Article

Thermally Accelerated Aging of Insulation Paper for Transformers with Different Insulating Liquids

1
Division of High Voltage Engineering and Asset Management, Institute of Electrical Power Systems, Leibniz Universität Hannover, 30167 Hannover, Germany
2
GRIDINSPECT GmbH, Mühlhof 3a, 36325 Feldatal, Germany
*
Author to whom correspondence should be addressed.
Energies 2021, 14(11), 3036; https://doi.org/10.3390/en14113036
Submission received: 13 April 2021 / Revised: 10 May 2021 / Accepted: 18 May 2021 / Published: 24 May 2021

Abstract

:
The article presents issues related to the aging behavior of oil-paper insulations in transformers using different oil- and ester-based insulating fluids. Despite numerous conducted studies on the subject of oil-paper aging, the use of new insulating fluids is creating open questions. In addition, new liquids such as synthetic and natural esters, as well as oil of the newest generation, are being used. Furthermore, there is still little research on the formation of aging markers with this form of the dielectric. For this reason, in this contribution, oil-paper insulations with mineral oil-based insulating fluids, natural and synthetic esters, as well as oil from natural gas, are aged thermally accelerated at 130 °C over a duration of 15 weeks, by considering two cases of free-breathing and hermetically sealed transformers. Therefore, various aging markers are investigated to allow a condition assessment. The results show that differences exist between the fluids and design of the transformer, as in the aging rate of the paper and the formation of aging markers in the insulating liquid such as acids. These findings can be used to improve asset management strategies by a more precise determination of the aging state depending on the transformer type as well as the type of insulating fluid.

1. Introduction

Transformers, and especially power transformers, are one of the most important assets in the electrical power grid. In many countries around the world, the average life of these devices already exceeds an age of 30 years, which means that the common design life has already been surpassed. However, the experience of grid operators shows that transformers can also be operated routinely for more than 50 years depending on various parameters like load, temperatures, etc. [1]. Therefore, from an economic and operational safety point of view, the importance of transformer condition assessment is increasing. For years, attempts have been made to assess the condition of the transformer through various investigation methods, such as partial discharge [2,3,4], vibration- [5,6], FRA-measurements [7,8] and many other methods, in order to obtain an overall picture of the condition of the transformer. With approx. 38%, the windings failures are the most frequent root of a transformer problem, which explains why the condition assessment of this part of the transformer is particularly important [9]. For oil-immersed transformers, paper insulation is still the most economical form of insulation [1]. Therefore, one important aspect for the availability of the transformer is the condition of the paper insulation, which can be expressed by means of the degree of polymerization (DP value) [10]. New paper has a DP value of about 1200–1000 and the end of life is expected to be around a value of 200 [1,11]. The DP value is correlated with the mechanical strength and therefore paper becomes brittle and fragile during aging [12,13]. In the event of a fault, this can lead to catastrophic failure of the transformer [1]. For the determination of the DP value, however, a paper sample is required, which usually cannot be taken during the operation, as this involves very high costs and efforts. Nevertheless, samples of the insulating liquid are relatively simple to take. For this reason, there is an attempt to determine the DP value via the determination of aging markers in the insulating liquid, such as with the measurement of the furan concentration, whereby the DP value of the paper is indirectly inferred via algorithms [14,15,16]. However, fluctuations in furan concentration may occur during operation [17,18]. Furthermore, this is also influenced by the type of insulating liquid, which can affect the accuracy of the DP value calculation [19]. For this reason, there is still an attempt to achieve a more accurate estimate of the aging condition of the transformer with new aging markers [1]. In the past, numerous studies have been carried out dealing with the aging of the oil-paper insulation system with mineral oil [20,21,22]. However, for environmental reasons as well as the further development of insulating liquids, alternatives such as natural and synthetic esters, as well as oil of the newest generation, are used. For the esters, initial investigations have already been made in this context, but there is still a need for further studies in this regard [19,23,24].
Therefore, this contribution compares three different oils and three different esters. The oils are a non-inhibited and inhibited oils based on mineral oils and an oil based on natural gas. Two natural esters and one synthetic ester are also used. Moreover, the influence of different systems, which are free-breathing and hermetically sealed transformers, is compared. The application areas of this investigation focus on the operation of free-breathing transformers as well as hermetic transformers, as shown in Figure 1a,b, with cellulose insulation, impregnated with an insulating liquid, for the assessment of the aging condition of the paper insulation.
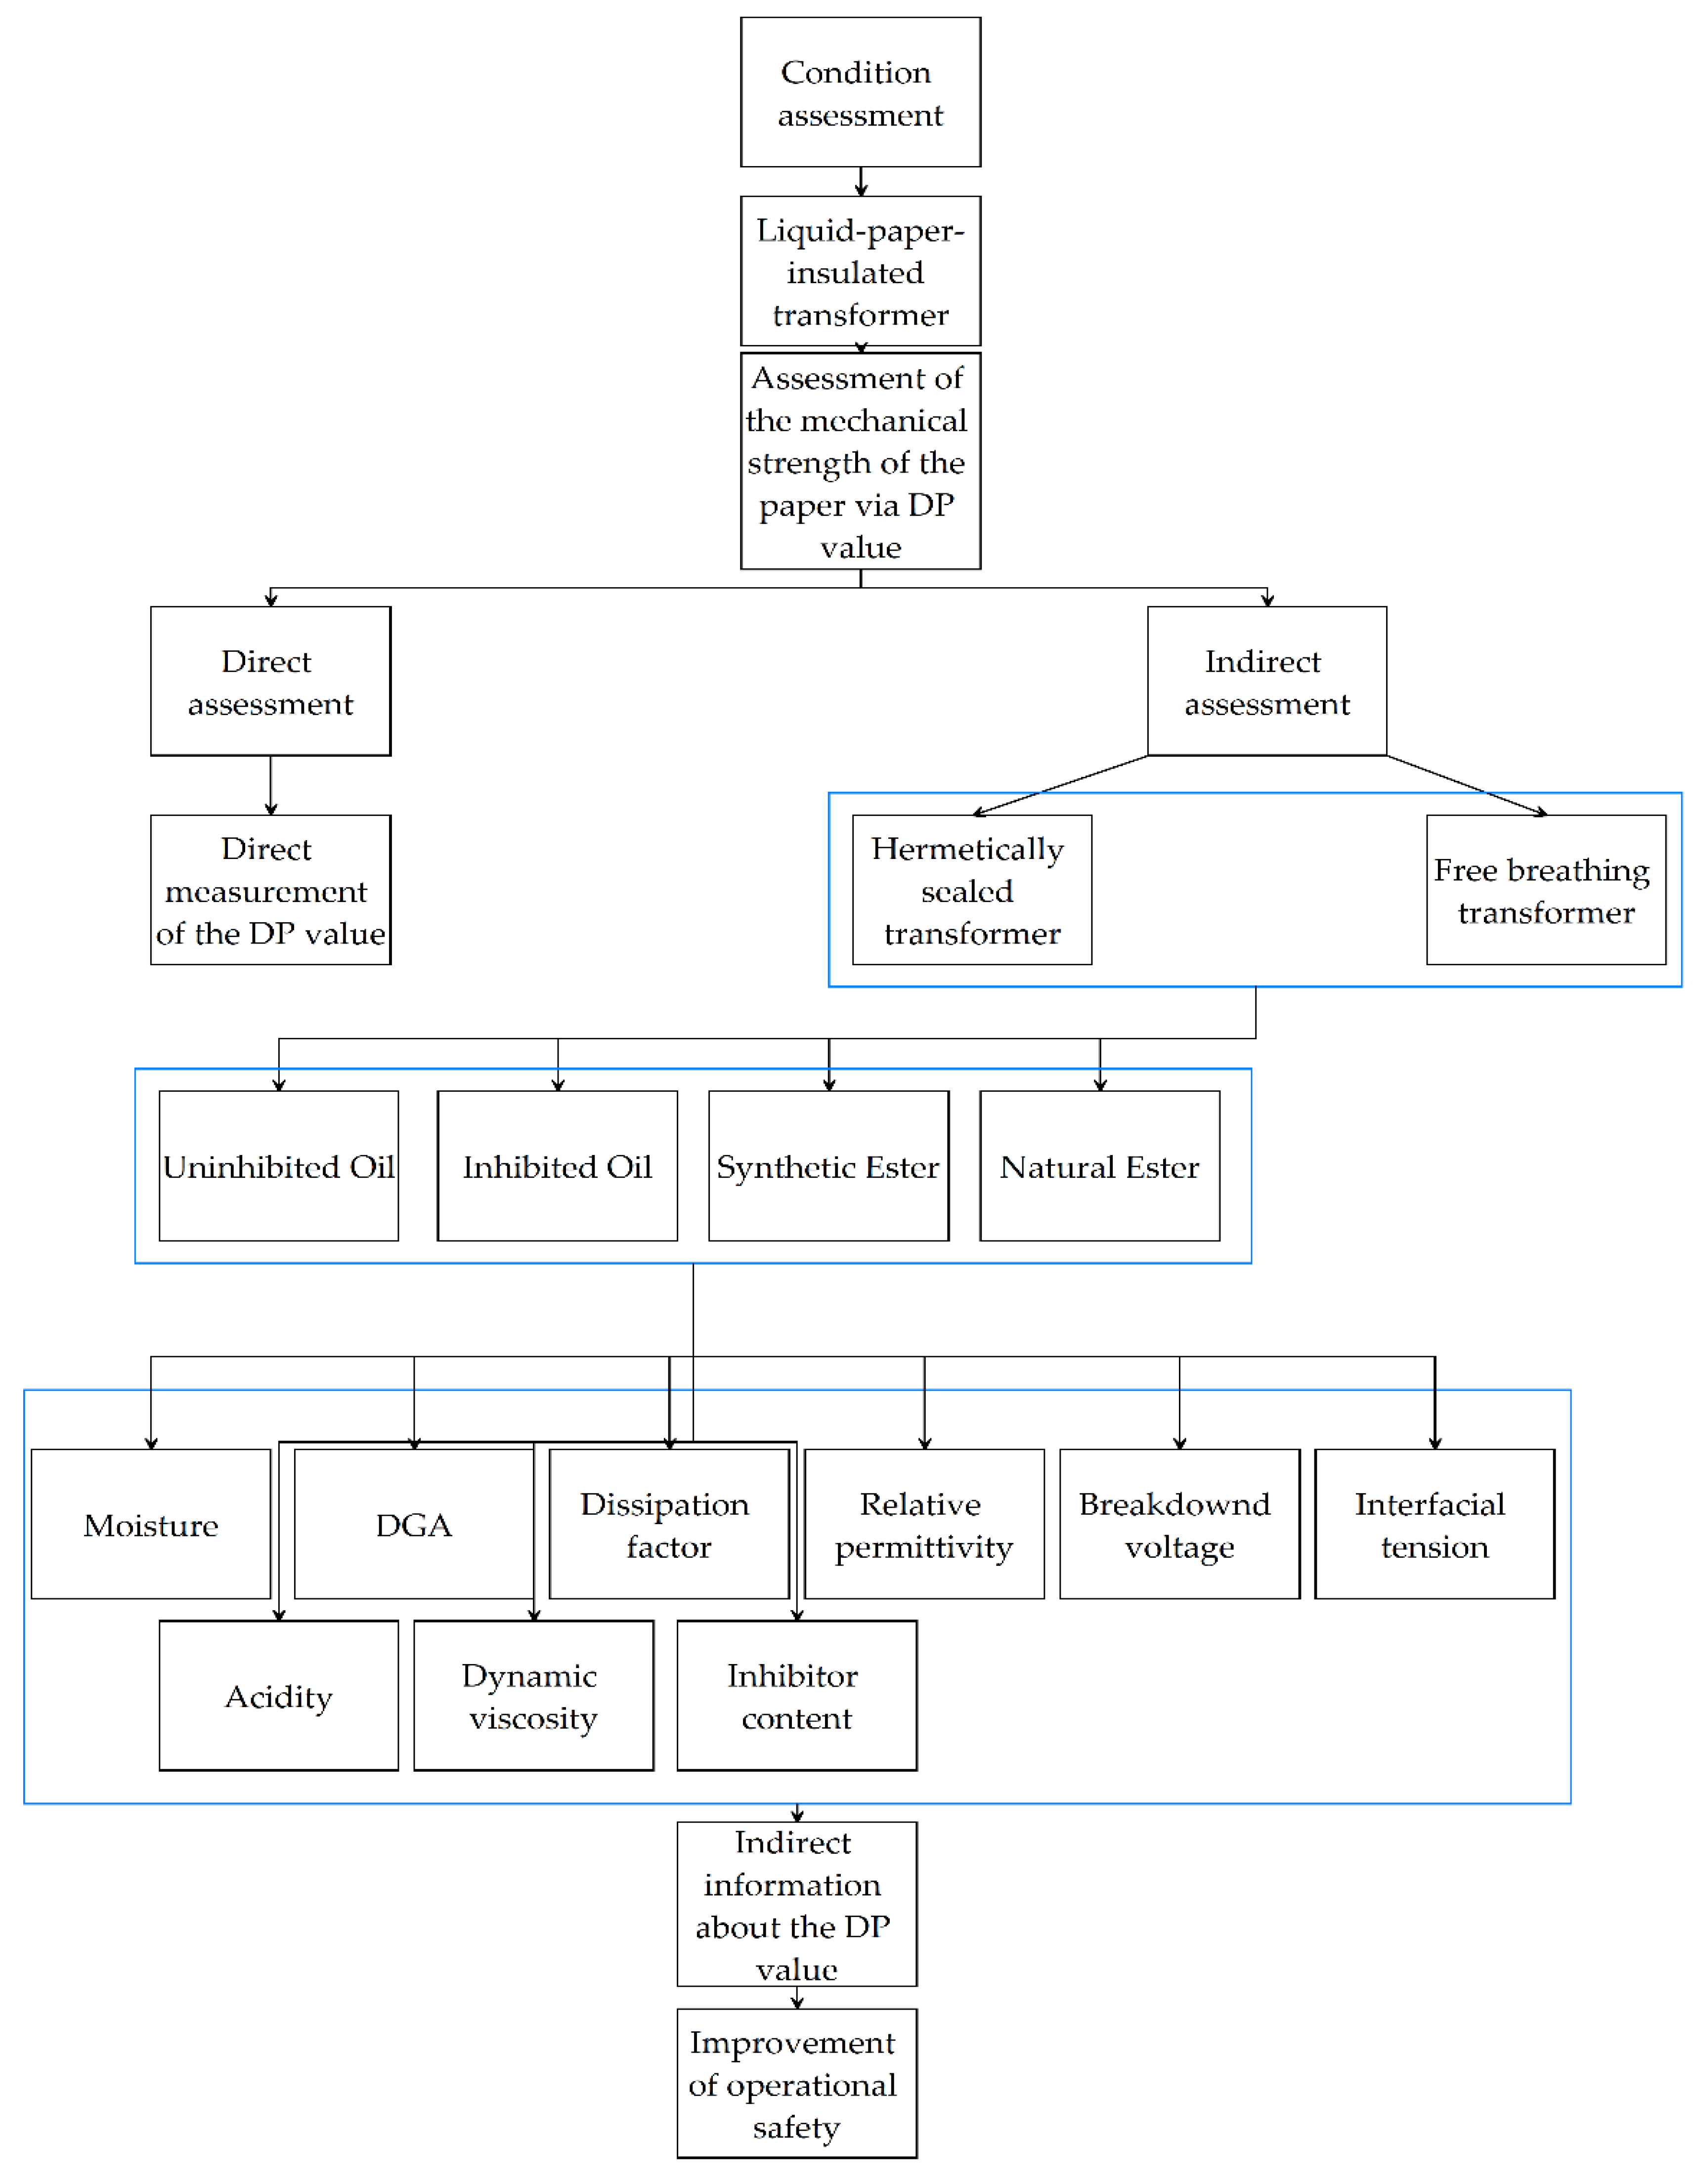
The comparison of the hermetic transformer takes place for all liquids, while the one regarding the free-breathing system takes place for the mineral oils as well as the natural gas oil. For esters, no aging was performed in the free-breathing system, since esters, except for the synthetic ones, are not suitable for such systems due to the lack of oxidation stability [27]. Thermal aging is accelerated by applying a temperature of 130 °C over a period of 15 weeks. Here, 10 samples per liquid and system were prepared, so that a total of 90 samples were examined. For this study, the degree of polymerization (DP) was scrutinized as well as various aging markers of the liquids. The focus is on the finding of alternatives for the furan content for the condition assessment of the transformer and especially the insulating paper. Various physico-chemical, as well as electrical and dielectric, tests were carried out. On the one hand, the comparison is made over time in order to be able to assess the changes in these variables concerning the aging of the liquid. On the other hand, the correlation between the individual aging markers and the DP value is investigated in order to determine the extent to which the markers differ depending on the system and the type of liquid. The investigation shows that for the aging process different threshold values regarding the type of insulating fluid as well as the type of the transformer need to be applied. The block diagram in Figure 2 is intended to depict an overview of the general procedure in this investigation for condition assessment of the insulating paper.

2. Materials and Methods

2.1. Samples

Commercially available kraft paper with a thickness of 0.1 mm, a common insulation in transformers, was used for the aging test. They have a density of 0.75–0.85 g/cm3 and are manufactured according to IEC 554-3-5 Typ 5A2.
In addition, six different insulating fluids are used. On the one hand, three oils and on the other hand, three different esters are investigated. The oils are the non-inhibited Oil A and the inhibited Oil B with a mineral oil base. Furthermore, the oil of the newest generation Oil C is used, which is obtained from natural gas [28,29,30]. The used esters are the synthetic ester Ester A and the natural esters Ester B and Ester C, which are based on rapeseed oil and soybean oil [31]. This contribution provides a deeper study as well as a detailed review of a first series of investigations in which aging behavior was performed in a hermetic and free-breathing transformer using Oil A, B, and C [28,29] and a second series of investigations in which a hermetic transformer was replicated using Ester A, B, and C [31].
For the test, 30 Erlenmeyer flasks were each filled with 1.6 kg of liquid and 160 g of paper. The paper was cut into 100 mm long strips with a width of 25 mm. The aim of the experiment was to model the corresponding real operating conditions within a transformer. The ratio of liquid to paper is 10:1, as this corresponds to the ratio of a real transformer, where this value is typically between 1:13.3 for distribution transformers and 1:7.6 for core-type power transformers [32]. However, these values may vary, depending on the manufacturer, voltage level and type of the transformer [18].

2.2. Preparation

In order to simulate the real conditions of a new transformer, the liquids are first prepared in a heat vacuum process by removing impurities, drying, and degassing. According to empirical data, the insulating paper used has a water content of 6–8% by weight on delivery [33]. To reduce the moisture the paper is also subjected to additional drying. Therefore, paper strips are placed in a stainless-steel container comprising a stainless steel grid. The grid consists of 28 chambers and separates the paper from each other. Subsequently, the container and paper strips are placed in a vacuum heating oven for drying over 48 h. During this period, the paper strips are dried at a constant temperature of 80 °C and a pressure of 0.03 mbar.
After drying the paper strips, 20 L of the insulating liquid is filled in under vacuum via a ball valve. Hereafter, the valve is then closed and after a waiting time of 10 min, the vacuum chamber is ventilated with dried air. In this regard, a needle valve on the side of the chamber is opened to ventilate with dry air. It remains open until an ambient pressure reaches approx. 1013 mbar. The whole process should ensure that the voids in the paper are filled with the insulating liquid for good impregnation. To complete the impregnation, the paper strips must remain in the vacuum furnace for 48 h at a temperature of 80 °C. In this way, 10 samples per liquid and system are generated, and this process is repeated accordingly for each system and liquid.
To protect the liquid-paper-insulation from external influences, such as moisture or oxygen ingress, the flasks are sealed immediately with a silicone plug for transport to the heating oven for thermally accelerated aging. The sealing of the flasks ensures a hermetic system that is protected from environmental influences.

2.3. Aging Process

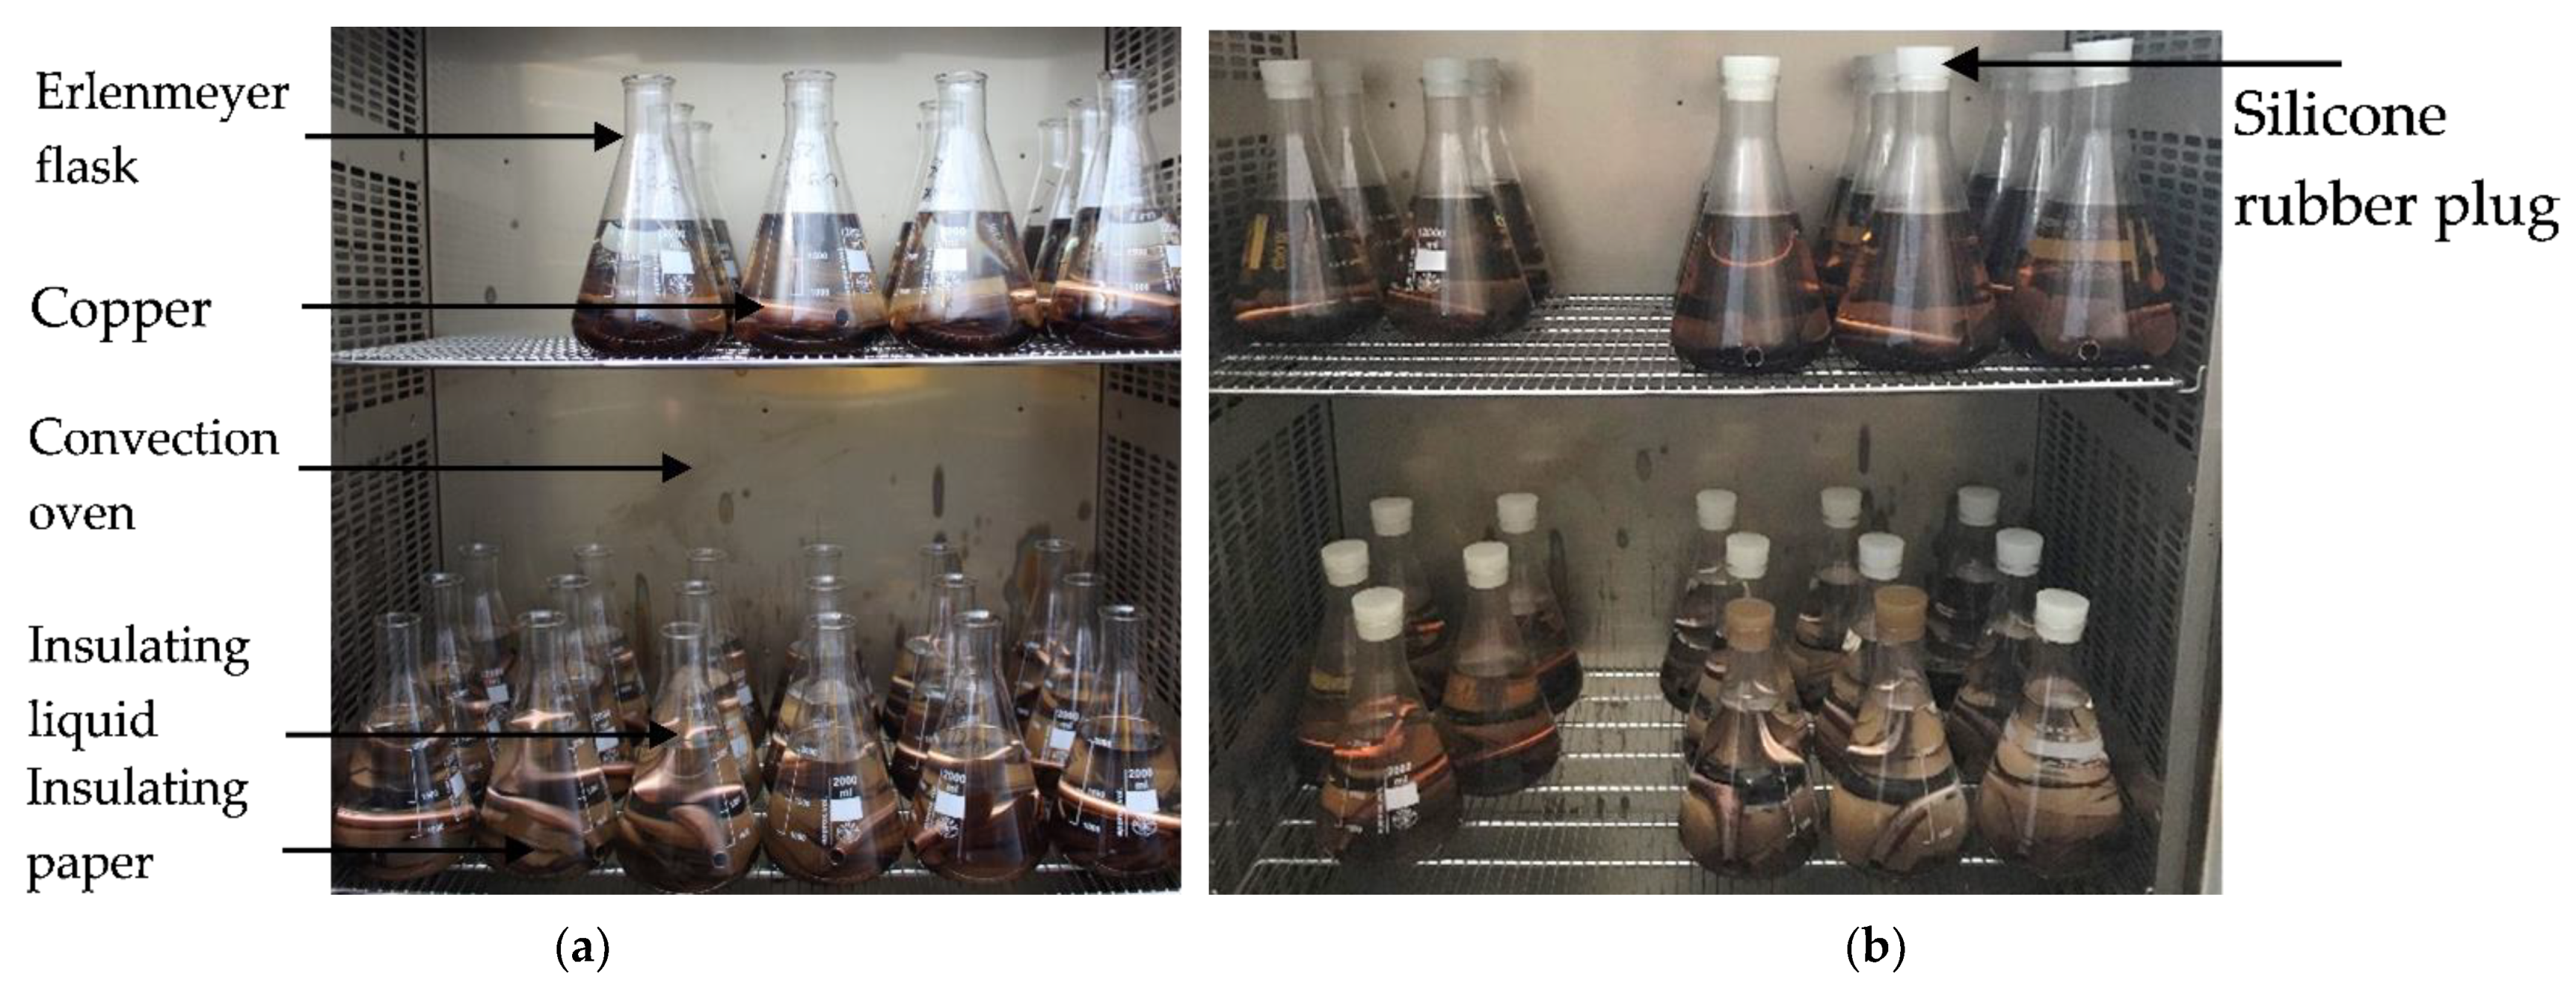
In this study, thermally accelerated aging is performed to simulate the aging of the transformer insulation. The arrangement of the samples in Erlenmeyer flasks for different systems is shown in Figure 3.
For the aging, a temperature of 130 °C is selected in order, on the one hand, not to exceed the flash point of the liquids and, on the other hand, to simulate the aging of about 30–50 years in a reasonable time. It has already been empirically determined that a temperature increase of approx. 6–8 K halves the service life [1].
Chemically inert borosilicate glass Erlenmeyer flasks were used for the simulation of free-breathing or hermetic transformers, which hereinafter are designated as the open and closed systems, respectively. For the open system, the flasks were open and thus had contact with the ambient air, while for the closed system a hermetic seal was achieved utilizing silicone rubber plugs. Since the windings inside a transformer are made of copper wrapped with the insulating paper, a copper tube of 150 mm long, weighing 66 g with a surface of 160 cm2 was added as a catalyst inside each Erlenmeyer flask to simulate the real environmental conditions inside a transformer.

2.4. Sampling

Samples were always taken according to the same procedure in order to avoid external influences on the measurement results. The Erlenmeyer flasks with the liquid-paper-samples were plugged immediately (for the open system) after removing from the oven and time was given to cool down for 24 h. The flasks of the closed system remained sealed, as they were closed with a silicon rubber plug throughout the aging process. These samples are also allowed to cool for a period of 24 h, followed by removal of the insulating liquid and paper. Afterward, samples of the liquid were transferred into hermetically sealed aluminum bottles without any air space to prevent the samples from absorbing moisture and gases from the ambient air as well as releasing further gases from the liquid.
The filling process is carried out in accordance with IEC 60475, avoiding the formation of gas bubbles and minimizing oil circulation [34]. The times for taking the samples were determined in advance. The first sample was taken before aging, following the drying and impregnation process. Four further samples were taken at intervals of one week each. Another four samples were then taken at two-week intervals, and the last sample was taken after 15 weeks, as shown in Table 1. In general, it can be seen that the insulating material becomes darker with time. The visual change is more pronounced in the open system than in the closed system, due to increased oxidation processes. Furthermore, the formation of soot and oil sludge can be observed in the non-inhibited Oil A.

2.5. Measurement Methods

This section is intended to provide an overview of the measurement methods used in this work to determine different aging markers. Table 2 lists the aging markers studied in this work, as well as the measuring devices used for this investigation and the standards by which measurements were performed accordingly. The examination of only the DP value, as well as the inhibitor content, were carried out in the external accredited analytical laboratory Analysen Service GmbH Umwelt- und Öllabor Leipzig in Leipzig, Germany. Since esters are still relatively new in their use as insulating fluids, there are in some cases no independent standards for these esters. In this case, existing standards for mineral oils are used.
All measurements were made according to the mentioned standards, so the accuracy of the measurements is within the limits of the mentioned standards as well as the accuracy of the presented measuring instruments.
In Supplementary Materials the individual measuring devices are presented as well as the optical change of the insulating material.

3. Results and Discussion

This section presents and discusses the results. First, the aging of the kraft paper in the various insulating fluids and systems is discussed. It is followed by an evaluation of different aging markers, which are determined from the insulating oil. They are plotted against the aging time as well as their corresponding insulating paper DP value in order to investigate whether correlations exist, and with which one a condition assessment of the insulating paper is possible. This determination will be discussed in more detail using correlation analysis. Based on the results, newly defined threshold values regarding the end of life of the paper insulation for each of the aging markers will be discussed.

3.1. Degree of Polymerization

The DP value indicates the average amount of glucose molecules in a chain that are linked by oxygen atoms [35]. The following measurement results were performed according to IEC 60450 in an external accredited analytical laboratory. Figure 4a shows the change in DP values over the aging time. At the beginning of aging, the papers after impregnation have an approximately similar DP value of 1000. Nevertheless, for improving the comparability of data related to the different systems as well as the insulating liquid, the change in the DP value is also shown in Figure 4b as a percentage of this initial value.
Firstly, it can be stated that the paper ages more slowly in the closed systems, as hydrolysis and oxidation are driving factors of aging [36,37]. In the closed systems, no further oxygen can be taken from the ambient air for ongoing oxidation processes. The development of moisture from the ambient air should have a subordinate influence in this respect, since aging takes place at a temperature of 130 °C and thus the relative humidity should be very low. For this reason, there is no developed moisture from the ambient air.
In the open system, the DP value decreases faster in the inhibited Oil B and C. According to [1], even nowadays the influence of the inhibitor on the aging of the oil-paper insulation has not been sufficiently studied. One difference here is mainly the formation of oil sludge and soot in Oil A, which indicates increased aging of the insulating oil. Oil B and C, on the other hand, age visually much more slowly, which behaves inversely to the paper aging. According to [38], inhibitors reduces the influence of acids and polar compounds on the cellulose and thus reduces the hydrolytic and oxidative degradation. The formation of soot particles and oil sludge in Oil A could lead to the increased absorption of both water and low molecular weight acids, which otherwise diffuse more into the paper and are responsible for accelerated aging of the insulating oil.
In addition, aged insulating oil has a higher water solubility than new insulating oil, which can also reduce the water content in the paper [39]. This might explain why the DP value with the non-inhibited Oil A does not decrease as much over aging as with the inhibited Oil B and C. The formation of soot and oil sludge was lower in Oil A in the closed system, which would explain the smaller difference to Oil C in the closed system.
In the closed system, on the other hand, no clear difference can be seen between the insulating oils and the esters as well as no clear influence of the inhibitor. What is noticeable here is the slower aging of the paper in Oil B. In the case of the esters, on the other hand, there seems to be a slight difference between the natural esters and the synthetic ester in the course of aging. Up to the last measuring point, the paper with the synthetic ester ages faster, but this seems to slow down towards the end of the aging process.
The largest differences between esters and oils are in the range between 400–200 DP. In the studies [19,40,41,42] it was shown that the paper ages more slowly in esters than in insulating oils. The reason for this is the assumption that esters dry out the paper due to their higher water solubility and thus reduce the hydrolysis processes of the paper. In [1], however, it is already pointed out that this phenomenon is much less pronounced at real operating temperatures of transformers due to its lower temperatures in comparison to 130 °C. The test results related to week 15 also show that the values for the esters are higher than those of Oil A and C, which means that a general positive influence of the esters in comparison to the insulating oils can also be observed here especially in the area of end of life of the paper insulation.
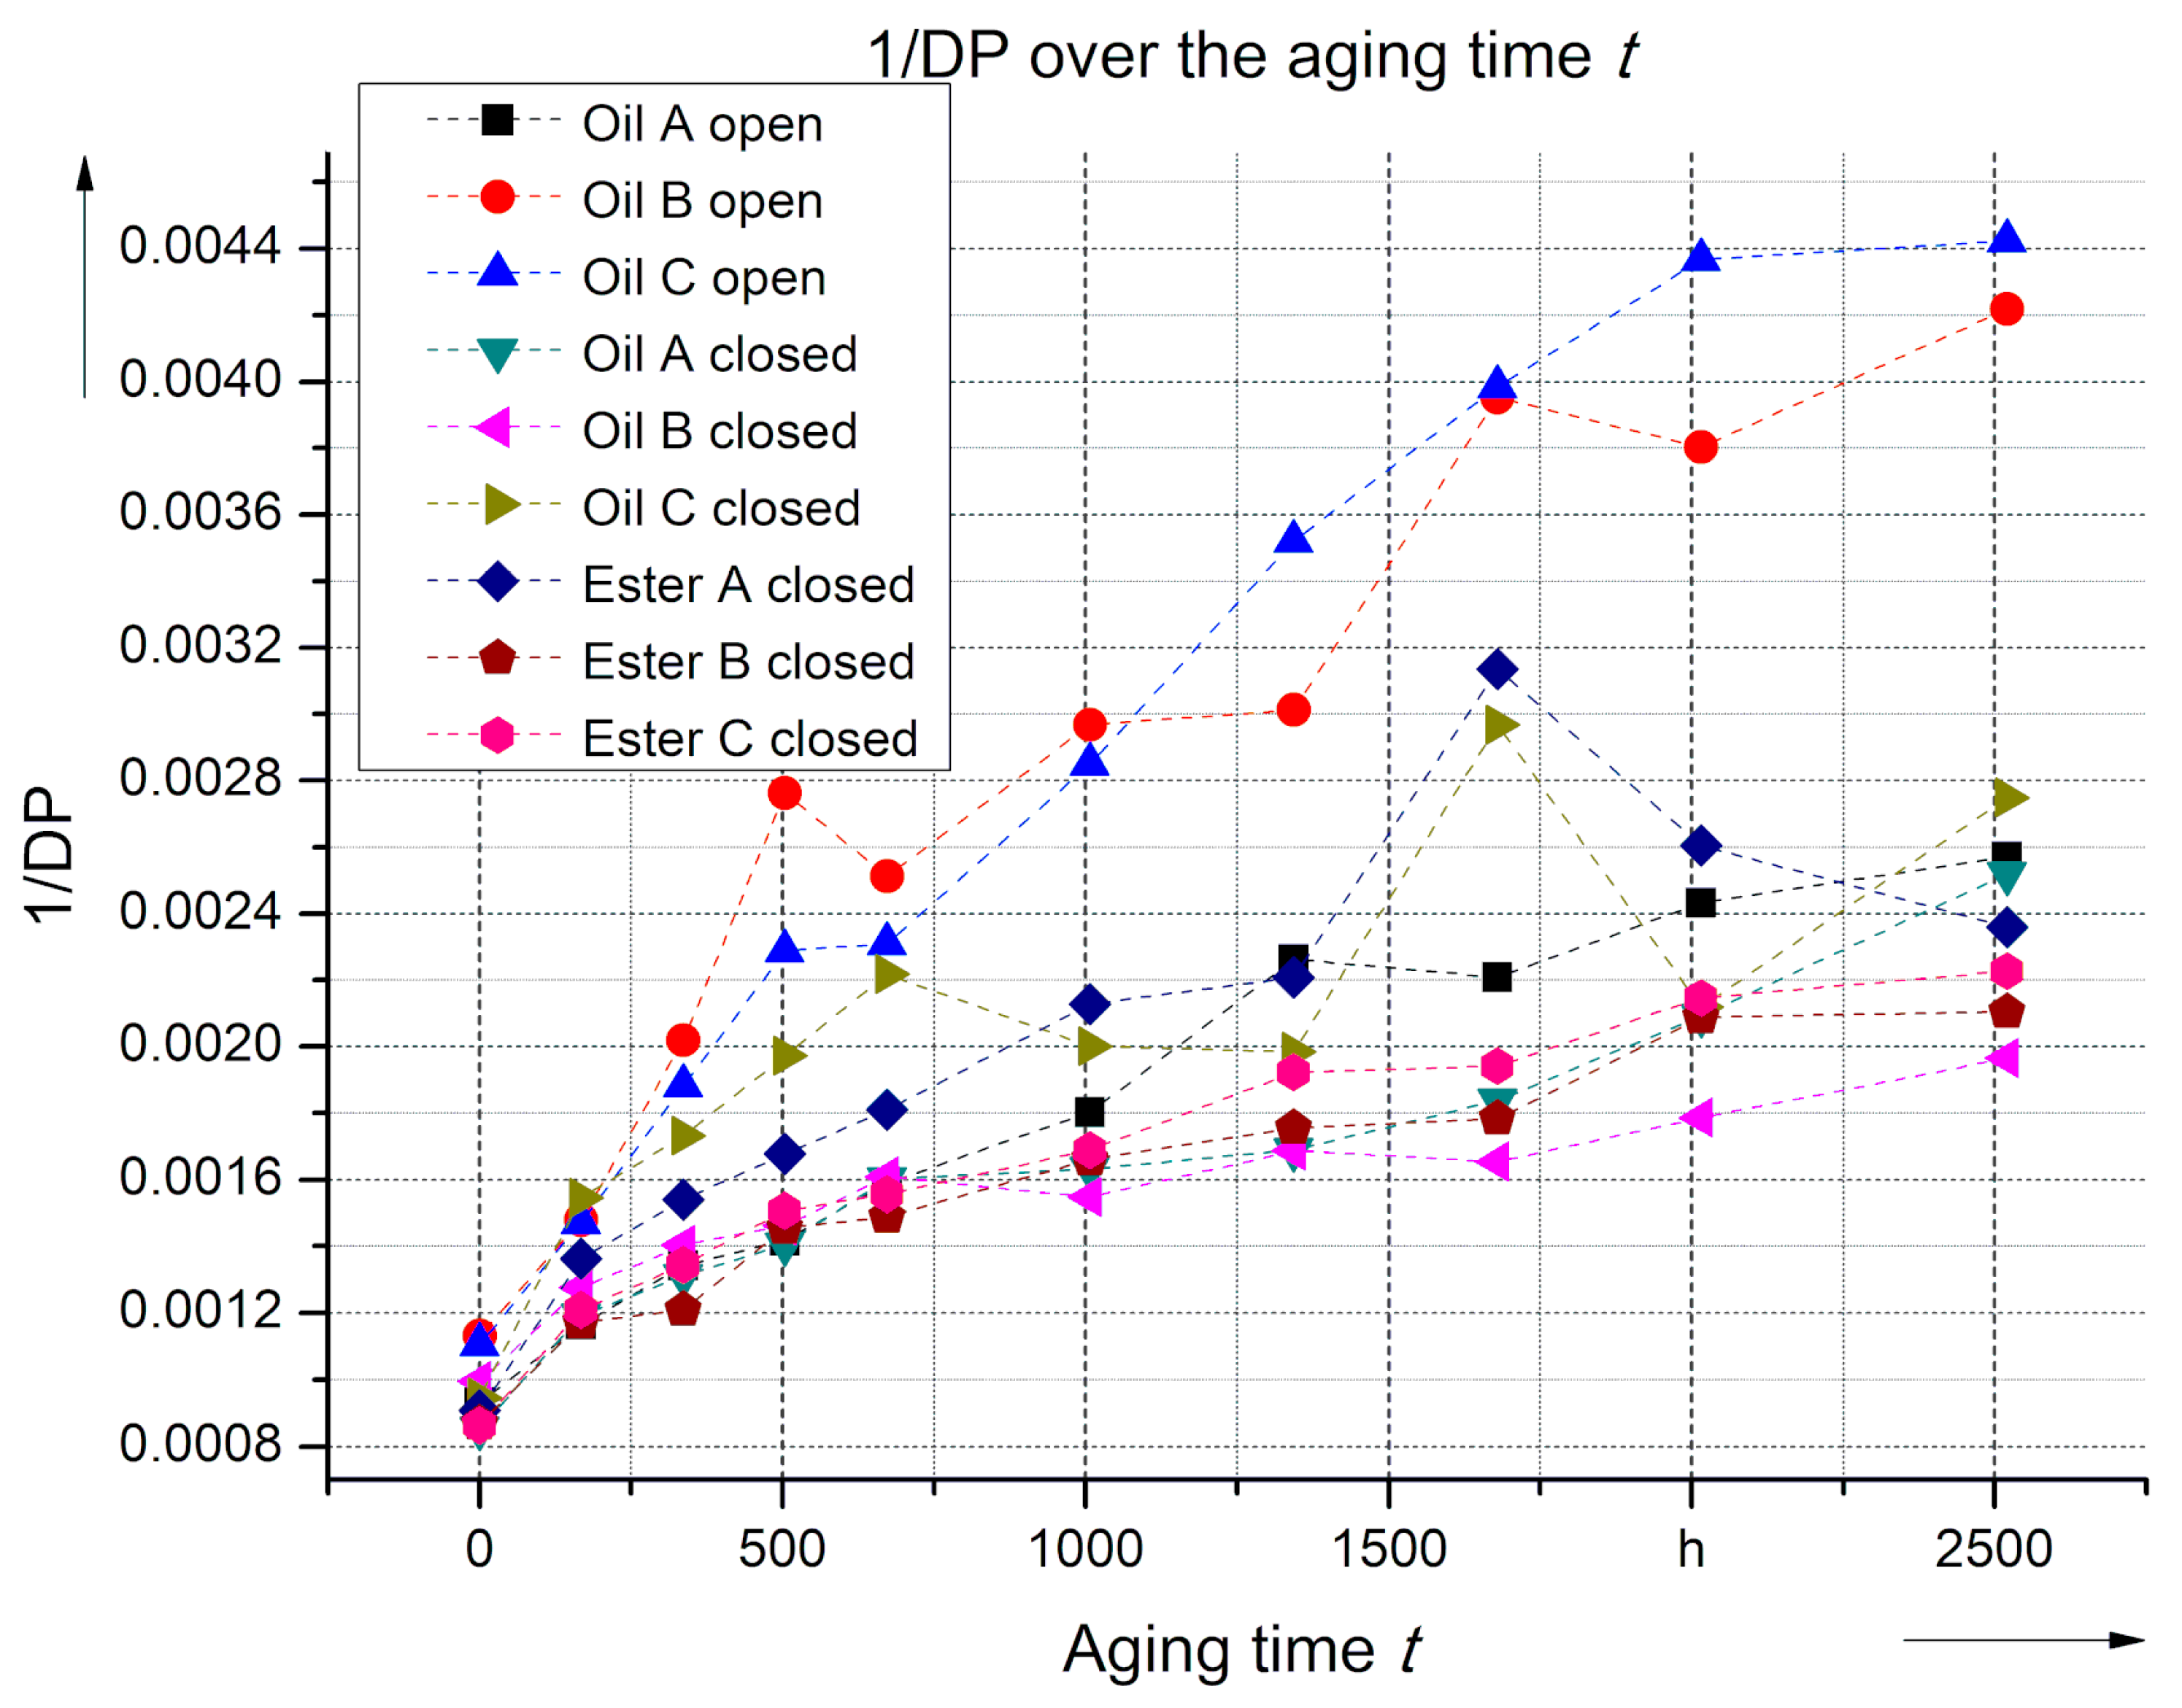
In the following, the influence of the systems and fluids will be scrutinized by examining the rate of depolymerization in 1/DP in Figure 5, since this ratio is proportional to the aging rate (k) of the paper [1]. It is expected that its values behave relatively linearly over the aging time, up to a certain DP value, and then deviate from this straight line [1,43]. This phenomenon can also be observed here for Oil B and C in the open system after about 2000 h. Compared to all other systems and fluids, these two oils also have the lowest values with a DP value of just over 200. The amorphous regions or locations in the cellulose structure where chain scissions may occur reduce with time, which is why the rate and thus the slope change [1]. In general, it can also be stated that aging proceeds faster in the open system. The aging in the closed system only shows smaller differences between oil and ester at the end of the aging process, so that it can generally be assumed that the increased water absorption of the esters has a bigger influence at the end of the service life of the paper.

3.2. Oil Aging Marker

The following aging marker values are determined from samples of the insulating liquids and their changes are presented as a function of the aging time as well as of the DP value. The goal is the investigation of the correlation between the aging markers and the DP value of the insulating paper to avoid direct sampling of the paper during operation. Here, the focus is on alternatives to furan and methanol, to improve asset management by knowing the influence of the type of liquid as well as the breathing system on the formation of such markers.
With regard to the scope of the article, the differences between the markers are mainly discussed, while the progression over the DP value is essentially used to investigate the correlation of the markers with the aging condition of the insulating paper. Since a more detailed analysis of the correlation with the DP value is carried out in Section 3.4, the progressions over the DP value will not be discussed in this section.

3.2.1. Moisture

In many studies, such as [37,44], the negative influence of water on the aging of the insulating paper has been demonstrated. The change of water content in the insulating liquid shown in Figure 6 is discussed below. The measurements were made using Karl Fischer titration at room temperature. It can be seen that the water content increases during aging, which is due to hydrolysis processes, as this is an autocatalytic process in which water is consumed and generated from the breaking of the cellulose molecules. Furthermore, water is an end product of the oxidation of the paper as well as the liquid [45]. In [45], it was shown that the amount of water formed is related to the number of chain scissions of the paper. There are clear differences here between the open and closed systems. In the open system, the water content is higher due to the higher rate of chain scissions as the DP value in this system is lower. In the case of the esters, their higher water solubility is readily apparent. The water content here is about 10 times higher compared to the oils in the closed system, which indicates that more water diffuses from the paper into the ester, thus reducing hydrolysis processes in the paper.
For sake of clarity, the valid legends are shown for all the following graphs of this chapter just in Figure 6a, indicating the type of sealing system as well as the insulating liquid. In the following, this scheme is repeated steadily, which allows an easy assignment of the graphs.

3.2.2. CO and CO2

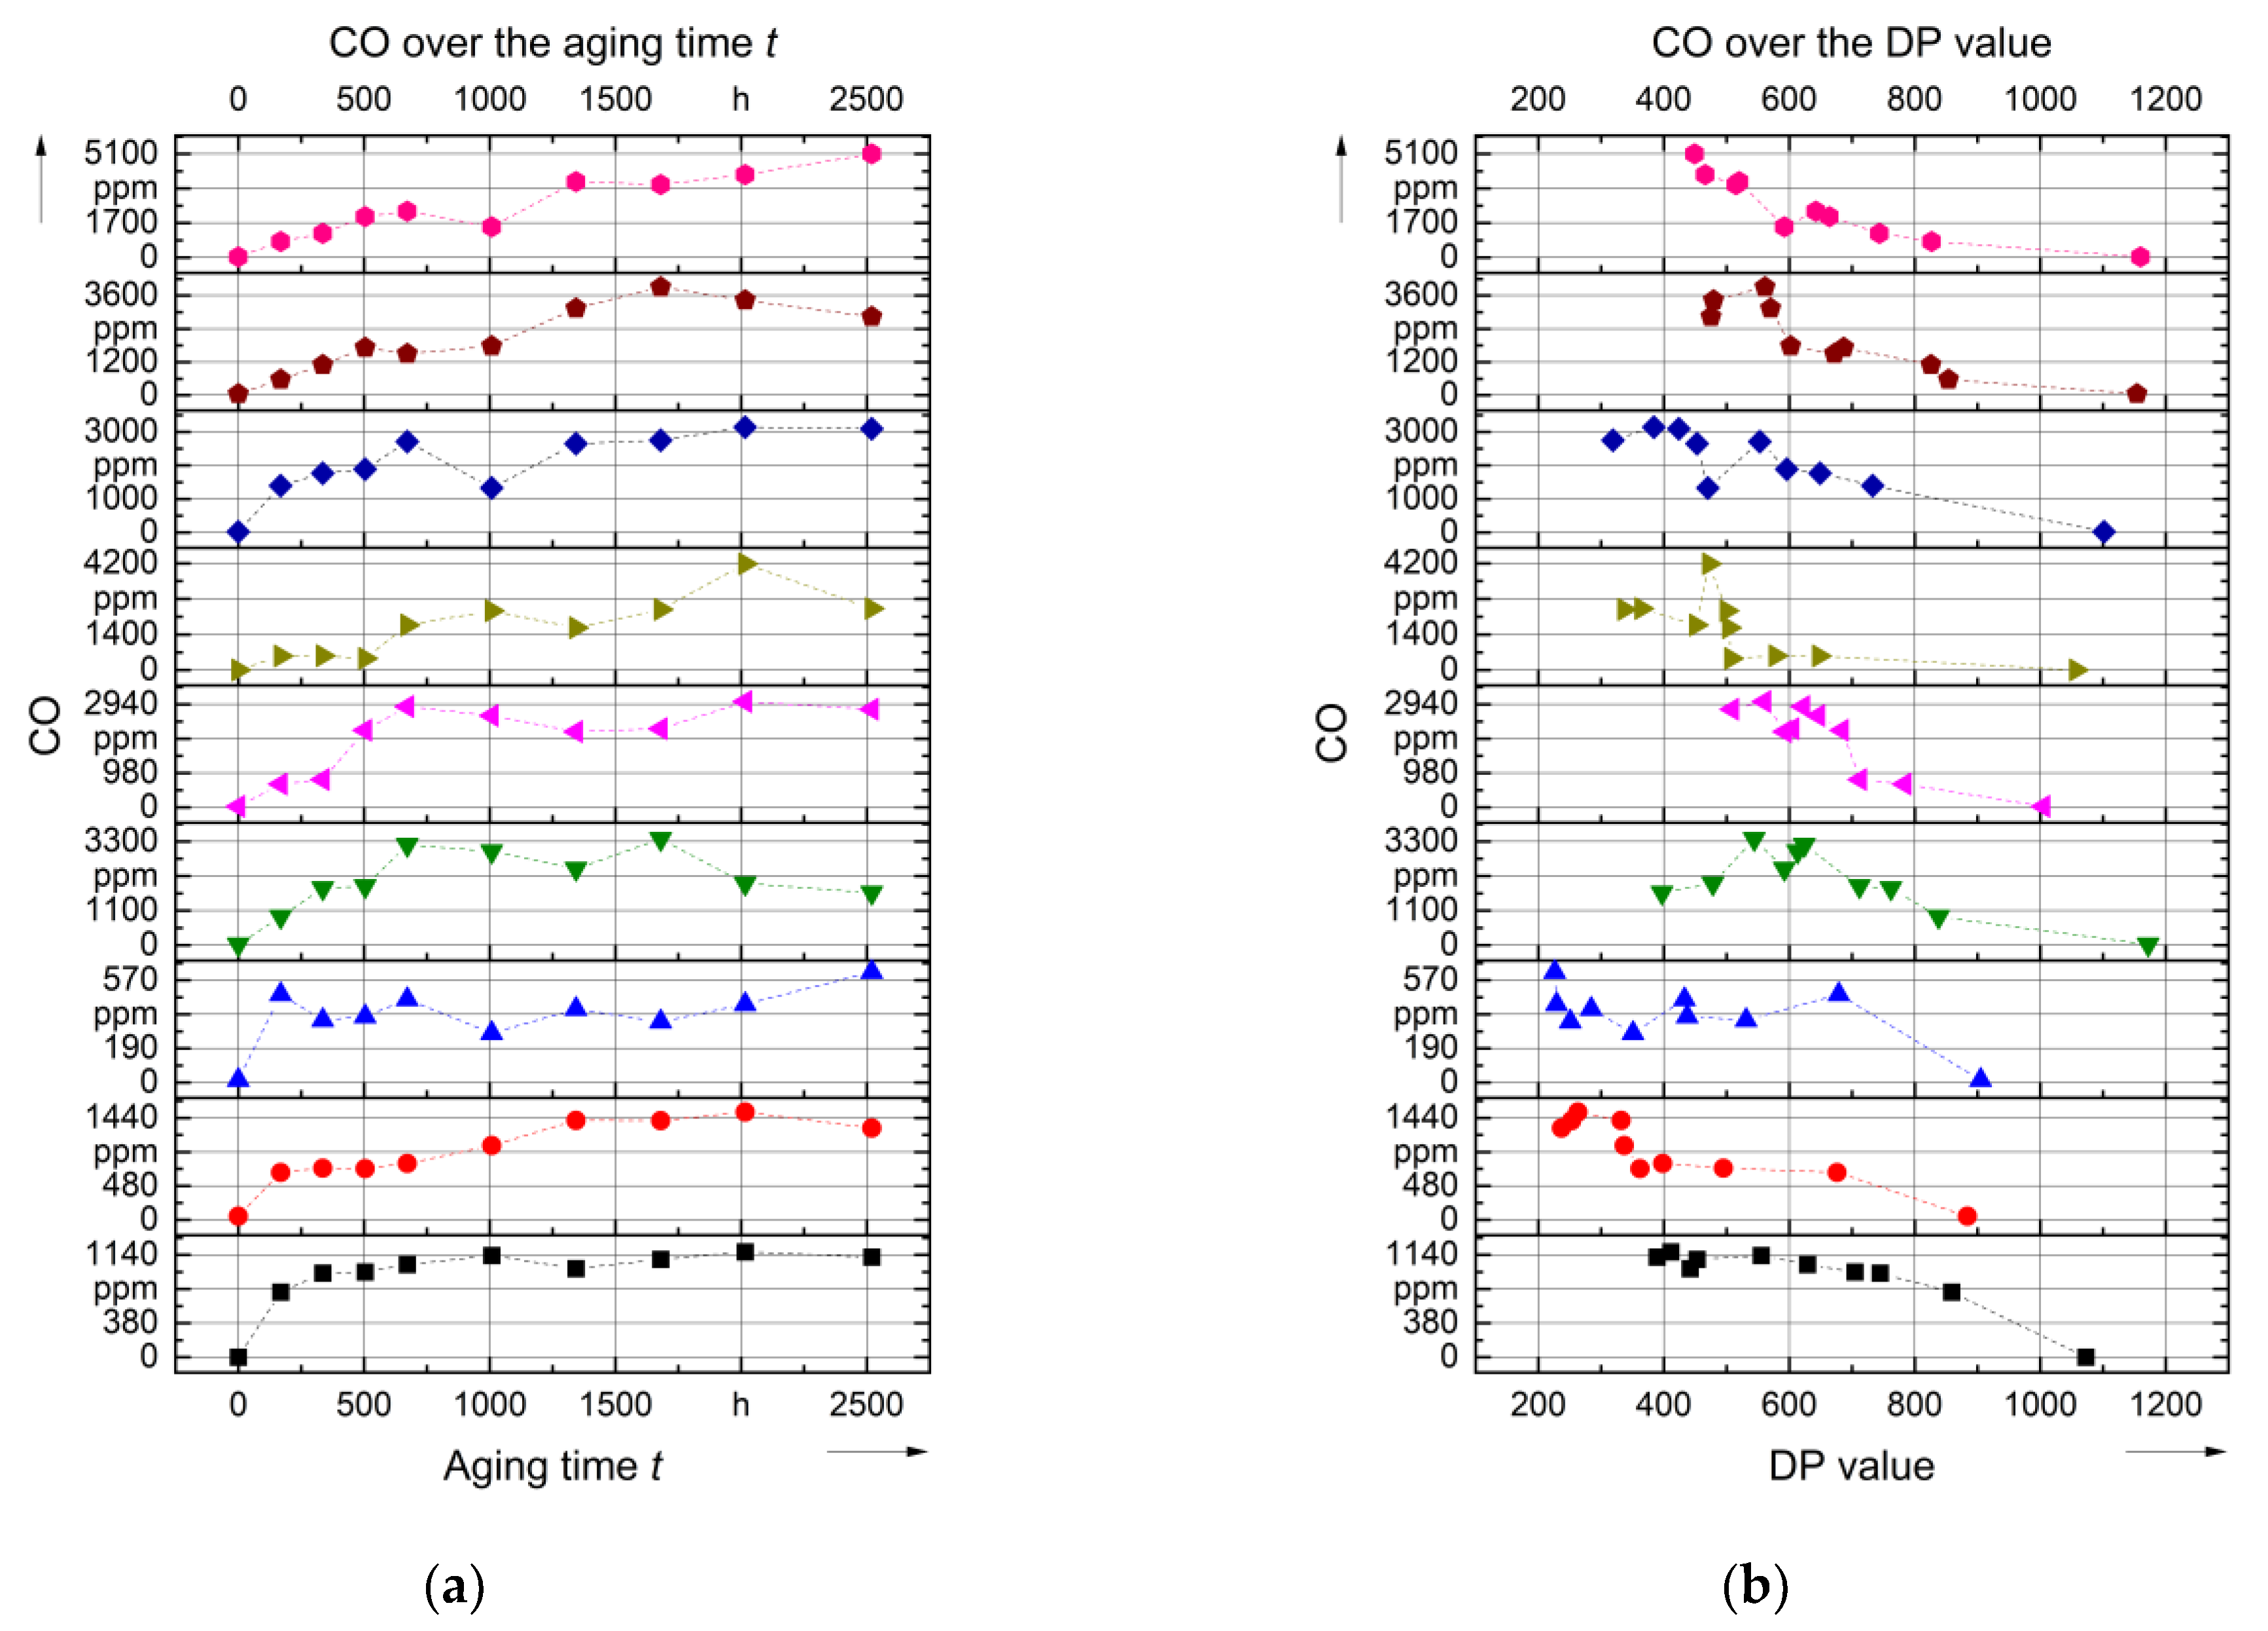
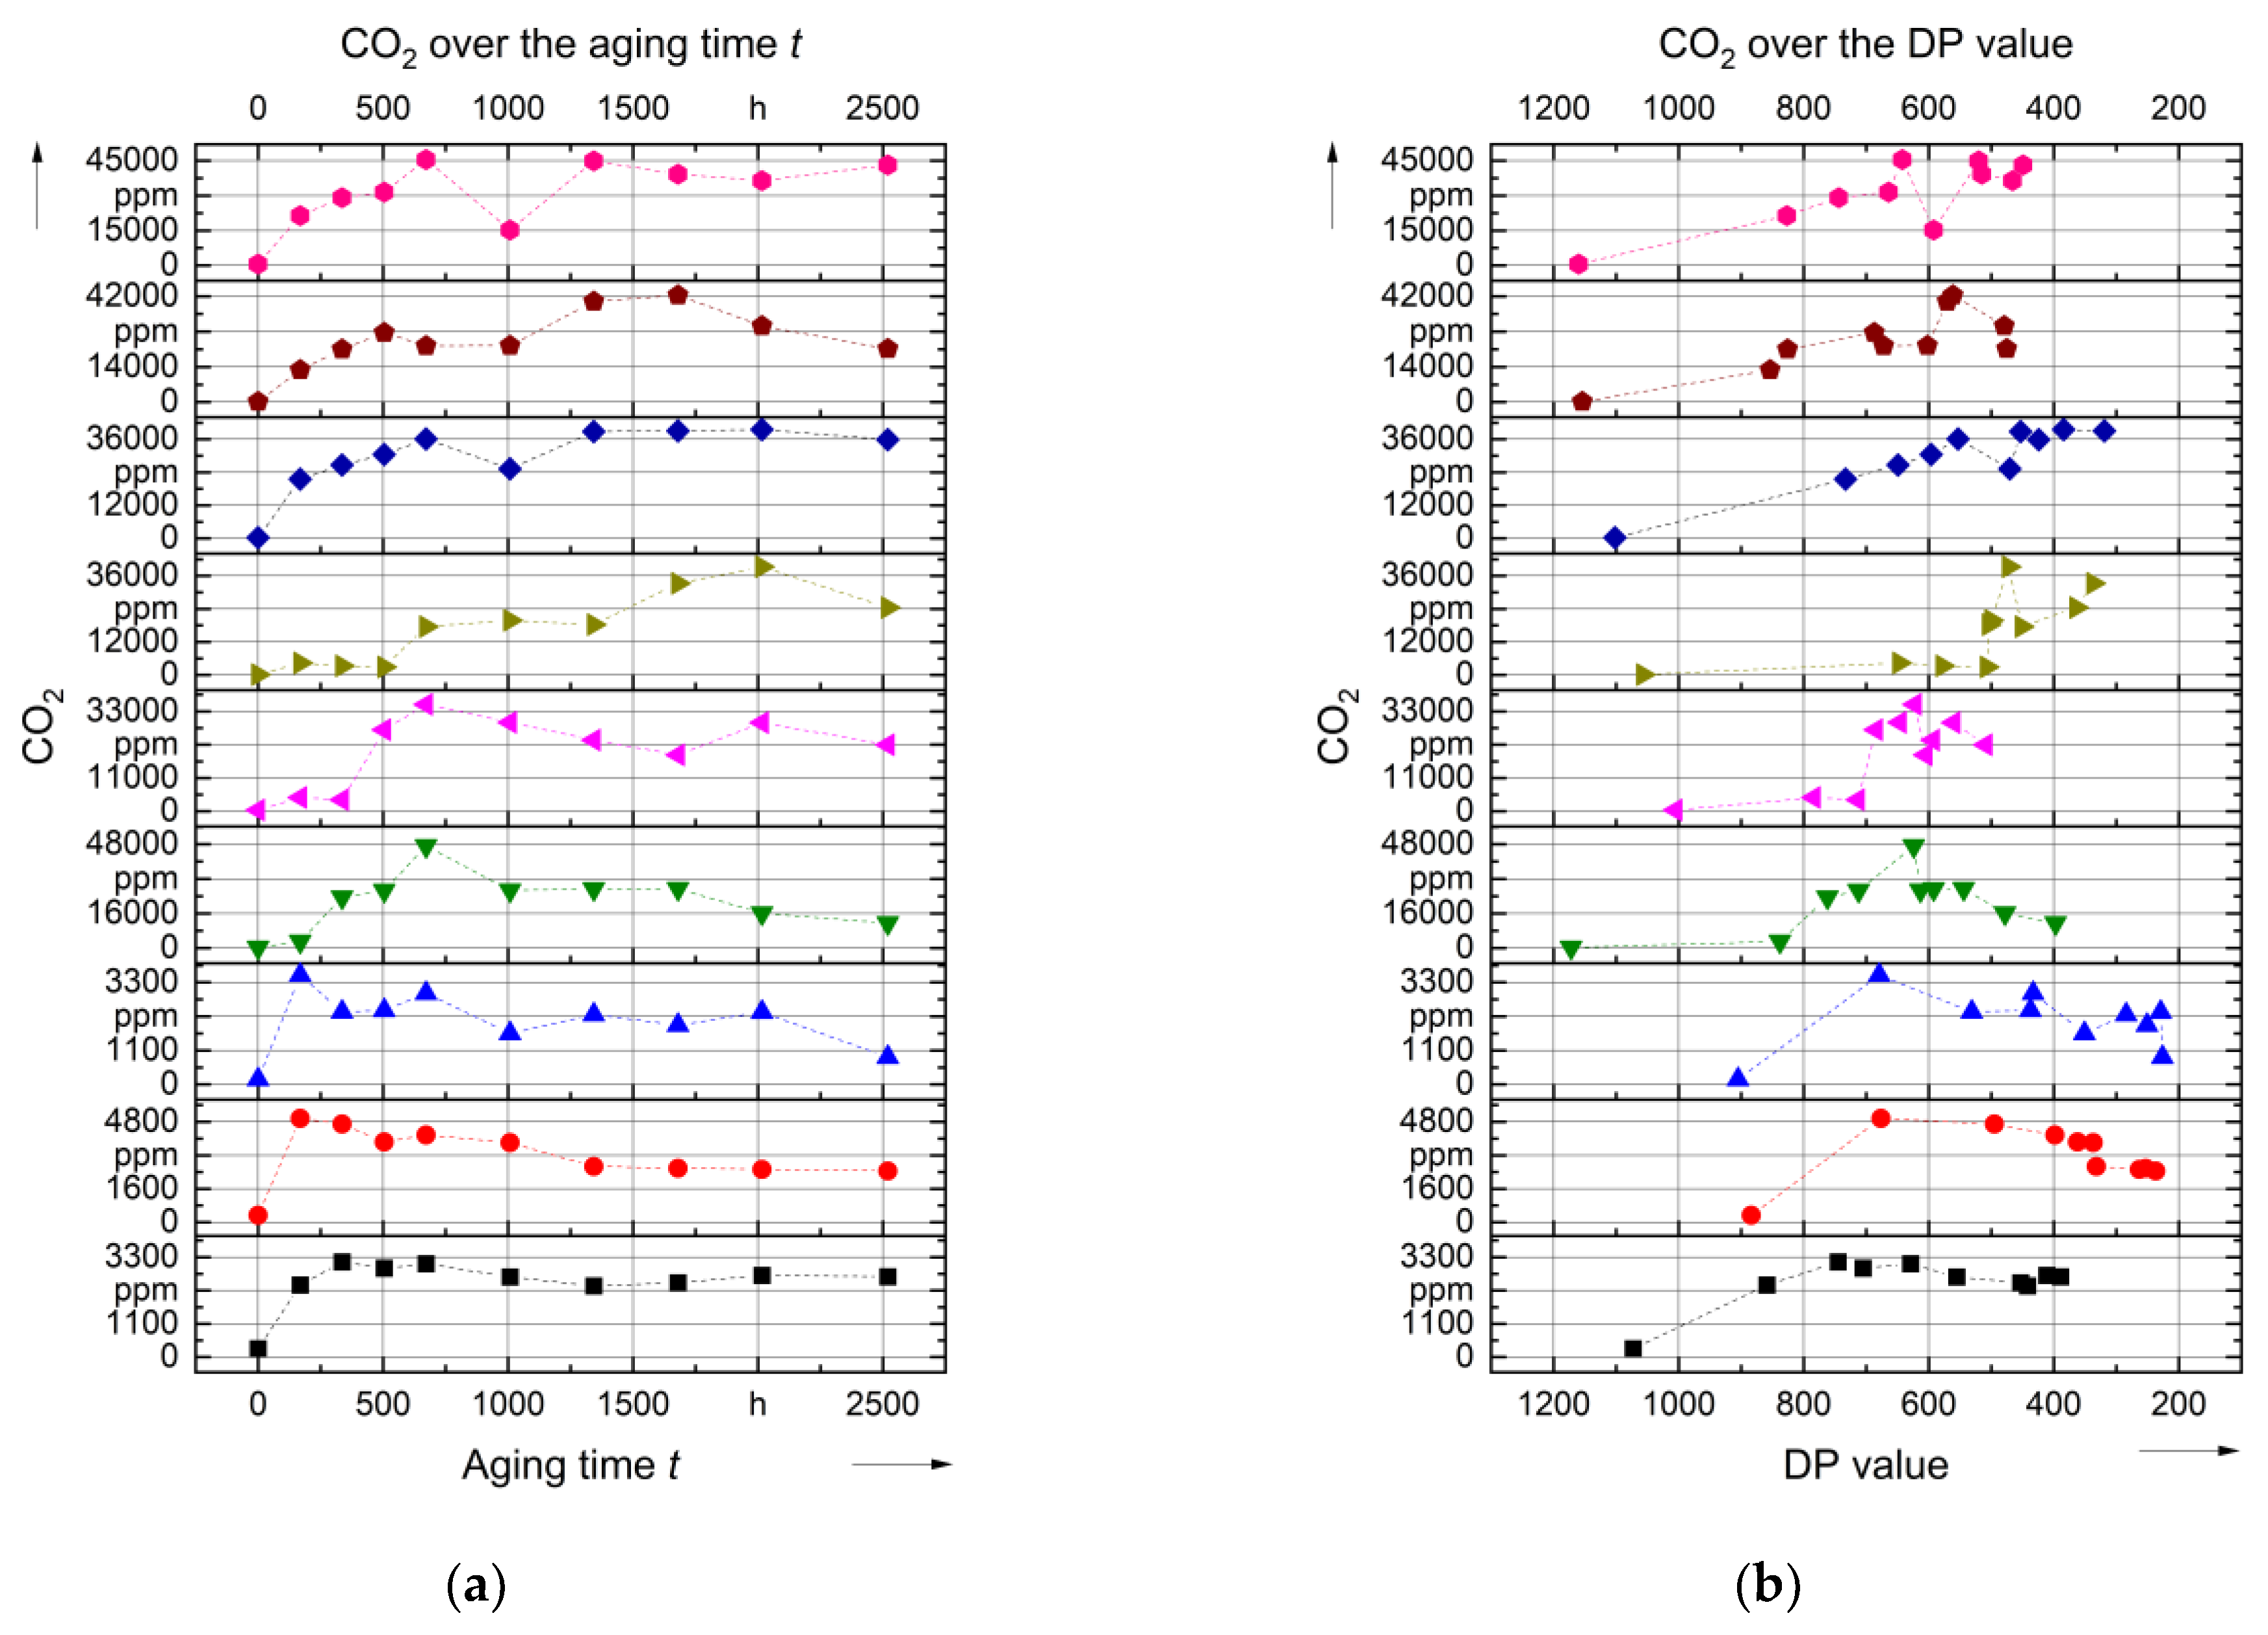
Carbon monoxide (CO) and carbon dioxide (CO2) are also among the end products of paper aging, although these gases are also produced to a lesser extent by oil oxidation [1,46]. Figure 7 first shows the course of the concentration of CO, which reveals an increase over the aging time. There are clear differences between the open and closed systems. In the open system, gases that have already been formed can be released into the environment, since the aim is always to achieve equilibrium with the surrounding medium. In the closed system, the gases formed cannot escape, which is why the gas concentration is two to seven times higher than in the open system. In the comparison between the esters, the natural Ester B and C show higher concentrations than the synthetic Ester A. On the other hand, their comparison with the oils in the closed system reveals no clear differences, which can be concluded that CO is mainly caused by the aging of the paper and only to a very small extent by the oxidation of the liquid.
The trend of the CO2 concentration in Figure 8 also shows an increase over the aging time. The difference between the open and closed systems is more conspicuous than for the CO concentration. The concentration in the closed system can be up to ten times higher. Furthermore, differences between the natural Ester B and C and the synthetic Ester A can be observed in this case.
The final values in the closed system with esters and oils differ only slightly, as is the case with CO, where the concentration of CO is about one-tenth that of CO2. Thus, it can be assumed that the gas concentration is mainly caused by the aging of the insulating paper and thus the gas concentration depends mainly on the amount of paper as well as the type of the system. In the case of the esters, however, it appears to be a greater increase in the concentration during the first four weeks.
Usually, the CO2/CO ratio, which is supposed to be less sensitive to oil oxidation than the individual concentrations, is used to evaluate paper insulation. The curves of this ratio are presented in Figure 9. According to IEC 60599, the ratio for normal paper aging should be 3 < CO2/CO < 10 [47]. Values below 3 indicate above-average aging of the insulating paper, while values above 10 allow conclusions to be drawn about mild overheating of the insulation (>160 °C) [48]. In [46], an increasing ratio between 6–9.5 of CO2/CO for a decreasing DP value between 1100–200 for transformers with normal aging is reported. Unfortunately, no information is available about the type of fluid, the operating time and the type of transformer (open or closed). However, in both [46] and [48] and IEC 60599 [47], a decrease of the ratio over the aging time as well as with decreasing DP value is addressed. Values below CO2/CO < 3 are only achieved for the open system in this study. The influence of the inhibitor can also be clearly seen here.
In the case of the inhibited Oil B and C, the ratio falls below this value at later times compared to Oil A, although the DP value of the paper in Oil A is higher. Nevertheless, a clear decrease in the ratio over the aging time can be observed in all oils. In the closed system, however, different behavior is observed. For the oil-fluids Oil A and B, in the beginning, there is a slight decrease in the ratio in the first or second week, only to return to the initial level, while it remains at a level of about 10 for the rest of the aging. A similar value can be observed for Oil C, reaching an approximately constant level after only one week.
At the beginning of aging, there are still very few gas concentrations present, and major deviations in the ratio can occur; therefore, it should only be interpreted after sufficient time has elapsed for gases to dissolve in the liquid. For the esters, an adaptation of the ratios from IEC 60599 should be made. Higher values are achieved with the natural esters than with the synthetic ester, accompanied by a decrease over time and values below 10 being achieved at the end of the aging process. The ratio for the synthetic ester tends to behave constant and the values remain above 10.

3.2.3. Dissipation Factor tan δ and Relative Permittivity εr

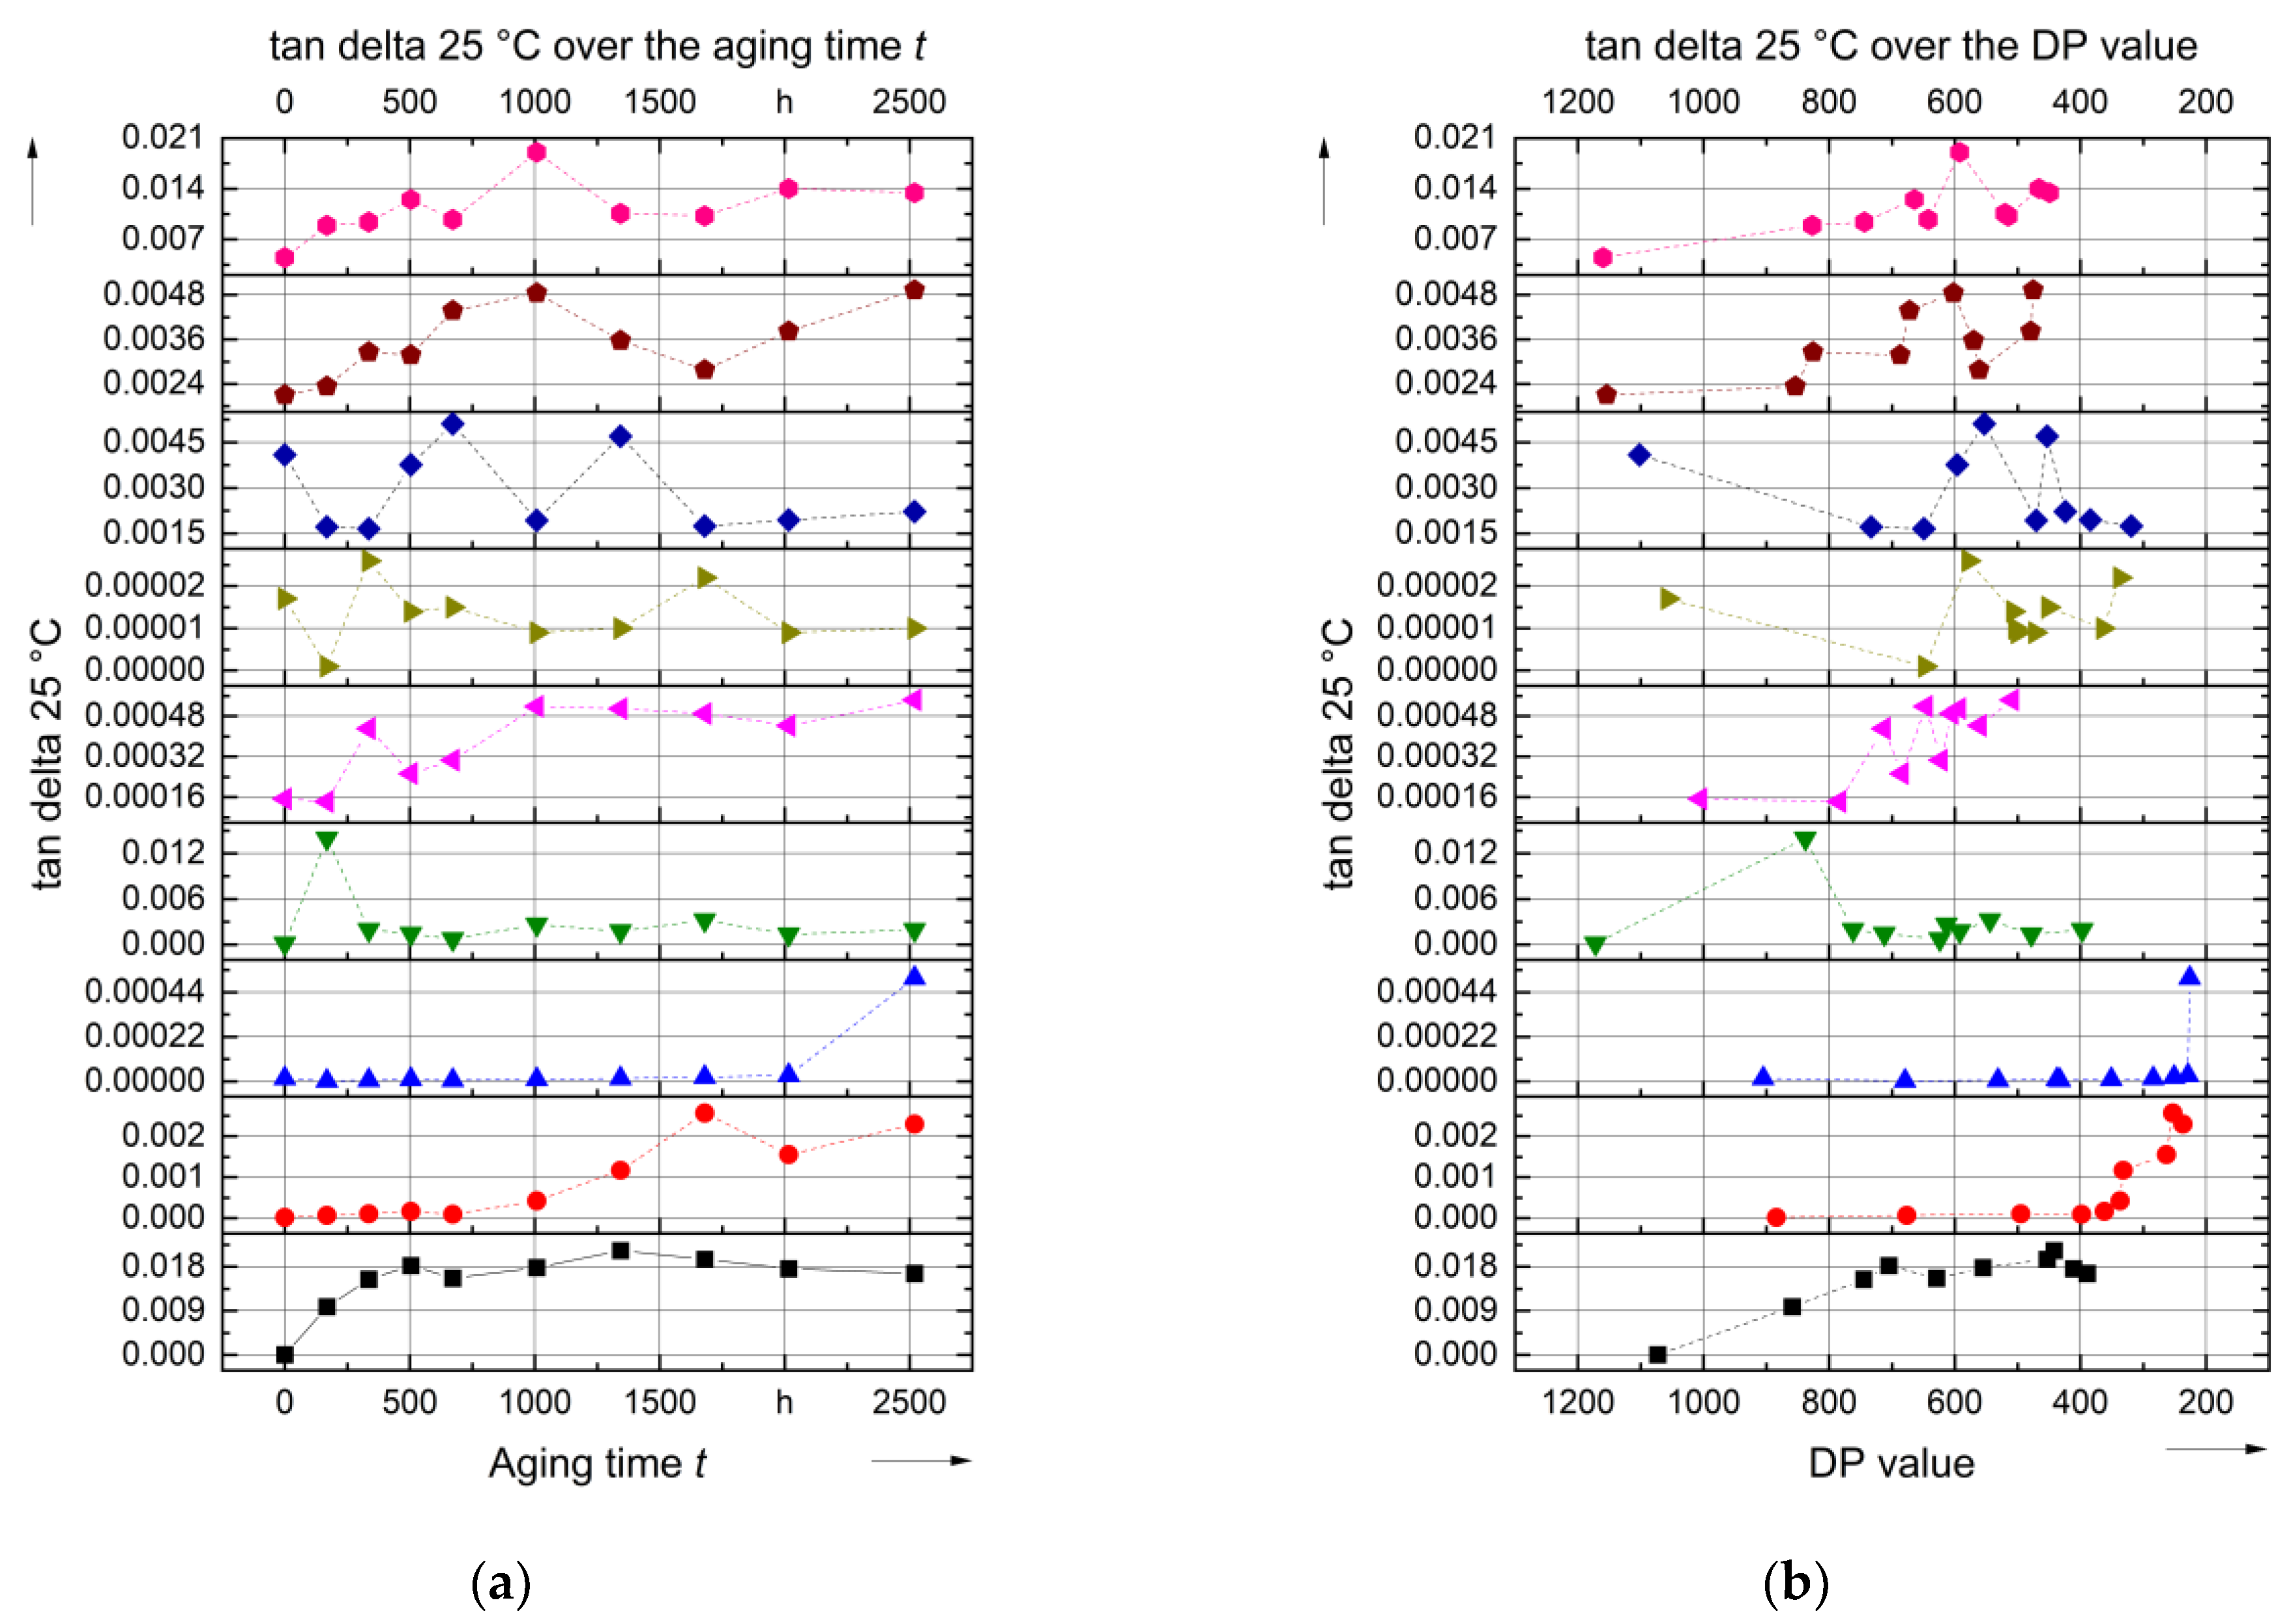
In this section, the results related to the dissipation factor (tan δ) of the liquid at a measurement temperature of 25 °C and 50 Hz 2000 VAC, shown in Figure 10, will be discussed. The research work [27] showed that the dissipation factor of natural and synthetic ester is higher than that of mineral oils, which can also be confirmed in this study. This is due to the higher absolute water content in esters as well as the basic nature of the fluids [49]. Vegetable oils form weakly polar liquids, while mineral oils are non-polar liquids [50]. The dissipation factor increases due to the formation of aging products that dissolve in the insulating liquid, such as water, carbon black and other conductive products. The studies [27] and [51] showed that the dissipation factor in closed systems is higher compared to open systems. However, the aging times were 1440 h at 130 °C in [27] and 21 days at 115 °C in [51], which are shorter when compared to this investigation. In this study, it can be observed that for later aging times, there are higher tan δ values achieved in the open system. The increase is more delayed in the inhibited Oil B and C. This increase in tan δ is due to the formation of conductive aging products, since the formation of soot and oil sludge occurs rapidly in Oil A. Thus, the open and closed systems appear to behave oppositely toward the end of the insulating paper’s life.
In addition to the dissipation factor, the relative permittivity εr was also measured at a temperature of 25 °C and a frequency of 50 Hz and presented in Figure 11. According to [52], there is only a small influence on the relative permittivity due to aging and water. The investigation [51] found out that for mineral oil there is also a small effect of the relative humidity on the relative permittivity. Regarding the current study, it is clear that almost no change is observed for the closed system. When comparing Oil A and B, as well as Oil C, with the esters, it can be recognized that the value is more constant over the aging time, while the change seems to be greater for the esters. No clear difference is observed between the synthetic Ester A and the natural Ester B and C. The larger variation for the esters could be caused by the larger absolute water content, as well as with the larger acid concentrations in the liquid, which will be discussed in more detail in the section for acid. Thus, more polar substances are present in the liquid, causing a stronger change in relative permittivity. For the oils, no difference between inhibited and non-inhibited oils can be observed for the closed system either.
In contrast, clear correlations can be observed for the open system. For the mineral oil-based Oil A and B, an almost linear increase can be seen over the aging time. For the inhibited Oil C, the value remains practically constant and only increases at the last measuring point after 15 weeks. There is no clear difference between Oil A and B, thus a general influence of the inhibitor cannot be assumed. This continuous increase is probably due to the continuous increase of polar substances in the liquid such as water and acids.

3.2.4. Breakdown Voltage UD

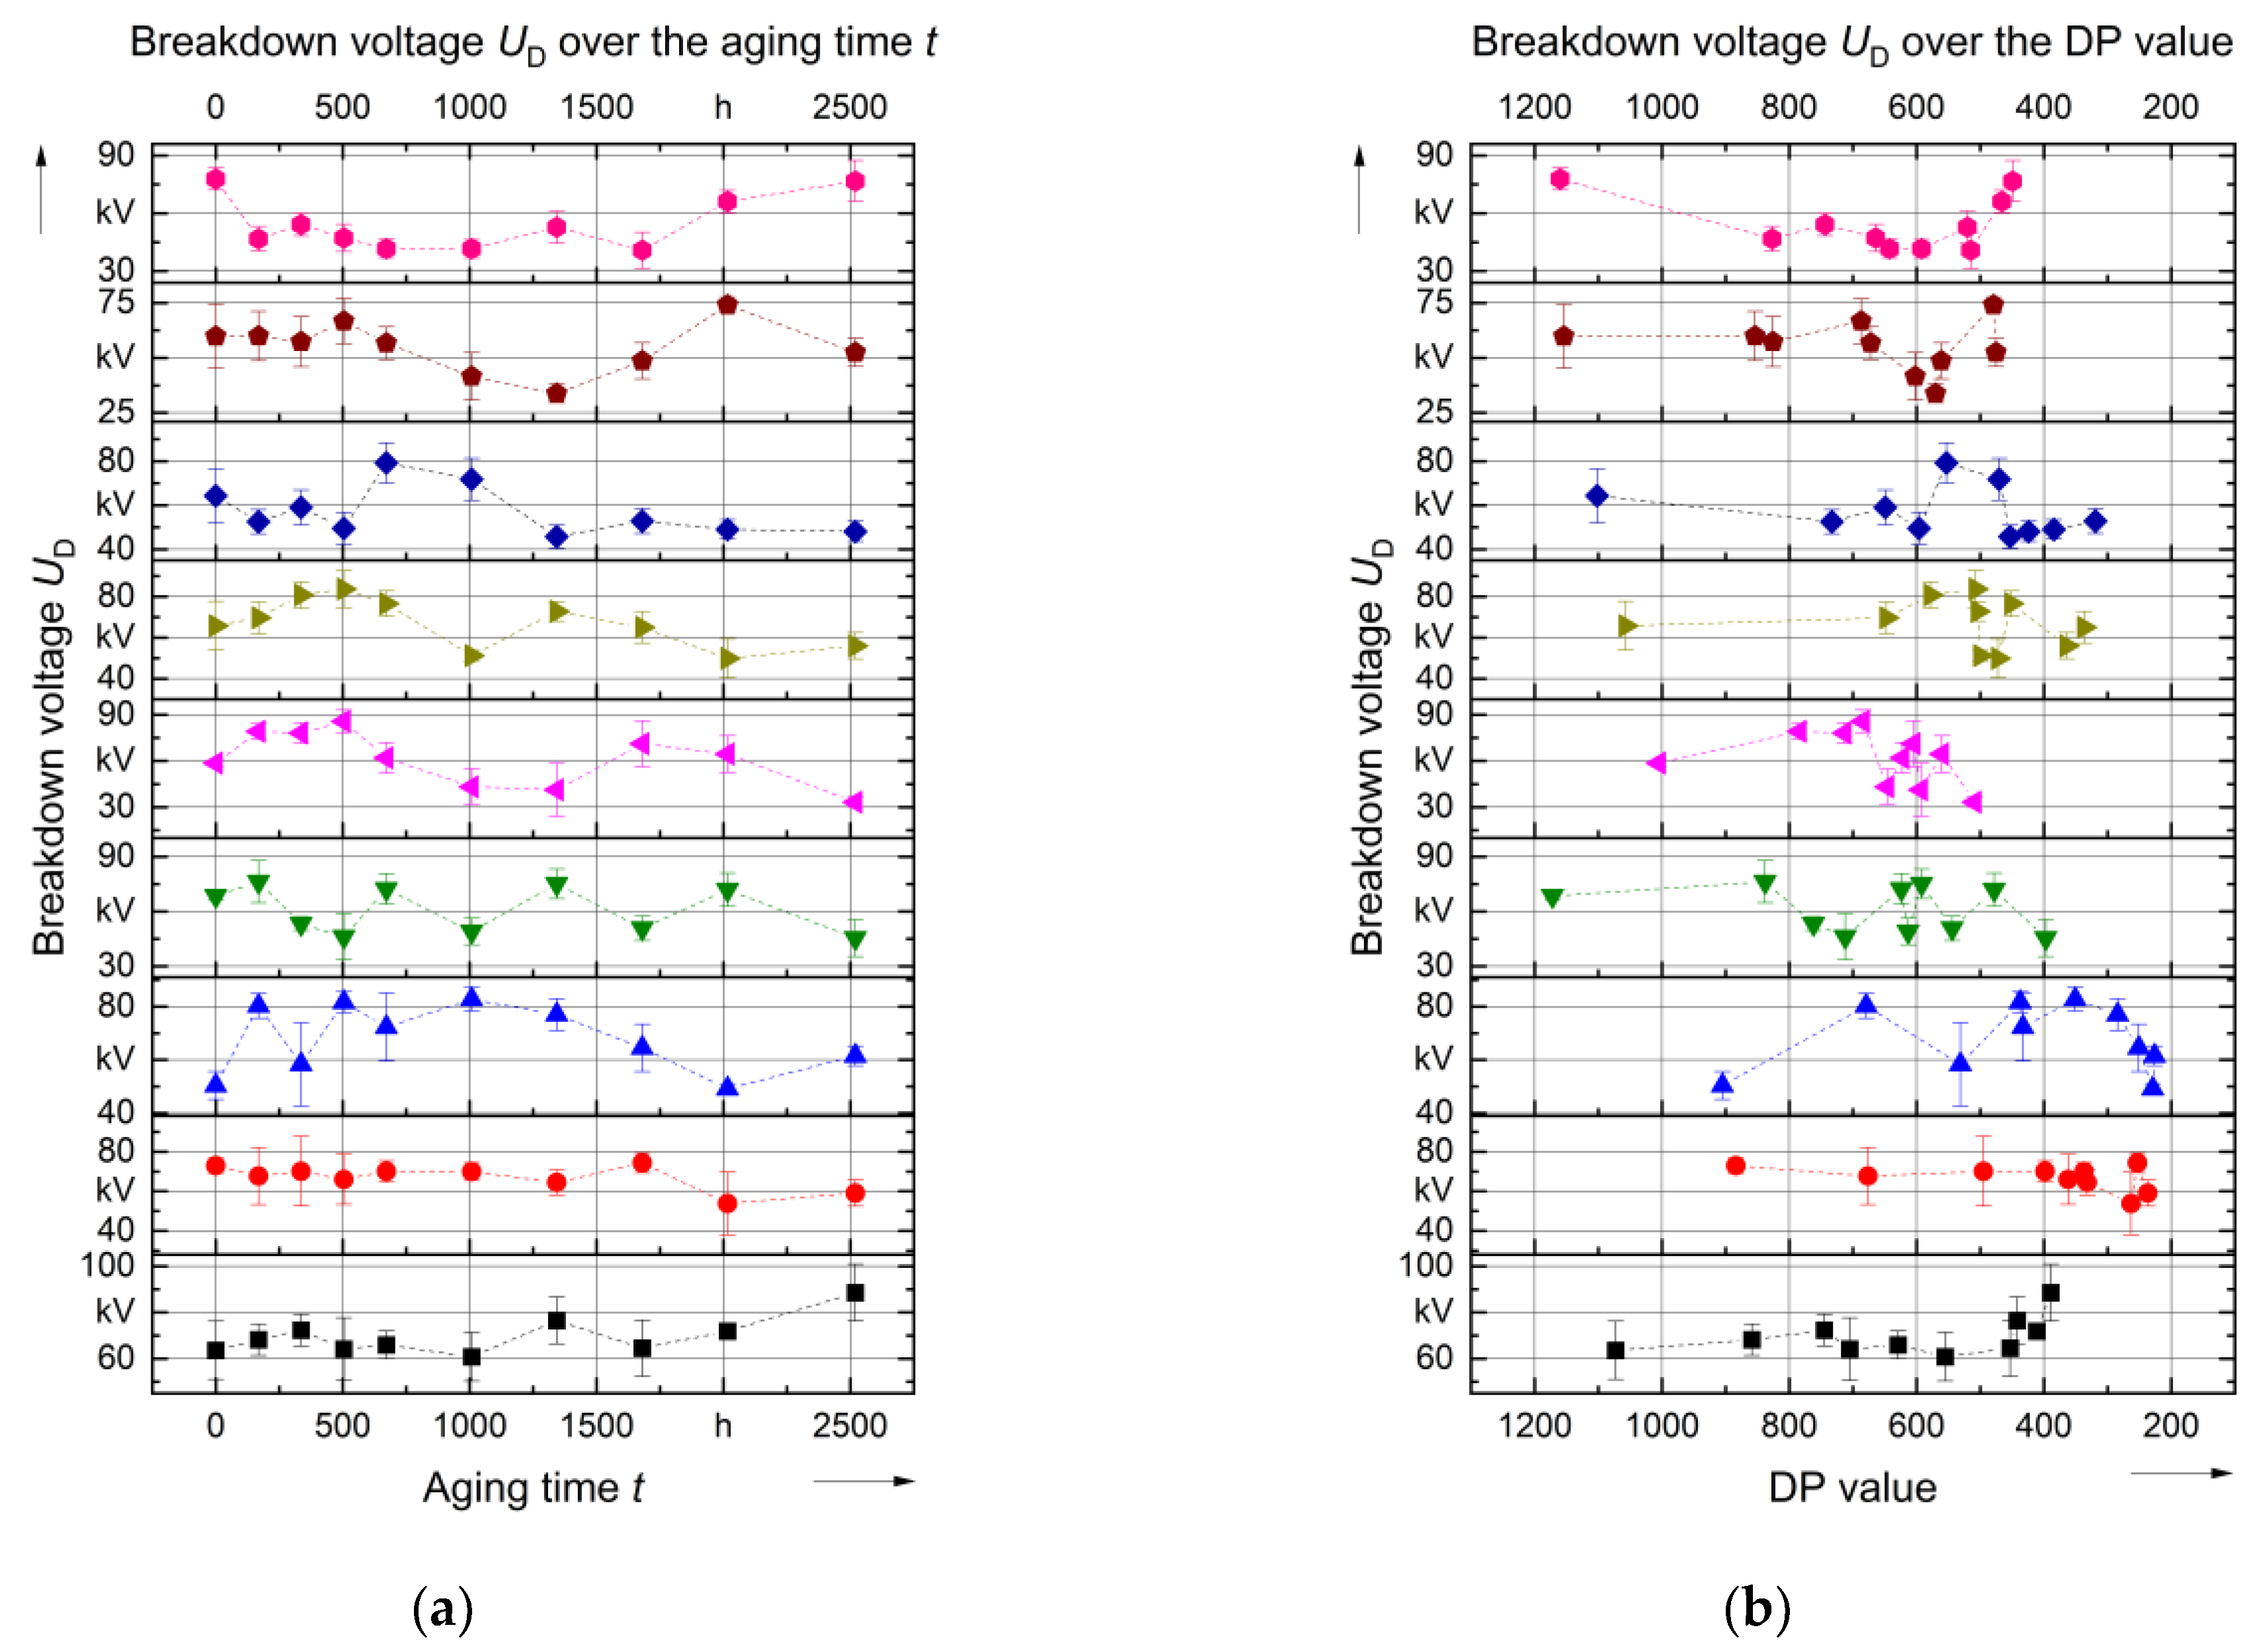
As a further parameter, the breakdown voltage UD was investigated, which is shown in Figure 12. The measurement was carried out according to IEC 60156 standard using VDE spherical caps with a spacing of 2.5 mm and a voltage rise of 2 kV/s, with six values recorded per measuring point [53]. Overall, the values show volatile behavior, regardless of the system and insulating fluid used. In the comparison between the open and closed system, the change in the closed system seems to be larger for the mineral oil-based Oil A and B with a difference of about 60 kV between the minimum and maximum value, while the difference for the closed system is about 40 kV. In the closed system, on the other hand, there is no clear difference between the oils and esters. Likewise, no clear influence of the inhibitor can be seen. At the end of aging, the breakdown voltage of esters is slightly higher than that of oils, which is due to its property. The investigation [52] found out that the formation of bubbles in esters is reduced due to the formation of peroxide during a temperature increase, because of the high affinity to hydrogen gas. The study [54] showed that the breakdown voltage of natural ester and insulating oil decrease over the aging time, after aging together with kraft paper. At an aging temperature of 140 °C, the breakdown voltage after 1500 h is about 20% lower than the initial value, and for mineral oil, the value is about 30% lower than the initial value [54].
In this study, the closed system basically also shows a decrease up to an aging time of between 1000 and 1500 h, although an increase can be observed in the further course, hence a general decrease over the aging time cannot be assumed. Similarly, [27] showed that the breakdown voltage for aged natural and synthetic ester can even be higher due to the chemical change of the ester. The volatile behavior of the breakdown voltage is due to the superposition of various effects [49]. Water and thus the relative humidity have a negative influence on the breakdown voltage of an insulating liquid. Therefore, the autocatalytic process of hydrolysis, whereby water is produced and consumed, also causes fluctuations in the relative humidity of the liquids. This is one reason for the fluctuations in breakdown voltage. On the other hand, more acids are formed, which can also have a negative effect on the breakdown voltage. In the case of esters, the overall acid concentration is higher, where predominantly mild long-chain fatty acids are formed, which are non-corrosive [54]. Furthermore dissolved gases can have a negative influence on the breakdown voltage, since electrical breakdown is often triggered by gas bubbles. In the previous section, however, it was shown that the concentration of CO and CO2 increases; hence, a further effect must be assumed overall for the increase in breakdown voltage at the end of the service life. According to [55], by-products such as radicals, alcohols, water, aldehydes, ketones, carboxylic acids, and finally esters can be formed during the aging of the insulating fluid, with some by-products significantly increase the water solubility of the fluid. Therefore, this could be a reason for the increase in breakdown voltage at the end of the aging period, since it is well known that the breakdown voltage is a function of the relative water content [35].

3.2.5. Interfacial Tension σ

Figure 13 shows the course of the interfacial tension (IFT) for the different systems and fluids. The measurements were made according to ASTM D971-99A using a Du Noüy ring [56]. The formation of oxidation products reduces the IFT value over the aging time, as this value is reduced by low quantities of polar groups. These are precursors of sludge [57]. Moreover, the IFT is reduced by the formation of insoluble polar substances, which are, for example, oil sludge or carbon particles [58].
It can be seen that the IFT of the esters at the beginning are only half of the ones for the oils. In the open system, there is an exponential decrease over the aging time. For the non-inhibited Oil A, this decrease occurs more rapidly than for the inhibited Oil B and C. This is due to the greater formation of polar insoluble aging products, while the formation has been reduced by inhibitors. It can be assumed that these substances are formed mainly by oxidation processes since the decrease in the closed system is much slower and after aging for 15 weeks the values are almost twice as high.
For the esters, it can be seen that over the aging time, the interfacial tension remains practically constant, which can be observed for both the synthetic Ester A and the natural Ester B and C. As can be seen in the section for acid, there is a strong correlation with the acid number and IFT. However, this only applies to insulating oils. In the open system, more acid is formed in Oil A, B and C than in the closed system, which is also consistent with the decrease in IFT. In the esters, the acid number is ten times higher in some cases, but this does not affect the IFT. The formation of long-chain fatty acids in both natural and synthetic esters seems to not influence the IFT as those acids are different from those in the mineral oil where the correlation is higher [1].

3.2.6. Acidity

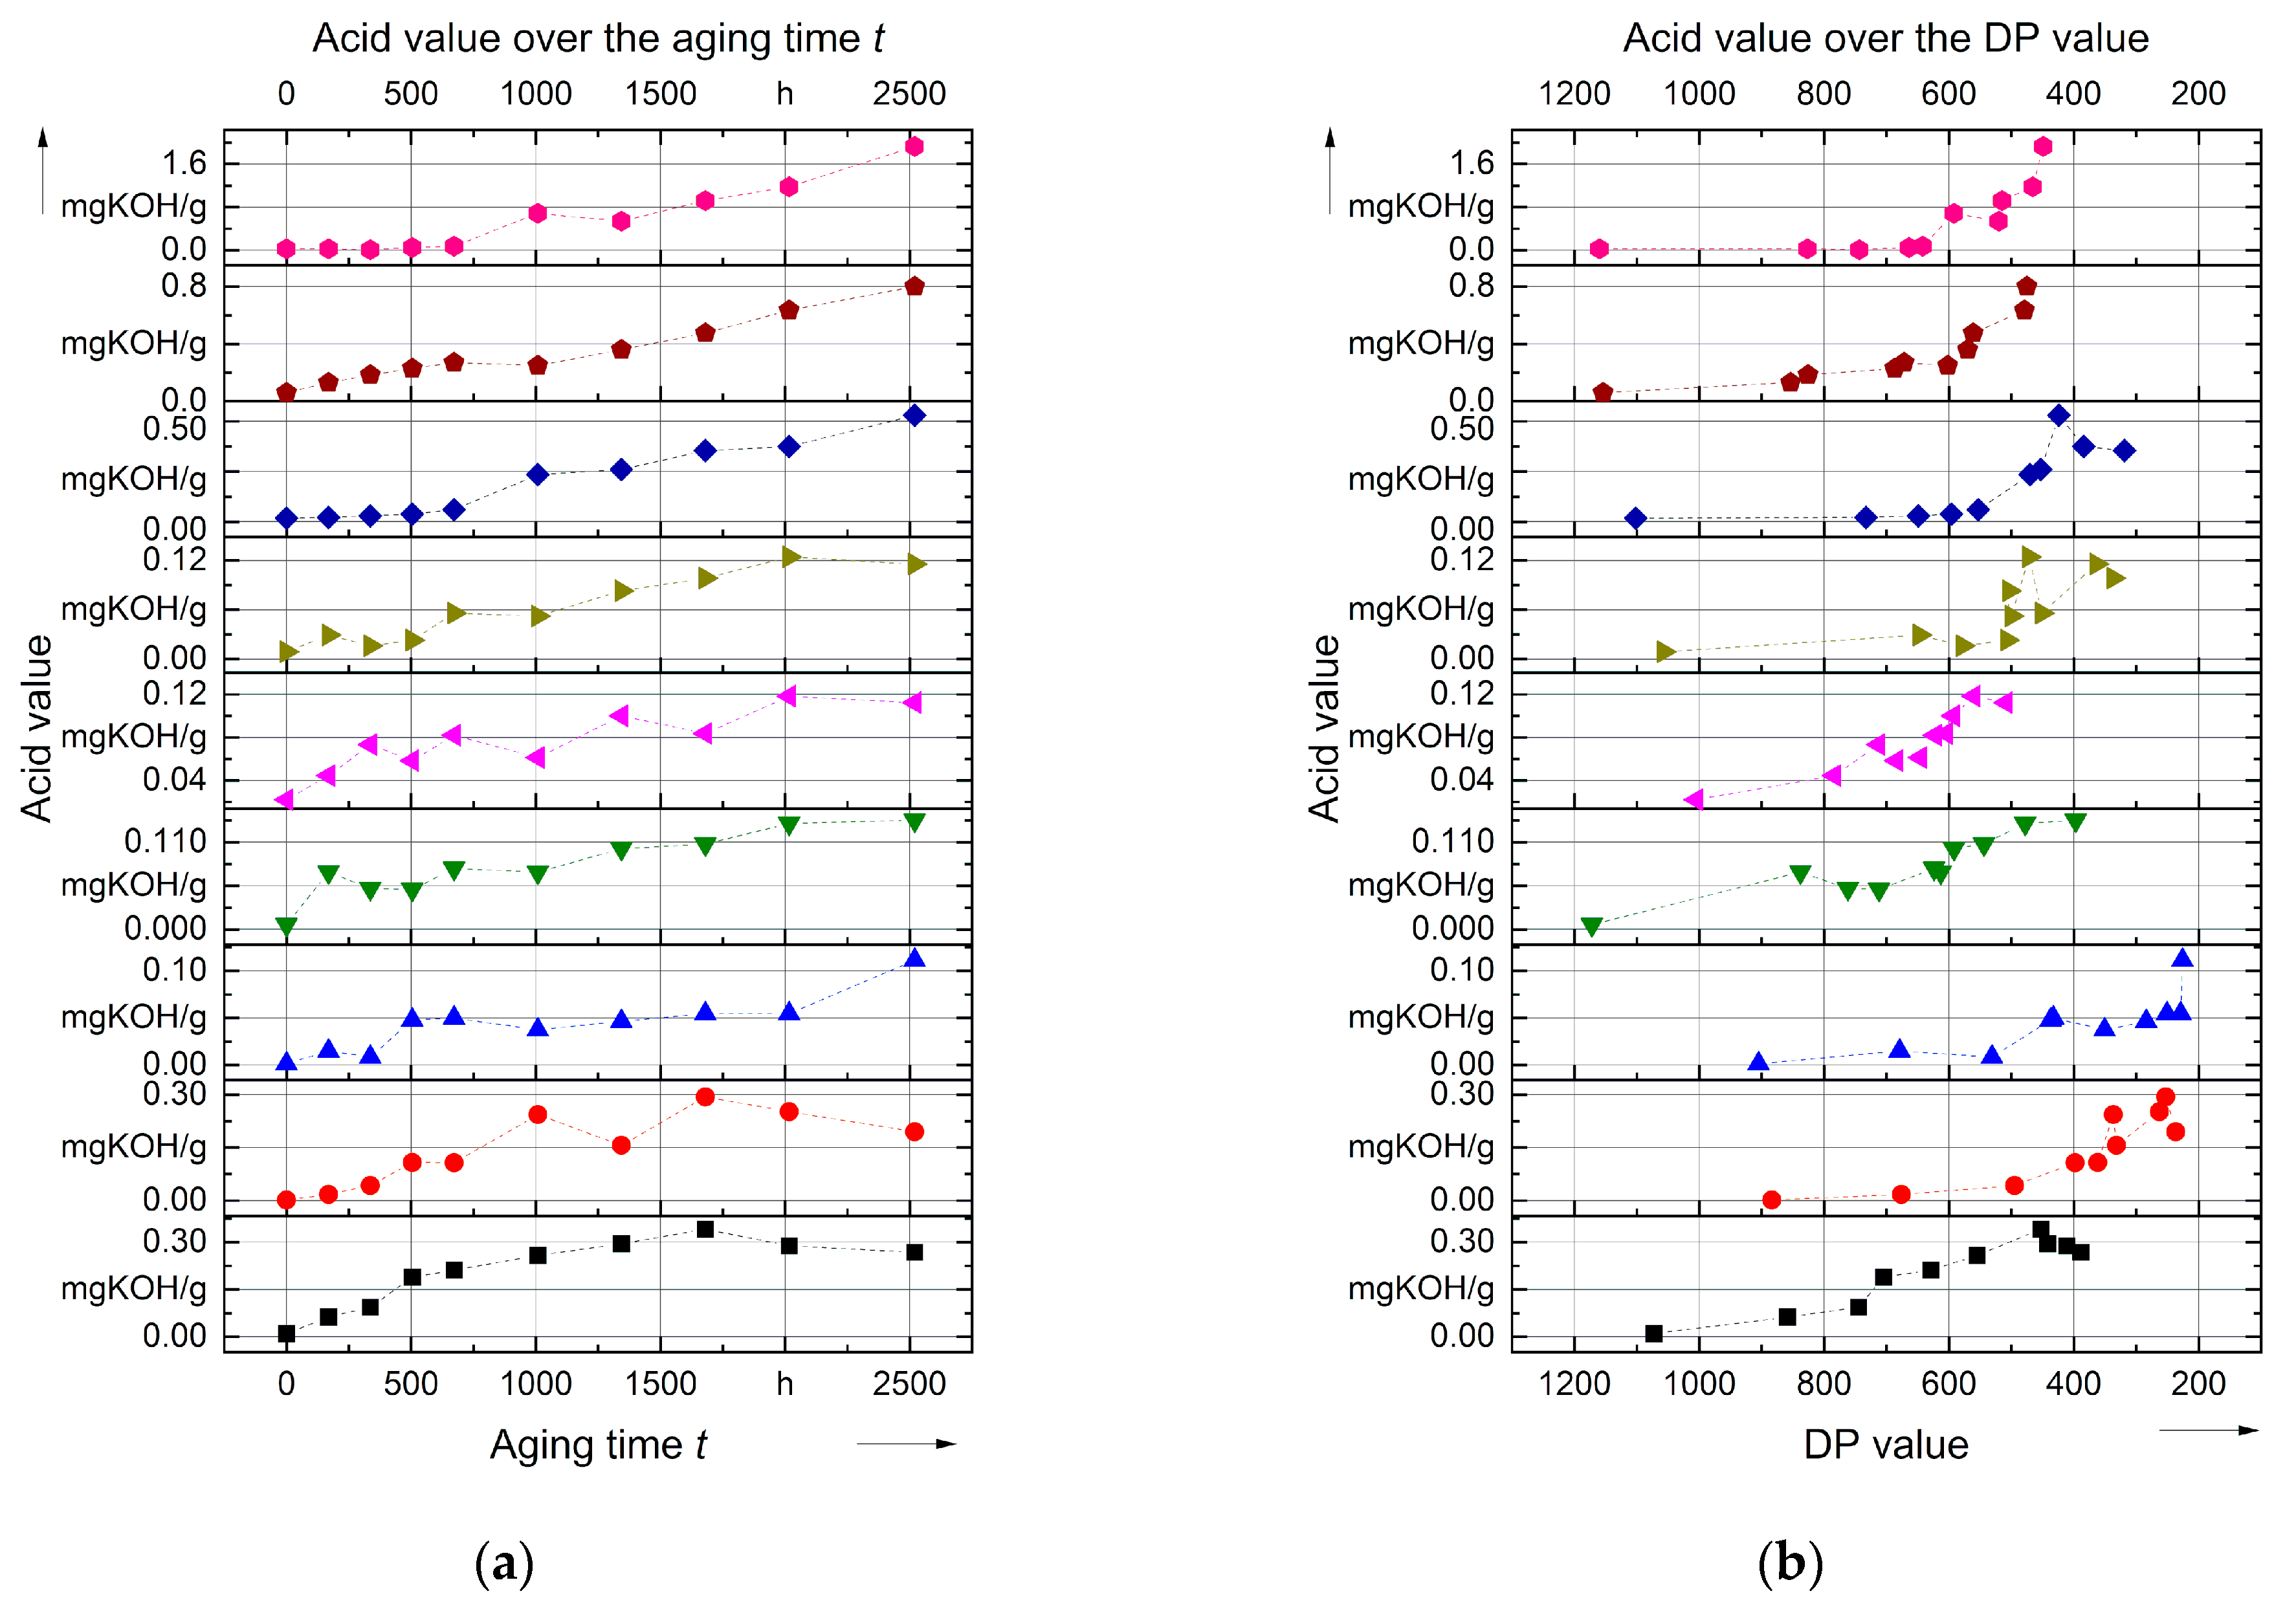
Another important aging product for assessing the condition of the insulation is the acid number of the insulating liquid, as shown in Figure 14. Aging of the liquid-paper insulation results in the formation of various acids. In this work, the measurements with respect to IEC 62021 were made using a potentiometric method for mineral oil-based and non-mineral oil-based liquids [59,60]. This is a common method for determining the acid number. However, the disadvantage is that the total amount of acid in the liquid is determined, but it is not possible to distinguish the types of acid [61]. During aging, high (HMA) and low molecular weight (LMA) acids are formed by hydrolysis and oxidation processes. Due to thousands of different molecules of mineral insulating oil, the theoretical number of different acids that can be formed is even larger. Acid is formed mainly by hydrolysis processes and also to a lesser extent by oxidation processes [1]. The HMA acids in mineral oil are, for example, stearic and naphthenic acids. The LMA acids are formic, acetic and levulinic acids [62]. The research [62] has shown that the types of acids have different influences on the aging process of the insulation. For example, it is known that LMA acids are mainly absorbed by the paper insulation. This is due to their solubility in water. In the case of HMA acids the majority remain in the insulating liquid and thus have no negative effect on the paper aging [63].
In natural esters, numerous acids can be formed by hydrolysis and oxidation. The majority of the acids are stearic, palmitic, oleic, linoleic and α-linolenic acids [64]. The study [65] showed that water is consumed in natural esters, resulting in the formation of high molecular weight (HMW) free fatty acids in the ester. This phenomenon can also be observed with the natural Ester B and C in Figure 6. Especially for Ester C, the decrease in the water content after 1000 h can be detected, with a disproportionate increase in the acid number. With an acid number of about 1.6 mgKOH/g, this is about twice as large as that of the natural Ester B with 0.8 mgKOH/g. However, even the synthetic Ester A, with an acid number of 0.5 mgKOH/g, has a value about four times higher than that of the oils in the closed system. The investigation [19] expresses the suggestion that a similar behavior of formation of high molecular weight (HMW) free fatty acids occurs for synthetic esters, under the consumption of water. However, in this study, no decrease in water content was recognized for the synthetic Ester A. However, also for Ester A, the acid number is about four times higher than for the oils in the closed system. The splitting of the ester bond in the molecule results in long-chain fatty acids, which are caused by hydrolysis in both natural and synthetic esters but have only a minor effect on paper aging [1]. Thus, both systems (open and closed) and all insulating fluids used show an increase in acidity as a function of aging, making the acid value a good parameter for assessing the aging condition of both the insulating fluid and the insulating paper.

3.2.7. Dynamic Viscosity η

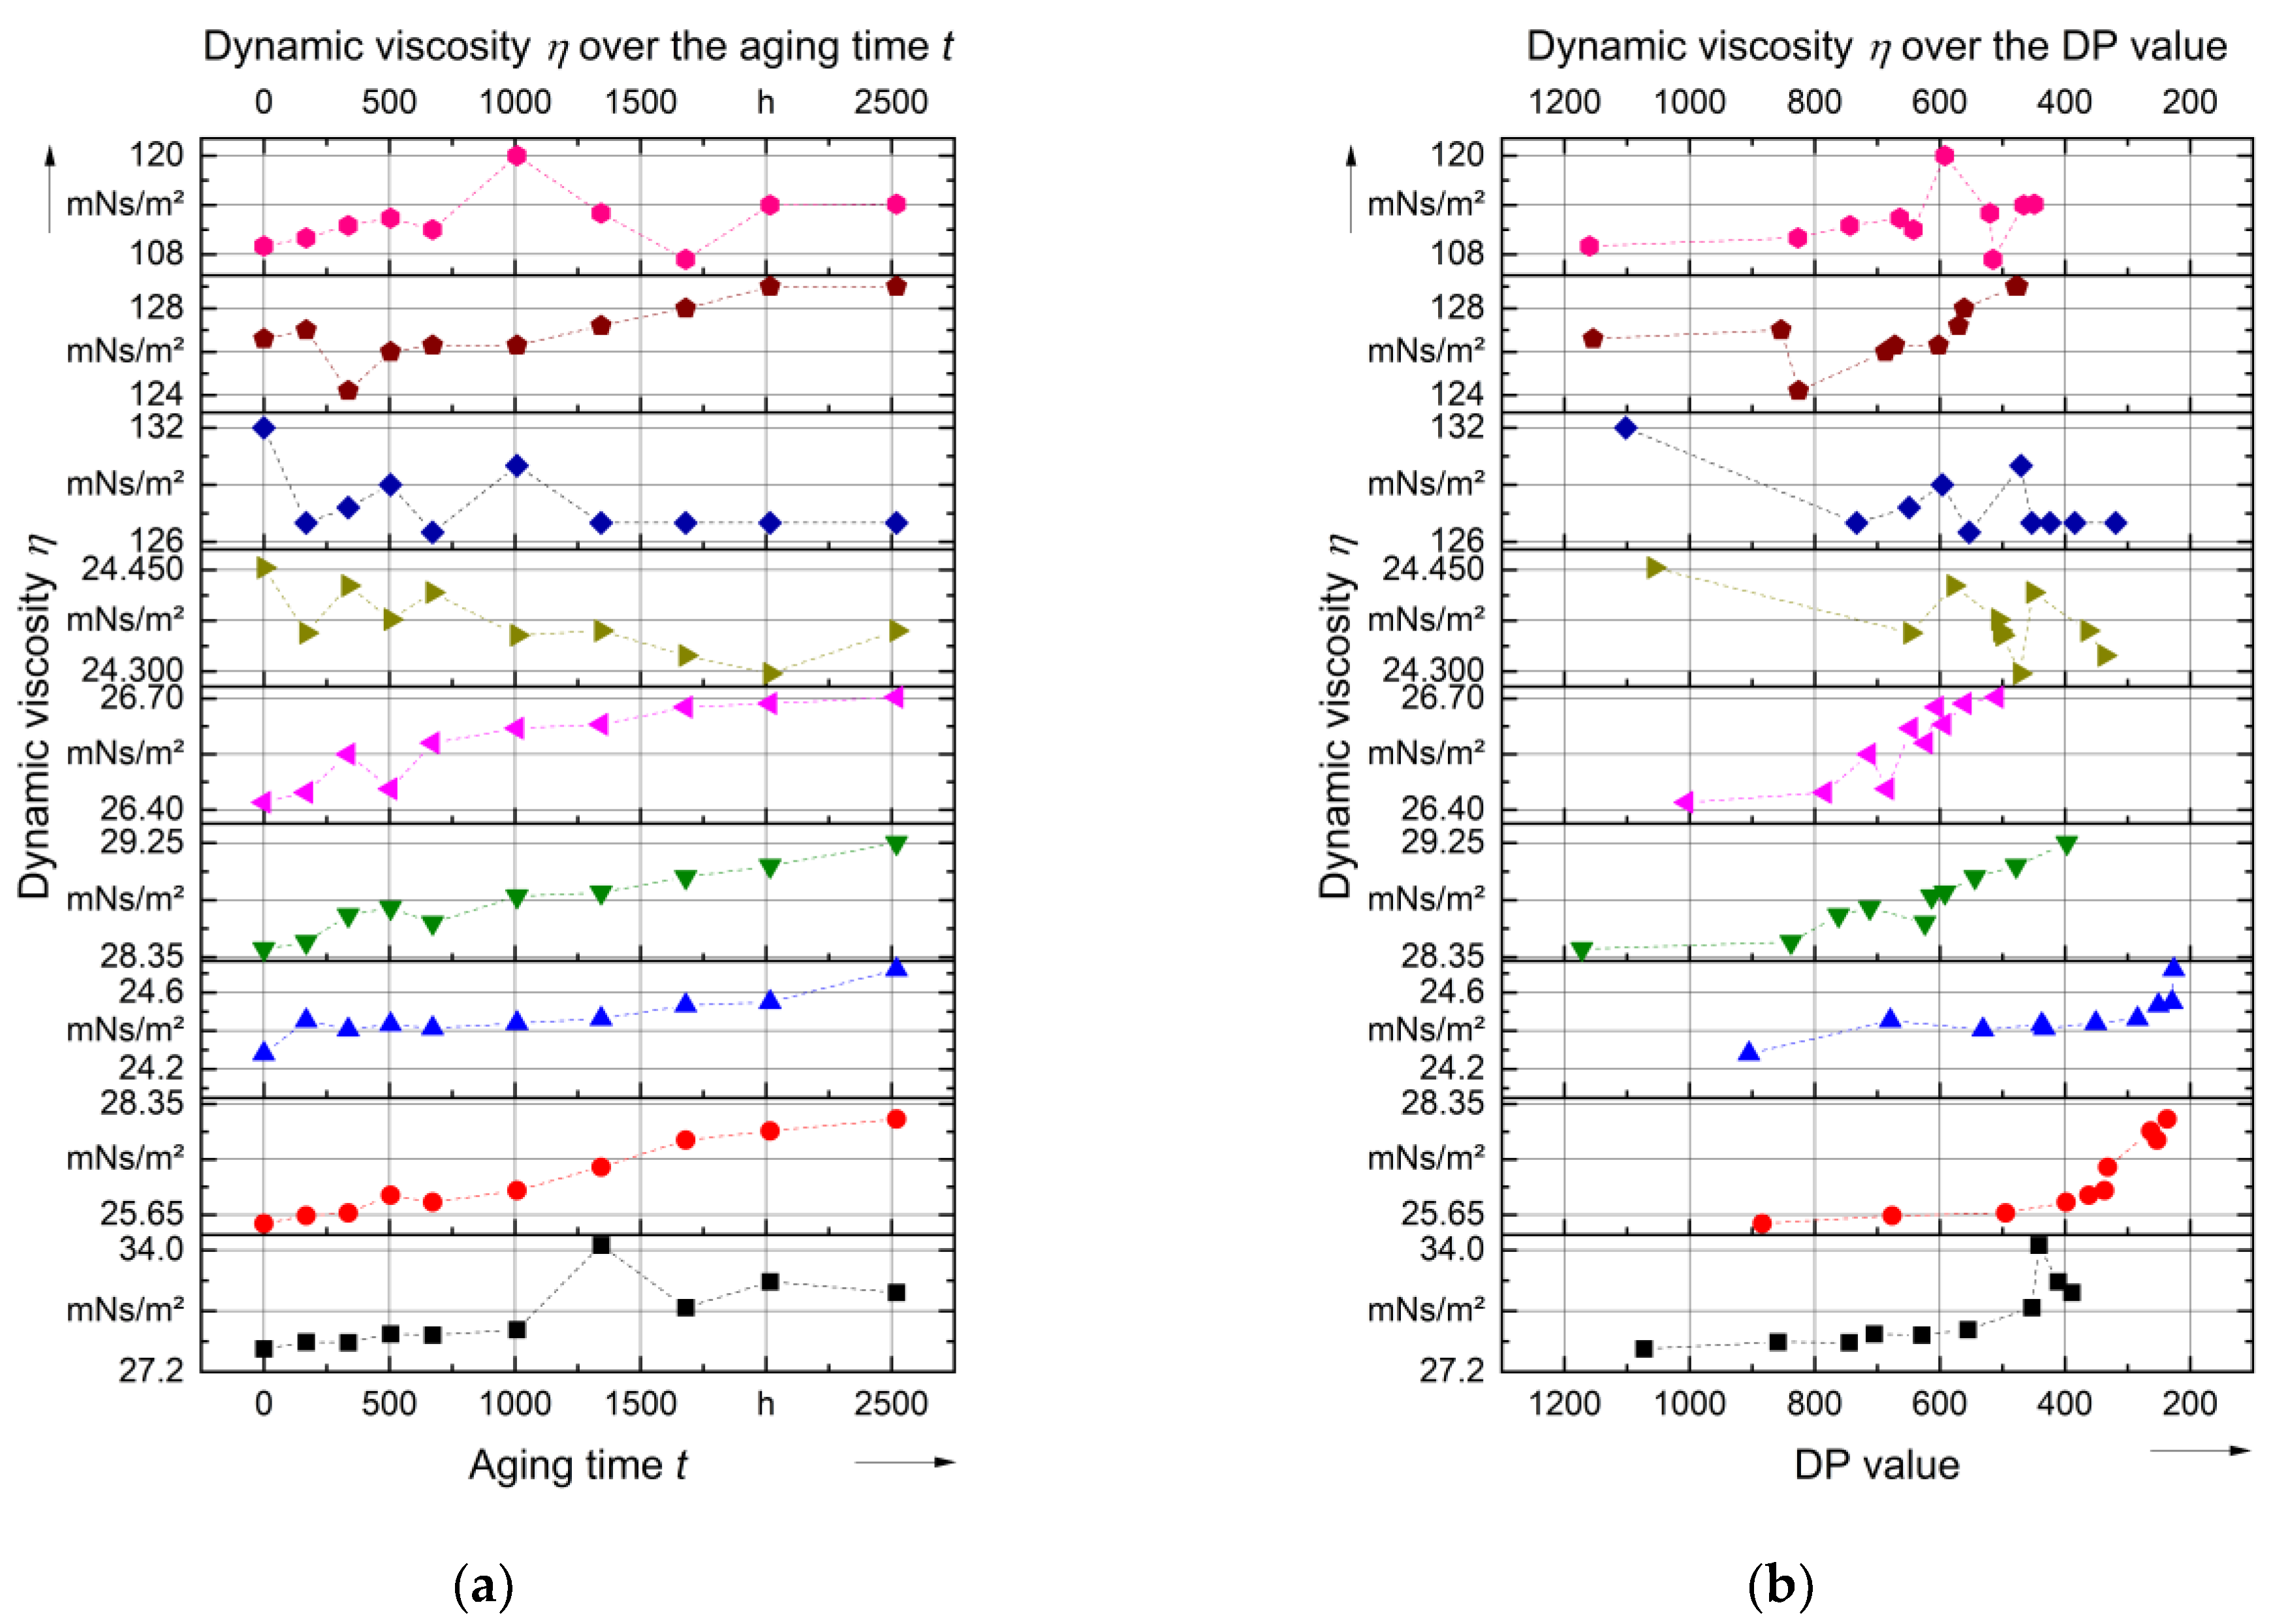
The viscosity is an indicator of the cooling capacity of the insulating liquid. Therefore, as a further parameter, the dynamic viscosity according to ASTM D2983 at a temperature of 10 °C was determined in this study, as shown in Figure 15 [66]. This temperature was chosen because it was discovered in previous investigations that changes in viscosity due to the aging processes are best observed at low temperatures. At higher temperatures, the viscosity is reduced to such an extent that any aging influences that may occur cannot be adequately detected.
The results show that the most significant changes are observed in the open system, where there is an almost linear increase in viscosity over the aging time. This is more pronounced for the mineral oil-based Oil A and B than for Oil C. This increase can also be recognized in the closed system for Oil A and B. For Oil C, however, the viscosity remains constant over the aging time. There is an increase in viscosity due to the oxidation of the oil-paper insulation material as well as the associated formation of aging products such as furfural as well as acids. Furthermore, sludge is formed in mineral oils due to the polymerization of degradation products. This leads to a deterioration of heat transfer in the transformer, which in turn leads to accelerated aging of the insulating material and an associated increase in viscosity [49].
The significantly higher viscosity of the esters compared to the insulating oils is also noticeable here. The relative change in the viscosity for the esters is smaller compared to the oils in the closed system, with the viscosity remaining practically constant. This is due to the low influence of oxidation processes on account of the closed system, which is also consistent with the results from the investigation [67]. In this case, the viscosity of ester is nearly five times higher, due to its chemical properties. Ester mainly consists of triglyceride while mineral oil is mainly made up of hydrocarbon [49]. Oxidation processes in natural esters attack predominantly unsaturated parts of the carbon chain in the molecular structure, leading to an increase in viscosity. For this reason, natural esters are only suitable for use in hermetically sealed transformers. However, this process of increasing viscosity needs to not be accompanied by acid formation [1].

3.3. Inhibitor Content

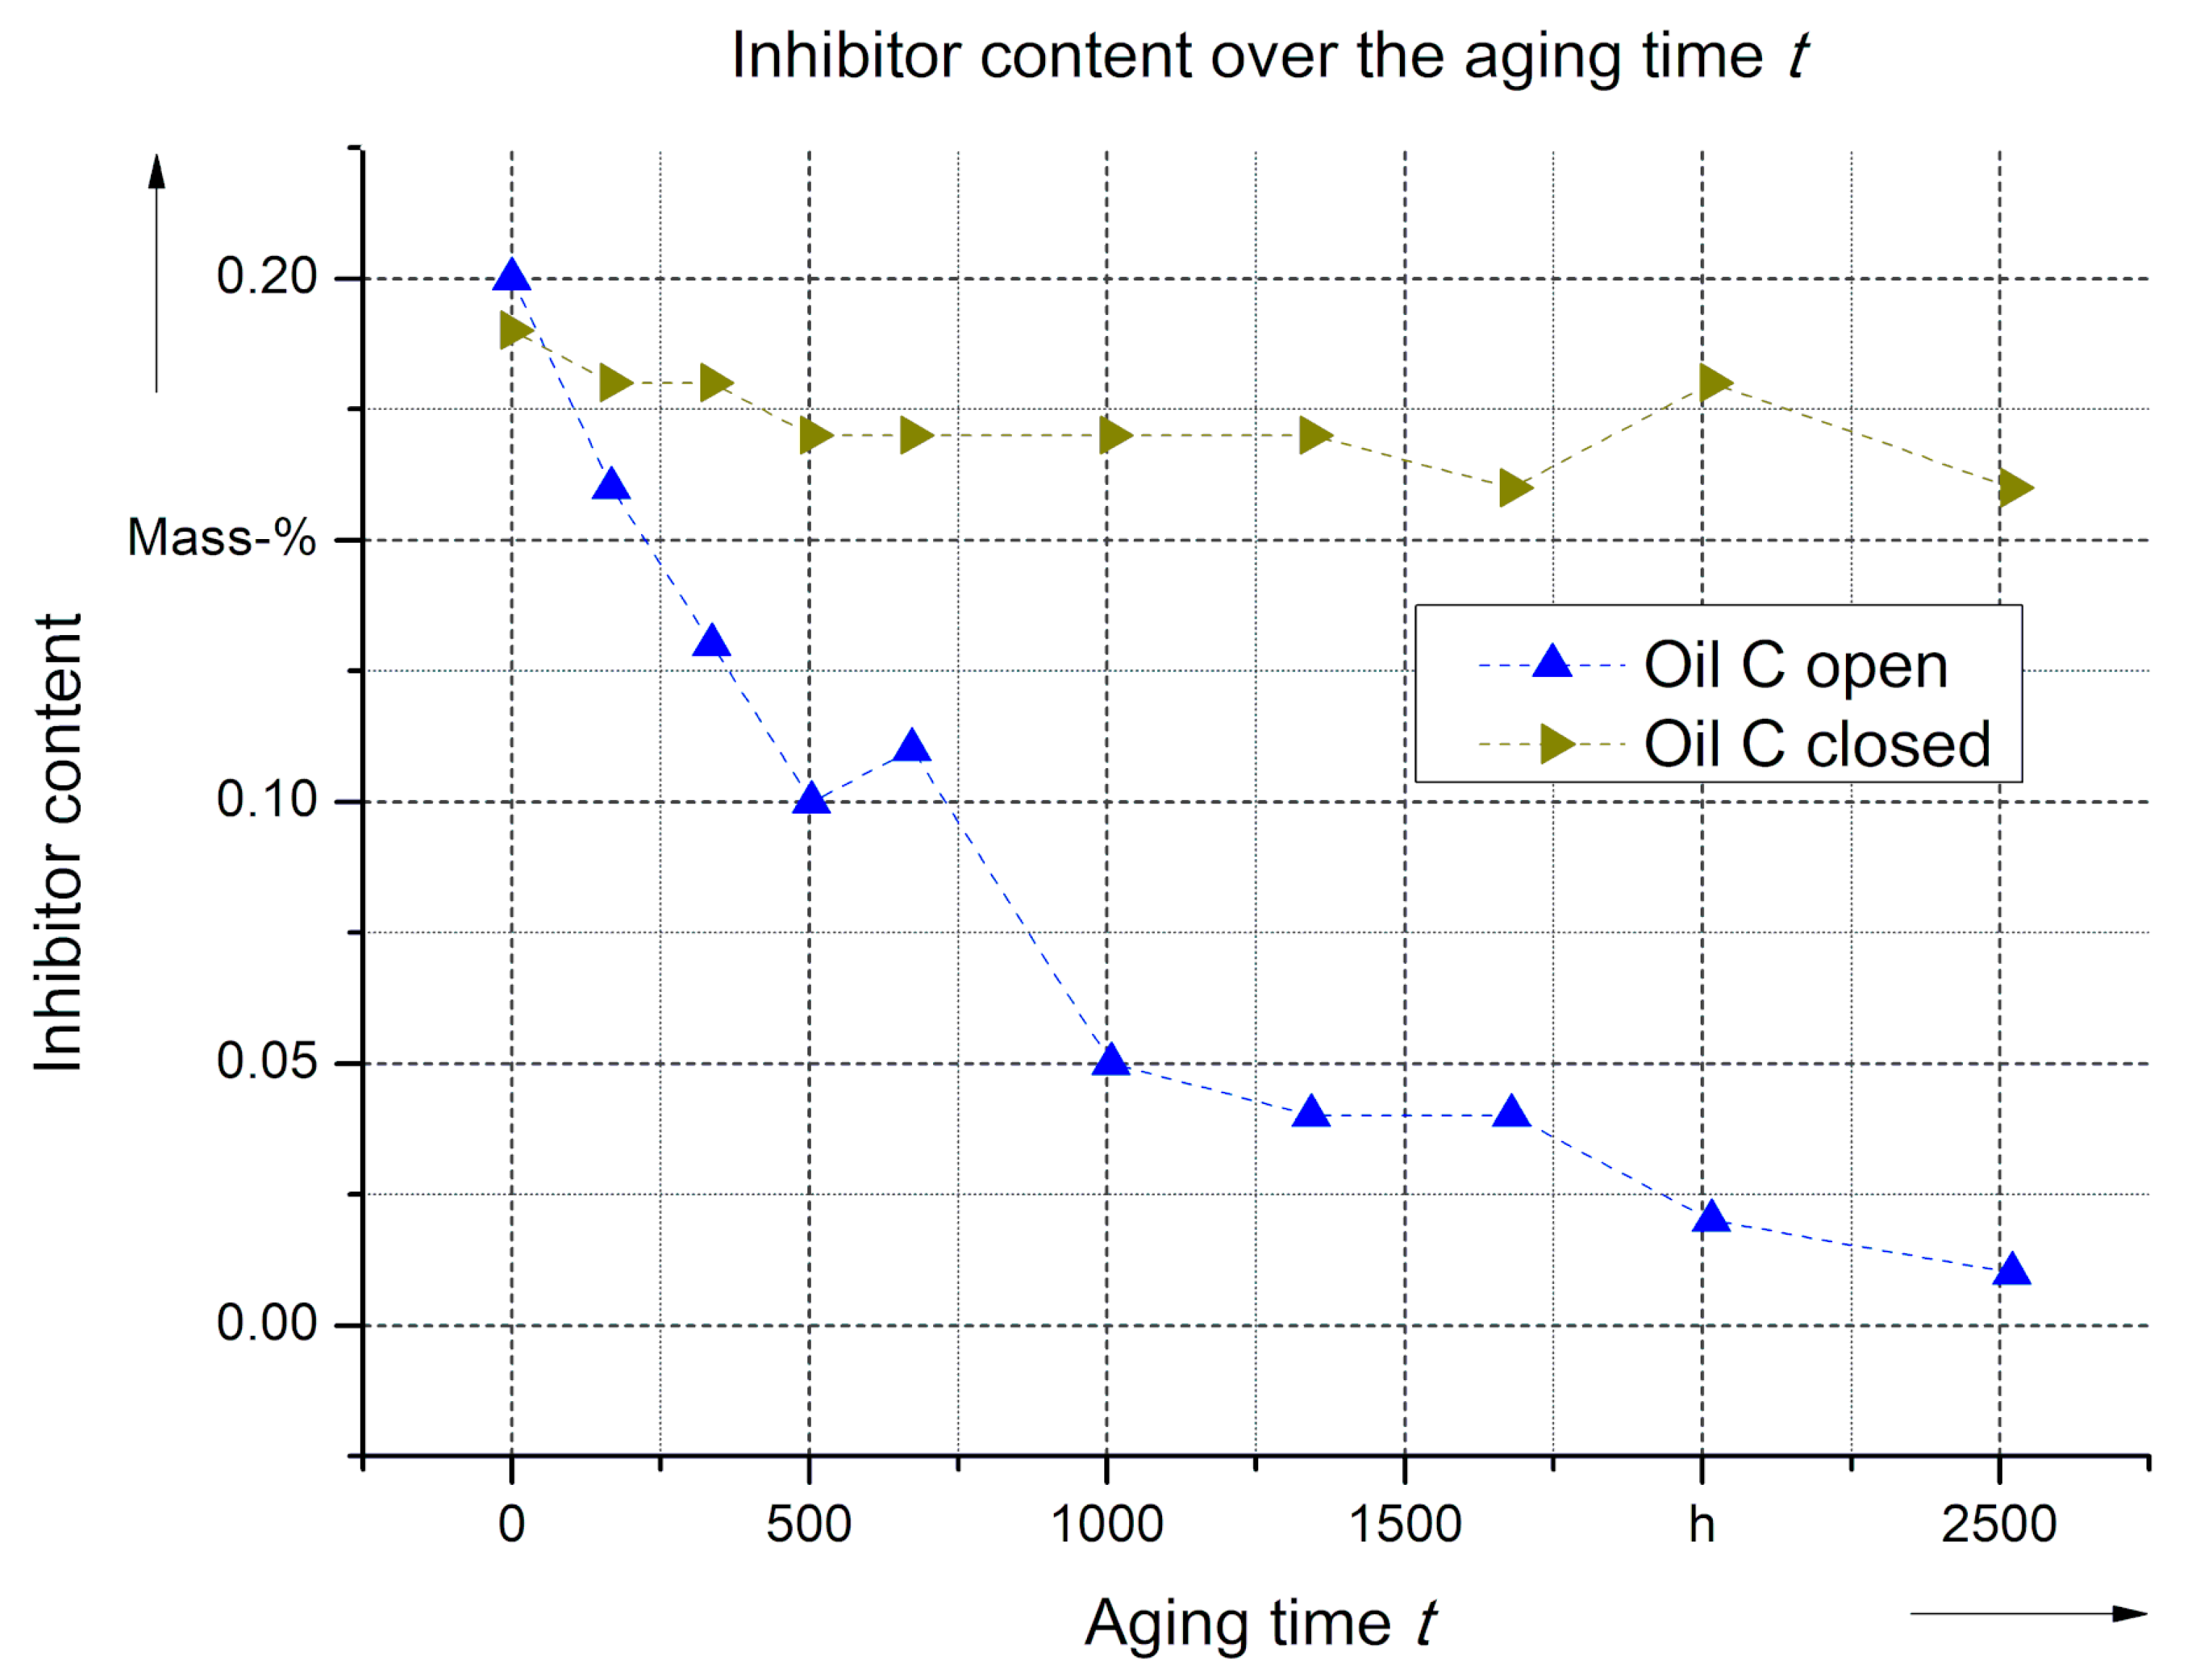
In order to investigate the change in the inhibitor content, the 2,6-dibutyl-4-methylphenol (DBPC) content of Oil C was measured according to IEC 60666 [68]. The course of the inhibitor concentration in mass percent (mass-%) for the open and closed system is shown in Figure 16.
It can be assumed that the curves are qualitatively representative for Oil B too, which is also inhibited. Initially, Oil C has a concentration of about 0.2 mass-% in both systems, with the concentration decreasing exponentially over the aging time. The decrease is much more pronounced in the open system than in the closed system due to oxidation processes. After aging for 15 weeks, the concentration in the closed system is 16 times higher than in the open system, with 0.16 mass-%. The research [69] found out that DBPC reduces the generation of acids and other by-products to a greater extent compared to other antioxidants, which is expressed in lower acid number and higher IFT. The study [70] showed that DBPC in new oil has very little effect on the dissipation factor as well as on the gas components produced during aging.
This shows that the design of the transformer has a major influence on the decrease in inhibitor content, which, however, is not reflected to the same extent in the aging rate of the paper, since the difference in DP value with Oil C after 15 weeks is only about 1.6 times as big.

3.4. Correlation Analysis

In this section, the correlations among the aging markers will be examined. The aim is to investigate the correlation between the variables for improving the condition assessment of transformers. Parameters that show a strong correlation, e.g., to the DP value need to be more considered if the quality of the paper should be assessed. Therefore, the correlation is determined according to Pearson, whereby the Pearson correlation coefficient r is calculated. The meaning of the coefficient is shown in Table 3. For a better overview, only strong correlations with a value of |r| ≥ 0.8 are shown in the following.
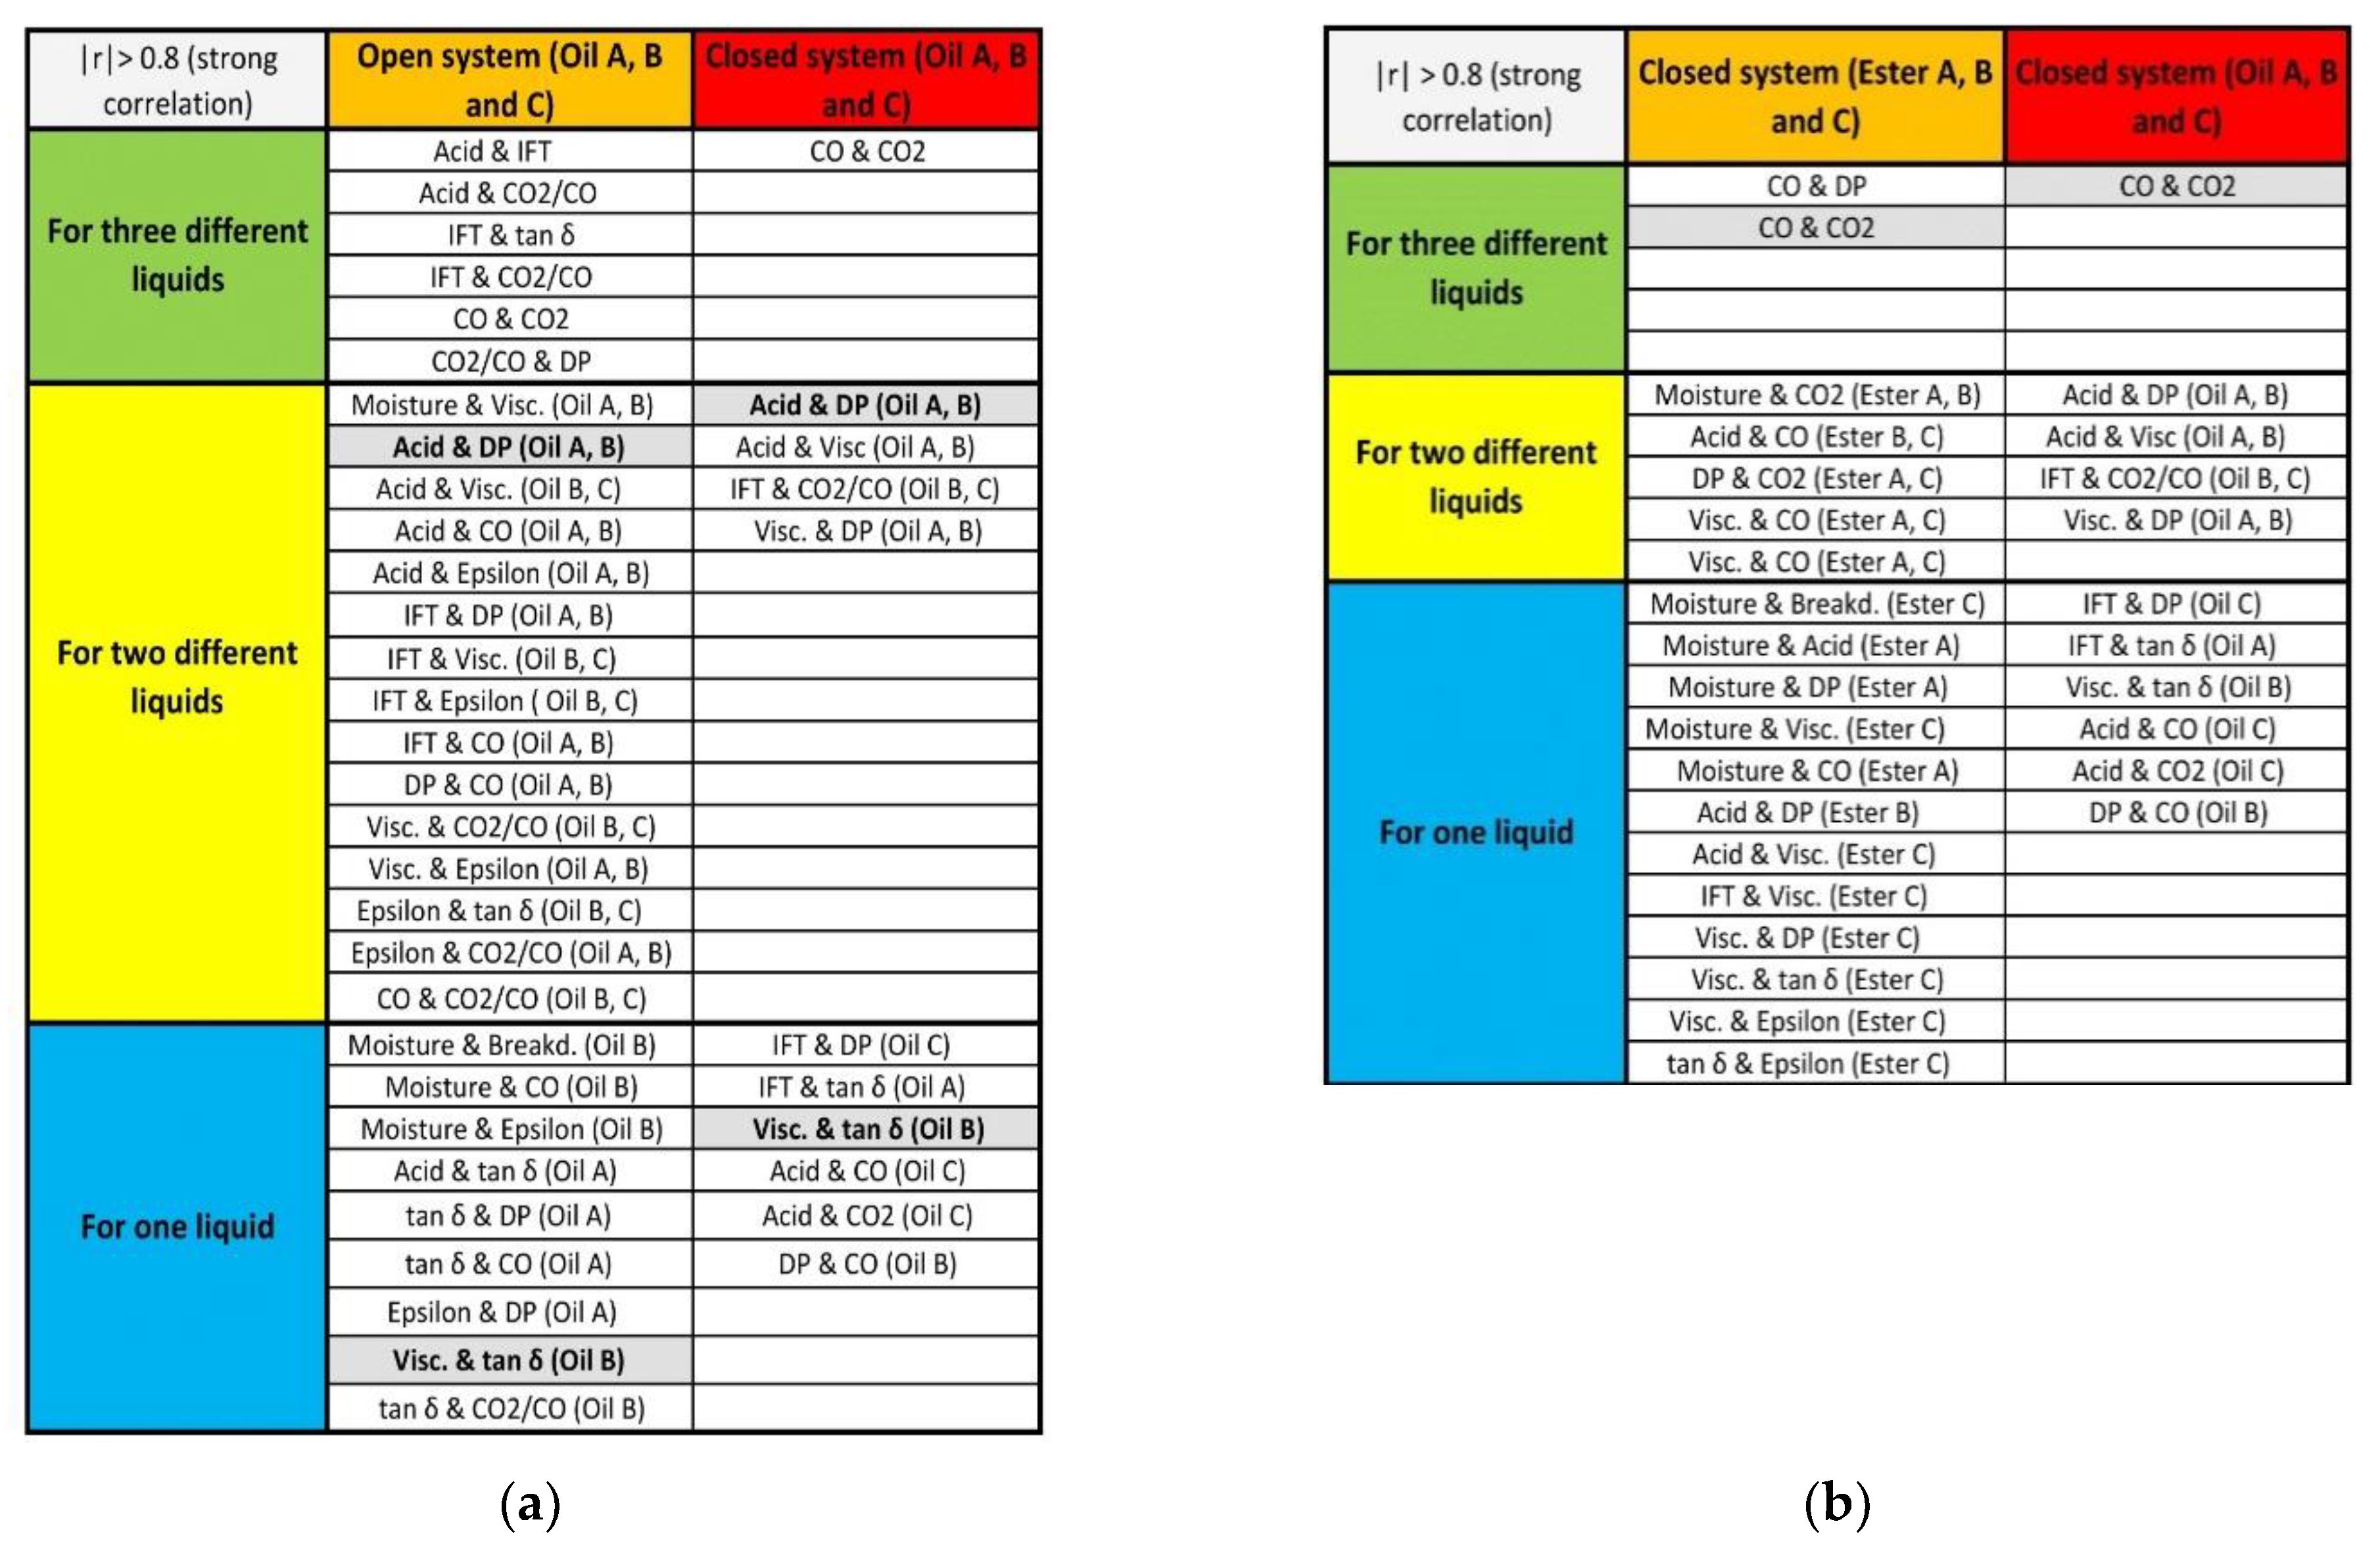
Figure 17a presents different markers with strong correlations for the open and closed systems in the insulating Oil A, B and C. The figure tries to show that the correlation between which two markers are strong as well as whether the strong correlation occurs for all three Oils A, B and C at the same time or only for two or only one liquid. If the correlation does not occur for all three liquids at the same time, the oils in which this correlation occurs are marked in brackets. It can be seen that the number of cases with strong correlations is larger in the open system than in the closed system.
For a better understanding of the principle, an example from Figure 17a is discussed in more detail. The inhibited insulating Oil B shows a strong correlation between its dynamic viscosity (η) and the dissipation factor tan (δ) in both systems (open and closed). Corresponding correlations are further visually highlighted by means of a grey background, with the matching oil type, written in brackets. For the open system, a dependence on the type of oil can be seen. Some correlations, such as acid and IFT are apparently independent of the oil type (inhibited or non-inhibited), as these correlations occur for all three oils. For many of the correlations that occur for two oils, the correlations are for inhibited Oil B and C. Thus, there is obviously an influence of the inhibitor. In the case of the strong correlations for one oil, Oil A is most frequently represented, which means that these correlations probably occur predominantly for uninhibited oils. The higher number of strong correlations in the open system is probably caused by the greater relative change in the aging markers due to increased oxidation processes. The overall relative change of markers in the closed system is smaller, which means that a larger number of markers would have to be investigated in the closed system to achieve a general condition assessment of the oil-paper insulation.
In Figure 17b, the strong correlations of markers in the closed system have been investigated using different insulating fluids. In general, this can be understood as a comparison between esters and insulating oils when used in a hermetic transformer. For this purpose, the insulating oils (Oil A, B and C) and the synthetic and natural esters (Ester A, B and C) are compared and illustrated. It can be observed that for the esters there is a very good correlation between the DP value, and thus the aging condition of the insulating paper, and the gas concentration CO. Nevertheless, the number of the case with strong correlations is smaller than those of the open system.
For esters, it appears to be strong correlations between aging markers and the formation of CO and CO2, which can be recognized in the "For two different liquids" property. Nevertheless, it does not seem to be dependent on the type of ester, as this can be observed for both the synthetic Ester A and the natural Ester C. The esters have significantly more strong correlation cases in the part of "For one liquid" compared to the insulating oils. Here it is noticeable that the natural Ester C has the most correlations compared to the Ester A and B. Overall, the number of correlations in the closed system is lower compared to the open system. Therefore, considering the type of insulating fluid is more important for oils than the type of system (open or closed). Obviously, a distinction must also be made between the natural esters, since they do not show strong correlations to the same extent.
Regarding the indirect determination of paper aging by measuring aging markers in the insulating liquid, the CO2/CO ratio seems to be particularly well suited for the open system, since it shows a strong correlation for all three insulating oils. Likewise, the acid number, IFT and concentration of CO are well suited for the mineral oil-based Oil A and B. For the non-inhibited Oil A, the dissipation factor tan δ and the relative permittivity εr are also suitable. In the closed system with the insulating Oil A, B and C, the acid number, as well as the dynamic viscosity for the mineral oil-based Oil A and B, show a very strong correlation with the DP value. For the inhibited Oil C, the IFT seems to be a good parameter for drawing conclusions about the paper condition. Furthermore, the gas concentration CO shows a strong correlation with the DP value for all three esters. Correspondingly the CO2 concentration for the Ester A and C. For the synthetic Ester A, there is also a strong correlation with the moisture content and for the natural Ester B with the acid number. Based on such an analysis, suitable parameters can be chosen for the creation of an algorithm, which can be based, for example, on fuzzy logic. By means of such an algorithm, different parameters can be used for different transformer types and fluids, which enable the indirect determination of the DP value, which was carried out in the investigations [72,73].
In Supplementary Materials, Pearson’s correlation values r are shown for the different systems as well as liquids.

3.5. Threshold Values for Paper Aging

Based on the results obtained, it can be seen that oil-paper insulation ages differently in various systems, with differences also depending on the insulating fluid. For this reason, differences are determined, whereby a distinction is to be made between inhibited and non-inhibited oil as well as synthetic and natural esters. This form of subdivision is suitable because it classifies commonly used insulating fluids that are offered by different manufacturers. In this section, threshold values are proposed for different aging markers in the different systems as well as liquids as presented in Table 4 and Table 5. According to IEC 60450, an insulating paper is considered "average" when the DP value falls below 650 (Table 4) and "aged" below 350 (Table 5); therefore, an assessment of threshold values concerning this variable is given below [74]. Reaching these limits is intended to provide information at which the DP value is likely to be significantly reduced. Since some paper samples had not yet reached the DP value of 350, the aging markers were considered according to the lowest DP value of the samples. Nevertheless, all paper samples with a DP value of approx. 400 are within the range of this end of life. These values, which are resulted from the tests, are thus used to assess the condition of the paper insulation. For a few parameters, a more precise subdivision was necessary for the inhibited Oil B and C, since no single value could be defined here. For this reason, two values are defined for individual parameters, with the upper value representing Oil B and the lower value representing Oil C. Although this is simulated aging under laboratory conditions, it was shown that the results can be transferred to real transformers [75,76].
Based on the tables below, it can be assumed that the more parameters match the transformer condition to be estimated, the higher is the probability of aged paper. For a better classification, time values are additionally given in the table, after which time the DP values of 650 and 350 are reached in this investigation. The time is given in brackets and assigned to the corresponding insulating liquid types.
Table 4 also explains how these limits are to be interpreted. It also determines whether the transformer should be examined when the value falls below or exceeds the limit. Ranges are also given which indicate healthy paper insulation as well as ranges which indicate aged paper insulation since no clear threshold value can be defined.
Thus, as an example in Table 4, it can be assumed that, for example, in the case of an uninhibited oil in a free-breathing transformer, when the acid value of 0.2 mgKOH/g is exceeded, the DP value of the paper can be assumed to be in the range of about 650 on average. The same also applies when the IFT falls below a value of 21 mN/m. Furthermore, with an inhibited oil in a closed system, for example, it can be assumed that a range of 650 DP is reached at a CO2 concentration in the liquid of 4000–8000 ppm. Concerning the synthetic ester in a hermetic transformer, the DP value of 650 can be assumed to be reached when the CO2/CO ratio exceeds or falls below the range 12–14. It cannot be assumed that all limits will be reached at the same time. Nevertheless, the assumption of reaching the DP value can be strengthened the more limit values are exceeded or fallen short of. The same principle applies to Table 5 and thus to an average DP value of 350 of the insulating paper.

4. Conclusions

In this study, the replication of liquid-paper insulation, as found mainly in power transformers, was performed. Therefore, the conditions in free-breathing transformers, as well as hermetic transformers, were simulated. The aging of the insulation was thermally accelerated over 15 weeks in order to simulate the lifetime of a transformer in a reasonable period of time. To simulate the different types of real transformers, inhibited oils were used in addition to an uninhibited mineral oil, which belongs to the newer generation of insulating oils. Moreover, the investigation was carried out with esters, which are increasingly being used in transformers, but knowledge of their aging in the transformer is not yet as profound as for mineral oils. Therefore, a synthetic ester, as well as two natural esters, were used in this investigation.
This study reveals that the assessment of aging markers in insulating liquids to evaluate the condition of a transformer and especially the indirect assessment of the paper insulation is depending on the type of sealing system, as well as on the insulating liquid. Thus, it was confirmed that in free-breathing transformers (open system) the influence of oxidation is more pronounced than in hermetic transformers (closed system). This also has the consequence that the relative change of oil parameters is stronger in open systems. Concerning the DP value, the change is not the same. Thus, for the same DP value, the values of acidity in a fluid can be different depending on the system (open or closed). Furthermore, it should be distinguished whether oil is inhibited or not. For example, variables such as viscosity, acid number or IFT showed stronger changes for the non-inhibited oil. For the inhibited oils, the change in the oil markers is less pronounced, whereas the DP value decreases faster in the open system for inhibited oils.
Furthermore, the closed system comparison also unfolded significant differences between esters and insulating oils. For example, the acid concentration is much higher for esters, but this has no negative effect on the aging rate. Similarly, some markers for esters are not suitable for evaluation, such as interfacial tension and viscosity under normal aging, since these quantities practically do not change over the aging time.
There are also stronger correlations among the aging variables in the open system compared to the closed system, thus more parameters are needed overall to assess the closed system. Likewise, a differentiation of the system is important especially for the evaluation of gases, such as the CO2/CO ratio. The ratio is markedly higher for esters compared to insulating oils, which has to be considered when using esters in transformers. From the correlations of the DP value with the aging markers, it can be concluded that some parameters such as the acid number, IFT or the ratio CO2/CO can be good indicators to achieve an indirect condition analysis of the paper insulation.
This comparative study of the different insulating fluids and systems of transformers offers the possibility for transformer operators to compare measured values of their assets with the values from this study. With these results, conclusions can be drawn independently, while the DP value should be determined more precisely, which the determined threshold values can be used for. For this purpose, parameters determined by means of correlation analysis can be used. Therefore, these results can be used to improve the condition assessment of transformers. They allow transformer operators to perform a more targeted analysis depending on the system as well as the insulation fluid, which overall increases the operational reliability of the high voltage network.
In addition, the results can also be used to estimate the performance of the various insulating fluids in service and what factors, such as oxidation, affect the electrical and dielectric properties of the insulating fluid. Likewise, the results serve for sound knowledge in the use of novel fluids in transformers such as synthetic and natural esters.
Future work will investigate other factors influencing the formation of aging markers. The influence of the liquid-paper weight ratio and the influence of different water concentrations in the liquid will be determined. Furthermore, the influence of different mixing ratios of mineral oil and ester can be investigated as well as investigations using Fourier transform infrared spectroscopy (FTIR) to investigate correlations with aging markers as well as to determine characteristic areas in the spectrum that allow a condition assessment of the paper insulation.

Supplementary Materials

The following are available online at https://www.mdpi.com/article/10.3390/en14113036/s1, Figure S1: Measuring device for determining the water content, the detail of titration cell, weighing of the insulating liquid sample and a measurement curve., Figure S1: Measuring device for determining the water content, the detail of titration cell, weighing of the insulating liquid sample and a measurement curve., Figure S2: 50 mL glass syringe with a connected PTFE hose via a two-way valve., Figure S3: DGA system for the detection of dissolved gases in the insulating liquid., Figure S4: Device for determining the dissipation factor tan δ and relative permittivity εr., Figure S5: Device for determining the breakdown voltage UD of the insulating liquid., Figure S6: Device for determining the interfacial tension σ of the insulating liquid., Figure S7: Device for determining the acid value of the insulating liquid., Figure S8: Rotational viscometer for determining the dynamic viscosity η of the insulating fluid., Figure S9: Pearson correlation coefficients r for the open system with Oil A, B and C., Figure S10: Pearson correlation coefficients r for the closed system with Oil A, B and C., Figure S11: Pearson correlation coefficients r for the closed system with Ester A, B and C., Table S1: Optical appearance of the insulating materials during thermally accelerated aging for 15 weeks at 130 °C. In the Supplementary Materials section, information about the measuring devices, as well as the optical change of the insulating material, is presented. Furthermore, the correlation of the aging markers for the different systems and fluids is presented in figures. Source [77,78,79,80,81,82,83,84,85,86].

Author Contributions

Conceptualization, K.H.; Investigation, T.M.; Methodology, T.M.; Project administration, P.W. and K.H.; Supervision, P.W.; Validation, K.H. and J.P.; Writing—original draft, T.M.; Writing—review & editing, P.W. and J.P. The authors contributed collectively to the experiment setup, testing and measurement, data analysis and manuscript preparation. All authors have read and agreed to the published version of the manuscript.

Funding

Research funded by Zentrale Innovationsprogramm Mittelstand (ZIM) des Bundesministeriums für Wirtschaft und Energie (BMWi) (ZF4039201LT5).

Institutional Review Board Statement

Not applicable.

Informed Consent Statement

Not applicable.

Acknowledgments

The authors would like to express their gratitude to AiF/ZIM for the financial support as well as Weidmann Electrical Technology AG for the support with insulation materials and Analysen Service GmbH for the paper analyses.

Conflicts of Interest

The authors declare no conflict of interest.

References

  1. Ageing of Liquid Impregnated Cellulose for Power Transformers: Study Committee: D1, WG (TF): WG D1.53; Cigré: Paris, France, 2018.
  2. Okabe, S.; Ueta, G. Partial discharge criterion in AC test of oil-immersed transformer and gas-filled transformer in terms of harmful partial discharge level and signal transmission rate. IEEE Trans. Dielectr. Electr. Insul. 2012, 19, 1431–1439. [Google Scholar] [CrossRef]
  3. Wang, Y.; Chang, D.; Fan, Y.; Zhang, G.; Zhan, J.; Shao, X.; He, W. Acoustic localization of partial discharge sources in power transformers using a particle-swarm-optimization-route-searching algorithm. IEEE Trans. Dielectr. Electr. Insul. 2017, 24, 3647–3656. [Google Scholar] [CrossRef]
  4. Jaroszewski, M.; Rakowiecki, K. Partial discharge inception voltage in transformer natural ester liquid—Effect of the measurement method in the presence of moisture. IEEE Trans. Dielectr. Electr. Insul. 2017, 24, 2477–2482. [Google Scholar] [CrossRef]
  5. Garcia, B.; Burgos, J.C.; Alonso, A.M. Transformer Tank Vibration Modeling as a Method of Detecting Winding Deformations—Part II: Experimental Verification. IEEE Trans. Power Deliv. 2006, 21, 164–169. [Google Scholar] [CrossRef]
  6. Bagheri, M.; Zollanvari, A.; Nezhivenko, S. Transformer Fault Condition Prognosis Using Vibration Signals over Cloud Environment. IEEE Access 2018, 6, 9862–9874. [Google Scholar] [CrossRef]
  7. Nurmanova, V.; Bagheri, M.; Zollanvari, A.; Aliakhmet, K.; Akhmetov, Y.; Gharehpetian, G.B. A New Transformer FRA Measurement Technique to Reach Smart Interpretation for Inter-Disk Faults. IEEE Trans. Power Deliv. 2019, 34, 1508–1519. [Google Scholar] [CrossRef]
  8. Hashemnia, N.; Abu-Siada, A.; Islam, S. Improved power transformer winding fault detection using FRA diagnostics–part 1: Axial displacement simulation. IEEE Trans. Dielectr. Electr. Insul. 2015, 22, 556–563. [Google Scholar] [CrossRef]
  9. Tenbohlen, S.; Jagers, J.; Bastos, G.; Desai, B.; Diggin, B.; Fuhr, J.; Gebauer, J.; Krueger, M.; Lapworth, J.; Mański, P.; et al. Development and Results of a Worldwide Transformer Reliability Survey. In Proceedings of the CIGRE SC A2 Colloquium, Shanghai, China, 20–25 September 2015. [Google Scholar]
  10. Li, S.; Ge, Z.; Abu-Siada, A.; Yang, L.; Li, S.; Wakimoto, K. A New Technique to Estimate the Degree of Polymerization of Insulation Paper Using Multiple Aging Parameters of Transformer Oil. IEEE Access 2019, 7, 157471–157479. [Google Scholar] [CrossRef]
  11. Emsley, A.M.; Ali, M.; Xiao, X.; Heywood, R.J. Degradation of cellulosic insulation in power transformers. Part 4: Effects of ageing on the tensile strength of paper. IEEE Proc. Sci. Meas. Technol. 2000, 147, 285–290. [Google Scholar] [CrossRef]
  12. Lundgaard, L.E.; Linhjell, D. Ageing and Restoration of Transformer Windings; SINTEF Energy Research: Trondheim, Norway, 2001; EBL-K EBL-K-43-2001. [Google Scholar]
  13. Liland, K.; Kes, M.; Glomm Ese, M.-H.; Lundgaard, L.; Christensen, B. Study of oxidation and hydrolysis of oil impregnated paper insulation for transformers using a microcalorimeter. IEEE Trans. Dielectr. Electr. Insul. 2011, 18, 2059–2068. [Google Scholar] [CrossRef]
  14. Vasovic, V.; Lukic, J.; Mihajlovic, D.; Pejovic, B.; Radakovic, Z.; Radoman, U.; Orlovic, A. Aging of transformer insulation—experimental transformers and laboratory models with different moisture contents: Part I—DP and furans aging profiles. IEEE Trans. Dielectr. Electr. Insul. 2019, 26, 1840–1846. [Google Scholar] [CrossRef]
  15. El-Aal, R.A.A.; Helal, K.; Hassan, A.M.M.; Dessouky, S.S. Prediction of Transformers Conditions and Lifetime Using Furan Compounds Analysis. IEEE Access 2019, 7, 102264–102273. [Google Scholar] [CrossRef]
  16. Leibfried, T.; Jaya, M.; Majer, N.; Schafer, M.; Stach, M.; Voss, S. Postmortem Investigation of Power Transformers—Profile of Degree of Polymerization and Correlation with Furan Concentration in the Oil. IEEE Trans. Power Deliv. 2013, 28, 886–893. [Google Scholar] [CrossRef]
  17. Feng, D.; Yang, L.; Zhou, L.; Liao, R. Influential Factors and Correction Method of Furfural Content in Transformer Oil. IEEE Access 2019, 7, 53487–53495. [Google Scholar] [CrossRef]
  18. Feng, D.; Yang, L.; Zhou, L.; Liao, R.; Chen, X. Effect of oil–paper–pressboard mass ratio on furfural content in transformer oil. IEEE Trans. Dielectr. Electr. Insul. 2019, 26, 1308–1315. [Google Scholar] [CrossRef]
  19. Fernandez, O.H.A.; Fofana, I.; Jalbert, J.; Gagnon, S.; Rodriguez-Celis, E.; Duchesne, S.; Ryadi, M. Aging characterization of electrical insulation papers impregnated with synthetic ester and mineral oil: Correlations between mechanical properties, depolymerization and some chemical markers. IEEE Trans. Dielectr. Electr. Insul. 2018, 25, 217–227. [Google Scholar] [CrossRef]
  20. Lundgaard, L.E.; Hansen, W.; Linhjell, D.; Painter, T.J. Aging of Oil-Impregnated Paper in Power Transformers. IEEE Trans. Power Deliv. 2004, 19, 230–239. [Google Scholar] [CrossRef]
  21. Emsley, A.M. The kinetics and mechanisms of degradation of cellulosic insulation in power transformers. Polym. Degrad. Stab. 1994, 44, 343–349. [Google Scholar] [CrossRef]
  22. Lessard, M.C.; van Nifterik, L.; Masse, M.; Penneau, J.F.; Grob, R. Thermal aging study of insulating papers used in power transformers. In Proceedings of the Conference on Electrical Insulation and Dielectric Phenomena-CEIDP ‘96, Millbrae, CA, USA, 23 October 1996; Volume 2, pp. 854–859. [Google Scholar]
  23. Tokunaga, J.; Koide, H.; Mogami, K.; Hikosaka, T. Comparative studies on the aging of thermally upgraded paper insulation in palm fatty acid ester, mineral oil, and natural ester. IEEE Trans. Dielectr. Electr. Insul. 2016, 23, 258–265. [Google Scholar] [CrossRef]
  24. Trnka, P.; Hornak, J.; Prosr, P.; Michal, O.; Wang, F. Various Aging Processes in a Paper-Natural Ester Insulation System in the Presence of Copper and Moisture. IEEE Access 2020, 8, 61989–61998. [Google Scholar] [CrossRef]
  25. R&S International Holding AG. The 1000th Power Transformer. Available online: https://the-rsgroup.com/the-1000th-power-transformer/ (accessed on 4 May 2021).
  26. Boerstn Electric Co. Ltd. Hermetically Sealed Three Phase Oil Immersed Power Transformer. Available online: http://www.boerstn.com/hermetically-sealed-3-phase-oil-immersed-power-transformer-15913446741093711.html (accessed on 4 May 2021).
  27. Tenbohlen, S.; Koch, M. Aging Performance and Moisture Solubility of Vegetable Oils for Power Transformers. IEEE Trans. Power Deliv. 2010, 25, 825–830. [Google Scholar] [CrossRef]
  28. Muenster, T.; Kinkeldey, T.; Werle, P.; Haemel, K.; Preusel, J. Investigation on the Accelerated Ageing Behaviour of Oil-Paper-Insulation Using Different Insulating Oils. In Proceedings of the VDE High Voltage Technology 2018, ETG-Symposium, Berlin, Germany, 12–14 November 2018; pp. 1–6. [Google Scholar]
  29. Münster, T.; Kinkeldey, T.; Werle, P.; Hämel, K.; Preusel, J. Investigation on Ageing Parameters of a Thermally Accelerated Aged Paper-Oil-Insulation in a Hermetically Sealed System. In Proceedings of the 2018 Condition Monitoring and Diagnosis (CMD), Bentley, Australia, 23–26 September 2018; pp. 1–6. [Google Scholar]
  30. Münster, T.; Kinkeldey, T.; Werle, P.; Hämel, K.; Preusel, J. Comparison of a Thermally Accelerated Aged Oil-Paper Insulation of an Open and Hermetically Sealed System. In Proceedings of the 21st International Symposium on High Voltage Engineering; Németh, B., Ed.; Springer: Berlin/Heidelberg, Germany, 2020; Volume 1, pp. 777–787. ISBN 978-3-030-31675-4. [Google Scholar]
  31. Münster, T.; Kinkeldey, T.; Werle, P.; Hämel, K.; Preusel, J. Investigation on the Ageing Behaviour of Ester Impregnated Insulating Paper in a Hermetically Sealed System. In Proceedings of the 2019 IEEE Conference on Electrical Insulation and Dielectric Phenomena (CEIDP), Washington, DC, USA, 20–23 October 2019; pp. 134–137, ISBN ISBN 2576-2397. [Google Scholar]
  32. Deutsche Institut für Normung e.V. Electrical Insulation Systems (EIS)-Thermal Evaluation of Combined Liquid and Solid Components-Part 2: Simplified Test; Beuth GmbH: Berlin, Germany, 2014; 62332-2:2014-12; Available online: https://www.beuth.de/de/vornorm/din-iec-ts-62332-2/222906506 (accessed on 16 February 2021).
  33. Brinkmann, C. Die Isolierstoffe der Elektrotechnik; Springer: Berlin/Heidelberg, Germany, 1975; ISBN 9783642809224. [Google Scholar]
  34. Deutsches Institut für Normung e.V. Method of Sampling Insulating Liquids (IEC 60475:2011); German Version EN 60475:2011; Beuth GmbH: Berlin, Germany, 2012; EN 60475:2012-07; Available online: https://www.beuth.de/de/norm/din-en-60475/152891057 (accessed on 16 February 2021).
  35. Küchler, A. Hochspannungstechnik: Grundlagen, Technologie, Anwendungen, 3rd ed.; Springer: Berlin/Heidelberg, Germany, 2009; ISBN 3540784128. [Google Scholar]
  36. Ese, M.; Liland, K.; Lundgaard, L. Oxidation of paper insulation in transformers. IEEE Trans. Dielectr. Electr. Insul. 2010, 17, 939–946. [Google Scholar] [CrossRef]
  37. Lelekakis, N.; Martin, D.; Wijaya, J. Ageing rate of paper insulation used in power transformers Part 1: Oil/paper system with low oxygen concentration. IEEE Trans. Dielectr. Electr. Insul. 2012, 19, 1999–2008. [Google Scholar] [CrossRef]
  38. Oxidation Stability of Insulating Fluids: TECHNICAL BROCHURES; Study Committee: D1, WG D1.30; Cigré: Paris, France, 2013.
  39. Du, Y.; Mamishev, A.V.; Lesieutre, B.C.; Zahn, M.; Kang, S.H. Moisture solubility for differently conditioned transformer oils. IEEE Trans. Dielect. Electr. Insul. 2001, 8, 805–811. [Google Scholar] [CrossRef]
  40. Hao, J.; Liao, R.; Chen, G.; Ma, Z.; Yang, L. Quantitative analysis ageing status of natural ester-paper insulation and mineral oil-paper insulation by polarization/depolarization current. IEEE Trans. Dielectr. Electr. Insul. 2012, 19, 188–199. [Google Scholar] [CrossRef] [Green Version]
  41. Matharage, S.Y.; Liu, Q.; Wang, Z.D.; Wilson, G.; Krause, C. Aging assessment of synthetic ester impregnated thermally non-upgraded kraft paper through chemical markers in oil. IEEE Trans. Dielectr. Electr. Insul. 2018, 25, 507–515. [Google Scholar] [CrossRef]
  42. Frimpong, G.; Oommen, T.; Asano, R. A survey of aging characteristics of cellulose insulation in natural ester and mineral oil. IEEE Electr. Insul. Mag. 2011, 27, 36–48. [Google Scholar] [CrossRef]
  43. Kachler, A.J.; Hohlein, I. Aging of cellulose at transformer service temperatures. Part 1: Influence of type of oil and air on the degree of polymerization of pressboard, dissolved gases, and furanic compounds in oil. IEEE Electr. Insul. Mag. 2005, 21, 15–21. [Google Scholar] [CrossRef]
  44. Mandlik, M.; Ramu, T.S. Moisture Aided Degradation of Oil Impregnated Paper Insulation in Power Transformers. IEEE Trans. Dielectr. Electr. Insul. 2014, 21, 186–193. [Google Scholar] [CrossRef]
  45. Life Management Techniques for Power Transformers: Technical Brochures; Study Committee: A2, WG A2.18; Cigré: Paris, France, 2013.
  46. Teymouri, A.; Vahidi, B. CO2/CO concentration ratio: A complementary method for determining the degree of polymerization of power transformer paper insulation. IEEE Electr. Insul. Mag. 2017, 33, 24–30. [Google Scholar] [CrossRef]
  47. Deutsche Institut für Normung e.V. Mineral Oil-Filled Electrical Equipment in Service-Guidance on the Interpretation of Dissolved and Free Gases Analysis; Beuth GmbH: Berlin, Germany, 2016; EN 60599:2016-10; Available online: https://www.beuth.de/de/norm/din-en-60599/253359747 (accessed on 16 February 2021).
  48. Recent Developments on the Interpretation of Dissolved Gas Analysis in Transformers: Study Committee: A2, D1, JTF D1.02/A2.11; Cigré: Paris, France, 2006.
  49. Liao, R.; Guo, C.; Wang, K.; Yang, L.; Grzybowski, S.; Sun, H. Investigation on thermal aging characteristics of vegetable oil-paper insulation with flowing dry air. IEEE Trans. Dielectr. Electr. Insul. 2013, 20, 1649–1658. [Google Scholar] [CrossRef]
  50. Li, J.; Zhang, Z.; Grzybowski, S.; Liu, Y. Characteristics of moisture diffusion in vegetable oil-paper insulation. IEEE Trans. Dielectr. Electr. Insul. 2012, 19, 1650–1656. [Google Scholar] [CrossRef]
  51. Ten, C.F.; Fernando, M.A.R.M.; Wang, Z.D. Dielectric properties measurements of transformer oil, paper and pressboard with the effect of moisture and ageing. In Proceedings of the 2007 Annual Report-Conference on Electrical Insulation and Dielectric Phenomena, Vancouver, BC, Canada, 14–17 October 2007; pp. 727–730, ISBN 0084-9162. [Google Scholar]
  52. Darma, I.S. Dielectric properties of mixtures between mineral oil and natural ester. In Proceedings of the 2008 International Symposium on Electrical Insulating Materials (ISEIM 2008), Yokkaichi, Japan, 7–11 September 2008; pp. 514–517. [Google Scholar]
  53. Deutsche Institut für Normung e.V. Insulating Liquids-Determination of the Breakdown Voltage at Power Frequency-Test Method; Beuth GmbH: Berlin, Germany, 2017; EN 60156:2017-05; Available online: https://www.beuth.de/de/norm-entwurf/din-en-60156/271035585 (accessed on 16 February 2021).
  54. Shim, M. Comparative evaluation of aging of insulating, material in natural ester and mineral oil. In Proceedings of the 2010 International Conference on High Voltage Engineering and Application, New Orleans, LA, USA, 11–14 October 2010; pp. 393–396. [Google Scholar]
  55. Koch, M.; Tenbohlen, S.; Stirl, T. Diagnostic Application of Moisture Equilibrium for Power Transformers. IEEE Trans. Power Deliv. 2010, 25, 2574–2581. [Google Scholar] [CrossRef]
  56. ASTM International. Standard Test Method for Interfacial Tension of Insulating Liquids against Water by the Ring Method (D971-20). Available online: https://www.astm.org/Standards/D971.htm (accessed on 16 February 2021).
  57. Hadjadj, Y.; Fofana, I.; Sabau, J.; Briosso, E. Assessing insulating oil degradation by means of turbidity and UV/VIS spectrophotometry measurements. IEEE Trans. Dielectr. Electr. Insul. 2015, 22, 2653–2660. [Google Scholar] [CrossRef]
  58. Forouhari, S.; Abu-Siada, A. Remnant life estimation of power transformer based on IFT and acidity number of transformer oil. In Proceedings of the 2015 IEEE 11th International Conference on the Properties and Applications of Dielectric Materials (ICPADM), Sydney, Australia, 19–22 July 2015; pp. 552–555, ISBN 2160-9241. [Google Scholar]
  59. Deutsche Institut für Normung e.V. Insulating Liquids-Determination of acidity-Part 1: Automatic potentiometric titration; Beuth GmbH: Berlin, Germany, 2004; EN 62021-1:2004-06; Available online: https://www.beuth.de/de/norm/din-en-62021-1/71333782 (accessed on 16 February 2021).
  60. Deutsche Institut für Normung e.V. Insulating Liquids-Determination of Acidity-Part 3: Test Methods for Non Mineral Insulating Oils; Beuth GmbH: Berlin, Germany, 2015; EN 62021-3:2015-05; Available online: https://www.beuth.de/de/norm/din-en-62021-3/228589835 (accessed on 16 February 2021).
  61. Kouassi, K.; Fofana, I.; Cissé, L.; Hadjadj, Y.; Yapi, K.; Diby, K. Impact of Low Molecular Weight Acids on Oil Impregnated Paper Insulation Degradation. Energies 2018, 11, 1465. [Google Scholar] [CrossRef] [Green Version]
  62. Lundgaard, L.; Hansen, W.; Ingebrigtsen, S. Ageing of Mineral Oil Impregnated Cellulose by Acid Catalysis. IEEE Trans. Dielectr. Electr. Insul. 2008, 15, 540–546. [Google Scholar] [CrossRef]
  63. Azis, N.; Liu, Q.; Wang, Z.D. Ageing assessment of transformer paper insulation through post mortem analysis. IEEE Trans. Dielectr. Electr. Insul. 2014, 21, 845–853. [Google Scholar] [CrossRef]
  64. Yao, W.; Li, J.; Huang, Z.; Li, X.; Xiang, C. Acids generated and influence on electrical lifetime of natural ester impregnated paper insulation. IEEE Trans. Dielectr. Electr. Insul. 2018, 25, 1904–1914. [Google Scholar] [CrossRef]
  65. Singha, S.; Asano, R.; Frimpong, G.; Claiborne, C.C.; Cherry, D. Comparative aging characteristics between a high oleic natural ester dielectric liquid and mineral oil. IEEE Trans. Dielectr. Electr. Insul. 2014, 21, 149–158. [Google Scholar] [CrossRef]
  66. Deutsche Institut für Normung e.V. Mineralölerzeugnisse-Durchsichtige und undurchsichtige Flüssigkeiten-Bestimmung der kinematischen Viskosität und Berechnung der dynamischen Viskosität; Beuth GmbH: Berlin, Germany, 2021; EN ISO 3104:2021-01; Available online: https://www.beuth.de/de/norm/din-en-iso-3104/323356210 (accessed on 16 February 2021).
  67. Wilhelm, H.; Tulio, L.; Jasinski, R.; Almeida, G. Aging markers for in-service natural ester-based insulating fluids. IEEE Trans. Dielectr. Electr. Insul. 2011, 18, 714–719. [Google Scholar] [CrossRef]
  68. Deutsche Institut für Normung e.V. Detection and Determination of Specified Additives in Mineral Insulating Oils; Beuth GmbH: Berlin, Germany, 2011; EN 60666:2011-03; Available online: https://www.beuth.de/de/norm/din-en-60666/137571780 (accessed on 16 February 2021).
  69. Mehanna, N.A.; Jaber, A.; Oweimreen, G.A.; Abulkibash, A.M. Assessment of dibenzyl disulfide and other oxidation inhibitors in transformer mineral oils. IEEE Trans. Dielect. Electr. Insul. 2014, 21, 1095–1099. [Google Scholar] [CrossRef]
  70. Wada, J.; Ueta, G.; Okabe, S.; Amimoto, T. Inhibition technique of transformer insulating oil degradation-evaluation of the effectiveness of oxidation degradation inhibitors. IEEE Trans. Dielect. Electr. Insul. 2013, 20, 1641–1648. [Google Scholar] [CrossRef]
  71. Zou, K.H.; Tuncali, K.; Silverman, S.G. Correlation and simple linear regression. Radiology 2003, 227, 617–622. [Google Scholar] [CrossRef] [PubMed]
  72. Kinkeldey, T.; Muenster, T.; Werle, P.; Nasution, E.F.; Suwarno, S.; Haemel, K.; Preusel, J. Estimation of the Degree of Polymerization (DP) of Oil-Paper Insulated Transformers Using a Novel Fuzzy Logic Algorithm. In Proceedings of the VDE High Voltage Technology 2018, ETG-Symposium, Berlin, Germany, 12–14 November 2018; pp. 1–6. [Google Scholar]
  73. Kinkeldey, T.; Münster, T.; Werle, P.; Hämel, K.; Preusel, J. Estimation of the Ageing Condition of Oil-Filled Transformers Based on the Oil Parameters Using a Novel Fuzzy Logic Algorithm. In Proceedings of the 21st International Symposium on High Voltage Engineering; Németh, B., Ed.; Springer: Cham, Germany, 2020; Volume 1, pp. 926–936. ISBN 978-3-030-31676-1. [Google Scholar]
  74. Deutsche Institut für Normung e.V. Measurement of the Average Viscometric Degree of Polymerization of New and Aged Cellulosic Electrically Insulating Materials; Beuth GmbH: Berlin, Germany, 2008; EN 60450:2008-03; Available online: https://www.beuth.de/de/norm/din-en-60450/104350320 (accessed on 16 February 2021).
  75. Schreiter, S.; Kinkeldey, T.; Lohmeyer, H.; Werle, P.; Münster, T.; Hämel, K.; Preusel, J. Anwendung eines Fuzzy-Logik-Algorithmus für die Lebensdauerabschätzung von Transformatoren im Betrieb: VDE Hochspannungstechnik, ETG-Fachtagung, 9–11 November 2020, Online-Veranstaltung; VDE GmbH: Berlin, Germany, 2020; ISBN 9783800753536. [Google Scholar]
  76. Kinkeldey, T.; Schreiter, S.; Lohmeyer, H.; Werle, P.; Münster, T.; Hämel, K.; Preusel, J. Furankonzentrationen vs. Fuzzy-Logik: Ein neuer Vorschlag zu Abschätzung des DP-Wertes von Leistungstransformatoren: VDE Hochspannungstechnik, ETG-Fachtagung, 9–11. November 2020, Online-Veranstaltung; VDE GmbH: Berlin, Germany, 2020; ISBN 9783800753536. [Google Scholar]
  77. SI Analytics GmbH. GEBRAUCHSANLEITUNG Originalversion OPERATING MANUAL: TitroLine® 7500 KF trace TITRATOR. Available online: https://www.xylemanalytics.com/de/File%20Library/Resource%20Library/SIA/01%20Manuals/INT/TL-7500KF_Operating%20Instructions_1.7-MB_German-English-PDF.pdf (accessed on 2 May 2021).
  78. Deutsche Institut für Normung e.V. Petroleum Products-Determination of Water Content Using Titration According to Karl Fischer; Beuth GmbH: Berlin, Germany, 2020; 51777:2020-04; Available online: https://www.beuth.de/de/norm/din-51777/315541277 (accessed on 2 May 2021).
  79. Energy Support GmbH. Bedienungsanleitung TOGA GC, Gaschromatograph für Gas-in-Öl-Analysen; Energy Support GmbH: Neuss, Germany, 2007. [Google Scholar]
  80. Deutsche Institut für Normung e.V. Insulating Liquids-Measurement of Relative Permittivity, Dielectric Dissipation Factor (tan δ) and d.c. Resistivity; Beuth GmbH: Berlin, Germany, 2005; EN 60247:2005-01; Available online: https://www.beuth.de/de/norm/din-en-60247/75943339 (accessed on 2 May 2021).
  81. BAUR GmbH. DTL C: BAUR Verlustfaktor- und Widerstandsmessgerät für Isolieröle. Available online: https://baur.at/XooWebKit/bin/download.php/cf3a7_d6a960c48d/DS_Oil%20tan%20delta%20resistivity%20tester_DTL%20C_BAUR_de-de.pdf (accessed on 2 May 2021).
  82. b2 electronic GmbH. BA100: Portable and Laboratory Based Oil Test Set. User Manual. Available online: http://www.b2hv.cn/wp-content/themes/b2hv_new/fileadmin/images_page/img_right/downloads/Datasheet-b2-BA100-DHV1207-Rev03.pdf (accessed on 2 May 2021).
  83. Biolin Scientific. Force Tensiometers: The Complete Range Of Du Noüy Ring and Wilhelmy Plate Tensiometers. Available online: https://www.strath.ac.uk/media/departments/mechanicalengineering/compositematerials/officedocuments/Sigma_force_701.pdf (accessed on 2 May 2021).
  84. SI Analytics GmbH. Gebrauchsanleitung Originalversion: TitroLine® 6000/7000 TITRATOR. Available online: https://www.xylemanalytics.com/en/File%20Library/Resource%20Library/SIA/01%20Manuals/GER/TitroLine-6000_7000_Deutsch.pdf (accessed on 2 May 2021).
  85. D02 Committee. Test Method for Low-Temperature Viscosity of Automatic Transmission Fluids, Hydraulic Fluids, and Lubricants Using a Rotational Viscometer; ASTM International: West Conshohocken, PA, USA, 2017. [Google Scholar]
  86. Brookfield Engineering Laboratories, INC. Brookfield DV2T Viscometer: Operating Instructions. Manual No. M13-167-B0614. Available online: https://www.brookfieldengineering.com/-/media/ametekbrookfield/manuals/lab%20viscometers/dv2t%20instructions.pdf?la=en (accessed on 2 May 2021).
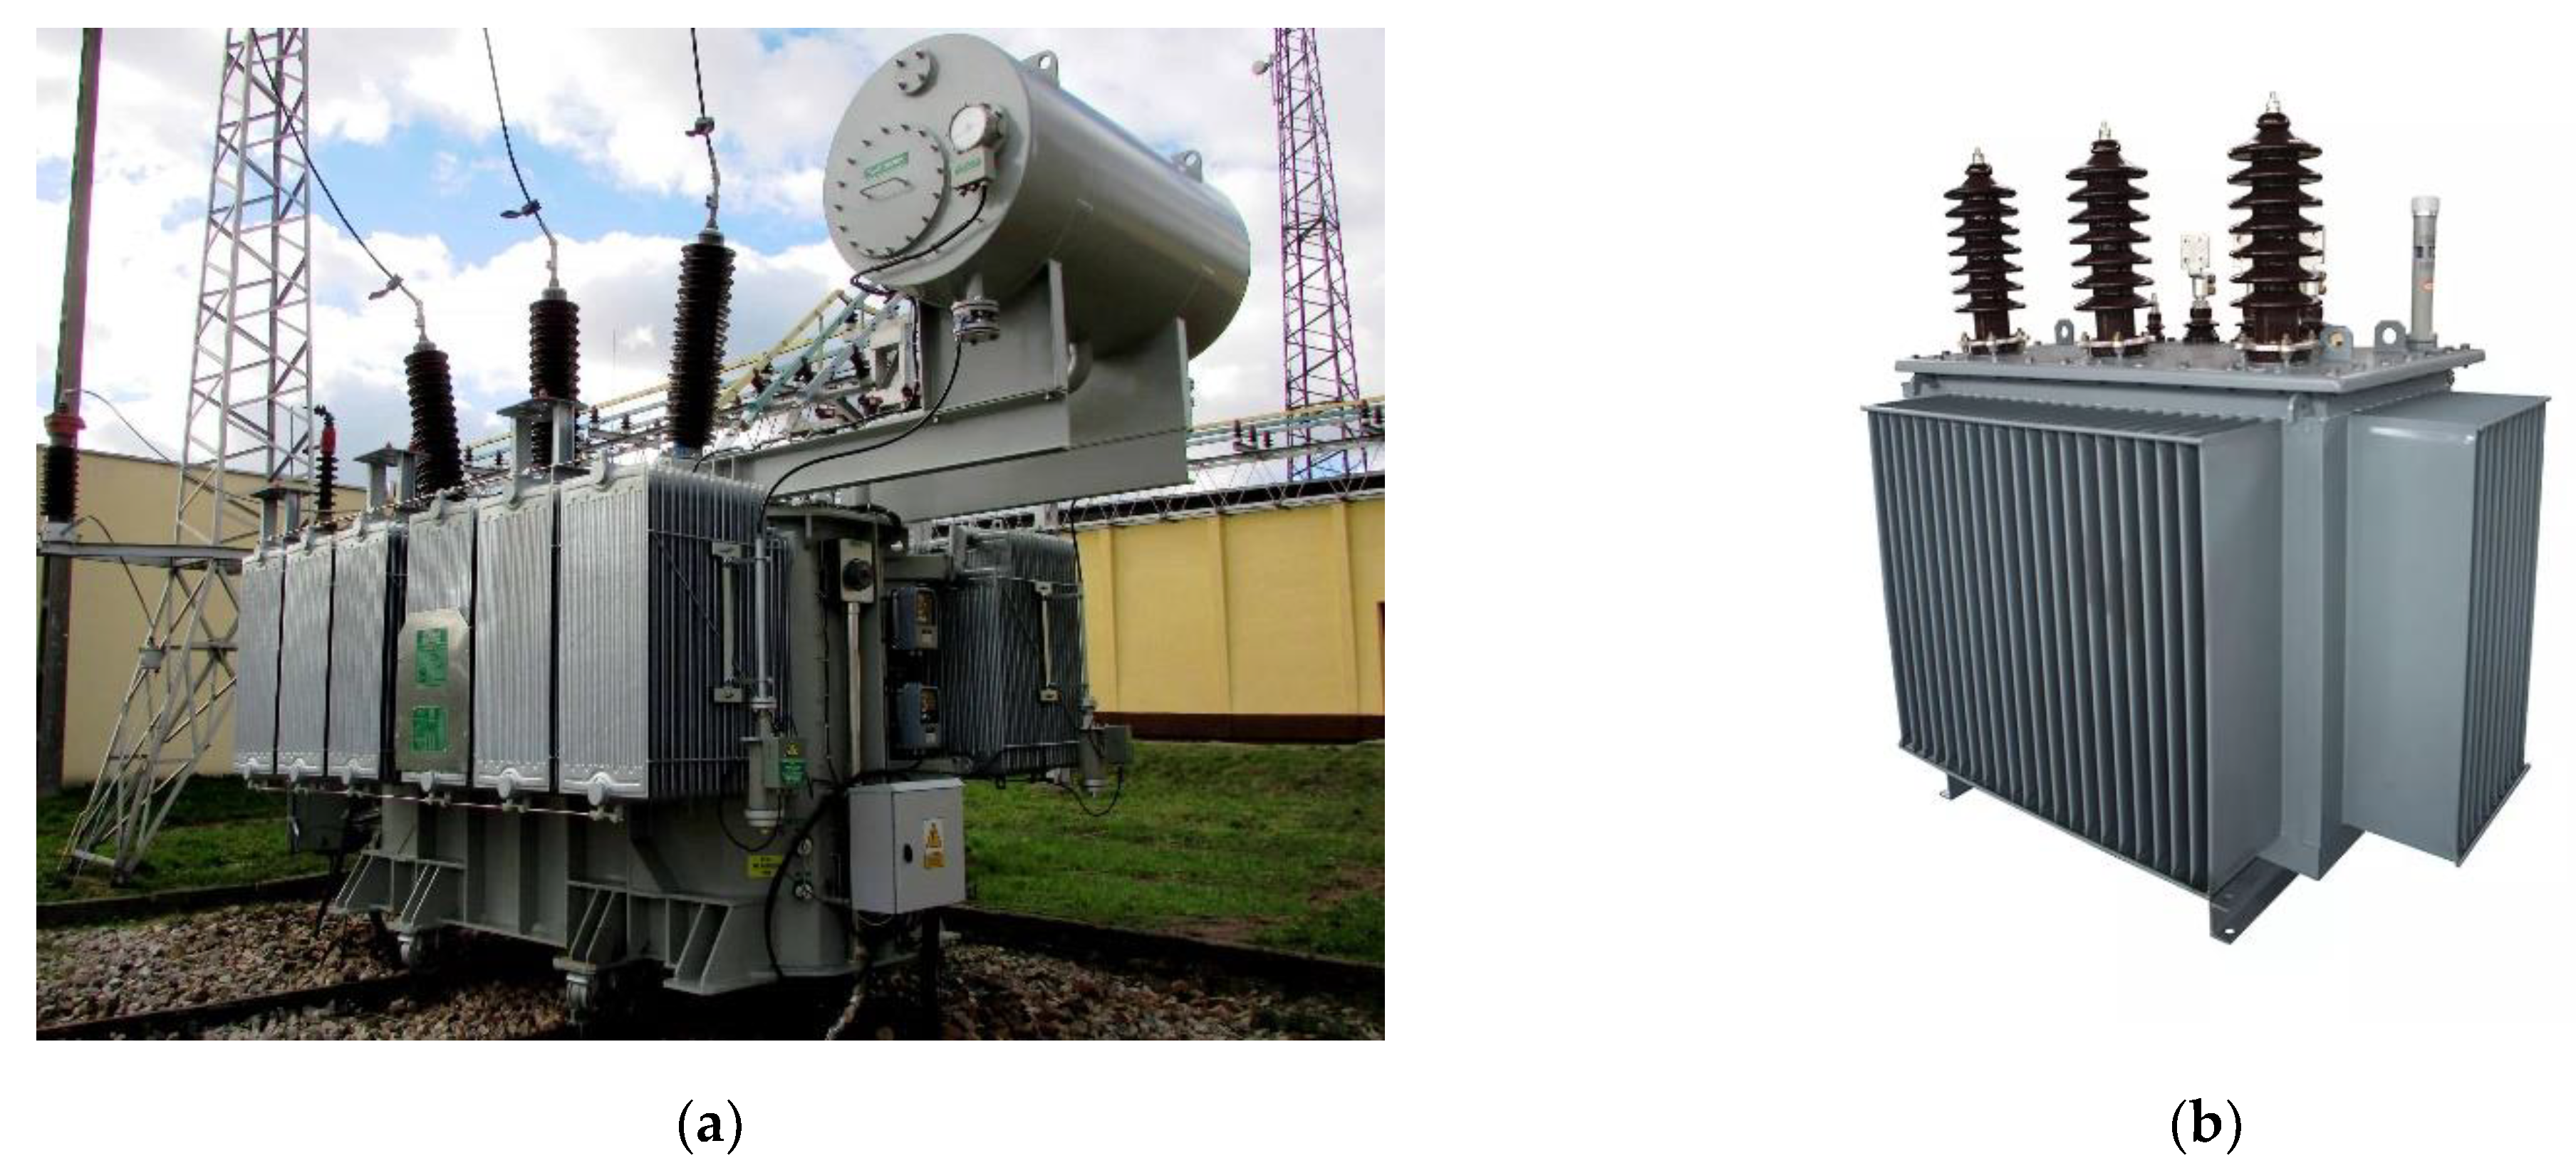
Figure 1. Application of liquid-paper insulations in power transformers: (a) Free breathing power transformer [25]; (b) Hermetic transformer [26].
Energies 14 03036 g001
Figure 2. Block diagram illustrating the study as well as the intended condition assessment of the paper insulation.
Energies 14 03036 g002
Figure 3. Thermally accelerated aging process of oil-paper insulation in a convection oven with Erlenmeyer flasks: (a) Open system; (b) Closed system.
Energies 14 03036 g003
Figure 4. Change in DP value as a function of aging time: (a) Absolute change in DP value; (b) Percentage change in DP value.
Energies 14 03036 g004
Figure 5. Rate of depolymerization in 1/DP over the aging time for different systems and liquids.
Energies 14 03036 g005
Figure 6. Change of water content in insulating liquids for different sealing systems: (a) Change over the aging time; (b) Change over the DP value; the legends refer to Figure 6a.
Energies 14 03036 g006
Figure 7. Change of CO concentration for different sealing systems and fluids: (a) Change over the aging time; (b) Change over the DP value; the legends refer to Figure 6a.
Energies 14 03036 g007
Figure 8. Change of CO2 concentration for different sealing systems and fluids: (a) Change over the aging time; (b) Change over the DP value; the legends refer to Figure 6a.
Energies 14 03036 g008
Figure 9. Change of CO2/CO ratio for the different sealing systems and fluids: (a) Change over the aging time; (b) Change over the DP value; the legends refer to Figure 6a.
Energies 14 03036 g009
Figure 10. Change of dissipation factor tan δ at 25 °C for different sealing systems and fluids: (a) Change over the aging time; (b) Change over the DP value; the legends refer to Figure 6a.
Energies 14 03036 g010
Figure 11. Change of relative permittivity εr at 25 °C for different sealing systems and fluids: (a) Change over the aging time; (b) Change over the DP value; the legends refer to Figure 6a.
Energies 14 03036 g011
Figure 12. Change of breakdown voltage UD at room temperature for different sealing systems and fluids: (a) Change over the aging time; (b) Change over the DP value; the legends refer to Figure 6a.
Energies 14 03036 g012
Figure 13. Change of interfacial tension σ (IFT) for different sealing systems and fluids: (a) Change over the aging time; (b) Change over the DP value; the legends refer to Figure 6a.
Energies 14 03036 g013
Figure 14. Change of acid value for different sealing systems and fluids: (a) Change over the aging time; (b) Change over the DP value; the legends refer to Figure 6a.
Energies 14 03036 g014
Figure 15. Change of dynamic viscosity η at 10 °C for different sealing systems and fluids: (a) Change over the aging time; (b) Change over the DP value; the legends refer to Figure 6a.
Energies 14 03036 g015
Figure 16. Change in inhibitor content for Oil C as a function of sealing system (open and closed) over aging time t.
Energies 14 03036 g016
Figure 17. Comparison of the systems for a Pearson correlation coefficient |r| ≥ 0.8: (a) Comparison of the oils in the open and closed system; (b) Comparison of the oils and esters in the closed system.
Energies 14 03036 g017
Table 1. Sampling times in weeks and hours.
Sample Number
(per Oil and System)
Aging Time (Weeks)Aging Time (Hours)
100
21168
32336
43504
54672
661008
781344
8101680
9122016
10152520
Table 2. Studied aging markers and related measurement devices and standards.
Aging MarkerMeasuring Device/LaboratoryStandard
Degree of polymerization (DP value)Analysen Service GmbH Umwelt- und Öllabor LeipzigIEC 60450
Moisture wabsTitroLine 7500 KF (SI Analytics GmbH)DIN 51777
CO and CO2 (DGA)TOGA GC (Energy Support GmbH)IEC 60475/IEC 60599
Dissipation factor tan δBAUR DTL C (BAUR GmbH)IEC 60247
Relative permittivity εrBAUR DTL C (BAUR GmbH)IEC 60247
Breakdown voltage UDBreakdown Analyzer BA100 (b2 electronics GmbH)IEC 60156
Interfacial tension σSigma 702ET (Biolin Scientific Ab)ASTM D971
AcidityTitroLine 7000 (SI Analytics GmbH)IEC 62021-1/IEC 62021-3
Dynamic viscosity ηBrookfield DV2Textra (AMETEK Brookfield)ASTM D2983
Inhibitor contentAnalysen Service GmbH Umwelt- und Öllabor LeipzigIEC 60666
Table 3. Classification of the correlation coefficient r according to Pearson [71].
Correlation CoefficientDescription
|r| < 0.2Very weak correlation
0.2 ≤ |r| < 0.5Weak correlation
0.5 ≤ |r| < 0.8Mean correlation
0.8 ≤ |r| < 1.0Strong correlation
Table 4. Definition of threshold values for different transformers and liquids for 650 DP (In case of two threshold values per parameter, the upper value stands for Oil B and the lower for Oil C).
ParameterUnitUninhibited OilInhibited OilSynthetic EsterNatural Ester
Open
(≈700 h)
Closed
(≈700 h)
Open
(≈250 h)
Closed
(≈250–700 h)
Closed
(≈300 h)
Closed
(≈700 h)
Acid valuemg KOH/g0.20.070.020.03–0.060.030.1
IFTmN/m21354037--
4244
tan δ (25 °C) 0.0160.0028 × 10−53 × 10−40.0020.005
4 × 10−61 × 10−6
Rel. Permittivity (25 °C) 2.22.182.182.183.183.11
-2.08
COppm10003000700290018001800
500600
CO2ppm200030,0004000–500026,00030,00022,000
2500–35004000–8000
CO2/CO 3.2512–157.007–1212–1414.00
Dyn. Viscosity (10 °C)mNs/m²30-----
Energies 14 03036 i001 be exceeded    Energies 14 03036 i002 fallen short of    Energies 14 03036 i003 healthy range    Energies 14 03036 i004 poor range
Table 5. Definition of threshold values for different transformers and liquids for 350 DP (In case of two threshold values per parameter, the upper value stands for Oil B and the lower for Oil C).
ParameterUnitUninhibited OilInhibited OilSynthetic EsterNatural Ester
Open
(>2500 h)
Closed
(>2500 h)
Open
(≈1000 h)
Closed
(>2500 h)
Closed
(>2500 h)
Closed
(>2500 h)
Acid valuemg KOH/g0.350.150.150.150.370.8
0.03–0.060.09–0.13
IFTmN/m17.53227.527.5----
4040
tan δ (25 °C) --0.040.06--
0.0010.001
Rel. Permittivity (25 °C) 2.242.19--3.2-
COppm12503500850325030005000
CO2ppm500050,0002400–4000(2–4) × 10440,000(2–4) × 104
CO2/CO 2–43–156–12.55–1514–198–22
Dyn. Viscosity (10 °C)mNs/m²31.629----
Publisher’s Note: MDPI stays neutral with regard to jurisdictional claims in published maps and institutional affiliations.