Abstract
Water management is a key factor affecting the efficiency of proton exchange membrane fuel cells (PEMFCs). The currently used monitoring methods of PEMFCs provide limited information about which processes or components that humidity has a significant impact upon. Herein, we propose the use of a novel approach of impedance measurements using a multi-sinusoidal perturbation signal, which enables impedance measurements under dynamic operating conditions. The manuscript presents the effect of the relative humidity (RH) of the reactants on the instantaneous impedance of the middle cell in the PEMFC stack as a function of the current load. Analysis of changes in the values of equivalent circuit elements was carried out to determine which process determines the stack’s performance depending on the load range of the fuel cell during operation. Comprehensive impedance analysis showed that to ensure optimal cell operation, the humidity of the reactants should be adjusted depending on the load level. The results showed that at low-current loads, the humidity of gases should be at least 50%, while at high-current loads, the cell should operate optimally at a gas humidity of 30% or lower. The presented methodology provides an important tool for optimizing and monitoring the operation of fuel cells.
Highlights:
- New impedance method for PEMFC water management
- On-line impedance measurements in different PEMFC operating conditions
- Optimization of RH values of supplied reagents over the entire current range
1. Introduction
One of the main applications of PEMFCs is their use as a drive in the automotive industry [1,2,3,4]. The efficiency of a PEMFC depends not only on the components of the cell and its design but also on the given working conditions [5]. These include temperature, stoichiometric coefficients, pressure, and RH of the supplied gases. Appropriate water management has a strong influence on maintaining optimum efficiency during the operation of a fuel cell [6,7], and it can be controlled by appropriately constructing the fuel cell stack [8], as well as regulating its working parameters [9]; however, determining the optimal amount of water depending on the amount of electricity generated is not straightforward because of the complex relationship between the water content in the system and its efficiency. On the one hand, proper membrane humidification must be ensured, and on the other hand, excess water produced must be removed from the cell [10]. Too low humidity in the reaction space causes difficulties in the transport of protons from the anode to the cathode. In turn, the amount of water produced during electricity generation increases upon increasing the current. The presence of excess water in the reaction space or gas diffusion layer makes it difficult to transport gaseous reactants to the reaction space [11]. A temporary loss of efficiency resulting from excess water in the cell is not dangerous [10,12], but a variable, uncontrolled amount of water in the fuel cell affects the mechanical degradation of the membrane, causing long-term efficiency losses [13,14,15,16,17].
So far, the assessment of the impact of reactant gas humidification on the fuel cell’s performance during a variable current load of the stack was based on monitoring the voltage drop [15,18,19,20,21] or by visualization using a transparent cell [22,23]. Unfortunately, these techniques do not allow the determination of which process or component of a membrane electrode assembly (MEA) is most greatly affected by the instantaneous amount of water. The assessment of the influence of the water amount on individual components can only be performed by ex situ measurements, e.g., SEM, neutron imaging, synchrotron radiography, or fluorescence microscopy [10,12]. The use of classic electrochemical impedance spectroscopy (EIS) allows observations of the influence of specific operating parameters, including the RH of reactant gases, but only under stable conditions [24,25,26,27,28,29]. This method is also ideally suited for the ex situ testing of individual components of the fuel cell [30,31,32,33,34,35]. EIS is also used in other fields for studying stationary systems [36,37,38]. Unfortunately, the biggest disadvantage of EIS is the inability to study dynamic systems. Thus, it is necessary to use a different test method.
Here, we propose the implementation of dynamic electrochemical impedance spectroscopy (DEIS), a modification of the classic EIS method in which the classical sequential perturbation signal is replaced with a multi-sinusoidal signal composed of a specified number of sine waves of different frequency, amplitude, and phase shift. Due to the introduction of an additional variable component in the current signal, it is possible to simultaneously monitor the voltage and instantaneous impedance spectra during the variable load of the fuel cells. The DEIS method has been successfully used to identify malfunctioning cells in fuel cell stacks [39,40] and also for selecting the optimal conditions of the fuel cell operation [41,42].
The aim of this paper is to present the DEIS as a technique that allows:
- monitoring performance of the fuel cell stack
- water management of fuel cells
- optimization of fuel cell operation, in specific humidity of the reagents used during the operation of the PEMFC cell stack depending on the stack load level.
In order to achieve the intended goals, the authors carried out simultaneous AC and DC measurements and performed their comprehensive analysis. In the Materials and Methods section, the methodology, fuel cell description, and applied operation conditions used are described. In the Results and Discussion section, first current–voltage characteristics are discussed, and then the results obtained from the DEIS method are presented. Detailed impedance analysis of the presented impedance spectrograms allowed for the detailed determination of the optimal conditions of gas humidification, depending on the current load of the fuel cell.
2. Materials and Methods
To maintain proper working conditions and to ensure a variable current load of the fuel cell stack, a test station developed by Fuel Cell Technologies, Inc. (Albuquerque, NM, USA) was used. Current–voltage (I-V) characteristics were obtained for the following levels of humidification of reagents: 10, 30, 50, and 80%. Identical RH values were set for both reagents. The cell temperature was constant in each experiment at 70 °C. The temperature of the supplied reactants at the inlet to the stack was 5 °C higher than the stack’s working temperature to avoid water condensation in the gas lines. The back pressure of the supplied gases was constant at 150 kPaabs. Up to 30 A of current load, flow rates were set to 3 L min−1 for hydrogen and 10 L min−1 for air, which are values specified by the stack manufacturer. Above this current value, the flow rate of the reactants fed was varied so that while increasing the current consumption, a stable stoichiometric ratio of the supplied fuel to the oxidant was set to 1.8 and 2.5, respectively. As the fuel, hydrogen 5.0 (purity of 99.999%) was used, and the oxidant was supplied as compressed air. The PEMFC stack was supplied by Zentrum für Sonnenenergie-und Wasserstoff-Forschung Baden-Württemberg ZSW (Ulm, Germany), and it consisted of 10 individual cells with an active, geometrical surface area of 96 cm2 each. A commercially available membrane electrode assembly was used. Flow channels based on a cascaded flow field design with parallel-connected multiple serpentine groups were located in bipolar plates. The illustrative scheme of the tested fuel cell stack is shown in Figure 1.
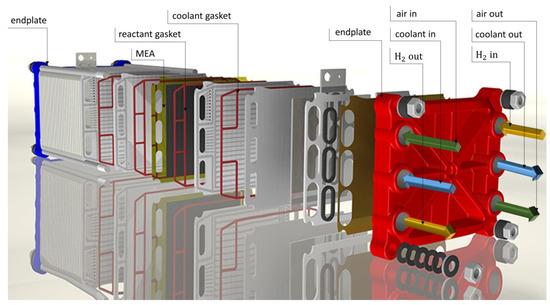
Figure 1.
CAD-exploded view of a ZSW fuel cell stack.
To simultaneously obtain impedance spectra for all cells at a variable current load, a system based on a test station and two National Instruments measurement cards, PXIe-6124 for signal generation and PXIe-4497 for data acquisition, was used. The investigations of each individual cell were carried out in a two-electrode setup in galvanodynamic mode.
The current load of the stack was linearly changed with a rate of 40 mA/s, in the range from 2 to 100 A. A multi-sinusoidal AC signal in the frequency range of 5–1123 Hz was applied to the investigated object as a perturbation signal. In the entire current range, the amplitude of the perturbation signal did not exceed 10% of the current load of the fuel cell stack. The use of a multi-sinusoidal perturbation signal in the given frequency range allowed the study of a dynamic system that is stationary in the 1 s measurement window, which is the time needed to obtain a full instantaneous impedance spectrum simultaneously for each cell and stack.
3. Results and Discussion
During the operation of the fuel cell stack, the voltage between its plates changed upon increasing the power consumption. The magnitude of these changes depended on the current load of the cell, as well as on the amount of water in the system. Due to the multiplicity of the obtained results, we presented results from the data analysis of cell no. 5 as representative values for the remaining cells. The current–voltage (I-V) characteristics obtained for the chosen cell are shown in Figure 2. Simultaneously, the instantaneous impedance spectra, shown as 3D impedance graphs in Figure 3, were obtained using DEIS.
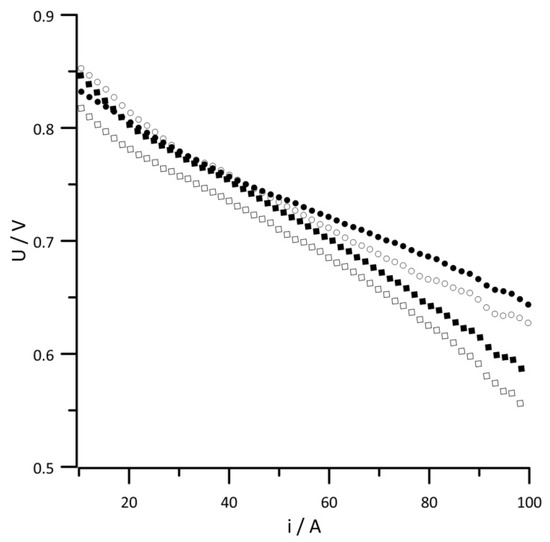
Figure 2.
I-V characteristics of a middle single cell. Geometric surface area S = 96 cm2, current load change rate di/dt = 40 mA s−1. RH of reactant gases (•) 10%, (◦) 30%, (▪) 50%, (▫) 80%.
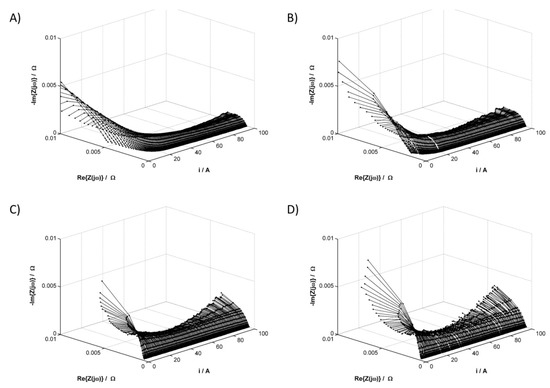
Figure 3.
Impedance spectra of the PEMFC middle cell obtained in galvanodynamic mode. Geometric surface area S = 96 cm2, current load change rate di/dt = 40 mA s−1, and measurement frequencies range from 5–1123 Hz. RH of reactant gases (A) 10%, (B) 30%, (C) 50%, and (D) 80%.
The I-V characteristics recorded for supplied reagents with a humidity of 80% deviated from the other characteristics in the entire current range. Based on this simple analysis, it can be concluded that a humidity of 80% is too high and adversely affects the fuel cell operation over the entire current range. Analyzing the voltage changes of the remaining RH values of the reactant gases, a 20–45 A current range can be distinguished where the I-V characteristics overlap. In the area of high-current loads, a greater voltage drop between the covers of the tested cell was caused by a higher RH value.
Analysis of the impedance results showed that for each tested RH value of reactant gases, there is a different current range at which the measured impedance values are the lowest, which is the range of optimal current loads of the cell at the set RH value. The widest range of optimal current loads can be observed in Figure 3A, which shows a change in the instantaneous impedance for the lowest reagent humidity. On the same impedance graph for low-current loads, the instantaneous impedance spectra are also significantly shifted toward positive values of the real impedance part, which indicates greater electrolyte resistance; however, to obtain information on the processes determining the fuel cell operation, an in-depth impedance analysis is necessary. For this purpose, the equivalent circuit shown in Figure 4 was used, the selection and validation of which was described by the authors in a previous study [39].
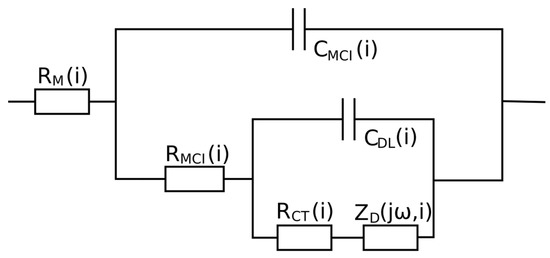
Figure 4.
Electrical equivalent circuit employed for analyzing the instantaneous impedance spectra. —sum of instantaneous resistance of the membrane and processes of hydrogen oxidation, —instantaneous resistance of the interlayer on the cathodic site, —instantaneous charge transfer resistance of oxygen reduction, instantaneous impedance of the element describing diffusion in a finitely thick layer, instantaneous capacitance of the catalyst-membrane interlayer on the cathodic site, and —instantaneous capacitance of the electrical double layer on the cathodic site.
Changes in the instantaneous values of the equivalent circuit elements in the function of current for different RH values of the reaction gases are presented in Figure 5, Figure 6, Figure 7, Figure 8, Figure 9 and Figure 10. Figure 5 presents the change in the instantaneous values of , and Figure 6 presents changes in the instantaneous values of for different reactant RH values. In both diagrams, the obtained relationships show similar change trends. Since the values of both resistances depend on the amount of ionomer and its humidification, the value of , is twice as large as the value of ) over the entire examined current range. The obtained relationships differ at low-current values, which indicates that the ionomer conductance is too low when the relative humidity of the supplied reaction gases is ≤30%. The type of proton transport in the electrolyte depends on the hydration level of the ionomer. At a low hydration of the membrane, the transport of H+ occurs through a vehicular or diffusion mechanism, and for a high level of ionomer hydration, the proton transport is faster and occurs with Grotthuss or proton-hopping mechanism. [10]. The obtained data indicate that at higher cell currents, when more water is produced, even for low RH values of the supplied reactants, optimal hydration of the ionomer is ensured. The obtained relationships suggest that for low-current densities, the stack should be operated at an RH of the reactant gases of at least 30%.
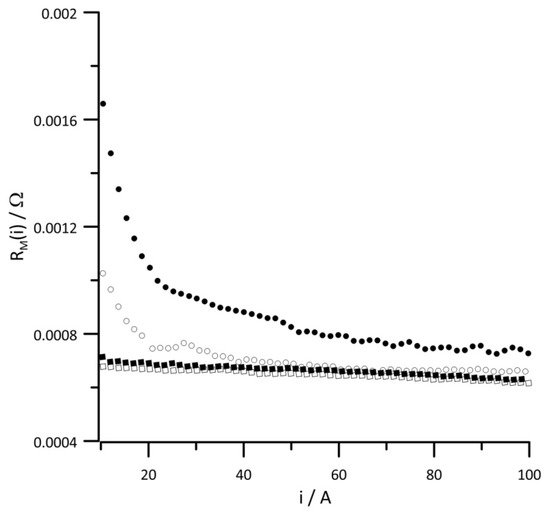
Figure 5.
Instantaneous value of versus current at reactant gas RH values of (•) 10%, (◦) 30%, (▪) 50%, and (▫) 80%. Geometric surface area S = 96 cm2, current load change rate di/dt = 40 mA s−1.
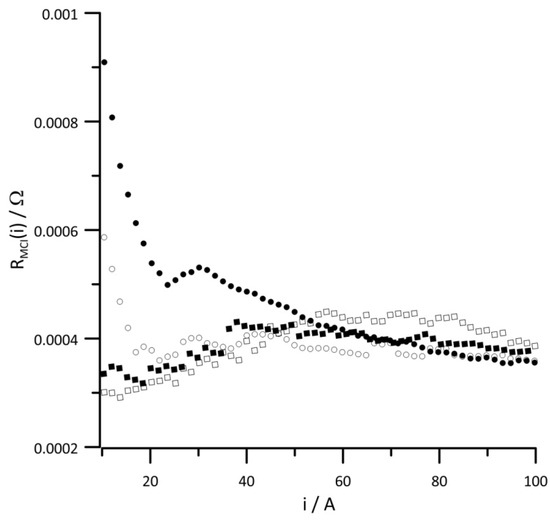
Figure 6.
Instantaneous value of versus current at reactant gas RH values of (•) 10%, (◦) 30%, (▪) 50%, and (▫) 80%. Geometric surface area S = 96 cm2, current load change rate di/dt = 40 mA s−1.
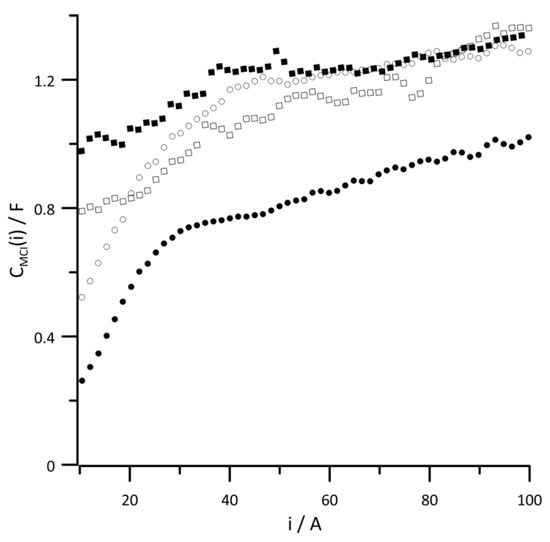
Figure 7.
Instantaneous value of versus current at reactant gas RH values of (•) 10%, (◦) 30%, (▪) 50%, and (▫) 80%. Geometric surface area S = 96 cm2, current load change rate di/dt = 40 mA s−1.
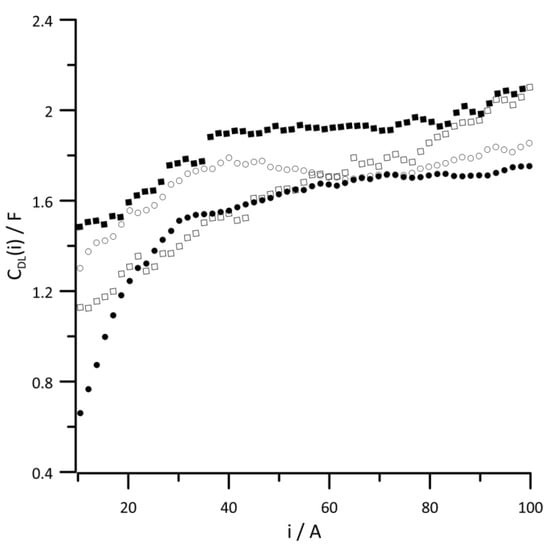
Figure 8.
Instantaneous value of versus current at reactant gas RH values of (•) 10%, (◦) 30%, (▪) 50%, and (▫) 80%. Geometric surface area S = 96 cm2, current load change rate di/dt = 40 mA s−1.
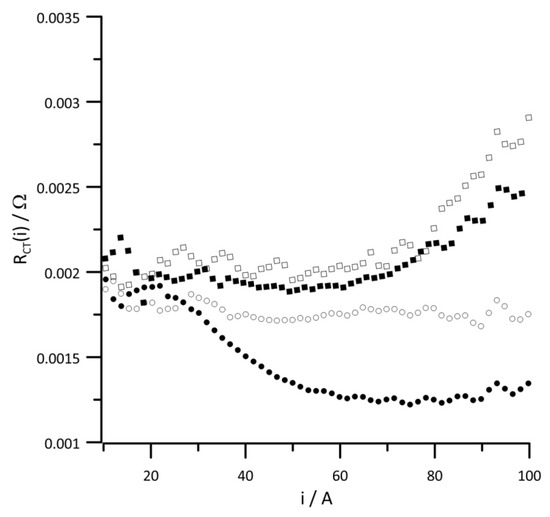
Figure 9.
Instantaneous value of versus current at reactant gas RH values of (•) 10%, (◦) 30%, (▪) 50%, and (▫) 80%. Geometric surface area S = 96 cm2, current load change rate di/dt = 40 mA s−1.
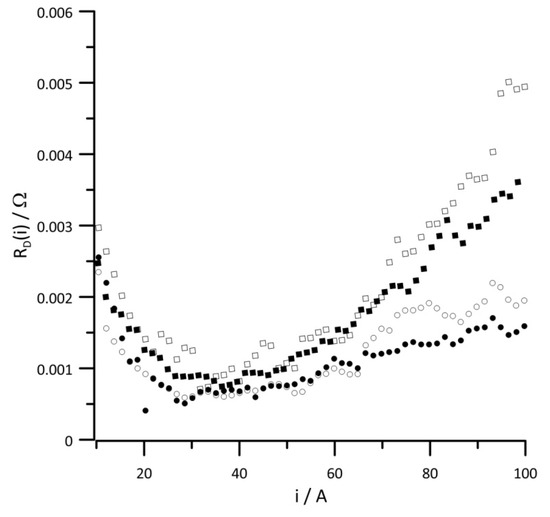
Figure 10.
Instantaneous value of versus current at reactant gas RH values of (•) 10%, (◦) 30%, (▪) 50%, and (▫) 80%. Geometric surface area S = 96 cm2, current load change rate di/dt = 40 mA s−1.
Figure 7 and Figure 8, respectively, show changes in the instantaneous values of CDL(i) and CMCI(i) capacities depending on the amount of energy generated for different reaction gas humidities. The presented relationships have nearly identical function shapes because the values of both capacitances are determined by the platinum content. Since there was much less platinum in the interlayer than the catalytic layer, the capacitance values shown in Figure 7 are almost twice as small as those in Figure 8. In both diagrams, the capacitance values obtained with 10% RH reaction gases are characterized by the lowest capacitance values over the entire current range. On the other hand, too much water in the catalytic layer can cause local flooding, which leads to the loss of catalyst active sites, which is followed by increased capacitance. At low-current values, when the cathode potential is high, the oxygen reduction reaction occurs on the surface of oxidized platinum [43,44,45], which is associated with the smallest capacitance values over the whole range of tested current loads.
The ORR is determined by the charge transfer resistance and differential capacity of the double layer. Changes in the instantaneous value of RCT (i) obtained at different RH values of reactants are shown in Figure 9. In the low-current range, the RH value has no impact on the RCT value; however, in the high-current range, an RH value above 30% significantly increased the charge transfer resistance due to a high amount of water in the fuel cell.
Figure 10 shows the dependence of the instantaneous diffusion resistance as a function of current at different RH values of the reactant gases. The diffusion resistance was determined based on the change in the instantaneous impedance of O atoms describing the finite-length diffusion. At low-current loads, the RD value is independent of the humidity level of the reactant gases. Upon increasing the generated energy, the influence of the water content in the system on the value of diffusion resistance was clearly distinguishable. This value is the highest of all resistances when the RH of the supplied reactants was at least 30% and the current load exceeded 60 A. Only at 10% RH of the supplied reagents was the diffusion resistance lower than the charge transfer resistance in the high-current load range.
Based on the presented results, three current values were selected, and then changes in individual equivalent circuit parameters obtained from impedance analysis as a function of RH are presented in Figure 11.
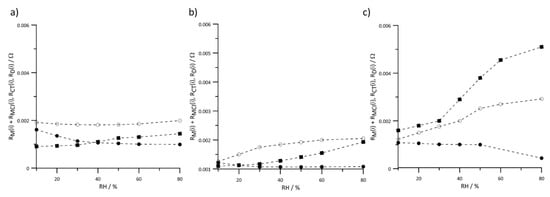
Figure 11.
Instantaneous value of resistances versus RH of reactant gases at constant current load (a) 20 A, (b) 60 A, and (c) 100 A. Geometric surface area S = 96 cm2, (•) , (◦), and (▪) .
Membrane and interlayer resistances are considered as a sum because both of these values depend on the ionomer resistance and exhibit similar behavior. Changes in the humidity have the greatest effect on the values of resistances when the cell is operated under a high load (Figure 11c). In this current range, the fuel cell operation was determined by diffusion resistance. In the other presented relationships (Figure 11a,b), the differences between the resistance values are insignificant.
4. Summary
This manuscript describes a new on-line method to determine the effect of reactant gas humidity on the electrical load on processes or components of a fuel cell during its dynamic operation. Determination of the optimal humidity of the supplied reagents was possible by analyzing the obtained instantaneous impedance spectra as a function of the current. To ensure the best performance, the RH value of reactants should vary depending on the load of the fuel cell. For low-current densities, the RH value has the greatest influence on the resistance of the membrane and interlayer. To ensure optimal cell operation, the RH of the reactant gases should be set to at least 50%, which is linked to proper hydration of the ionomer. This is even more important during stoichiometric operation at a very low-current density at the minimum gas-flow thresholds defined by the stack manufacturer. For high-current loads, the best results were obtained for low RH values up to 30%. When using gases with a higher humidity, the diffusion resistance displayed much higher values than other resistances, which is undesirable for the optimal performance of the fuel cell. The presented methodology and obtained results are crucial for optimizing and monitoring the real operation of fuel cells.
Author Contributions
Conceptualization, E.J.; Investigation, E.J. and M.M.; Methodology, K.D.; Software, L.G.; Visualization, E.J. and M.M.; Writing—original draft, E.J.; Writing—review & editing, M.M. All authors have read and agreed to the published version of the manuscript.
Funding
The research leading to the presented results received funding from National Science Centre (NCN, Poland) under research project no. 2016/23/N/ST8/02027.
Institutional Review Board Statement
Not applicable.
Informed Consent Statement
Not applicable.
Conflicts of Interest
The authors declare no conflict of interest.
References
- Konno, N.; Mizuno, S.; Nakaji, H.; Ishikawa, Y. Development of Compact and High-Performance Fuel Cell Stack. SAE Int. J. Altern. Powertrains 2015, 4, 123–129. [Google Scholar] [CrossRef]
- Wilberforce, T.; El-Hassan, Z.; Khatib, F.; Al Makky, A.; Baroutaji, A.; Carton, J.G.; Olabi, A.G. Developments of electric cars and fuel cell hydrogen electric cars. Int. J. Hydrog. Energy 2017, 42, 25695–25734. [Google Scholar] [CrossRef]
- Babu, A.V.; Calay, R.K. Development of a fuel cell propulsion system for the existing Mercedes B-Class 160 of petrol driven car. Int. J. Green Energy 2017, 14, 801–810. [Google Scholar] [CrossRef]
- Tian, Y.; Zou, Q.; Han, J. Data-Driven Fault Diagnosis for Automotive PEMFC Systems Based on the Steady-State Identification. Energies 2021, 14, 1918. [Google Scholar] [CrossRef]
- Li, Y.; Pei, P.; Wu, Z.; Ren, P.; Jia, X.; Chen, D.; Huang, S. Approaches to avoid flooding in association with pressure drop in proton exchange membrane fuel cells. Appl. Energy 2018, 224, 42–51. [Google Scholar] [CrossRef]
- Ferreira, R.; Falcão, D.; Oliveira, V.; Pinto, A. 1D + 3D two-phase flow numerical model of a proton exchange membrane fuel cell. Appl. Energy 2017, 203, 474–495. [Google Scholar] [CrossRef]
- Pei, P.; Li, Y.; Xu, H.; Wu, Z. A review on water fault diagnosis of PEMFC associated with the pressure drop. Appl. Energy 2016, 173, 366–385. [Google Scholar] [CrossRef]
- Park, J.; Oh, H.; Lee, Y.I.; Min, K.; Lee, E.; Jyoung, J.-Y. Effect of the pore size variation in the substrate of the gas diffusion layer on water management and fuel cell performance. Appl. Energy 2016, 171, 200–212. [Google Scholar] [CrossRef]
- Li, Y.; Pei, P.; Wu, Z.; Xu, H.; Chen, D.; Huang, S. Novel approach to determine cathode two-phase-flow pressure drop of proton exchange membrane fuel cell and its application on water management. Appl. Energy 2017, 190, 713–724. [Google Scholar] [CrossRef]
- Kumbur, E.; Mench, M. Fuel cells–proton-exchange membrane fuel cells|Water Management. Encycl. Electrochem. Power Sources 2009, 828–847. [Google Scholar] [CrossRef]
- Pasaogullari, U.; Wang, C.-Y. Two-Phase Modeling and Flooding Prediction of Polymer Electrolyte Fuel Cells. J. Electrochem. Soc. 2005, 152, A380–A390. [Google Scholar] [CrossRef]
- Nandjou, F.; Poirot-Crouvezier, J.-P.; Chandesris, M.; Blachot, J.-F.; Bonnaud, C.; Bultel, Y. Impact of heat and water management on proton exchange membrane fuel cells degradation in automotive application. J. Power Sources 2016, 326, 182–192. [Google Scholar] [CrossRef]
- Kusoglu, A.; Karlsson, A.M.; Santare, M.H.; Cleghorn, S.; Johnson, W.B. Mechanical response of fuel cell membranes subjected to a hygro-thermal cycle. J. Power Sources 2006, 161, 987–996. [Google Scholar] [CrossRef]
- Kusoglu, A.; Karlsson, A.M.; Santare, M.H.; Cleghorn, S.; Johnson, W.B. Mechanical behavior of fuel cell membranes under humidity cycles and effect of swelling anisotropy on the fatigue stresses. J. Power Sources 2007, 170, 345–358. [Google Scholar] [CrossRef]
- Panha, K.; Fowler, M.; Yuan, X.-Z.; Wang, H. Accelerated durability testing via reactants relative humidity cycling on PEM fuel cells. Appl. Energy 2012, 93, 90–97. [Google Scholar] [CrossRef]
- Khorasany, R.M.; Kjeang, E.; Wang, G.; Rajapakse, R. Simulation of ionomer membrane fatigue under mechanical and hygrothermal loading conditions. J. Power Sources 2015, 279, 55–63. [Google Scholar] [CrossRef]
- Anyanwu, I.S.; Hou, Y.; Chen, W.; Pan, F.; Du, Q.; Xuan, J.; Jiao, K. Numerical Investigation of Liquid Water Transport Dynamics in Novel Hybrid Sinusoidal Flow Channel Designs for PEMFC. Energies 2019, 12, 4030. [Google Scholar] [CrossRef]
- Lee, Y.-H.; Kim, J.; Yoo, S. On-line and real-time diagnosis method for proton membrane fuel cell (PEMFC) stack by the superposition principle. J. Power Sources 2016, 326, 264–269. [Google Scholar] [CrossRef]
- Webb, D.; Møller-Holst, S. Measuring individual cell voltages in fuel cell stacks. J. Power Sources 2001, 103, 54–60. [Google Scholar] [CrossRef]
- Zhao, J.; Jian, Q.; Luo, L.; Huang, B.; Cao, S.; Huang, Z. Dynamic behavior study on voltage and temperature of proton exchange membrane fuel cells. Appl. Therm. Eng. 2018, 145, 343–351. [Google Scholar] [CrossRef]
- Zhang, C.; Li, W.; Hu, M.; Cheng, X.; He, K.; Mao, L. A Comparative Study of Using Polarization Curve Models in Proton Exchange Membrane Fuel Cell Degradation Analysis. Energies 2020, 13, 3759. [Google Scholar] [CrossRef]
- Hussaini, I.S.; Wang, C.-Y. Visualization and quantification of cathode channel flooding in PEM fuel cells. J. Power Sources 2009, 187, 444–451. [Google Scholar] [CrossRef]
- Spernjak, D.; Prasad, A.K.; Advani, S. Experimental investigation of liquid water formation and transport in a transparent single-serpentine PEM fuel cell. J. Power Sources 2007, 170, 334–344. [Google Scholar] [CrossRef]
- Mousa, G.; Golnaraghi, F.; DeVaal, J.; Young, A. Detecting proton exchange membrane fuel cell hydrogen leak using electrochemical impedance spectroscopy method. J. Power Sources 2014, 246, 110–116. [Google Scholar] [CrossRef]
- Futter, G.A.; Gazdzicki, P.; Friedrich, K.A.; Latz, A.; Jahnke, T. Physical modeling of polymer-electrolyte membrane fuel cells: Understanding water management and impedance spectra. J. Power Sources 2018, 391, 148–161. [Google Scholar] [CrossRef]
- Avcioglu, G.S.; Ficicilar, B.; Eroglu, I. Improved PEM fuel cell performance with hydrophobic catalyst layers. Int. J. Hydrog. Energy 2018, 43, 18632–18641. [Google Scholar] [CrossRef]
- Lee, Y.-H.; Yoo, S.; Kim, J. Development of Real-time Diagnosis Method for PEMFC Stack via Intermodulation Method. Trans. Korean Soc. Automot. Eng. 2014, 22, 76–83. [Google Scholar] [CrossRef][Green Version]
- Shan, J.; Lin, R.; Chen, X.; Diao, X. EIS and local resolved current density distribution analysis on effects of MPL on PEMFC performance at varied humidification. Int. J. Heat Mass Transf. 2018, 127, 1076–1083. [Google Scholar] [CrossRef]
- Sorrentino, A.; Sundmacher, K.; Vidakovic-Koch, T. Polymer Electrolyte Fuel Cell Degradation Mechanisms and Their Diagnosis by Frequency Response Analysis Methods: A Review. Energies 2020, 13, 5825. [Google Scholar] [CrossRef]
- Şahin, A.; Ar, I. Synthesis, characterization and fuel cell performance tests of boric acid and boron phosphate doped, sulphonated and phosphonated poly(vinyl alcohol) based composite membranes. J. Power Sources 2015, 288, 426–433. [Google Scholar] [CrossRef]
- Ozden, A.; Ercelik, M.; Devrim, Y.; Colpan, C.O.; Hamdullahpur, F. Evaluation of sulfonated polysulfone/zirconium hydrogen phosphate composite membranes for direct methanol fuel cells. Electrochim. Acta 2017, 256, 196–210. [Google Scholar] [CrossRef]
- Parnian, M.J.; Rowshanzamir, S.; Prasad, A.K.; Advani, S. High durability sulfonated poly (ether ether ketone)-ceria nanocomposite membranes for proton exchange membrane fuel cell applications. J. Membr. Sci. 2018, 556, 12–22. [Google Scholar] [CrossRef]
- Mohanta, P.K.; Regnet, F.; Jörissen, L. Graphitized Carbon: A Promising Stable Cathode Catalyst Support Material for Long Term PEMFC Applications. Materials 2018, 11, 907. [Google Scholar] [CrossRef] [PubMed]
- Jang, J.; Lee, J.G.; Hwang, H.J.; Kwon, O.; Jeon, O.S.; Ji, Y.; Shul, Y.-G.; Jang, J. Role of Nitrogen-Doped Carbon Nanofibers Inside Polymer Membranes for Enhancing Fuel Cell Performance. Energy Technol. 2018, 6, 998–1002. [Google Scholar] [CrossRef]
- Maya-Cornejo, J.; Garcia-Bernabé, A.; Compañ, V. Bimetallic Pt-M electrocatalysts supported on single-wall carbon nanotubes for hydrogen and methanol electrooxidation in fuel cells applications. Int. J. Hydrog. Energy 2018, 43, 872–884. [Google Scholar] [CrossRef]
- Miszczyk, A.; Szocinski, M.; Darowicki, K. Interlayer defect evolution in an organic coating system on steel under hydromechanical loading. J. Appl. Electrochem. 2006, 37, 353–358. [Google Scholar] [CrossRef]
- Miszczyk, A.; Darowicki, K. Multivariate analysis of impedance data obtained for coating systems of varying thickness applied on steel. Prog. Org. Coat. 2014, 77, 2000–2006. [Google Scholar] [CrossRef]
- Miszczyk, A.; Darowicki, K. Water uptake in protective organic coatings and its reflection in measured coating impedance. Prog. Org. Coat. 2018, 124, 296–302. [Google Scholar] [CrossRef]
- Darowicki, K.; Janicka, E.; Mielniczek, M.; Zieliński, A.; Gawel, L.; Mitzel, J.; Hunger, J. Implementation of DEIS for reliable fault monitoring and detection in PEMFC single cells and stacks. Electrochim. Acta 2018, 292, 383–389. [Google Scholar] [CrossRef]
- Slepski, P.; Janicka, E.; Darowicki, K.; Pierozynski, B. Impedance monitoring of fuel cell stacks. J. Solid State Electrochem. 2014, 19, 929–933. [Google Scholar] [CrossRef]
- Darowicki, K.; Janicka, E.; Slepski, P. Study of Direct Methanol Fuel Cell Process Dynamics Using Dynamic Electro-chemical Impedance Spectroscopy. Int. J. Electrochem. Sci. 2012, 7, 12090–12097. [Google Scholar]
- Slepski, P.; Darowicki, K.; Janicka, E.; Lentka, G. A complete impedance analysis of electrochemical cells used as energy sources. J. Solid State Electrochem. 2012, 16, 3539–3549. [Google Scholar] [CrossRef]
- Song, C.; Tang, Y.; Zhang, J.L.; Zhang, J.; Wang, H.; Shen, J.; McDermid, S.; Li, J.; Kozak, P. PEM fuel cell reaction kinetics in the temperature range of 23–120 °C. Electrochim. Acta 2007, 52, 2552–2561. [Google Scholar] [CrossRef]
- Paulus, U.; Schmidt, T.; Gasteiger, H.; Behm, R. Oxygen reduction on a high-surface area Pt/Vulcan carbon catalyst: A thin-film rotating ring-disk electrode study. J. Electroanal. Chem. 2001, 495, 134–145. [Google Scholar] [CrossRef]
- Paik, C.H.; Jarvi, T.D.; O’Grady, W.E. Extent of PEMFC Cathode Surface Oxidation by Oxygen and Water Measured by CV. Electrochem. Solid-State Lett. 2004, 7, A82–A84. [Google Scholar] [CrossRef]
Publisher’s Note: MDPI stays neutral with regard to jurisdictional claims in published maps and institutional affiliations. |
© 2021 by the authors. Licensee MDPI, Basel, Switzerland. This article is an open access article distributed under the terms and conditions of the Creative Commons Attribution (CC BY) license (https://creativecommons.org/licenses/by/4.0/).