Article

The Correlation of Biodiesel Blends with the Common Rail Diesel Engine’s Performance and Emission Characteristics

1
Faculty of Automobile Technology, HaNoi University of Industry, No.298, Cau Dien Street, Bac Tu Liem District, Ha Noi 100000, Vietnam
2
Internal Combustion Engine Department, Hanoi University of Science and Technology, Ha Noi 100000, Vietnam
*
Author to whom correspondence should be addressed.
Energies 2021, 14(11), 2986; https://doi.org/10.3390/en14112986
Submission received: 19 April 2021 / Revised: 12 May 2021 / Accepted: 15 May 2021 / Published: 21 May 2021
(This article belongs to the Section A4: Bio-Energy)

Abstract

:
The use of biofuel has been researched and announced by scientists to bring benefits in terms of environmental protection. However, studies continue to be conducted to achieve stable results and confirm biofuels as an effective alternative fuel for internal combustion engines. In this study, the fuel used is biodiesel derived from fish oil and conventional diesel fuel. Specifically, the test fuel is conventional diesel mixed with fish oil biodiesel in different ratios, including B0, B10, B20, B30, B40, and B50 (respectively 0%, 10%, 20%, 30% 40%, and 50% biodiesel in the mixture). Research was carried out by both simulation (from B0 to B50) and experiment (from B0 to B30) on a single cylinder common rail diesel engine. Test modes were at 25%, 50%, and 75% load respectively at maximum torque (at 1400 revolutions per minute (rpm)) and minimum fuel consumption (at 2200 rpm). Compared with B0, the average reduction in brake power of the biodiesel decreased relative to the proportion of biodiesel in the fuel mixture. Specific fuel consumption of the brakes (BSFC) and NOx emissions increased with decreasing emissions of smoke, hydrocarbon (HC), and carbon monoxide (CO) emissions when the biodiesel ratio increased.

1. Introduction

In the historical trend of improving heavy diesel performance and emission formation, diesel combustion and the development of innovative combustion systems able to improve the CO2 and improve the NOx–Soot trade-offs such as specific bowl design [1], innovative fuel injection systems (2750+ bar of injection pressure), and injection strategy [2] was presented as the effective method. On the other hand, using the alternative fuels such as biofuels are known as the most effective method with the most potential in recent years. Biofuels used for vehicles have received great interest from scientists and governments around the world, as biofuels contribute to the problem of energy shortages in the future. Biodiesel is a potentially very potent alternative to diesel. Biodiesel is a straight chain alkyl ester, so it has a higher Cetane number than mineral diesel. Diesel fuels typically have a Cetane value of 50 to 54, while biodiesel is usually 56 to 58. Thus, biodiesel can completely meet the Cetane requirement without additives; it is also used as an additive for the mineral diesel [3].
Biodiesel is obtained from the transesterification of vegetable oils and from animal fats [4,5,6]. Biodiesel contains very little aromatic hydrocarbons and very low sulfur content, about 0.001%. This feature of biodiesel is good for use as a fuel, because it significantly reduces SOx emissions that corrode the equipment and pollute the environment. At the same time, the biodiesel fuel contains about 11% oxygen, so the combustion of the fuel occurs completely, reducing the amount of hydrocarbons in the exhaust gas. With biodiesel emissions of SO2, CO2 is significantly reduced, CO is reduced by 20%, and there is more free oxygen [7]. Biodiesel has already been commercialized in the transport sector and can be used in diesel engines with little or no modification [8]. Biodiesel and its blends with conventional diesel are environmentally friendly, and their use in diesel engine results in reduced exhaust pollutants as compared to conventional diesel fuel [9,10]. Vietnam is a country that has potential and a big aquatic product market.
Vietnam is a country with strong seafood advantages. In particular, the output of exported catfish is very large, about 1.2 million tons per year. During processing, most of the fish’s appendages are removed, accounting for about 75% by weight [11]. These subsections will be a source of environmental pollution if left untreated. Therefore, ways have been sought to recycle these appendages into biodiesel fuel [12,13,14].
The low heat value combined with the injection rate will determine the rate at which the heat is radiated in the cylinder. Since biodiesel (B100) has a lower calorific value than diesel (B0), the biodiesel mixture will also have a lower calorific value than B0. It will reduce the maximum temperature and pressure in the cylinder when using biodiesel blends. This will affect the economy, energy, and environment of the diesel engine. The self-ignition ability of diesel fuel can be determined by Cetane value. The number of Cetanes has a decisive influence on the delay time of the fuel and therefore directly affects the temperature and pressure in the cylinder. When there is more oxygen in its chemical composition, biodiesel mixtures generally have higher experimental actions than conventional diesel [15]. This is an advantage of biodiesel when mixing and burning.
The C:H:O ratio is one of the important parameters when assessing the chemical composition of a diesel fuel. However, the analysis and accurate determination of C:H:O ratio has high cost and high demand for experimental equipment. Since B100 has an increase in oxygen (O), the decrease in carbon (C) and hydrogen (H) as compared to B0 will have different effects on combustion and the formation of pollutants of diesel engine. On the one hand, the biodiesel mixture contains more oxygen, leading to the maximum temperature of the combustion process, increasing the oxygen content in the combustion zone, which tends to increase the NOx concentration in the exhaust gas. On the other hand, also due to higher combustion zone and oxygen content, it improves smoke quality (decrease in PM content) [16,17].
From the above analysis, it can be seen that for each biodiesel mixture, there are changes in physical and chemical properties and combustion properties compared to conventional diesel fuel. The variation of these parameters tends to be different, and their impact on the performance target and pollution level of a diesel engine is complex and intertwined. Correlation between biodiesel blend ratio with economic, energy, and environmental indicators has been clearly shown in this study by both simulation and experiment. The study was performed on a common rail engine.

2. Methodology

2.1. Combustion Model

Models with controlled combustion mixture (MCC) are used to build properties in diesel combustion. The model can be calculated by:
d Q t o l t a l d α = d Q M c c d α + d Q P M C d α
With Qtotal: total heat release [kJ];
QPMC: total fuel heat input [kJ];
QMCC: cumulative heat release [kJ];
Ignition delay model:
The ignition delay is calculated using the Andree and Pachernegg [18] model:
d I i d d α = T U B T r e f Q r e f .
The ignition delay integral Iid reaches a value of 1.0 (=at αid), and the ignition delay τid is calculated from: τid = αid αSOI.
Here, Iid: ignition delay integral (−); Tref: reference temperature = 505.0 (K); TUB: unburned zone temperature (K); Qref: reference activation energy, f(droplet, diameter, oxygen content,…) (K); τid: ignition delay; αSOI: start of injection timing (degCA); αid: ignition delay timing (degCA).

2.2. Heat Transfer Model

The heat transfer is calculated from the following equation [19,20].
Q w i = A i α w ( T c T w i )
where Qwi: wall heat flow; Ai: surface area; αw: heat transfer coefficient; Tc: gas temperature in the cylinder; Twi: wall temperature.
Heat transfer coefficient (αw) is usually calculated by WOSCHNI Model [19]:
α w = 130 × D 0.2 × P c 0.8 × T c 0.53 × [ C 1 × C m + C 2 × V D × T c .1 p c .1 × V c .1 × ( p c p c .0 ) ] 0.8
where C1 = 2.28 + 0.308. Cu/Cm; C2 = 0.00324 for DI engines; D: cylinder bore, Cm: mean piston speed; Cu: circumferential velocity, Cu = π.D.nd/60; VD: displacement per cylinder; pc,o: cylinder pressure of the motored engine (bar); Tc,1: temperature in the cylinder at intake valve closing (IVC); pc,1: pressure in the cylinder at IVC (bar).

2.3. Emission Model

2.3.1. NOx Formation Model

NOx formed from the oxidation reaction of nitrogen in high-temperature conditions of combustion. The 6 reactions introduced in Table 1, which are based on the well-known Zeldovich mechanism, are taken into account.
The concentration of N2O is calculated according to:
N 2 O N 2 O 2 = 1.1802.10 6 . T 1 0.6125 . exp [ 18.71 R T ]
where T1: temperature at the beginning of the compression stroke (K).
NO formation rate is calculated as follows:
d [ N O ] d t = 2 ( 1 α 2 ) [ R 1 e 1 + α K 2 + R 4 e 1 + K 4 ] P R T .
The final rate of NO production/destruction in [mole/cm3s] is calculated as:
r N O = C P o s t Pr o c m u l t . C k i n e t i c M u l t . 2 . ( 1 α 2 ) . r 1 1 + α . A K 2 . r 4 1 + A K 4
with α = C N O , a c t C N O , e q u . 1 C P o s t Pr o M u l t ; A K 2 = r 1 r 2 + r 3 ; A K 4 = r 4 r 5 + r 6 .

2.3.2. CO Formation Model

CO formation following the two reactions given in Table 2 is taken into account.
The final rate of CO production/destruction in [mole/cm3s] is calculated as:
rCO= Cconst.(r7+ r8). (1 − α)
with α = CCO, act/CCO, equ.

2.3.3. Soot Formation Model

Soot formation is described by two steps including formation and oxidation. The net rate of change in soot mass (m) is the difference between the rates of soot formed (ms.f) and oxidized (ms,ox).
d m s d t = d m s , f d t d m s , o x d t
with d m s , f d t = A f . m f , v . p 0.5 exp [ E s , f R T ] soot formation rate
d m s , o x d t = A o x . m s . P O 2 P p 1.8 exp [ E s , o x R T ] oxidation rates
ms: soot mass; mf,v: fuel evaporation volume; PO2: pressure of O2 molecules; Es,f = 52,335 kJ/kmol: activation energy; Es,ox = 58,615 kJ/kmol: oxidation energy; Af, Aox: the constant empiric selection and specific engine types.

2.3.4. Fuel Model

The properties of the experimental fuel have a great influence on the performance as the engine emissions. Table 3 presents some properties of test fuels.
First, it is necessary to define fuel B100; B100 fuel is 100% pure biodiesel including the chemical compound with the ratio by volume and is presented in Table 4. B10, B20, B30, B40, and B50 have a percentage of volume, respectively 10%, 20%, 30%, 40%, and 50% of B100.

2.4. Modeling Diesel Engine AVL 5402

The AVL 5402 engine is a single-cylinder, four-stroke, common rail diesel engine. The engine specification is shown in Table 5, and the engine is modeled by AVL Boost software (Figure 1). AVL Boost software is powerful software in simulation combustion engine, this helps simulate the heavy duty engine or small engine [21].
The general control data of the model as well as the elements are shown in Table 6 below.

2.5. Experimental Setup

The experimental system includes a Dyno-AMK electric test band, researching 1 cylinder engine AVL5402, cooling water and lubricating oil cooling system AVL577, fuel consumption meter (Fuel Balance 733S), throttle control device THA100, test tape control and monitoring system PUMA, and control system. The ECU supplies fuel to INCA engines, the cylinder pressure gauge INDICATING CEB-II, opacimeter 439 opacimeter smoke meter, smoke meter, and some other devices. Regarding other auxiliary equipment, the experimental diagram is shown in Figure 2.

2.5.1. Power Measuring Equipment

Dyno-AMK is an electric brake that functions as a generator in which the reciprocal magnetic field between Roto and Stato creates a resistance torque with ROTO and is balanced with the drive torque from ROTO. Brake assembly is connected to the drive shaft from the engine. The reciprocal magnetic field strength between Roto and Stato is adjusted to increase or decrease the momentum on the drive shaft from the motor. The ability to change brake torque is suitable for automatic control in the test mode of the engine. Brake assembly has the function of working in the generator mode (braking for the engine) and the engine mode (pulling the rotary engine). When the test strips work in transmitter mode, the generated power will pass through the inverter to output and connect to the grid.
The tester can test a maximum torque of 150 Nm, a maximum power of 28 kW, and a speed of 0 to 8000 rpm.

2.5.2. Fuel Balance AVL733S

The AVL733S fuel gauge is used to measure the fuel consumption of the engine by weighing the fuel in the fuel tank. The AVL733S can continuously measure the amount of fuel for a period of time from filling the tank until the fuel in the tank drops to zero.
The AVL733S has basic parameters such as Fuel temperature range (−100 °C ÷ 700 °C); Measuring range (0 ÷ 150 kg/h); Supply fuel pressure (0.1 ÷ 0.8 at); Working voltage (24 V); Maximum measuring frequency (10 Hz); and Device accuracy (±0.12%).

2.6. Simulation and Experimental Testing Condition

Simulations are performed for fuels with blend ratios of 0%, 10%, 20%, 30%, 40%, and 50% respectively with symbols B0, B10, B20, B30, B40, and B50. Meanwhile, an experiment is done with fuel with mixing ratios of 0%, 10%, 20%, and 30% respectively with symbols B0, B10, B20, and B30. An experiment is conducted with a lower blending ratio to reduce costs.
The amount of fuel supplied to the cycle will be fixed with all tested fuels. The amount of fuel supplied to the cycle according to the working modes for each load is presented in Table 7.
There are 2 speed modes 1400 (rpm) and 2200 (rpm) with 2 early injection angle values of 140 and 180 determined from the outer characteristic curve with changing injection time so that the torque achieved is corresponding to the load values (75%, 50%, and 25%). For each mode, the amount of fuel supplied to the cycle is determined corresponding to the injection time for diesel fuel (B0). The amount of fuel supplied to the cycle will be fixed with all tested fuels.
We constructed the external characteristic curve for diesel fuel with constant injection pressure (600 bar) to determine the maximum torque value (Memax). The actual performance curve of the AVL-5402 engine is shown in Figure 3.
The injection time for each type of fuel to ensure the same amount of fuel supplied to the cycle when changing injection pressure is also done similarly. The injection time for each fuel to achieve GCT corresponds to the load modes (25%, 50% and 75%) and is shown in Table 8. The spraying process is a single injection pulse.

3. Results and Discussion

From the actual full load characteristic curve of the AVL-5402, the 1400 (rpm) mode gives the maximum torque, while at 2200 (rpm), the fuel consumption is in the lowest value. Thus, these two speed regimes will be selected for conducting survey calculations on the model.

3.1. Model Validation

In order to determine the reliability of the model, before applying on a large scale, it is necessary to use the model to calculate in a certain mode, to compare the simulation results with the experimental results, and to correct the model if it is necessary that the difference between the calculated result and the measured result is within what the limit will allow.
Figure 4 presents the results of the comparison in capacity between simulation and experiment for fuels B0, B10, B20, and B30 while keeping GCT corresponding to 75% load. The results showed that the largest deviation for B0 fuel specifically at 1400 (rpm) was 7.96%; at 2200 (rpm), it is 6.0%. Meanwhile, the smallest deviation for B30 fuel specifically at 1400 (rpm) is 4.04%; at 2200 (rpm), it is 2.61%.
Figure 4 presents the results of the comparison of capacity between simulation and experiment for fuels B0, B10, B20, and B30 while keeping GCT corresponding to 75% load. The results showed that the largest difference for B0 fuel, specifically, at 1400 (rpm) was 7.96%; while at 2200 (rpm), it is 6.0%. Meanwhile, the smallest deviation for B30 fuel, specifically at 1400 (rpm), is 4.04%; at 2200 (rpm), it is 2.61%.
Figure 5 presents the comparison results in fuel consumption rate between simulation and experiment for fuel types B0, B10, B20, and B30 while keeping GCT corresponding to 75% load. The results show the maximum deviation for B0 fuel at both speed modes. Specifically, at 1400 (rpm), it is 5.05%, and at 2200 (rpm), it is 6.48%. The smallest deviation occurs at fuel B30, namely, at 1400 (rpm), it is 3.88%, and at 2200 (rpm), it is 4.77%.
From the comparison in capacity and fuel consumption above, it shows that the average deviation in the capacity for B0, B10, B20, and B30 fuels respectively reaches the values 6.00%, 5.71%, 5.10%, and 4.76%. Meanwhile, the fuel consumption rates are respectively −5.77%, −5.19%, −4.52%, and −4.33%.
Thus, the calculation by simulation models for the fuels with errors below 10% completely meets the reliability needed to conduct calculations on a wider range later.

3.2. Combustion Characteristics

Figure 6 compares the pressure in engine cylinder when using six kinds of fuel: B0, B10, B20, B30, B40, and B50. The pressure trend in the cylinder when using B10, B20, B30, B40, and B50 was presented. However, the timing has a change; specifically, the real time of burning (the rapid burning phase) and reaching the peak pressure (reaching extreme) of the biodiesel fuel earlier with biodiesel blending increased. This is because biodiesel fuel has a higher solute value, which should shorten the delay time, resulting in the combustion process tending to take place earlier and shifting forward according to the crankshaft rotation angle. On the other hand, when increasing the biodiesel blending ratio, the values of peak pressure and pressure in the expansion process decrease, respectively. The cause of this phenomenon is due to the decline in the low calorific value of biodiesel fuels [22,23]. The parameters of the time of starting fire, the time of reaching the maximum pressure, and the value of the maximum pressure are presented in Table 9.
The amount of fuel supplied to a cycle is the same for all fuels; on the other hand, the calorific value of biodiesel fuel is lower than that of diesel fuel, so the heat rate of biodiesel fuel will be lower. Figure 7 shows the time of a sharp increase in the exothermic rate for biodiesel fuel earlier. This is also explained by the higher Cetane value of biodiesel fuel [24]. The parameters of the heat rate of the fuels are shown in Table 9.
The specific parameters of combustion process are shown in Table 9.
Figure 7 and Table 9 show that the maximum heating rate of B0 fuel reaches the maximum and decreases gradually as the mixing ratio increases, the peak heat rate of B0, B10, B20, B30, B40, and B50 are 37.5, 36.7, 36.0, 35.3, 34.8, and 34.4 (kJ), respectively. However, the earliest moments of the B50 fuel’s peak exothermic speed appear (according to the crankshaft angle) and later on as the mixing ratio decreases. There is a negligible difference between the different mixing ratios in the end stage of the heat generation. The decrease in the exothermic rate when the mixing ratio increases is due to the lower calorific value of the biodiesel fuel, while the increase in the mixing ratio causes the peak exothermic rate to appear earlier due to the value of the value of the biodiesel fuel. The higher dissolution of biodiesel fuels shortens the delay in burning time and causes the exothermic process to shift forward with a crankshaft rotation.

3.3. Engine Performance

The capacity (Ne) of the engine decreases compared to that when using diesel fuel (B0) and decreases as the biodiesel blend ratio (% Biodiesel) increases. With the same amount of fuel supplied to a cycle for all fuels, the reduced capacity is due to lower biodiesel fuel calorific value. On the other hand, due to the reduced delay time, the phenomenon of both burning and compression occurs when using biodiesel fuel, resulting in reduced capacity [25,26,27,28]. Averaging in all modes shows that for simulation, the average power reduction is 0.99%, 2.01%, 2.88%, 3.82%, and 4.98%, respectively. For the experiment, the average reduction capacity is 1.08%, 2.16%, and 3.01%, respectively. The relationship and trend of capacity change according to the biodiesel blending ratio are shown in Figure 8 and Figure 9.
The relationship between the change of capacity and the biodiesel blending ratio is shown through the following function:
Simulation: y1 = −0.0797x + 0.0005; Squared value (R2 = 0.9987)
Experiment: y2 = −0.1011x − 0.046; Squared value (R2 = 0.9969)
Figure 10 and Figure 11 show the relationship between fuel consumption rate (BSFC) and biodiesel blend ratio. The BSFC increases gradually as the biodiesel blend ratio increases. Since the amount of fuel supplied to the cycle remains constant for the fuels, due to the decrease in engine power, fuel consumption increases. Specifically, the average in all modes shows that for the simulation, the average fuel consumption rate increases by 1.30%, 2.30%, 3.28%, 4.24%, and 5.58%, respectively. For the experiment, the average increase in fuel consumption rate is 1.21%, 2.45%, and 3.40%.
The relationship between the change of fuel consumption rate and the biodiesel blending ratio is shown through the following function:
Simulation: y1 = 0.1077x + 0.0905; Squared value (R2 = 0.9967)
Experiment: y2 = 0.1144x + 0.049; Squared value (R2 = 0.9966).

3.4. Exhaust Emission
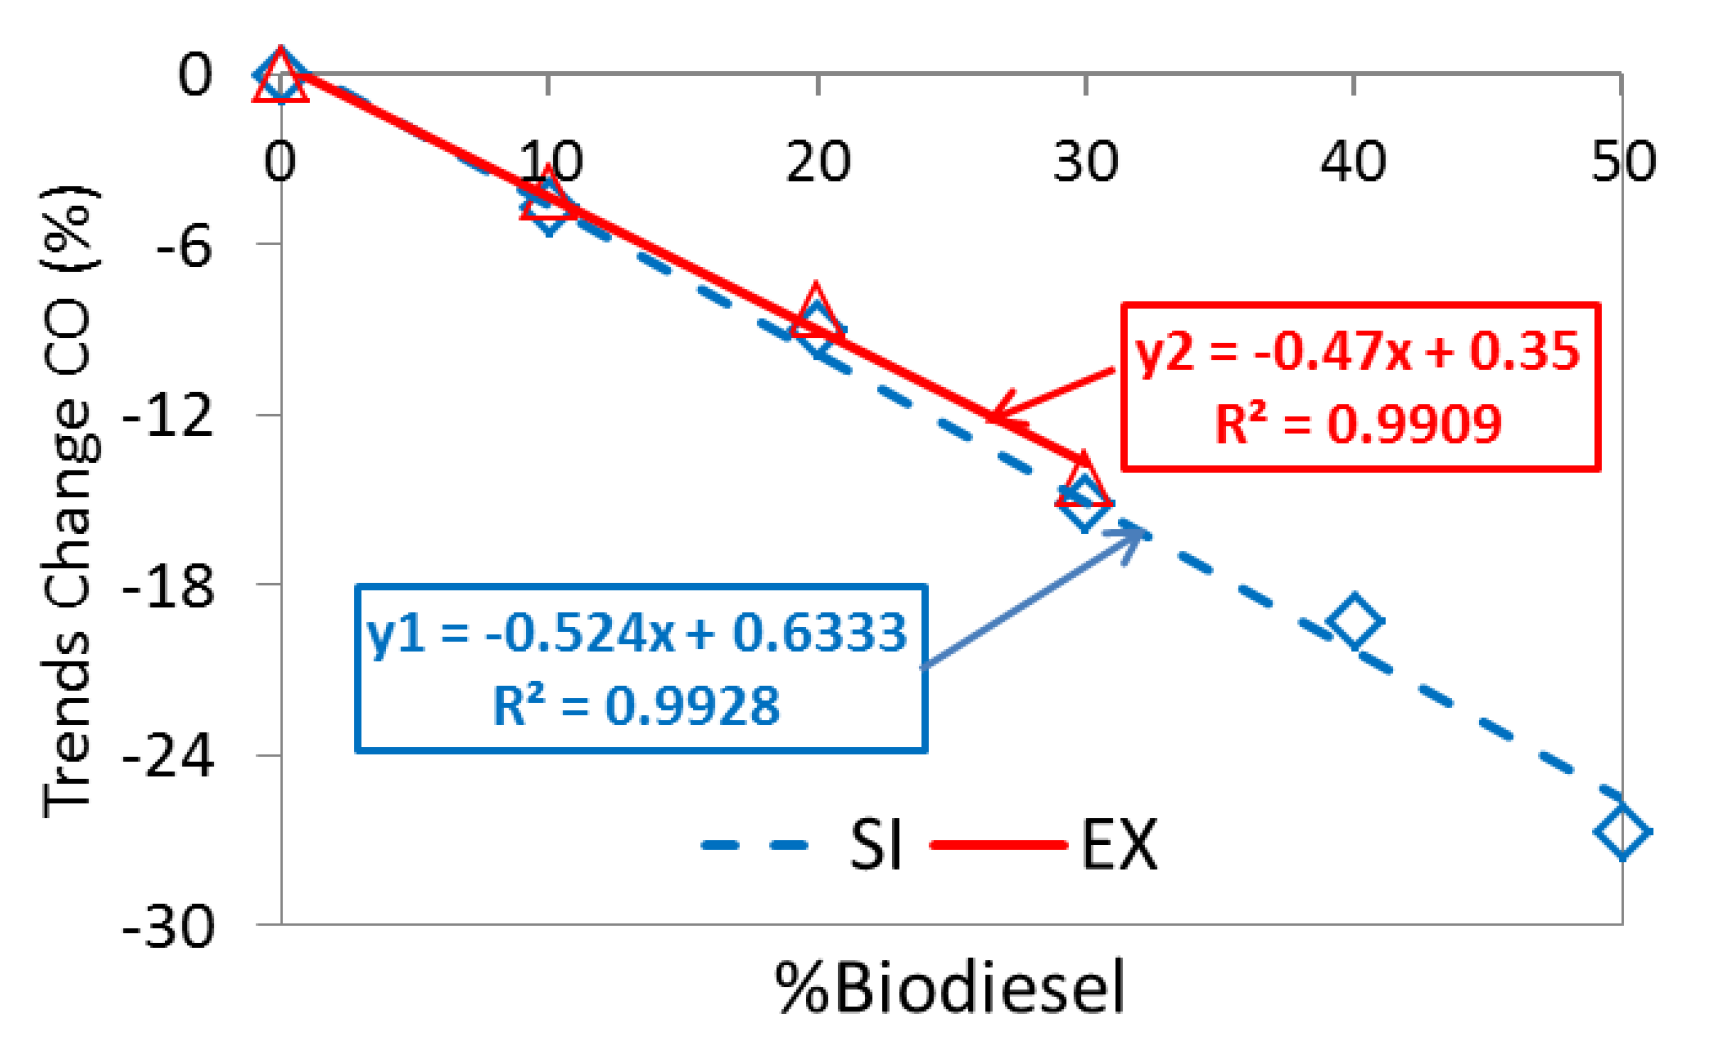
3.4.1. CO Emission

CO is a combustion product in the lack of oxygen condition. As the mixing ratio increased, the CO emissions also decreased proportionally. On average, for all testing modes, the simulation results show that CO reduction is 4.7%, 9.0%, 15.1%, 19.3%, and 26.7%, respectively, in which the experimental results also show that CO reduction is 4.2%, 8.3%, and 14.3%.
The reduction in CO emissions when using biodiesel can be explained by the oxygen component in the biodiesel fuel, which helps to reduce local areas with small A/F ratios [29,30]. Figure 12 and Figure 13 show the relationship between CO emissions and biodiesel blend ratio.
The relationship between CO emissions and biodiesel blend ratio is presented through the following function:
Simulation: y1 = −0.524x + 0.6333; Squared value (R2 = 0.9928)
Experiment: y2 = −0.47x + 0.35; Squared value (R2 = 0.9909).

3.4.2. HC Emission

HC emission is a mixture of unburnt fuel and lubricating oil. Figure 14 and Figure 15 show the relationship and trend of HC emissions according to biodiesel blending ratio. The simulation results showed that HC decreased by 8.5%, 17.6%, 25.1%, 31.5%, and 39.6% respectively, while the experimental results also showed that HC decreased by 9.1%, 18.1%, and 26.2%, respectively. The reduction in HC emission is not caused by oxygen content but also due to the higher Cetane value of biodiesel fuel compared to diesel fuel. The high value of Cetane makes it easier for the fuel to ignite and burn more completely [31].
The relationship between HC emission and biodiesel blends is shown through the following functions:
Simulation: y1 = 0.7843x + 0.7762; Squared value (R2 = 0.9971)
Experiment: y2 = 0.876x + 0.21; Squared value (R2 = 0.9966).

3.4.3. NOx Emission

Figure 16 and Figure 17 shows the relationship between NOx emissions according to biodiesel blending ratio. Simulation results show that NOx increases by 2.4%, 3.9%, 5.4%, 8.2%, and 10.4% respectively, while the experimental results also showed that NOx increased by 2.2%, 3.7%, and 5.1%. This change is due to the higher air residue coefficient of biodiesel fuel, which facilitates the formation of NOx, because the mixture of biodiesel fuel burns faster, resulting in heat. The degree of the combustion chamber is also higher. On the other hand, with the numeric value of the Cetane, the larger the length of the carbon molecular chain makes the diffusion burning more intense [32]. The result is an increase in NOx emissions.
The relationship between NOx emission and biodiesel blends is showed through the following functions:
Simulation: y1 = 0.2026x + 0.0143; Squared value (R2 = 0.9903)
Experiment: y2 = 0.168x + 0.23; Squared value (R2 = 0.9875).

3.4.4. Smoke Emission

Smoke is a typical component only found in diesel engines exhaust gas. Figure 18 and Figure 19 show the between smoke and biodiesel blending ratio. The simulation results showed that smoke decreased by 6.3%, 12.3%, 18.6%, 23.9%, and 30.1% respectively, while the experimental results also showed that smoke decreased by 5.6%, 11.4%, and 17.5%. Diffuse combustion in diesel engines is very favorable for soot formation. However, with engines using biodiesel fuel, it significantly reduces soot emissions because the oxygen element in the fuel component helps to oxidize soot more thoroughly [33,34]. Moreover, the diffuse combustion of the engine when using biodiesel is more intense, helping to over-oxidize the combustion products more thoroughly. In addition, with a higher A/F ratio and higher Cetane value, it also helps the burning process more smoothly, resulting in a sharp decrease in black smoke.
The relationship between smoke emission and biodiesel blends is showed through the following functions:
Simulation: y1 = 0.7843x + 0.7762; Squared value (R2 = 0.9971)
Experiment: y2 = 0.876x + 0.21; Squared value (R2 = 0.9993).

4. Conclusions

The simulation results have shown the evolution of the combustion process through the pressure changes in the cylinder and the heat rate. These graphs show that the combustion of the engine starts earlier when using biodiesel fuel due to the increase in the Cetane value.
Engine power decreases as the biodiesel blend ratio increases due to the lower biodiesel fuel calorific value. Meanwhile, fuel consumption increases with an increase in blend ratio. Fuel consumption for the B30 fuel decreased by 3% and decreased by 3.98% for the B50, while the fuel consumption for the B30 increased by 3.4% and by 4.98% for the B50. The power loss is due to the lower calorific value of biodiesel fuel; on the other hand, the decrease in combustion delay results in both combustion and compression.
CO, HC emissions, and smoke levels are reduced most when using B50 fuel by 26.7%, 39.6%, and 30.1%, respectively, while maximum NOx increased by 10.4%. The reason is that biodiesel fuel has an additional oxygen component and a large carbon molecular chain length that helps the burning process run smoothly; the results of this study report that the biodiesel studied could have a positive impact on efficiencies (NOx–Soot trade-offs) and GHG, especially for a heavy-duty engine application.
Fuel consumption and engine emissions have sensitive relationships with biodiesel blend ratios. When the biodiesel blending ratio changes, it changes the physicochemical properties of the fuel, thereby changing the mixture formation and combustion of the engine. In particular, the biggest benefit is to reduce some of the toxic components of the exhaust gas.

Author Contributions

Conceptualization, T.N.N. and N.X.K.; methodology, T.N.N.; software, T.N.N.; validation, T.N.N., N.X.K. and L.A.T.; formal analysis, T.N.N.; resources, T.N.N.; data curation, N.X.K.; writing—original draft preparation, T.N.N.; writing—review and editing, N.X.K.; supervision, L.A.T. All authors have read and agreed to the published version of the manuscript.

Funding

This research received no external funding.

Institutional Review Board Statement

Not applicable.

Informed Consent Statement

Not applicable.

Data Availability Statement

Not applicable.

Conflicts of Interest

The authors declare no conflict of interest.

References

  1. Belgiorno, G.; Boscolo, A.; Dileo, G.; Numidi, F.; Pesce, F.C.; Vassallo, A.; Ianniello, R.; Beatrice, C.; Di Blasio, G. Experimental Study of Additive-Manufacturing-Enabled Innovative Diesel Combustion Bowl Features for Achieving Ultra-Low Emissions and High Efficiency. SAE Int. J. Adv. Curr. Pr. Mobil. 2020, 3, 672–684. [Google Scholar] [CrossRef]
  2. Di Blasio, G.; Vassallo, A.; Pesce, F.C.; Beatrice, C.; Belgiorno, G.; Avolio, G. The Key Role of Advanced, Flexible Fuel Injection Systems to Match the Future CO2 Targets in an Ultra-Light Mid-Size Diesel Engine. SAE Int. J. Engines 2019, 12, 129–144. [Google Scholar] [CrossRef]
  3. Graboski, M.S.; McCormick, R.L. Combustion of fat and vegetable oil derived fuels in diesel engines. Prog. Energy Combust. Sci. 1998, 24, 125–164. [Google Scholar] [CrossRef]
  4. Jiaqiang, E.; Pham, M.; Zhao, D.; Deng, Y.; Le Hieu, D.; Zuo, W.; Zhuad, H.; Liuad, T.; Pengad, Q.; Zhangad, Z. Effect of different technologies on combustion and emissions of the diesel engine fueled with biodiesel: A review. Renew. Sustain. Energy Rev. 2017, 80 (Suppl. C), 620–647. [Google Scholar]
  5. Saravanan, A.; Murugan, M.; Reddy, S.M.; Parida, S. Performance and emission characteristics of variable compression ratio CI engine fueled with dual biodiesel blends of Rapeseed and Mahua. Fuel 2019, 236, 116751. [Google Scholar] [CrossRef]
  6. Mahlia, T.M.I.; Syazmi, Z.A.H.S.; Mofijur, M.; Abas, A.E.P.; Bilad, M.R.; Ong, H.C.; Silitonga, A.S. Patent landscape review on biodiesel production: Technology updates. Renew. Sustain. Energy Rev. 2020, 118, 109526. [Google Scholar] [CrossRef]
  7. Shah, A.N.; Yunshan, G.; Chao, H. Combustion and Emission Response by a Heavy duty Diesel Engine Fuelled with Biodiesel: An Experimental Study. MUET. Available online: https://journal.uet.edu.pk/ojs_old/index.php/pjeas/article/view/243 (accessed on 20 May 2021).
  8. Wu, F.; Wang, J.; Chen, W.; Shuai, S. A study on emission performance of a diesel engine fueled with five typical methyl ester biodiesels. Atmos. Environ. 2009, 43, 1481–1485. [Google Scholar] [CrossRef]
  9. Sahoo, P.; Das, L.; Babu, M.; Arora, P.; Singh, V.; Kumar, N.; Varyani, T. Comparative evaluation of performance and emission characteristics of jatropha, karanja and polanga based biodiesel as fuel in a tractor engine. Fuel 2009, 88, 1698–1707. [Google Scholar] [CrossRef]
  10. Tesfa, B.; Mishra, R.; Gu, F.; Ball, A. Combustion characteristics of CI engine running with biodiesel blends. Renew. Energy Power Qual. J. 2011, 747–754. [Google Scholar] [CrossRef]
  11. Tong, Y.D. Rice intensive cropping and balanced cropping in the Mekong Delta, Vietnam—Economic and ecological considerations. Ecol. Econ. 2017, 132, 205–212. [Google Scholar] [CrossRef]
  12. Ching-Velasquez, J.; Fernandez-Lafuente, R.; Rodrigues, R.C.; Plata, V.; Rosales-Quintero, A.; Torrestiana-Sanchez, B.; Tacias-Pascacio, V.G. Production and characterization of biodies el from oil of fi sh waste by enzymati c catalysis. Renew. Energy 2020, 153, 1346–1354. [Google Scholar] [CrossRef]
  13. Xu, C.; Nasrollahzadeh, M.; Selva, M.; Issaabadi, Z.; Luque, R. Waste-to-wealth: Biowaste valorization into valuable bio(nano)materials. Chem. Soc. Rev. 2019, 48, 4791–4822. [Google Scholar] [CrossRef] [PubMed]
  14. Paone, E.; Fazzino, F.; Pizzone, D.; Scurria, A.; Pagliaro, M.; Ciriminna, R.; Calabrò, P. Towards the Anchovy Biorefinery: Biogas Production from Anchovy Processing Waste after Fish Oil Extraction with Biobased Limonene. Sustainability 2021, 13, 2428. [Google Scholar] [CrossRef]
  15. Buyukkaya, E. Effects of biodiesel on a DI diesel engine performance, emission and combustion characteristics. Fuel 2010, 89, 3099–3105. [Google Scholar] [CrossRef]
  16. Krahl, J.; Munack, A.; Schröder, O.; Stein, H.; Bunger, J. Influence of biodiesel and different designed diesel fuels on the exhaust gas emissions and health effects. SAE Pap. 2003, 2003-01-3199. [Google Scholar] [CrossRef]
  17. Lin, B.-F.; Huang, J.-H.; Huang, D.-Y. Experimental study of the effects of vegetable oil methyl ester on DI diesel engine performance characteristics and pollutant emissions. Fuel 2009, 88, 1779–1785. [Google Scholar] [CrossRef]
  18. Users Guide-AVL Boost Version 2011.1. Available online: https://www.avl.com/boost (accessed on 20 May 2021).
  19. Theory-AVL Boost Version 2011.1. Available online: https://www.avl.com/boost (accessed on 20 May 2021).
  20. Khoa, N.X.; Lim, O.T. Comparative Study of the Effective Release Energy, Residual Gas Fraction, and Emission Characteristics with Various Valve Port Diameter-Bore Ratios (VPD/B) of a Four-Stroke Spark Ignition Engine. Energies 2020, 13, 1330. [Google Scholar] [CrossRef] [Green Version]
  21. Khoa, N.X.; Lim, O.T. Estimation of parameters affected in internal exhaust residual gases recirculation and the influence of exhaust residual gas on performance and emission of a spark ignition engine. Appl. Energy 2020, 278, 115699. [Google Scholar] [CrossRef]
  22. Jiaqiang, E.; Minh-Hieu, P.; Yuanwang, D.; Tuannghia, N.; Vinh-Nguyen, D.; Duc-Hieu, L.; Wei, Z.; Qingguo, P.; Zhiqing, Z. Effects of injection timing and injection pressure on performance and exhaust emissions of a common rail diesel engine fueled by various concentrations of fish-oil biodiesel blends. Energy 2018, 149, 979–989. [Google Scholar]
  23. Muralidharan, K.; Vasudevan, D. Performance, emission and combustion characteristics of a variable compression ratio engine using methyl esters of waste cooking oil and diesel blends. Appl. Energy 2011, 88, 3959–3968. [Google Scholar] [CrossRef]
  24. Nguyen, T.N.; Vu, K.T.; Tran, T.; Thu, H.; Le Anh, T. Effects of Injection Timing on Performance and Emissions of a Common-Rail Diesel Engine Fuelled with Waste Cooking Oil Blend. In Proceedings of the 5th AUN/SEED-Net Regional Conference on New/Renewable Energy, Hanoi, Vietnam, 26 September 2012; pp. 164–169. [Google Scholar]
  25. Ren, Y.; Huang, Z.; Miao, H.; Di, Y.; Jiang, D.; Zeng, K.; Liu, B.; Wang, X. Combustion and emissions of a DI diesel engine fuelled with diesel-oxygenate blends. Fuel 2008, 87, 2691–2697. [Google Scholar] [CrossRef]
  26. Qi, D.; Geng, L.; Chen, H.; Bian, Y.; Liu, J.; Ren, X. Combustion and performance evaluation of a diesel engine fueled with biodiesel produced from soybean crude oil. Renew. Energy 2009, 34, 2706–2713. [Google Scholar] [CrossRef]
  27. Han, D.E.J.; Deng, Y.; Zuo, W.; Qian, C.; Wu, G.; Peng, Q.; Zhang, Z. Performance enhancement of a baffle-cut heat exchanger of exhaust gas recirculation. Appl. Therm. Eng. 2018, 134, 86–94. [Google Scholar]
  28. Rashedul, H.K.; Masjuki, H.H.; Kalam, M.A.; Ashraful, A.M.; Rahman, S.M.A.; Shahir, S.A. The effect of additives on properties, performance, and emission of biodiesel fuelled compression ignition engine. Energy Convers. Manag. 2014, 88, 348–364. [Google Scholar] [CrossRef]
  29. Kousoulidou, M.; Fontaras, G.; Ntziachristos, L.; Samaras, Z. Biodiesel blend effects on common-rail diesel combustion and emissions. Fuel 2010, 89, 3442–3449. [Google Scholar] [CrossRef]
  30. Zhang, Z.E.J.; Deng, Y.; Pham, M.; Zuo, W.; Peng, Q.; Yin, Z. Effects of fatty acid methyl esters proportion on combustion and emission characteristics of a biodiesel fueled marine diesel engine. Energy Convers. Manag. 2018, 159, 244–253. [Google Scholar] [CrossRef]
  31. Gnanasekaran, S.; Saravanan, N.; Ilangkumaran, M. Influence of injection timing on performance, emission and combustion characteristics of a DI diesel engine running on fish oil biodiesel. Energy 2016, 116, 1218–1229. [Google Scholar] [CrossRef]
  32. Bhaskar, K.; Nagarajan, G.; Sampath, S. Optimization of FOME (fish oil methyl esters) blend and EGR (exhaust gas recirculation) for simultaneous control of NOx and particulate matter emissions in diesel engines. Energy 2013, 62, 224–234. [Google Scholar] [CrossRef]
  33. Godiganur, S.; Murthy, C.S.; Reddy, R.P. Performance and emission characteristics of a Kirloskar HA394 diesel engine operated on fish oil methyl esters. Renew. Energy 2010, 35, 355–359. [Google Scholar] [CrossRef]
  34. Nguyen, T.N.; Pham, P.M.; Tuan, L.A. Spray, combustion, performance and emission characteristics of a common rail diesel engine fueled by fish-oil biodiesel blends. Fuel 2020, 269, 117108. [Google Scholar] [CrossRef]
Figure 1. Diesel engine AVL 5402 model.
Energies 14 02986 g001
Figure 2. Diagram of a single-cylinder engine test strip. 1 INCA PC; 2 PUMA PC; 3 INDICATING PC; 4 DYNO torque control cabin; 5 Engine speed signal; 6 Engine torque; 7 Control throttle position signal; 8 Throttle position sensor; 9 Pressure and temperature sensor; 10 ECU; 11 Fuel balance; 12 Opacimater; 13 Temperature sensor.
Energies 14 02986 g002
Figure 3. External characteristic of engine.
Energies 14 02986 g003
Figure 4. Comparisons between simulation results and experimental of power. (a) Speed at 1400 (rpm); (b) Speed at 2200 (rpm).
Energies 14 02986 g004
Figure 5. Comparisons between simulation results and experimental of fuel consumption. (a) Speed at 1400 (rpm); (b) Speed at 2200 (rpm).
Energies 14 02986 g005
Figure 6. Evolution of cylinder pressure of fuel B0, B10, B20, B30, B40, and B50.
Energies 14 02986 g006
Figure 7. Variation of heat release rate values with respect to crank angle.
Energies 14 02986 g007
Figure 8. Relationship between capacity and biodiesel blending ratio of simulation (SI) and experiment (EX).
Energies 14 02986 g008
Figure 9. Trend of capacity changes according to biodiesel blend ratio of simulation (SI) and experiment (EX).
Energies 14 02986 g009
Figure 10. Relationship between BSFC and biodiesel blending ratio of simulation (SI) and experiment (EX).
Energies 14 02986 g010
Figure 11. Trend of changing BSFC according to biodiesel blend ratio of simulation (SI) and experiment (EX).
Energies 14 02986 g011
Figure 12. Relationship between CO emissions and biodiesel blending ratio of simulation (SI) and experiment (EX).
Energies 14 02986 g012
Figure 13. Trend of changes CO emissions according to biodiesel blend ratio of simulation (SI) and experiment (EX).
Energies 14 02986 g013
Figure 14. Relationship between HC emissions and biodiesel blending ratio of simulation (SI) and experiment (EX).
Energies 14 02986 g014
Figure 15. Trend of changes HC emissions according to biodiesel blend ratio of simulation (SI) and experiment (EX).
Energies 14 02986 g015
Figure 16. Relationship between NOx emissions and biodiesel blending ratio of simulation (SI) and experiment (EX).
Energies 14 02986 g016
Figure 17. Trend of changes NOx emissions according to biodiesel blend ratio of simulation (SI) and experiment (EX).
Energies 14 02986 g017
Figure 18. Relationship between smoke and biodiesel blending ratio of simulation (SI) and experiment (EX).
Energies 14 02986 g018
Figure 19. Trend of changes smoke according to biodiesel blend ratio of simulation (SI) and experiment (EX).
Energies 14 02986 g019
Table 1. NOx formation reactions.
RateStoichio Metry Equation   k i = k 0 , i . T a . e T A i T
r1N2+ O = NO + Nr1 = k1.CN2.CO
r2O2+ N = NO + Or2 = k2.CO2.CN
r3N + OH = NO + Hr3 = k3.COH.CN
r4N2O + O = NO + NOr4 = k4.CN2O.CO
r5O2+ N2= N2O + Or5 = k5.CO2.CN2
r6OH + N2= N2O + Hr6 = k6.COH.CN2
where ri: reactions rates (mole/cm3s); Ci: molar concentrations under equilibrium conditions (mole/cm3); ki: reactions constant; T: reaction temperature.
Table 2. CO formation reactions.
Reactions RatesStoichio MetryRate
r7CO + OH = CO2+ H r 7 = 6.76 × 10 10 × e T 1102.0 × C C O × C O H
r8CO2+ O = CO + O2 r 8 = 2.51 × 10 12 × e 24055.0 T × C C O × C O 2
Table 3. Properties of test fuel.
PropertyUnitMethodB0B10B20B30B40B50B100
Heating value MJ/kgASTM
D240
42.7642.2641.8441.2941.0341.2937.58
Cetane value ASTM
D613
49505152535456
Density at 15 °C kg/m3ASTM
D1298
838840845848852857866
Kinematic viscosity at 40 °C ASTM
D445
3.223.313.473.563.673.764.40
Flash point cStASTM
D93
677175808489142
Sulfur content ppmASTM
D5453
42843043343643944126
Water content ppmASTM
D6304
628496110122136215
Table 4. Chemical composition of fuel B100.
Chemical CompoundRatio (% Volume)
C15H30O20.0107
C17H34O20.146
C19H38O20.0655
C19H36O20.399
C19H34O20.376
C19H32O20.0028
Table 5. Specifications of the engine.
NoParameterValue
1Cylinder diameter (D)85 mm
2Stroke (S)90 mm
3Displacement volume510.7 cm3
4Compression ratio 17:1
5Rate power/speed9/3200 kW/rpm
Table 6. General data controller model AVL-5402 engine.
NoParameterParameterUnit
1Type of engine4 Stroke
2Environmental pressure1at
3Environment temperature25°C
4Theoretical A/F ratio14.7
5Fire modelAVL MCC
6Number of injuction holes5
7Injuction hole diameter0.17mm
8Injection pressure600bar
9Early Injector angle at 1400 (rpm)14degrees
10Early Injector angle at 2200 (rpm)18degrees
Table 7. Fuel injection at engine loads.
Speed
(rpm)
Fuel Mass Injection, gct (g)
75% Load50% Load25% Load
14000.01730.01150.00675
22000.01750.012250.00715
Table 8. Injection duration.
Speed (rpm)Consumption Fuel
(g/cycle)
B0B10B20B30B40B50
Injection Duration (ms)
14000.00675361366370378383388
0.0115465481484488494501
0.0173585612641644648653
22000.00715372376378387391394
0.01225480497503508513519
0.0175581607636639643648
Table 9. Comparisons parameters of combustion process 6 type of fuel.
Combustion ParametersUnitB0B10B20B30B40B50
Cylinder pressure max MPa75.4675.2574.9174.5274.3174.08
Pressure angle max after TDC°TK3.293.022.802.672.232.01
Speed of increasing pressure maxMPa/°TK5.685.675.605.585.535.48
Combustion starting angle before TDC°TK5.205.285.355.485.505.58
The rate of heat release maxkJ/°TK37.536.736.035.334.834.4
Heat release angle max before TDC°TK0.50.60.70.851.01.1
Publisher’s Note: MDPI stays neutral with regard to jurisdictional claims in published maps and institutional affiliations.

