Article

Prediction of Air Pressure Change Inside the Chamber of an Oscillating Water Column–Wave Energy Converter Using Machine-Learning in Big Data Platform

Korea Institute of Science and Technology Information (KISTI), Yuseong-gu, Daejeon 34141, Korea
*
Author to whom correspondence should be addressed.
Energies 2021, 14(11), 2982; https://doi.org/10.3390/en14112982
Submission received: 31 March 2021 / Revised: 17 May 2021 / Accepted: 18 May 2021 / Published: 21 May 2021
(This article belongs to the Section A3: Wind, Wave and Tidal Energy)

Abstract

:
Wave power is an eco-friendly power generation method. Owing to the highly volatile nature of wave energy, the application of prediction techniques for power generation, failure diagnosis, and operational efficiency plays a key role in the successful operation of wave power plants (WPPs). To this end, we propose the following approaches: (i) deriving the correlation between highly volatile data such as wave height data and sensor data in an oscillating water column (OWC) chamber; (ii) development of an optimal training model capable of accurate prediction of the state of the wave energy converter (WEC) based on the collected sensor data. In this study, we developed a big data analysis system that can utilize the machine learning framework in KNIME (an open analysis platform), and to enable smart operation, we designed a training model using a digital twin of an OWC–WEC that is currently in operation. Using various machine learning models, the pressure of the OWC chamber was predicted, and the results obtained were tested and evaluated to confirm its validity. Furthermore, the prediction performance was comparatively analyzed, demonstrating the excellent performance of the proposed CNN-LSTM-based prediction model.

1. Introduction

In recent years, the problems of global warming, environmental pollution, and depletion of natural resources caused by the use of fossil fuel-based energy, and the safety problem of nuclear energy have triggered the need for an alternative and permanent energy source, drawing attention toward renewable energy sources such as ocean energy, solar energy, and wind power. Against this backdrop, the South Korean government, in line with its incentives and planned electric power target, has announced its long-term plan to increase the proportion of renewable energy, which is currently 6% of the total power generation portfolio, to at least 20% by 2030 and 30% by 2040 [1]. Ocean energy, an attractive renewable energy source, generates electricity by utilizing tidal power, wave power, ocean current, and temperature differences of the ocean. Among these methods of power generation, wave energy generation is an environmentally friendly method of obtaining energy from the ocean, which accounts for 71% of the earth’s surface. Once a wave power plant (WPP) is installed, it can serve as a revolutionary energy source for countries by the coast, such as South Korea, owing to its low maintenance and operation costs [2]. Structures for wave energy converters (WECs) can be classified into three categories according to the conversion method of kinetic energy from ocean waves: (i) overtopping devices, (ii) wave-activated bodies, and (iii) oscillating water columns (OWC). Among these three structures, OWCs are designed to generate a reciprocating air flow through the turbines, thereby driving generators to produce energy. Although its conversion efficiency is low, the structure of the power generation system is separated from seawater, resulting in high reliability and safety as well as advantages in terms of maintenance, which have been reported in the related literature [3,4,5]. Globally, some representative OWC plants include the KVAENER plant in Norway [6], LIMPET plant in Scotland [7,8], Pico plant in Portugal [9,10], Mutriku plant in Spain [11], and Yongsu plant in South Korea. In South Korea, the West Sea around Jeju Island, in particular, has been reported for its high wave energy, facilitating the use of a WEC [12]. This is because, in the winter season, the northwest seasonal winds dominate under the specific pressure patterns such as the west-high-east-low pattern due to the development of Siberian high pressure, and the summer season is characterized by southeast or southwest seasonal winds. In winter, the wave energy is high due to the influence of the continental climate, with the highest average wave energy density being observed in December. During the typhoon season of August and September, the variation and the peak-to-average ratio of wave energy were the highest [13]. The construction of the Yongsu WPP, 1.2 km away from Jeju Island, was completed in July 2016 as a fixed-type OWC–WEC and has been operational since then. In general, the electric power extracted from the wave energy of an OWC–WEC is in the range of 60–500 kW, and the Yongsu WPP is currently undergoing tests with a target power generation of 500 kW [14]. The wave energy is converted into air flow generated by the oscillation of the water level inside the OWC air chamber, driving the air turbines and recovering electrical energy. The energy efficiency is maximized by resonance when the frequency of the incoming waves is equal to the natural frequency of the air chamber. The pressure prediction of the OWC chamber is not only the most direct parameter for improving the energy efficiency, but is also a necessary technology to prevent failure at instantaneous high pressure, which is a major issue in the operation of the Yongsu WPP generator.
The purpose of this study is to predict the pressure inside the OWC chamber, which will enable the control of the generator turbines, thereby maximizing electric power generation and preventing failure from instantaneous peak pressure. Based on the sensor data collected from the OWC–WEC, we designed a prediction model applying data preprocessing, including data correlation and machine learning, and verified the validity of the pressure prediction results in the OWC chamber. This paper is organized as follows: Section 2 outlines the related works that present an overview of OWC–WEC, and the research trend of machine learning used in OWC–WEC. Section 3 outlines the big data platform based on the HPC environment for artificial intelligence (AI) analysis of OWC–WEC datasets and the design of the OWC pressure prediction model. The datasets were defined, and significant features were derived from parameters with high correlation through correlation analysis. The section discusses a method of constructing an input dataset suitable for machine learning using data ingestion, correlation analysis of input data, data preprocessing, and noise removal. The prediction model and validation are detailed in this section. Section 4 highlights the superiority of the proposed model by comparing its performance with those of existing analysis models. Finally, Section 5 presents the conclusion and expected implications of the findings of this study and future research plans.

2. Background

2.1. OWC–WEC

An OWC–WEC converts wave energy into mechanical energy and subsequently converts mechanical energy into electrical energy. Figure 1 presents an overview of Yongsu OWC–WEC: (a) the study site of the OWC–WEC located 1.2 km offshore in front of Yongsu-ri in the region of Jeju Island, (b) schematics of the internal structure of the OWC–WEC, (c) arrangement for WPP operation, and (d) position of sensors in the turbine. The main characteristics of Yongsu OWC–WEC are presented in Table 1. The up-down motion of the air inside the OWC chamber is due to waves, leading to the reciprocating flow of air between the inside and outside of the chamber.
The reciprocating air flow passes through the blade and rotates the turbine, thereby converting the wave energy into mechanical energy. The mechanical energy transferred to the turbine is then converted into electrical energy through the WEC. However, owing to the characteristics of renewable energy, the generated voltage is not constant, and the transferred energy is converted to electrical energy with a constant voltage and frequency through a power conversion system (PCS). That is, because the output of the WEC is electrical energy with varying voltage and frequency, the PCS is essential for operating the WEC in connection with power grids [15,16].

2.2. Machine-Learning (ML) in OWC–WEC

ML is a subset of AI; it uses an algorithm in which data are analyzed and learned, and decisions and predictions are made on the output of new input data. ML can be categorized into supervised and unsupervised learning according to the learning type. Supervised learning uses labeled data that includes both input and output data for learning. Using the input and output of the training data, the function of the applicable system is inferred, and when there is a new input, the function is used to predict the corresponding output. Supervised learning can be categorized into regression, which is a prediction for continuous output data, and classification, which is a prediction for discontinuous output data. Unsupervised learning uses unlabeled data with only input data, and clustering is typically used in learning in which data with similar features are grouped using the features of the input data. For the pressure prediction in this study, a regression analysis algorithm that infers continuous output data for continuous input data was considered suitable. Representative regression analysis algorithms include linear regression (LR), support vector regression (SVR), decision regression tree (DT), random forest regression (RF), multilayer perception (MLP), and deep learning (DL). Algorithms frequently used in DL include convolutional neural networks (CNNs), recurrent neural networks (RNNs), and long short-term memory (LSTM) [17,18,19]. With the aim of achieving the operational efficiency of WPPs, several studies have developed prediction models for wave energy, OWC chamber pressure, and electric power. There are three categories of methodologies: statistics-based modeling, machine learning-based modeling, and DL-based modeling, which are described in Table 2. In the statistical model category, wave energy is predicted by applying an autoregressive model [20]. The results showed that the temporal resolution of the observed data affected the performance of the prediction model. In addition, wave energy is predicted by applying a LR [21]. This method mainly uses general LR with a simple design and removes unnecessary parameters to improve the stability of the predictive performance. However, this method has a disadvantage in that it cannot predict the irregularity of the time-series. In the machine-learning-based modeling category, neural networks were used to predict the wave energy of the WPP and the pressure in the chamber [22,23,24]. They acquired data from a real WPP during operation and performed short-term predictions to increase operational efficiency. In addition, by applying autoregressive modeling and NNs and performing predictions considering the characteristics of the time series, the performance stability improved. However, in the existing machine-learning method, severe overfitting occurs when the variation of the time-series increases or the amount of data increases, and overfitting makes accurate prediction difficult. Recently, predictive studies of the wave energy and electrical energy of WPPs have been conducted using DL to address some of the existing limitations. Using data from an actual WPP in operation and sensors, higher performance was achieved than the existing prediction method. The DL method was used to reduce randomness and noise from sensor data and extract features suitable for prediction. This method can automatically extract and model key features, even in cases of large amounts of data and data with complex attributes [25,26]. However, there has been no prior research investigating the prediction of temporal information in time-series data of the pressure in the chamber and the spatial correlation between parameters. In most studies, general sections were selected from time-series data, and temporal information was modeled for prediction, and prediction methods without consideration of temporal information were used. Therefore, in an environment highly subject to volatile energy, such as a WPP, a modeling and learning method that takes into account irregular temporal information and spatial information of parameters is required.

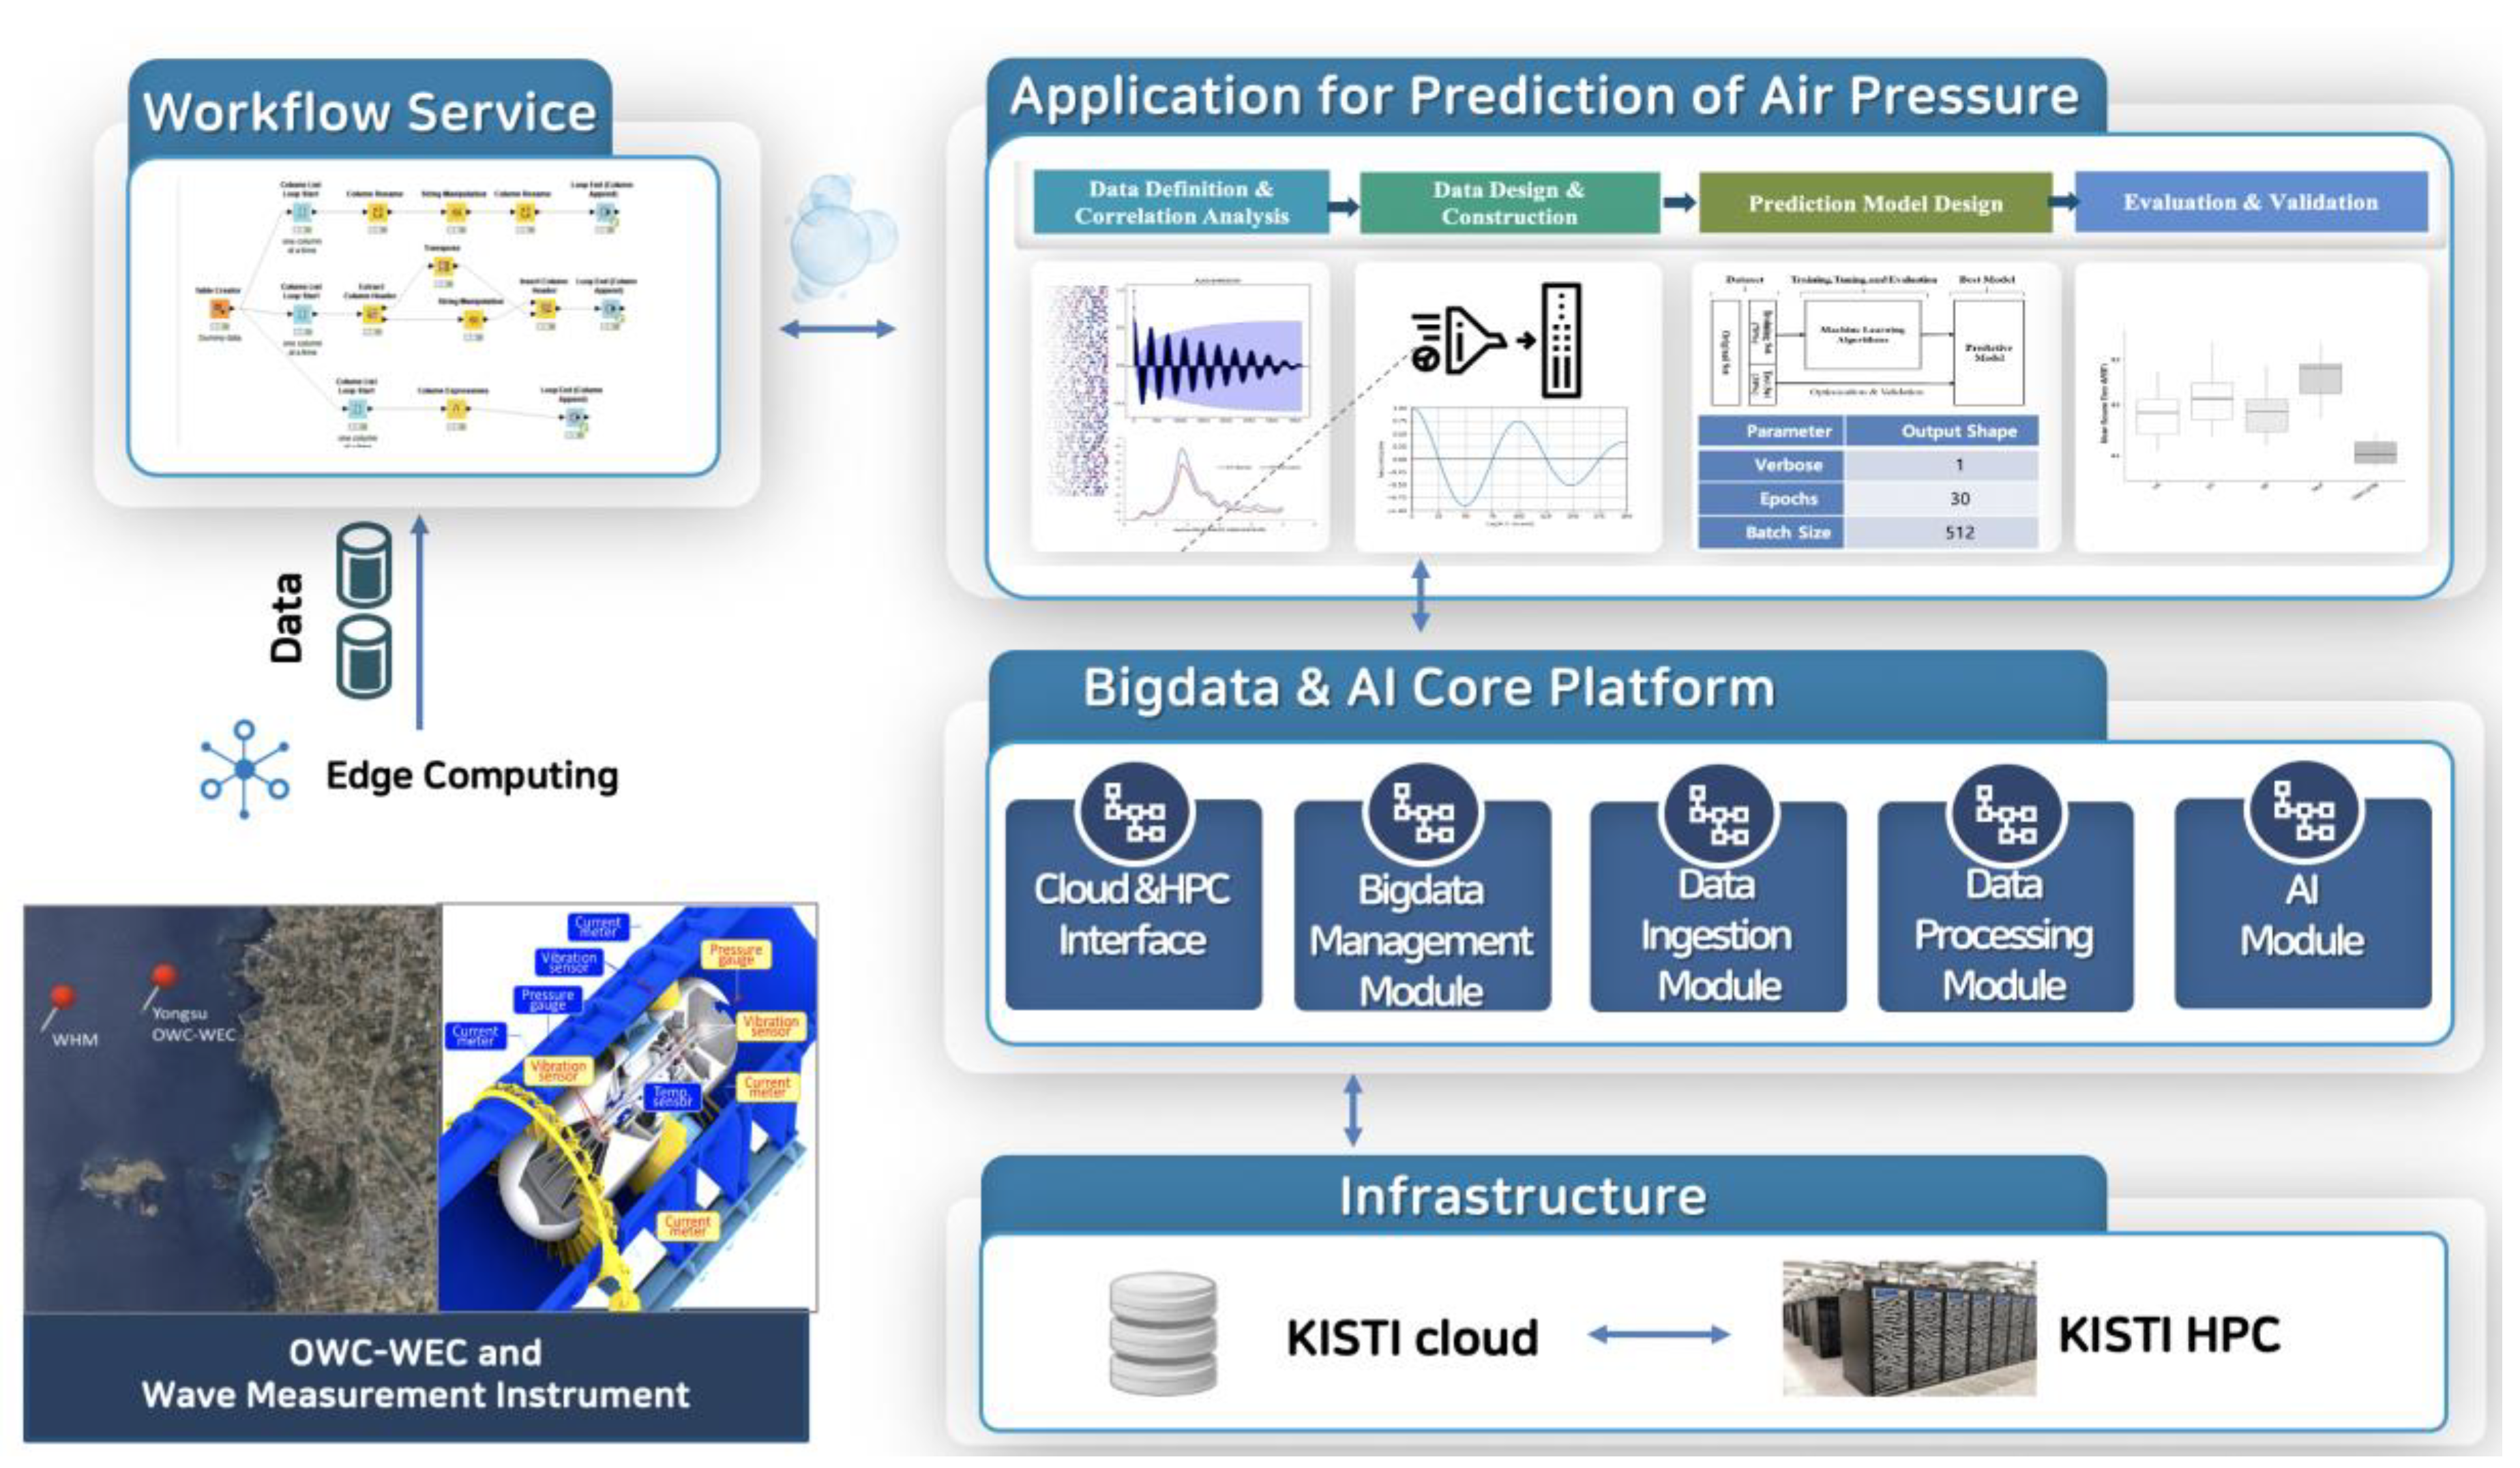
3. Materials and Methods

In this study, a platform for large-scale sensor data ingestion and support of time-consuming AI calculations was developed. The structure of the high-performance data analysis and processing platform based on big data is illustrated in Figure 2 and each key element can be described as follows:
  • Workflow Service: Supports blend tools from WEC domains with big data and AI core platform in a single workflow, including scripting in R and Python and ML
  • Application: Provides functions such as correlation analysis, real-time data monitoring, data browsing, and result analysis, and monitoring.
  • Big data and AI Core Platform: Supports cloud and HPC user interface, big data management module, data ingestion module, and AI module.
  • Infrastructure: Provide KISTI cloud and KISTI HPC resource
To develop a training model based on real data, external wave data of the OWC wave power generation system and sensor data generated from the OWC wave height meter (WHM) were acquired. Data preprocessing, such as filtering, was performed with the acquired raw data, and the datasets were classified into training sets and test sets, which were used to develop the training model. This section describes the entire process of developing a pressure prediction model. The pressure prediction model was developed using the proposed big data and AI platform, to support real-time sensor big data ingestion and analysis. Figure 3 shows a schematic of the overall process for the development of a pressure prediction model.

3.1. Data Definition and Correlation Analysis

For data ingestion, WHM and OWC–WPP data were selected as follows: (i) WHM data (e.g., wave height, wave period, wave direction) and (ii) OWC–WPP data (e.g., flow, pressure, and power). To examine the effect of WHM data, we performed a correlation analysis between the wave height data measured from WHM for 48 h (see Table 3, Figure 4) and OWC–WPP data (see Table 4, Figure 5).
Figure 6 shows the workflow for data preprocessing and correlation analysis. To preprocess data for correlation analysis, data normalization was performed. The simulated waves nearshore (SWAN) model [27] and statistical linear correlation [28] were used for the analysis. The wave energy and pressure data were based on 30 min intervals, considering the minimum interval of the measured wave energy. Figure 7 shows the results of the analysis with 30 min intervals over the course of 48 h. The SWAN model was used to analyze the impact of wave height sensors and WPPs, which are separated in the distance. The results showed that a time delay and deviation occurred because of the distance of 1 km between the Yongsu WPP and WHM, making it difficult to utilize the wave height data for the target WPP in this study.
The utilization of wave height data is limited owing to the time-delay problem, considering the 30 min intervals of the measured wave height. The reason for using OWC and WEC data is that, as shown in Figure 7, OWC generates pressure energy from the actions of wave energy, and the pressure is converted into energy such as flow velocity to operate the turbines; thus, it is judged that there is a close correlation between the two sets of data.
In order to analyze the pressure change due to air flow in both directions in the OWC chamber, the data samples were collected every second; the minimum interval between OWC data and the wave height data with measured electrical power. Table 5 shows the result of correlation analysis between OWC data and WEC data acquired in 1 s intervals for 48 h. From the analysis, there is a high positive correlation between the pressure data of OWC and WEC data, such as electrical energy. Therefore, it can be assumed that the OWC chamber pressure is one of the key parameters for the operation of WEC; thus, data prediction using machine learning can be considered instrumental in the operation of OWC–WEC.

3.2. Dataset Design and Construction

3.2.1. Data Preprocessing

To prepare the input data, features are processed and generated from the given raw data. Data preprocessing requires the creation of features from domain knowledge, which refers to creating or selecting a column (feature) of the data table for ML. This type of feature engineering has a large impact on the model performance, and the preprocessing techniques outlined in Table 6 are used to generate the training data. Because the prediction model generally operates on the assumption of using correct input data, a data cleansing method for generating training data is derived through the analysis of WHM data, internal pressure data, and power generation data. First, in order to perform a correlation analysis of features, processing to match the interval between sensor data with different measurement periods and preprocessing to match the format were performed. A dataset building plan was established in which the target feature (pressure) was selected, and based on the target feature, correlation analysis by sensor data feature was performed to select the input feature.
The preprocessing workflow for correlation analysis was established as shown in Figure 8, and the wave height data were read from the folder to obtain a file list, and input data were considered through this process. For data analysis considering time-series, nodes were created for the input and processing of the time-series and period of data, and nodes for constructing the applicable data were additionally designed to support processing such as filtering, merging, and column change of data. To resolve the problem of imbalanced data in which the proportion of data for each class is not uniform but biased, the performance of the classification algorithm is improved. The reason for identifying unbalanced classification as a problem can affect the performance of ML algorithms, so the skew may not be significant. Oversampling and undersampling are used to adjust the class distribution of a dataset. In particular, the data collected by the sensors of the current wave power system have unwanted noise due to the effect of wave energy, and the graph is not flattened, as shown in Figure 9a. To utilize the water level prediction data in a flow analysis model, noise needs to be removed to flatten the graph. In this study, Equation (1) was used to flatten the data by removing noise from the OWC chamber sensor data.
| H ( j ω ) | = 1 1 + ( ω ω c ) 2 n .
The Butterworth low-pass filter generates no ripples in the passband and attenuates the unwanted frequencies outside this band. The Butterworth low-pass filter selects a transfer function so that the magnitude response curve can be as flat as possible in the passband of the filter; thus, this filter is known to have a maximally flat magnitude. The result of flattening by applying a Butterworth low-pass filter to signals containing noise is shown in Figure 9b.

3.2.2. Dataset Construction

Autocorrelation analysis was performed to construct datasets reflecting the autocorrelation of the time series, as shown in Figure 10. Autocorrelation is a function representing the correlation between values taken at two time points of a random signal and helps to extract the principal components from time-series data. As a result of the autocorrelation analysis, a strong negative correlation of −0.9 at 2.5 s intervals and a positive correlation at 0.75 with 5 s intervals were discovered. Therefore, the target time for prediction was determined to be 2.5 s, which has a high correlation, and datasets were constructed accordingly.
The datasets for ML can be largely classified into training sets and test sets, and if a sufficient volume of data is acquired, the datasets can be classified into training sets, test sets, and validation sets, additionally enabling validation of data. Each type of dataset can be described as follows: (i) training sets to learn data patterns from raw data; (ii) test sets to test the model performance by running the model according to an actual scenario; and (iii) validation sets for tuning and evaluation. In this prediction model, training sets for OWC pressure prediction were constructed based on the window sliding of the correlation, as shown in Figure 11.

3.3. Predictive Model Design

Recently, the CNN-LSTM, an algorithm that has been used in time-series prediction has attracted attention owing to its excellent prediction performance. It extracts the spatial features of surrounding data by sliding a filter that performs a convolution operation in the convolution layer over a sequence [8]. Subsequently, LSTM, an algorithm optimized for grasping time information, is applied, and prediction is performed by incorporating temporal features. The architecture of CNN-LSTM can have various designs according to the type of layer constituting the network and tuning of parameters. CNN-LSTM consists of a convolutional layer, pooling layers, LSTM layers, and dense layers. The number of filters, kernel size, and the number of strides can be tuned for each layer. Tuning these parameters can affect the learning rate and performance according to the features of the training data. The changes in performance can be examined by varying these parameters. The identification of features of the input data plays a key role in the development of an optimal architecture for the prediction of OWC chamber water level with parameter tuning. Therefore, after predicting the OWC chamber water level through hyperparameter tuning, it was designed to select one value with the smallest error in the last fully connected layer.
Hyperparameter tuning refers to adjusting (tuning) hyperparameters to find the optimal training method by evaluating the model performance of the model with validation sets. The datasets with the highest prediction accuracy were those with all outliers removed. Table 7 lists the hyperparameters determined by hyperparameter tuning. The larger the epoch, the better the prediction result, but if it is too large, overfitting can occur leading to a significantly lower learning rate. Therefore, the size of the epoch was fixed at an optimal value of 30, and the number of units of the convolution layer, the number of layers, filter size, pooling size, and batch size were empirically determined.
Table 8 details the overall architecture of the CNN-LSTM proposed herein. The parameters of all layers are listed, including the LSTM layer; these include the number of filters in each convolution layer, size of the convolution layer, and the number of strides.

3.4. Evaluation and Validation

3.4.1. Training Evaluation

When training the prediction model with the training datasets, the training error was calculated using the loss function, and the weights and bias were modified to minimize the training error. Therefore, the training error is a highly useful indicator of the current state of the prediction model. As a general training error function, the mean squared error is used, which is given by
M S E = 1 n i = 1 n ( y i t i ) 2 .

3.4.2. Validation

After the completion of the training process, the previously discussed process was repeated in the same manner for the validation datasets. The error rate for a new sample is called the generalization error, and the generalization error is estimated by evaluating the prediction model with the validation sets. This estimate provides information about the performance of the predictive model for new data. Appropriately obtaining the generalization error and comparing it with the training error is crucial for performing performance comparisons. A small training error but a large generalization error indicates that the prediction model is overfitted to the training data. The total number of datasets used in this study was 700,000, which cannot be considered large. When the validation sets are too small, the model performance cannot be evaluated accurately, and the selection of the optimal model may be incorrect [7]. Cross-validation was performed to resolve this problem.

3.4.3. Evaluation of Prediction Results (Prediction Precision)

Root mean square error is a measure used to represent the difference between the predicted and actual values of the model. The RMSE for representing the prediction precision is given by
R M S E = 1 n i = 1 n ( y i t i ) 2 .

4. Results

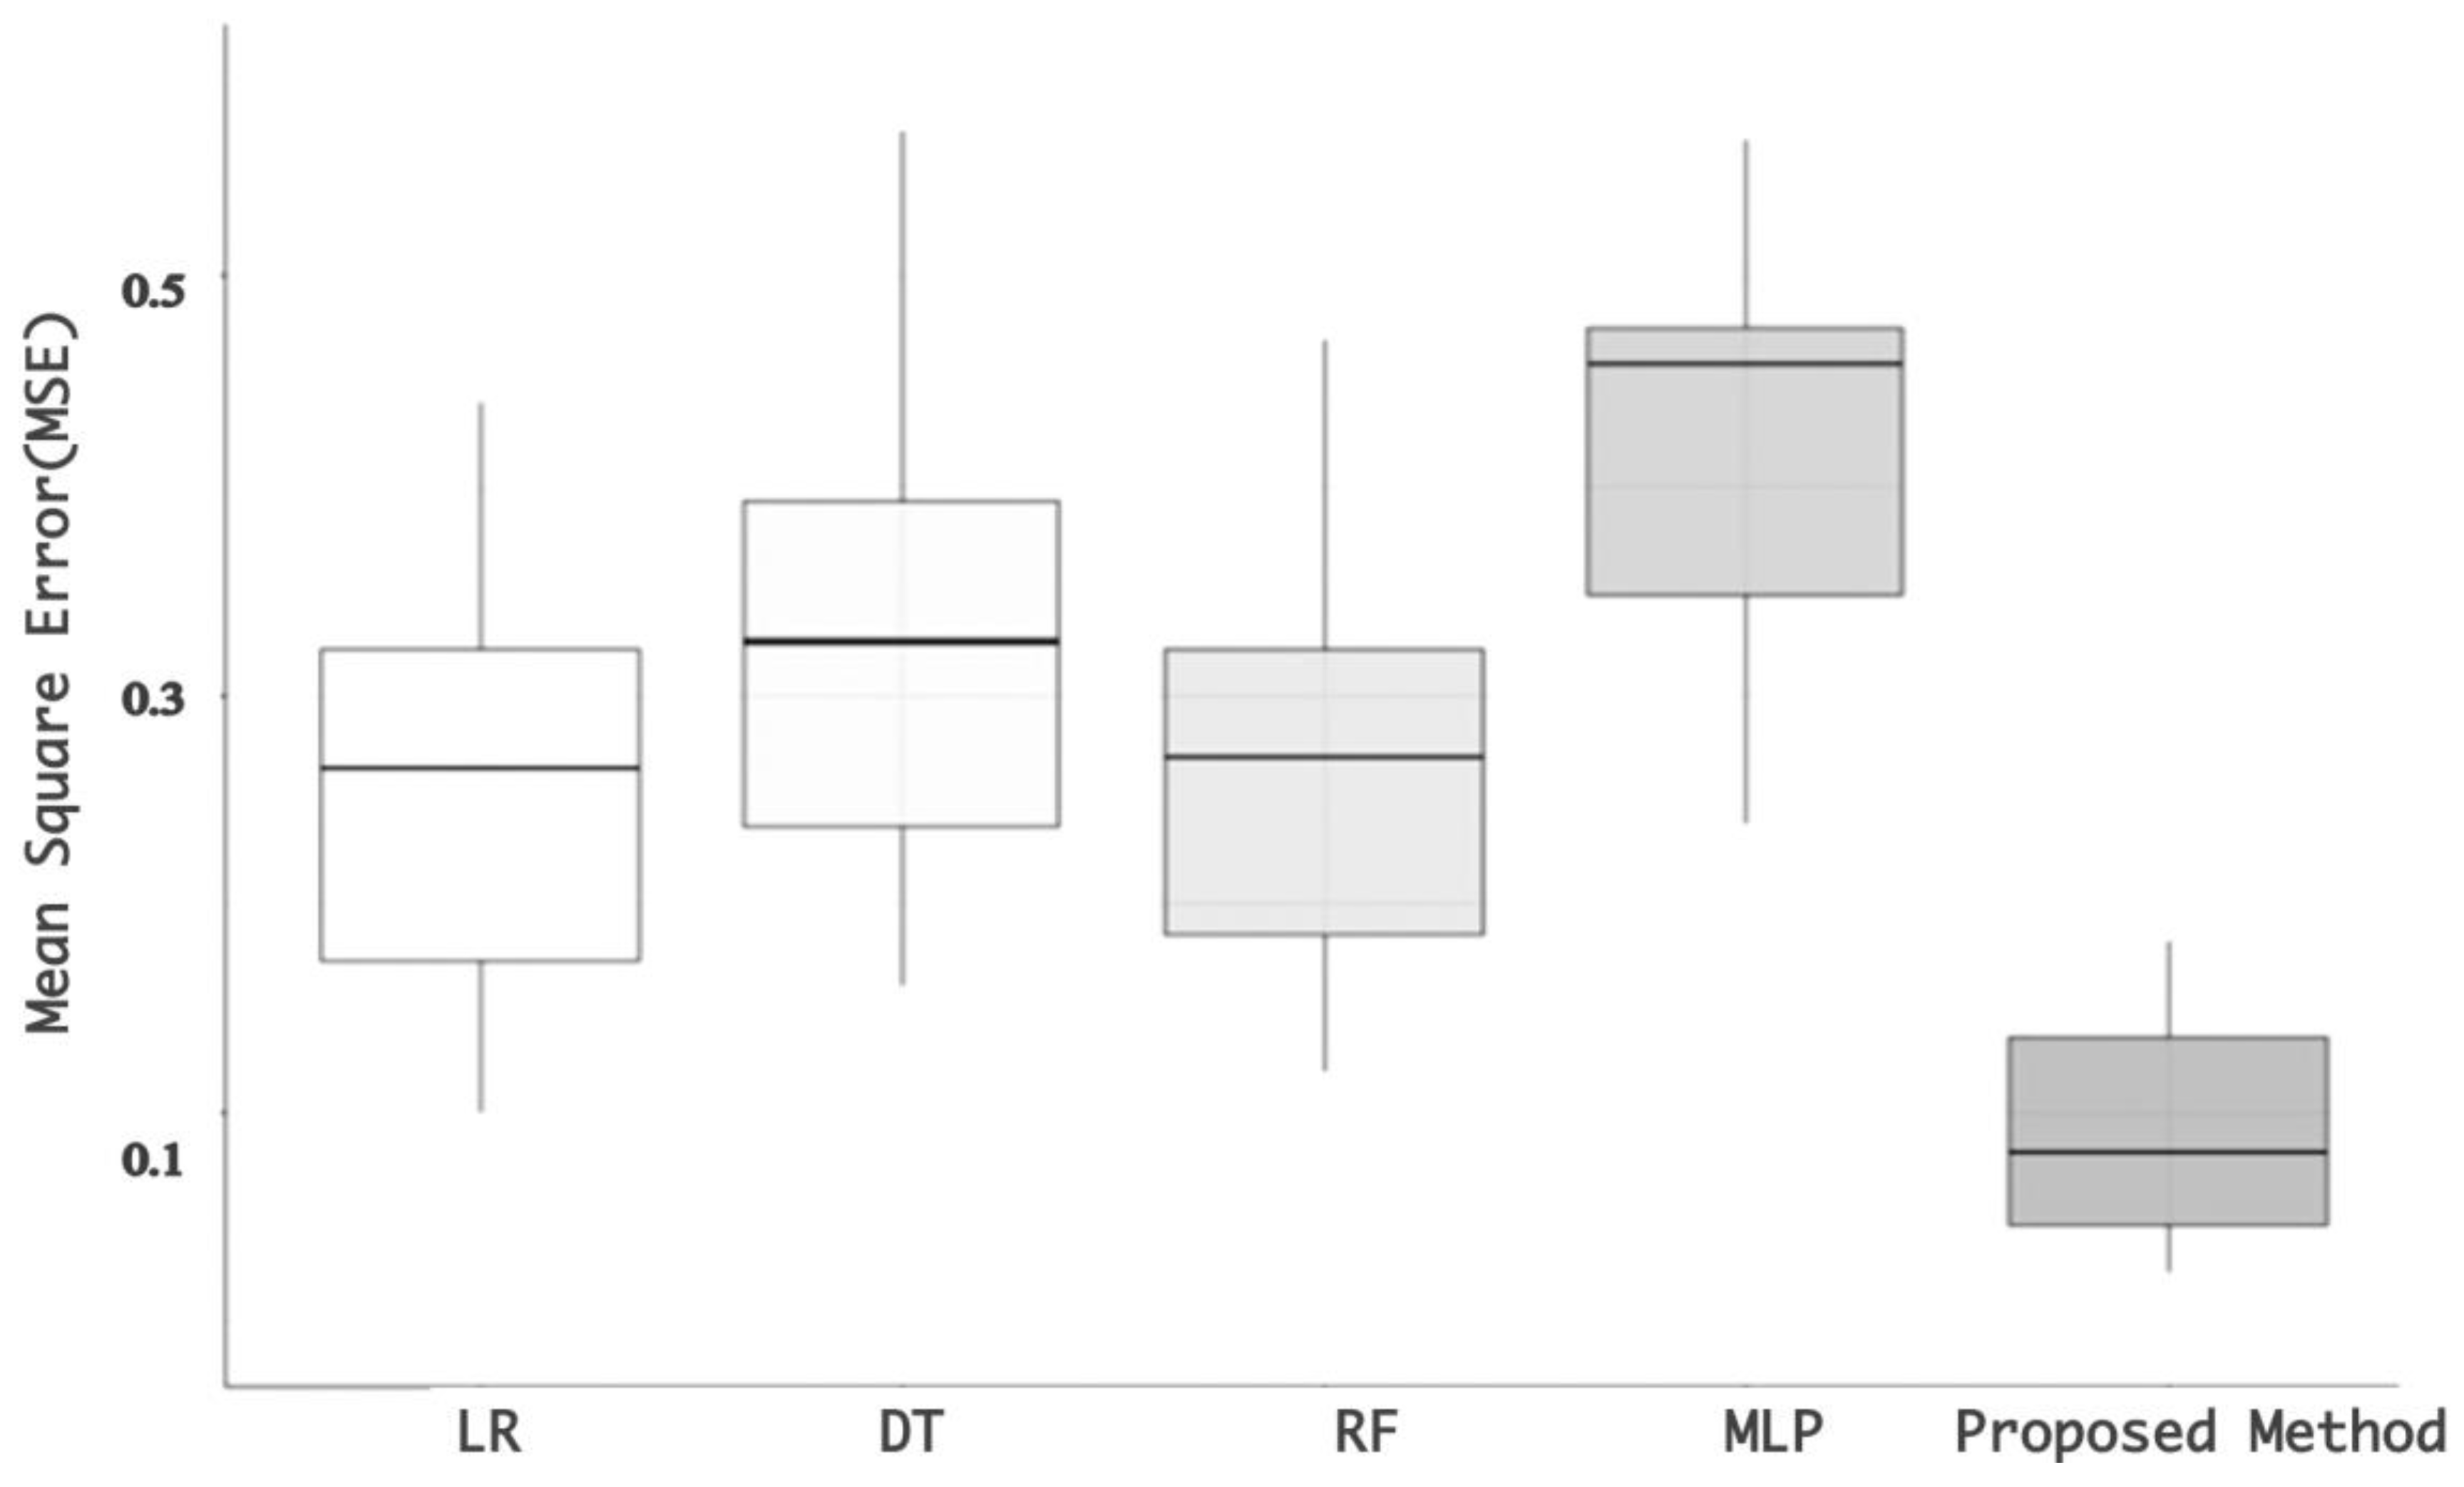
4.1. Performance Comparison with Conventional Machine-Learning Methods

To verify the utility of the proposed pressure prediction model based on CNN-LSTM, tests were performed using LR and a machine learning algorithm. In the performance-comparison test, 10-fold cross-validation was used, and the MSE was the lowest for the proposed CNN-LSTM among the machine-learning methods as well as LR. Figure 12 presents a box plot showing the MSE obtained using a 10-fold cross-validation test. The proposed method exhibits the best average performance. The figure shows a significant difference in MSE between the proposed CNN-LSTM and the existing methods. In addition, the results confirm that the proposed method ensures more stable performance using the distance from the mean value. Table 9 lists the parameters of the machine-learning methods used in the tests. Hyperparameters were tuned to achieve superior performance for each model to compare the CNN-LSTM with the existing methods. The hyperparameters for each model were set using the scikit-learn library, Python’s representative machine-learning package, and each hyperparameter was determined empirically. Xi is a vector composed of n predictions generated from samples of energy consumption data points for all parameters, and Yi is a vector composed of the observed consumption values of the predicted parameters.

4.2. Performance Comparison with other Deep-Learning-Based Models

Table 10 presents the performance comparison of deep-learning methods for pressure prediction. lr, dt, rf, mlp, cnn, and lstm were adopted for pressure prediction, and the results were validated by error metrics: MSE, RMSE, MAE, and MAPE. Therefore, the test results indicate that the proposed CNN-LSTM model outperformed existing deep-learning methods in terms of pressure prediction, and it is thus the most efficient pressure-prediction method.

5. Conclusions

Based on the IoT sensor data of the Yongsu WPP currently in operation, this study applied a prediction technique based on ML, an element technology of a digital twin, and demonstrated the superior performance of the proposed method. In the case of the WPP, with the definition of significant data by multiple parameters such as wave height data and sensor data of OWC, correlation analysis was performed with various parameters and through the analysis results, a methodology was investigated to predict the required information. Based on the raw dataset, features suitable for the machine-learning model were derived through feature engineering, and using the preprocessed data, training was performed in various models of ML, and a model with a high score was selected. A CNN-LSTM network that models temporal features was proposed to predict the pressure inside the WPP chamber. OWC chamber pressure prediction is challenging because the pressure exhibits an irregular trend due to external variability. This difficulty was resolved by linearly combining CNN and LSTM, and by modeling the complex functions of the actual pressure datasets of the WPP, improved modeling performance was achieved. The performance of the developed prediction model was compared with that of the existing machine learning methods. The performance was evaluated using a 10-fold cross-validation. The best MSE performance was obtained with the CNN-LSTM. In addition, the results showed that the standard deviation of cross-validation of the CNN-LSTM was small compared to the other models. As shown in Figure 12, the CNN-LSTM shows superior performance compared to other deep-learning methods, CNN and LSTM. The OWC chamber pressure prediction requires high performance because it is a pivotal factor influencing the efficiency of the OWC–WEC operation. The proposed method shows high prediction performance after 2.5 s. Through this study, it is expected that the efficiency of operation can be improved by predicting the pressure of OWC with improved accuracy, which is closely related to the power generation output and failure of OWC–WEC, and the utility of machine-learning technology required for smart operation with the digital twin of OWC–WEC was demonstrated.
In this study, because a sufficient amount of data were not available from the IoT sensors, there are some limitations to the full validation of the application of the proposed method. In the future, the design of a predictive analysis model with improved accuracy for smart operation and maintenance of OWC–WEC and real-time large-scale data analysis are required for further research. In particular, because of the problems that arise owing to the increase in the number of input vectors and the consequent sharp increase in the time required for training and analysis, addressing these problems can be achieved by the advancement in the OWC pressure prediction model based on machine learning, research on accuracy improvement using hyperparameter tuning of the deep-learning model, and further research on training environments based on distributed/parallel computing for real-time large-scale sensor data processing.

Author Contributions

Conceptualization, T.H., J.H., D.J.; writing-review and editing, D.S.; writing-original draft preparation, T.H.; data analysis, D.S.; data platform implementation, D.S.; project administration, M.K. All authors have read and agreed to the published version of the manuscript.

Funding

This research was funded by both the KRISO (Grant No.: PES3590) and KISTI (Grant No. K-21-L02-C06-S01), South Korea.

Institutional Review Board Statement

Not applicable.

Informed Consent Statement

Not applicable.

Acknowledgments

The authors are grateful to KRISO for providing the opportunity to participate in the project and for providing WEC data.

Conflicts of Interest

All the authors have no conflict of interest to declare.

References

  1. Minister of Trade, Industry and Energy. The 8th Basic Plan for Long-Term Electricity Supply and Demand; Minister of Trade, Industry and Energy: Sejong, Korea, 2017.
  2. Could Waves Become the Next Big Renewable Energy Source? Available online: https://edition.cnn.com/2016/12/12/africa/ghana-wave-energy/ (accessed on 7 December 2020).
  3. Cascajo, R.; García, E.; Quiles, E.; Correcher, A.; Morant, F. Integration of marine wave energy converters into seaports: A case study in the Port of Valencia. Energies 2019, 12, 787. [Google Scholar] [CrossRef] [Green Version]
  4. Kharati-Koopaee, M.; Fathi-Kelestani, A. Assessment of oscillating water column performance: Influence of wave steepness at various chamber lengths and bottom slopes. Renew. Energy 2020, 147, 1595–1608. [Google Scholar] [CrossRef]
  5. Lee, K.H.; Lee, J.H.; Jeong, I.H.; Kim, D.S. 3-Dimensional numerical analysis of air flow inside OWC type WEC equipped with channel of seawater exchange and wave characteristics around its structure (in case of regular waves). JKSCOE 2018, 30, 242–252. [Google Scholar] [CrossRef]
  6. Malmo, O.; Reitan, A. Wave-power absorption by an oscillating water in a channel. J. Fluid Mech. 1985, 158, 153–175. [Google Scholar] [CrossRef]
  7. Heath, T.; Whittaker, T.; Boake, C. The design, construction and operation of the LIMPET wave energy converter (Islay, Scotland) [Land Installed Marine Powered Energy Transformer]. In Proceedings of the 4th European Wave Energy Conference, Aalborg, Denmark, 4 December 2000; pp. 49–55. [Google Scholar]
  8. Boake, C.B.; Whittaker, T.J.; Folley, M.; Ellen, H. Overview and initial operational experience of the LIMPET wave energy plant. In Proceedings of the Twelfth International Offshore and Polar Engineering Conference, Kitakyushu, Japan, 26–31 May 2002; pp. 586–594. [Google Scholar]
  9. Vieira, M.; Monk, K.; Sarmento, A.; Reis, L. The Pico power plant as an infrastructure for development, research and graduation. In Proceedings of Congresso de Ciência e Desenvolvimento dos Açores; ACDA: Angra do Heroísmo, Portugal, 2013; pp. 1–25. [Google Scholar]
  10. Le Crom, I.; Brito-Melo, A.; Neumann, F.; Sarmento, A. Portuguese grid connected OWC power plant: Monitoring Report. In Proceedings of the Twentieth International Offshore and Polar Engineering Conference, Beijing, China, 20–25 June 2010; pp. 20–25. [Google Scholar]
  11. Torre-Enciso, Y.; Ortubia, I.; De Aguileta, L.L.; Marqués, J. Mutriku wave power plant: From the thinking out to the reality. In Proceedings of the 8th European Wave and Tidal Energy Conference, Uppsala, Sweden, 7–10 September 2009; pp. 319–329. [Google Scholar]
  12. Lee, H.; Oh, J.-S. Study of Power Output Characteristics of Wave Energy Conversion System According to Turbine Installation Method Combined with Breakwater. JOET 2015, 29, 317–321. [Google Scholar] [CrossRef]
  13. Kim, J.-S.; Park, J.-Y.; Choi, J.-S.; Shin, S.-H. Analysis of Wave Energy Resource in the West Sea of Jeju based on Wave Observation Data. JKOSMEE 2020, 23, 37–46. [Google Scholar] [CrossRef]
  14. Cui, Y.; Liu, Z.; Zhang, X.; Xu, C. Review of CFD studies on axial-flow self-rectifying turbines for OWC wave energy conversion. Ocean Eng. 2019, 175, 80–102. [Google Scholar] [CrossRef]
  15. Roh, C.; Kim, K.; Kim, J.; Hong, K. A Comparison of PWM methods for Power Converter of OWC Wave Power Generation System. JKOSMEE 2019, 22, 84–94. [Google Scholar] [CrossRef]
  16. Park, S.; Kim, K.-H.; Nam, B.; Kim, J.-S.; Hong, K. A Study on the Performance Evaluation of the OWC WEC Applicable to Breakwaters using CFD. JKSMEE 2018, 21, 317–327. [Google Scholar] [CrossRef]
  17. Fillbrunn, A.; Dietz, C.; Pfeuffer, J.; Rahn, R.; Landrum, G.A.; Berthold, M.R. KNIME for reproducible cross-domain analysis of life science data. J. Biotechnol. 2017, 261, 149–156. [Google Scholar] [CrossRef] [PubMed]
  18. Abdelhafez, H.A.; Amer, A.A. The Challenges of Big Data Visual Analytics and Recent Platforms. WSCIT 2019, 9, 28–33. [Google Scholar]
  19. Bonthu, S.; Bindu, K.H. Review of Leading Data Analytics Tools. IJET 2017, 7, 10–15. [Google Scholar] [CrossRef]
  20. Kim, Y.-G.; Moon, K.-I. Clustering of Smart Meter Big Data Based on KNIME Analytic Platform. JIIBC 2020, 20, 13–20. [Google Scholar] [CrossRef]
  21. Datasolution. Predictive Analysis Solution, KNIME Analytics Platform. Available online: http://www.datasolution.kr (accessed on 4 December 2020).
  22. Bartlett, P.L.; Long, P.M.; Lugosi, G.; Tsigler, A. Benign overfitting in linear regression. PNAS 2020, 117, 30063–30070. [Google Scholar] [CrossRef] [PubMed] [Green Version]
  23. Sevkli, M.; Sevkli, A.Z.; Cosgun, O. Comparison of Data Mining and Mathematical Models for Estimating Fuel Consumption of Passenger Vehicles. In Proceedings of the MWAIS 2019, Oshkosh, WI, USA, 21–22 May 2019; pp. 1–6. [Google Scholar]
  24. Qin, D.; Yu, J.; Zou, G.; Yong, R.; Zhao, Q.; Zhang, B. A novel combined prediction scheme based on CNN and LSTM for urban PM 2.5 concentration. IEEE Access 2019, 7, 20050–20059. [Google Scholar] [CrossRef]
  25. Fusco, F.; Ringwood, J.V. Short-term wave forecasting for real-time control of wave energy converters. IEEE Trans. Sustain. Energy 2010, 1, 99–106. [Google Scholar] [CrossRef] [Green Version]
  26. Simonetti, I. Optimization of Oscillating Water Column Wave Energy Converters: A Numerical Study. Ph.D. Thesis, Technische Universität Braunschweig, Florence, Italy, 2017. [Google Scholar]
  27. Sheng, W.; Lewis, T. Artificial neural network application in short-term prediction in an oscillating water column. In Proceedings of the Twentieth International Offshore and Polar Engineering Conference, Beijing, China, 20–25 June 2010. [Google Scholar]
  28. Paparella, F.; Monk, K.; Winands, V.; Lopes, M.; Conley, D.; Ringwood, J.V. Up-wave and autoregressive methods for short-term wave forecasting for an oscillating water column. IEEE Trans. Sustain. Energy 2014, 6, 171–178. [Google Scholar] [CrossRef] [Green Version]
  29. Monk, K.; Conley, D.; Winands, V.; Lopes, M.; Zou, Q.; Greaves, D. Simulations and field tests of pneumatic power regulation by valve control using short-term forecasting at the Pico OWC. In Proceedings of the 11th European Wave Tidal Energy Conference, Nantes, French, 6–11 September 2015; pp. 1–10. [Google Scholar]
  30. Ni, C.; Ma, X. Prediction of wave power generation using a convolutional neural network with multiple inputs. Energies 2018, 11, 2097. [Google Scholar] [CrossRef] [Green Version]
  31. Choi, E.; Cho, S.; Kim, D.K. Power Demand Forecasting Using Long Short-Term Memory (LSTM) Deep-Learning Model for Monitoring Energy Sustainability. Sustainability 2020, 12, 1109. [Google Scholar] [CrossRef] [Green Version]
Figure 1. Yongsu OWC–WEC: (a) Location map; (b) Construction diagram; (c) Arrangement for operation; (d) Sensors in the turbine.
Energies 14 02982 g001
Figure 2. Structure of proposed big data and AI platform.
Energies 14 02982 g002
Figure 3. Process of the pressure prediction model based on machine-learning in OWC–WEC.
Energies 14 02982 g003
Figure 4. Raw data obtained in the WHM: (a) Long period; (b) Short period.
Energies 14 02982 g004
Figure 5. Raw data obtained in the OWC: (a) Long period; (b) Short period.
Energies 14 02982 g005
Figure 6. Correlation analysis.
Energies 14 02982 g006
Figure 7. Analysis with SWAN.
Energies 14 02982 g007
Figure 8. Preprocessing workflow to build a dataset.
Energies 14 02982 g008
Figure 9. Air pressure signal of (a) before and (b) after noise reduction in OWC.
Energies 14 02982 g009
Figure 10. Result of autocorrelation analysis.
Energies 14 02982 g010
Figure 11. Target feature and prediction method.
Energies 14 02982 g011
Figure 12. Accuracy of 10-fold cross-validation using machine learning.
Energies 14 02982 g012
Table 1. Main characteristics of Yongsu OWC–WEC.
CharacteristicsDescription
Capacity500 kW (250 kW × 2)
External Dimensions37.2 m(L) × 31.2 m(B) × 27.5 m(H)
Weight10,500 ton
TurbineImpulse turbine of 1.8 m (dla.), 26 blades
GeneratorSynchronous generator(SG), Dual Fed Induction generator(DFIG)
Table 2. Deep-learning models in WEC.
CategoryAuthorMethodShort Description
Statistical based modelingFusco, F.; Ringwood, J.V. [25]LR, DTPresents an approach where the wave elevation is treated as a time series and it is predicted only from its past history
Simonetti. I. [26]LR, DTPresents an optimization of OWC WEC
Machine
learning- based modeling
Wanan Sheng,
Tony Lewis. [27]
MLPPresents a short-term prediction of the random process by an ANN, which can provide future information for the control system
Paparella, F.; Monk, K.; Winands, V. [28]MLPPresents a prediction of the wave elevation inside the chamber of the OWC for the Pico OWC plant in the Azores
Monk, K.; Conley, D.; Winands, V. [29] MLPPresents a short-term wave forecasting using an autoregressive model
Deep
learning- Based Modeling
Ni, C.; Ma, X. [30]CNNPresents a prediction of WEC using a convolutional NN with Multiple Inputs
Choi, E.; Cho, S.; Kim, D.K. [31]LSTMDesign a novel custom power demand forecasting algorithm based on the LSTM deep-learning method regarding the recent power demand patterns
Table 3. WHM attribute table.
AttributeDescription
TMean wave period
HSignificant wave height
DirectionMean wave direction
Collecting cycle: 30 min., Collecting duration: 48 h
Table 4. OWC sensor attribute table.
AttributeDescription
FlowFlow velocity
PressChamber pressure
TorqueMotor torque
RPMRotations per minute
Powerelectrical energy
Ingestion cycle(1 s), Ingestion time(48 h)
Table 5. Result of correlation analysis.
Press
(Chamber Pressure)
Flow
(Fluid Velocity)
Torque
(Motor Torque)
RPMPower
Press
(chamber pressure)
10.9766780.9199960.9134440.905568
Flow
(fluid velocity)
0.31441010.4522990.4522990.452299
Torque
(motor torque)
0.3921050.68111510.9522990.952299
RPM0.3244490.6122370.89269910.952299
Power0.3522990.6522110.8522990.8522991
Table 6. Feature engineering for data preparation.
ItemDescription
Removal of columns with many missing values
-
Columns with many missing values cannot be used as input data
Handling missing values
-
Replace with a mean value or a calculated value
-
In general, missing values are substituted with 1 or 0.
Integer Encoding
-
When there is text-type data
-
After classifying by word, the data is converted to index
Removal of redundant and highly correlated variables
-
Minimizing duplicate data, redundant data, or highly correlated variables
-
Application of scatter plot and principal component analysis
Modification of biased values
-
Continuous variables should follow a normal distribution
-
After reviewing the distribution trend, the biased values are modified
-
Review: Use of statistical scale and histogram
-
Modification/correction: use of log transformation, inverse transformation, square root transformation, and squares
Handling extreme values and extraordinary values
-
Use the extreme values, where possible
-
Remove outliers (values not within ±3SD), when they do not have significant implications
Table 7. Hyperparameter.
ParameterOutput Shapes
Verbose1
Epochs30
Batch Size512
Table 8. CNN-LSTM architecture.
Layer (Type)Output ShapeParam #
ConvLSTM2D (Activation = relu)(None, 1, 48, 64)50,176
Flatten(None, 3072)0
Repeat_Vector(None, 1, 3072)0
LSTM (Activation = tanh)(None, 1, 40)498,080
Time_Distributed (Activation = relu)(None, 1, 40)1640
Time_Distributed(None, 1, 1)41
Total params: 549,937
Table 9. Parameters for machine-learning techniques.
No.ModelDescription
1Linear Regression (LR)Fit_intercept = True, normalize = False, n_jobs = None
2Decision Tree Regression (DT)Splitter = “best”, maximum depth = None,
min samples split = 2, min sample leaf = 1
3Random Forest Regression (RF)No of estimators = 10, maximum depth = None,
min samples split = 2, min sample leaf = 1
4Multilayer perceptron (MLP)Activation = relu, weight optimization = adam, batch size = 512, number of epochs = 100, learning rate = 0.01
Table 10. Performance comparison of deep-learning methods.
MethodMSERSMEMAEMAPE
CNN0.2411 0.2835 0.2040 16.6666
LSTM0.2329 0.2785 0.1970 16.1211
The proposed0.1246 0.2038 0.1164 11.6133
Publisher’s Note: MDPI stays neutral with regard to jurisdictional claims in published maps and institutional affiliations.

