Article

A Mobile Energy Storage Unit Serving Multiple EV Charging Stations

1
Department of Electrical Engineering, American University of Sharjah, Sharjah P.O. Box 26666, United Arab Emirates
2
Production & Operations Management Research Lab, Faculty of Engineering, University of Windsor, 401 Sunset Ave., Windsor, ON N9B-3P4, Canada
3
Department of Electrical and Computer Engineering, University of Windsor, Windsor, ON N9B 3P4, Canada
4
Electrical Power and Machines Department, Faculty of Engineering, Ain Shams University, Cairo 11517, Egypt
*
Authors to whom correspondence should be addressed.
Energies 2021, 14(10), 2969; https://doi.org/10.3390/en14102969
Submission received: 13 April 2021 / Revised: 12 May 2021 / Accepted: 17 May 2021 / Published: 20 May 2021
(This article belongs to the Special Issue Demand Response Optimization Techniques for Smart Power Grids)

Abstract

:
Due to the rapid increase in electric vehicles (EVs) globally, new technologies have emerged in recent years to meet the excess demand imposed on the power systems by EV charging. Among these technologies, a mobile energy storage system (MESS), which is a transportable storage system that provides various utility services, was used in this study to support several charging stations, in addition to supplying power to the grid during overload and on-peak hours. Thus, this paper proposes a new day-ahead optimal operation of a single MESS unit that serves several charging stations that share the same geographical area. The operational problem is formulated as a mixed-integer non-linear programming (MINLP), where the objective is to minimize the total operating cost of the parking lots (PLs). Two different case studies are simulated to highlight the effectiveness of the proposed system compared to the current approach.

Graphical Abstract

1. Introduction

The distribution grid faces various challenges and obstacles due to the increase in the number of distributed generation (DG) units, such as wind and solar, in addition to the failure to meet growing demand for electric power, especially in urban areas. Future power grids in urban areas will focus on integrating energy storage systems (ESSs) to meet the increasing demand without compromising its CO2 emission reduction advantage [1]. In particular, due to falls in the price of the lithium-ion batteries, the most common type of batteries used in ESS [2], it is more attractive for utilities to use such technologies in their systems. The need for ESS units is clearly evident at locations that rely on renewable energy sources (RESs) due to their intermittent nature. The ubiquitous nature of electric vehicles (EVs) globally places stress on distribution systems, which might result in a failure to supply the required power in some cases [3,4]. This scenario affects the stability and reliability of the system [5]. The mobile energy storage system (MESS) has been the focus of numerous studies as a solution that supplies power to the grid during on-peak periods, ensuring that the required power is available at each time interval. This concept is known as vehicle-to-grid (V2G).
ESS units have been investigated to maximize their benefits; however, they have been used as a stationary solution either to coordinate EV charging or to be used with DGs to store power, especially in tandem with intermittent wind or solar to provide a more predictable power supply. EV charging coordination using optimal pricing algorithms is presented in [6,7,8]. Contemporary researchers have presented various approaches to integrating these technologies, such as the use of EVs as a bidirectional power source to supply power at peak hours, as discussed in [9,10]. A mobile energy generation and storage system (MEGSS) is proposed in [11], and is able serve several industrial customers using an optimal dispatch approach. The aim is to maximize profit by selecting the best customers to be served. An optimization algorithm that solves for the optimal size and location of an MESS to be used in a distribution network is proposed in [12], which takes load variation and market price fluctuations into account. The aim is to find the best location to connect the MESS to ensure minimum losses. EV mobility is used to balance the demand in [13], taking advantage of the fact that EVs travel to multiple destinations; however, there is no guarantee that EV owners are willing to participate. A study on the control strategy of the MESS for overload elimination is presented in [14]. The authors deployed an MESS to eliminate the seasonal short-term overload of distribution transformers in rural areas. In [15], an MESS is designed and utilized in Iran to act as a mobile generation unit. It can store energy from the grid and return the energy when required. Reducing operational costs and enhancing power grid resilience using an MESS is presented in [16]. The MESS is used to avoid the expected load shedding caused by disasters, i.e., it is used when extra backup capacity is necessary.
The ability of the MESS to move between different locations and supply multiple loads at different times helps to reduce the power drawn from the grid. Furthermore, it can be used in serving EV charging stations due to the uncontrolled peak demand period. EVs cannot be easily controlled because customers can require power at different times with different daily profiles. MESSs can be used to serve multiple EV charging stations, especially if these PLs share the same geographical area and have short peak demand periods. This paper proposes a scheduling approach of an MESS to help multiple EV charging stations meet their daily power requirements, address the extra demand, and reduce the operational costs. The MESS is used in this work to reduce demand peak charges because it serves the PLs at the peak time to help to meet the demand. It also provides a fast and reliable backup power source for the integrated PLs during unexpected grid outages.
The remainder of the paper is organized as follows: Section 2 presents the proposed approach. Section 3 introduces the problem formulation and the proposed MESS model. Different case studies and simulations are represented in Section 4. Finally, the conclusions are drawn in Section 5.

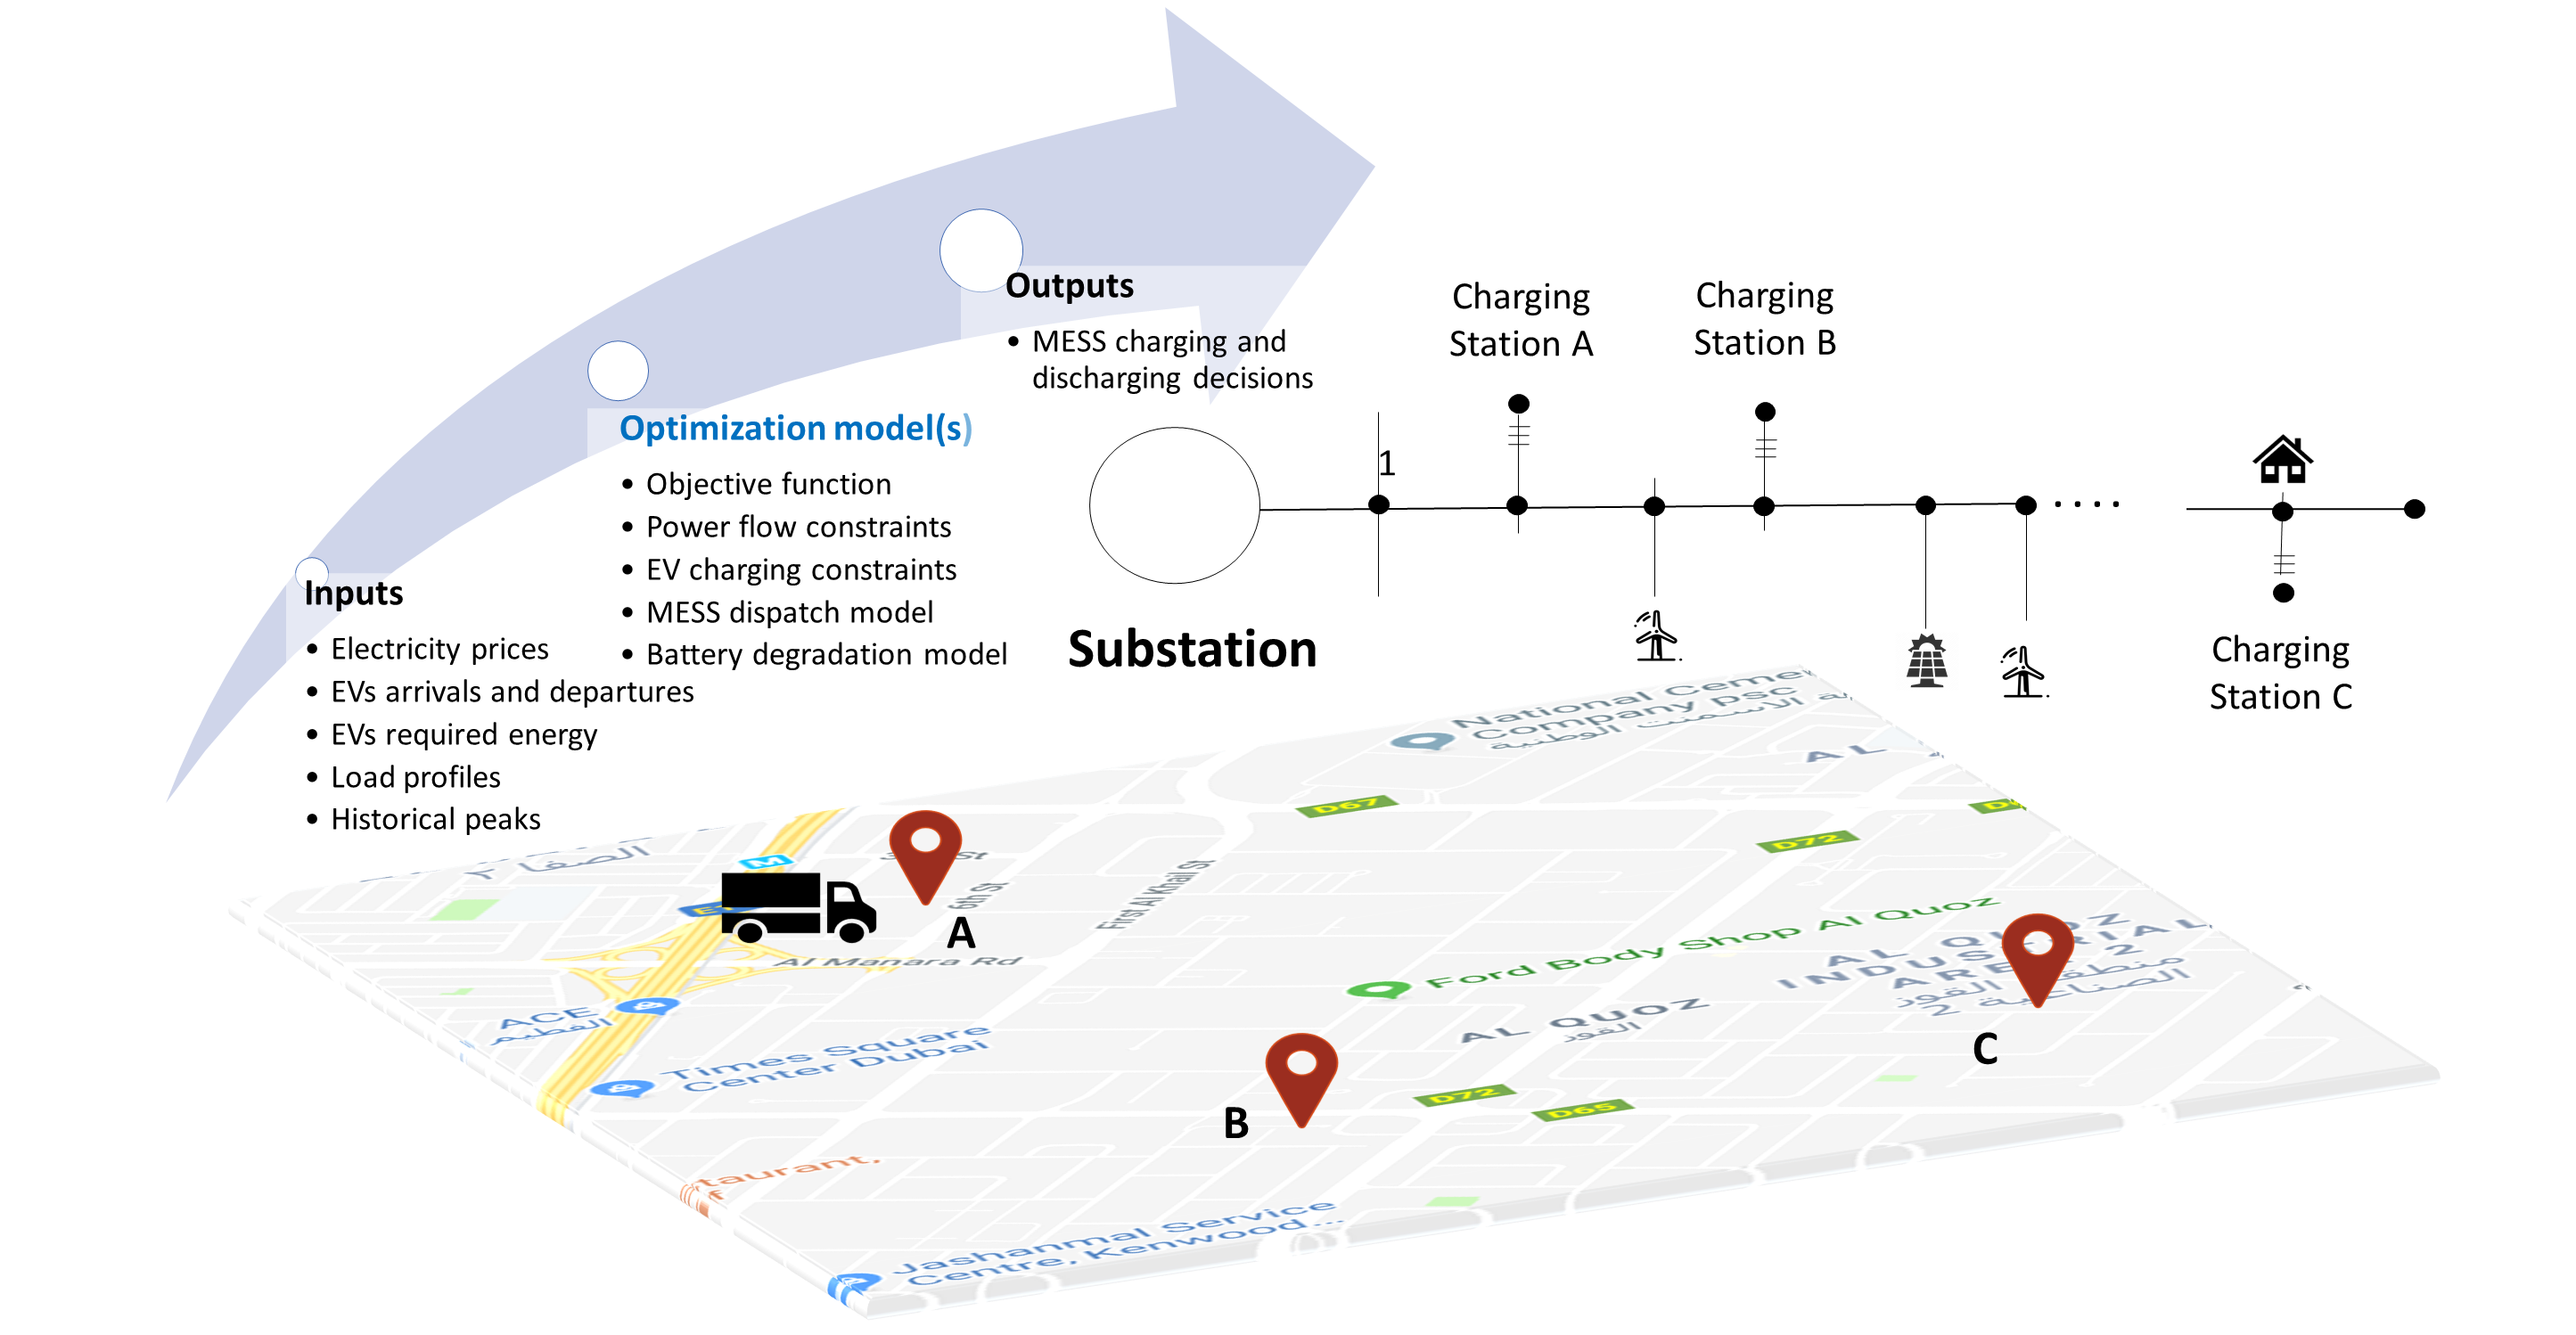
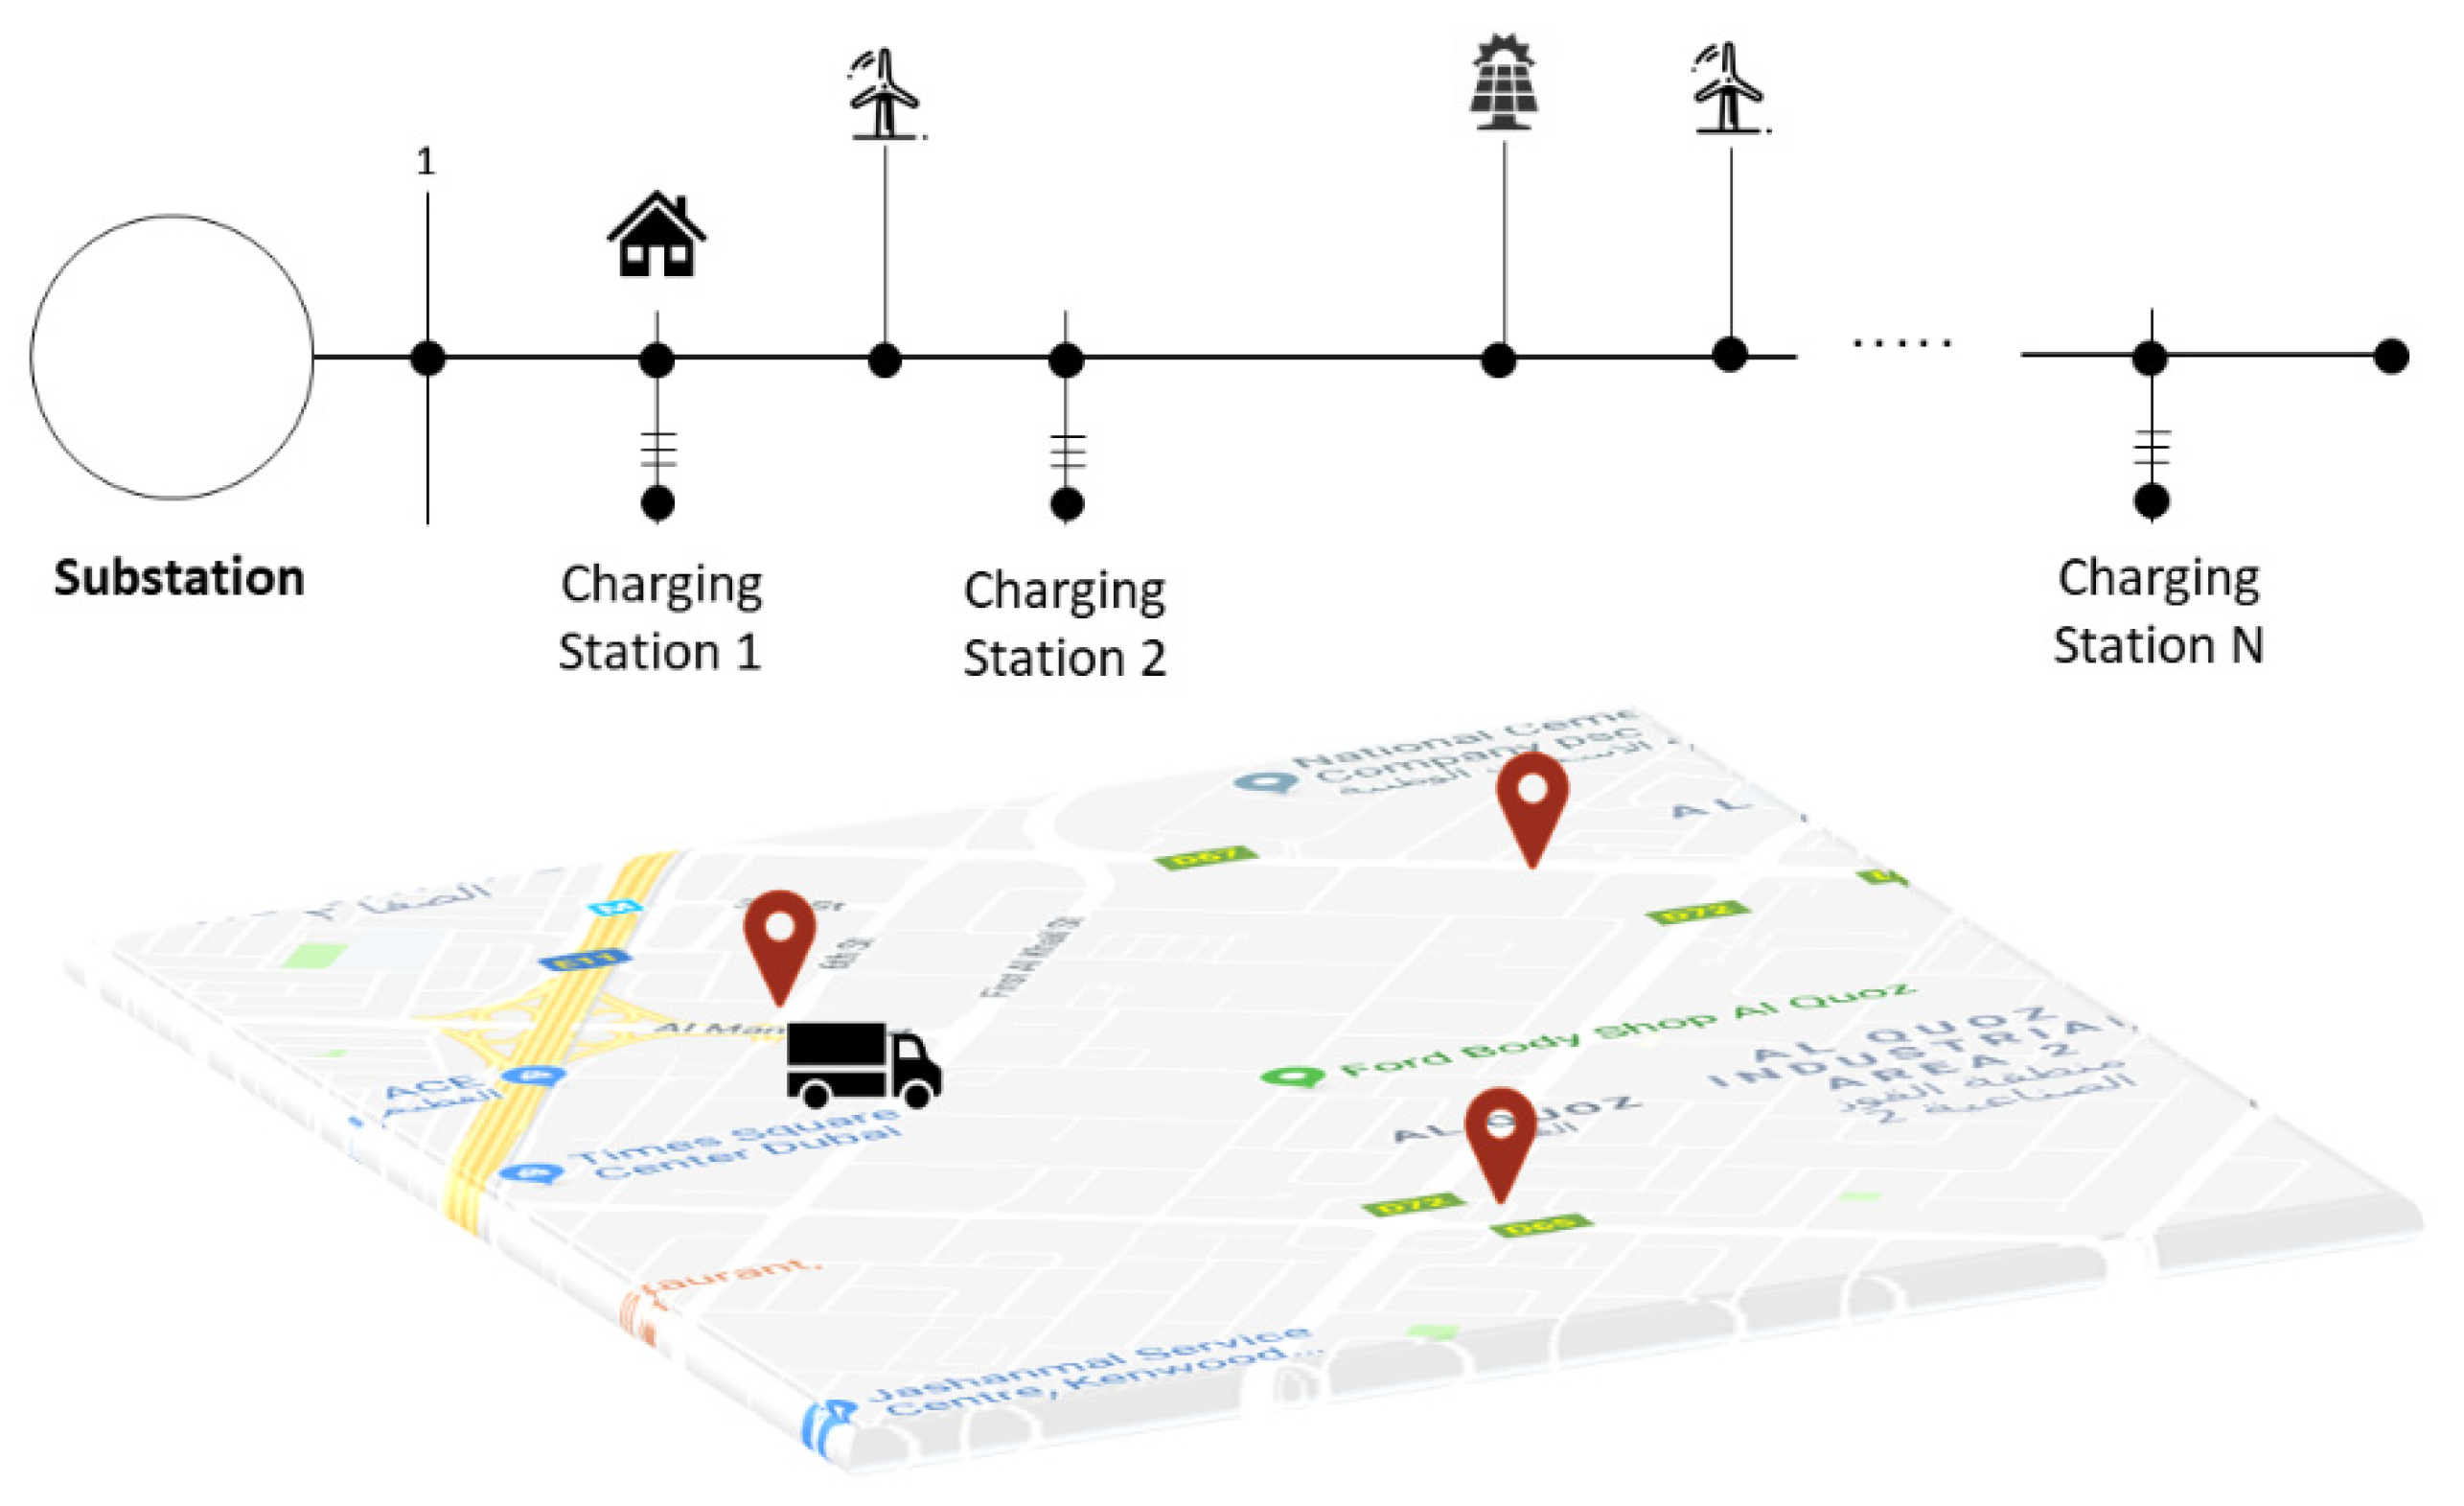
2. Proposed Approach

2.1. Problem Statement

The purpose of this paper is to model a mobile energy storage system shared by multiple EV charging stations that are located in the same geographical area, as shown in Figure 1. These PLs have different peak times, which justifies the application of an MESS to defer a network upgrade and meet the PL demand. Another solution that provides grid services similar to that of the MESS is aggregated EVs, which does not require any initial investment; however, the time availability of the aggregated EVs in PLs is uncontrollable [17], which raises questions about the reliability of the model. Moreover, not all EV owners are willing to participate in such a process. In addition, a large number of EVs are required in order to supply the same quantity of power as a single MESS.

2.2. Assumptions

The following assumptions were considered when modeling and designing the system:
  • Customers’ requirements are received day-ahead.
  • Visiting order of the charging station is known based on the forecasted load profile.
  • The time segment is hourly and changes within the hour are averaged.

3. Problem Formulation

To model the problem, the time horizon is defined as 24 time slots per day, for which each slot has a span of one hour and is represented as a set t = { 1 , 2 ,   3 , 24 } . The objective function is defined in Equation (1), which aims to minimize the total drained power by the PLs to charge the arrival EVs, as follows:
min   i ( t ( C t g r i d   P i , t E V T o t a l   Δ T ) ) + C D E G
where C t g r i d is the grid cost that varies at each time interval and the total power consumed by PL at each bus, and each time interval is represented by P i , t E V T o t a l . i is the number of the bus where PL is loaded. C D E G is the degredation cost.

3.1. Power Flow Constraints

Equations (2) and (3) represent the well-known nonlinear power flow equations, in which P i , t E V T o t a l is added as a load of the specified buses, as follows:
P i , t G P i , t L V i , t = j   V j , t ( G i , j cos δ i , j + B i , j sin δ i )   ,   i , t
Q i , t G Q i , t L V i , t = j   V j , t ( G i , j cos δ i , j + B i , j sin δ i ) ,   i , t
where i and j denote bus indexes; P i , t L   and Q i , t L   represent the real and reactive load powers, respectively; P i , t G   and Q i , t G   are the real and reactive generated power, respectively; G i , j   and B i , j   represent conductance and susceptance between buses i   and j ; and V i , t   and δ i   represent the voltage and angle level, respectively.
The voltage levels must be maintained within the acceptable limits as expressed in Equation (4). In addition, the thermal line limits impose an upper limit on the line current magnitude as in Equation (5), as follows:
V m i n   V i , t   V m a x   i , t
I i , j , t     I i , j m a x
where V m i n and V m a x are the minimum and maximum permissible voltage levels in p.u., respectively;   I i , j m a x   and I i , j , t is the maximum allowable current and the actual current at time t through the line between buses i and j , respectively.

3.2. EVs Charging Constraints

The EV charging process is modeled using Equation (6) for each PL. The power delivered to each EV at each time slot depends on the initial availability of the car, which is indicated by L o g i c n , t , i.e., if L o g i c n , t = 1 , then the car is available in the PL at time t as illustrated in Equation (7). Equation (8) ensures that every EV receives the pre-required demand, and Equation (9) computes the total demand of each charging station, as follows:
P n , t E V L o g i c n , t × P C H M A X   ,     n , t
L o g i c n , t = { 1   ,   A r r i v a l   t   D e p a r t u r e 0   ,   o t h e r w i s e .
E n E V r e q = t P n , t E V   ,     n
P i , t E V T o t a l = ( n P n , t E V ) P   i , t D C H T   ,     i I e v ,   t
where P C H M A X is the maximum available charging rate and n is the total number of arrival cars in each PL. P n , t E V is the total power delivered to each car n at each time slot t . E n E V r e q   denotes the demand for each EV. P i , t E V T o t a l denotes the total consumed power in each PL.
The state of charge (SOC) of each EV is updated with the charging energy as in Equations (10) and (11):
S O C n , t   = S O C n , t 1   + Δ S O C n , t  
  Δ S O C n , t   = P n , t E V × Δ T E n B A T  
where S O C n , t     is the SOC at time t for each EV; Δ S O C n , t     the change in the SOC due to charging; Δ T is the time segments in hours; E n B A T is the battery capacity in kWh.

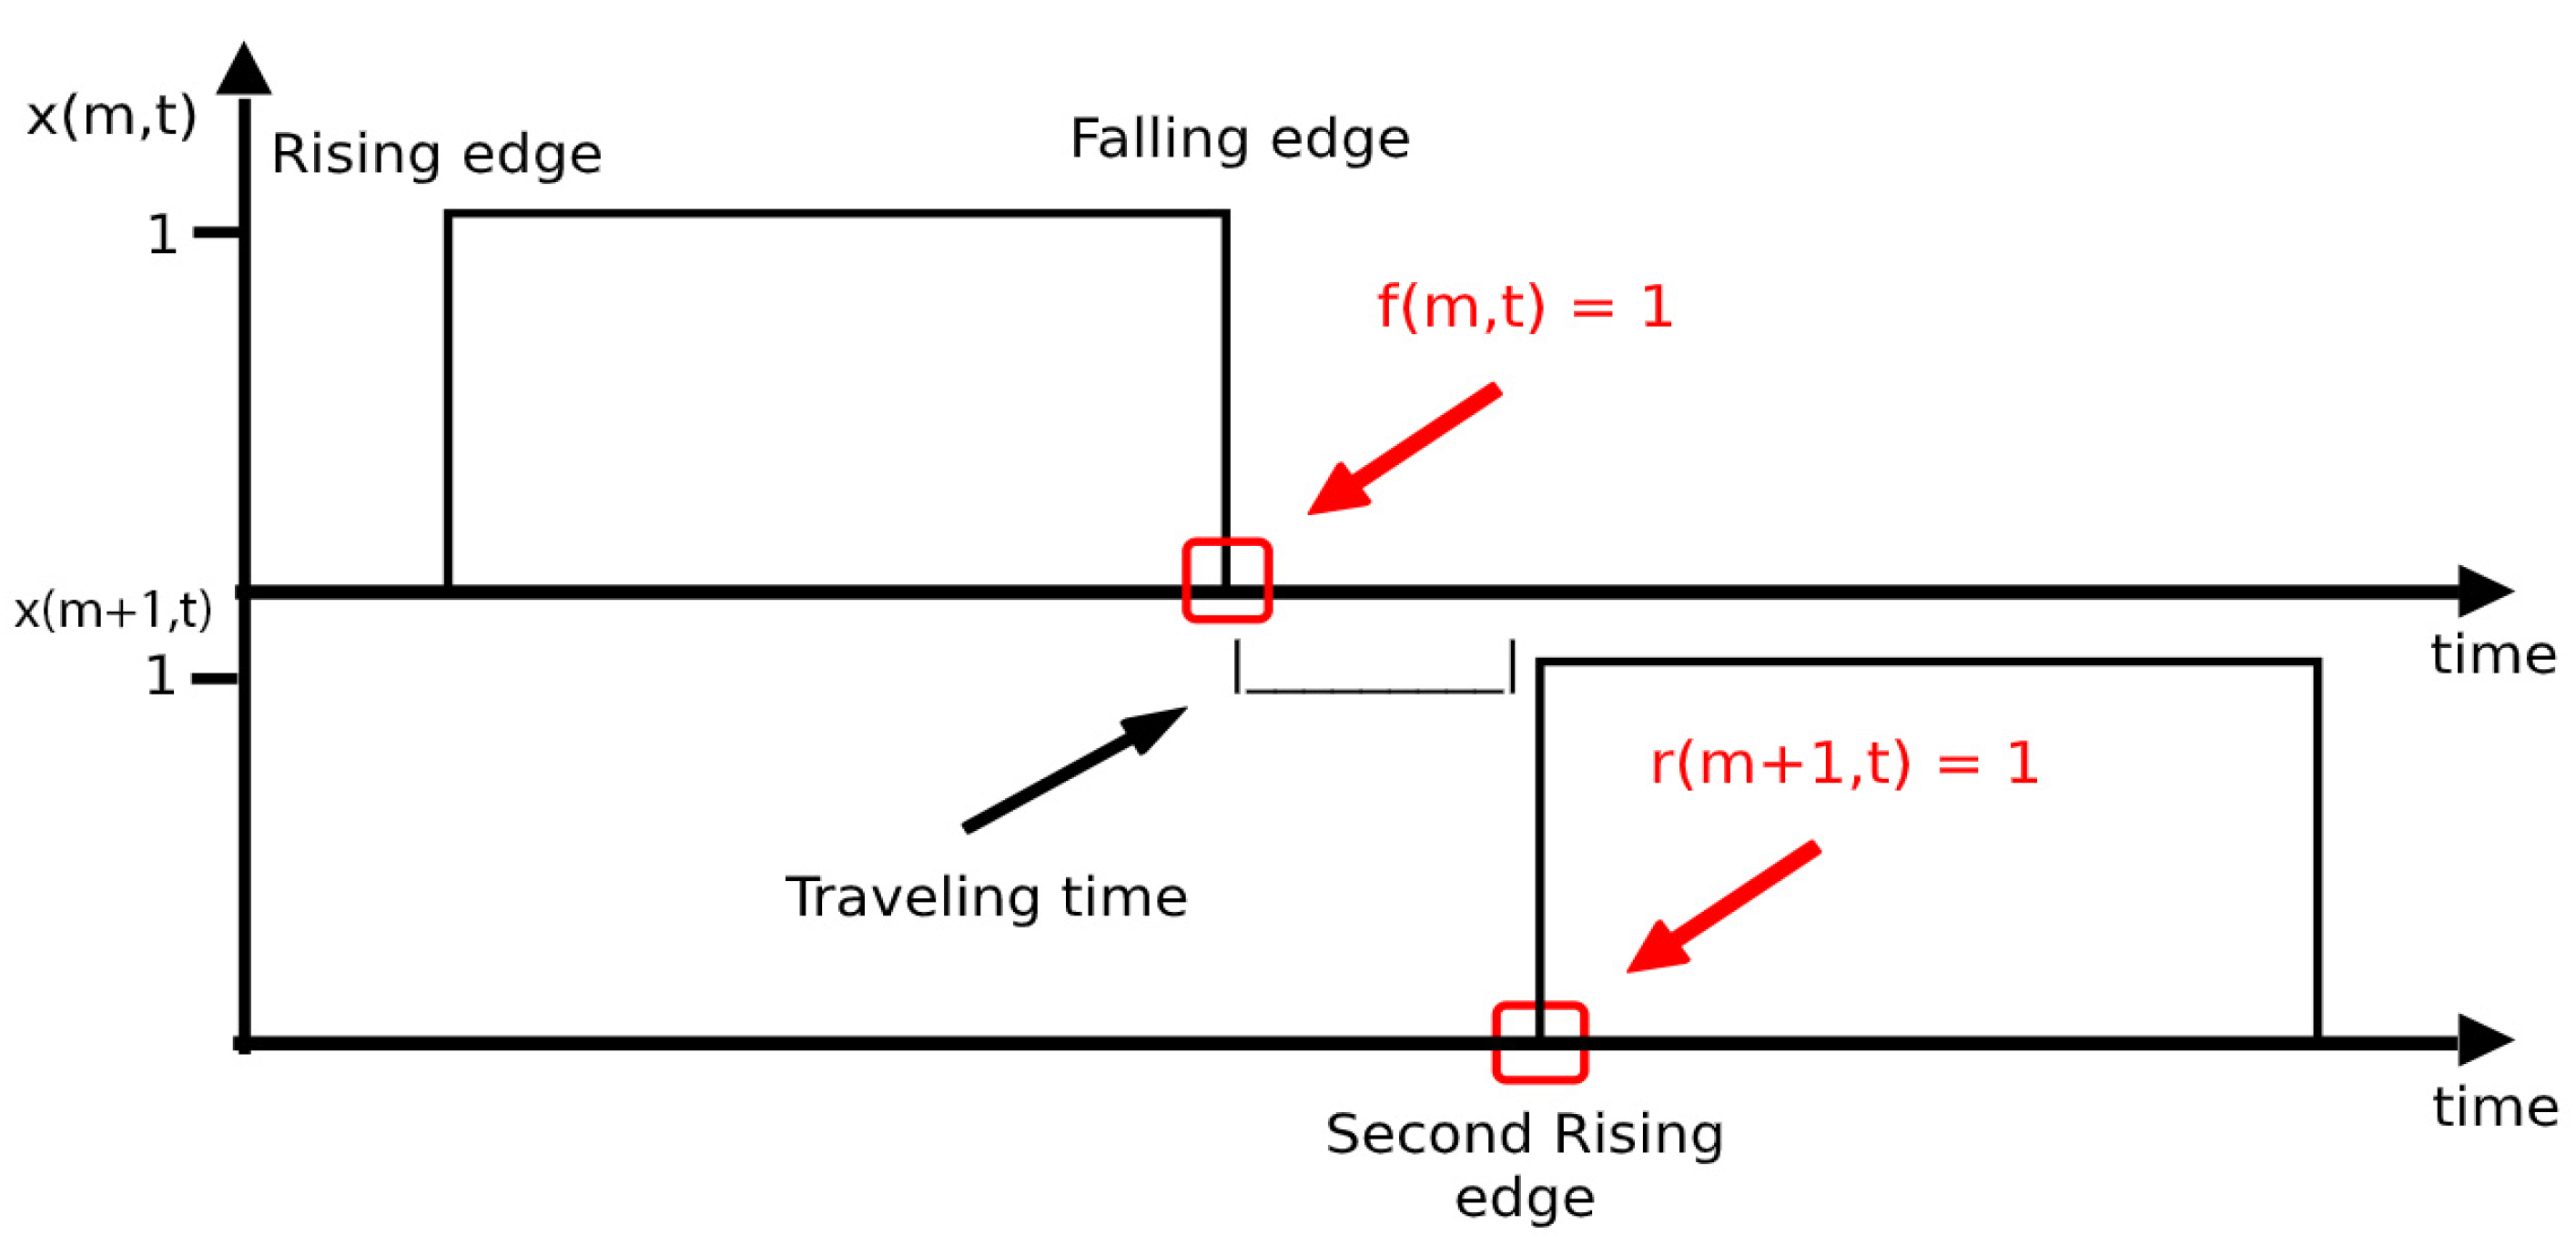
3.3. Mobile Storage Modeling

The MESS will supply power only if it is available at the PL; it should visit each location only once. A binary variable is introduced to represent the location of the MESS at each time slot; x m , t as shown in Equation (12), where m = { 1 , 2 , , N m } and N m is the total number of charging stations. T t is another binary variable representing the traveling period. If it is equal to 1, then the MESS is moving from one spot to another; otherwise, it should be zero. The MESS should be available at a PL or traveling between PLs at each time segment.
x m , t = { 1   : i f   E V   i s   a v a i l a b e   a t   P L m   a t   t i m e   t 0   ,   o t h e r w i s e .
Equation (13) ensures that the MESS will be available at one location at a time and Equation (14) signifies that the MESS should visit all the PLs during the day.
m x m , t + T t = 1 ,     t  
t x m , t + T t 1 ,     m
A new binary variable y m , t is introduced to capture the change in the state of x m , t . As illustrated in Equation (15), the variable y computes the change of the present state of variable x from the previous one. By allowing only two changes for each PL as presented in Equation (16), we ensure only two state changes take place and, as a result, only one rising edge and one falling edge appear in the model as illustrated in Figure 2. Equations (15) and (16) ensure that variable x m , t has a rectangular pulse; however, the width of the rectangle (time spent at each PL) is to be optimized based on each PL demand.
y m , t = ( x m , t x m , t 1 ) 2 ,     m , t  
t y m , t = 2   ,     m
After the departure of the first PL (first falling edge), the MESS should travel to the next station. A gap of the required traveling time between the falling edge of the first PL and the rising edge of the next PL should be considered to present a real logical scenario. Two binary variables called f m , t and r m , t are proposed to denote the timing of the fall and rise edges of each PL.
Equation (17) ensures that f m , t = 1 only at the falling edge of x m , t . The term ( x m , t x m , t 1 ) has three different possibilities, which are [−1, 0, and 1]. Constraint (17) guarantees that f m , t = 1 if the value of ( x m , t x m , t 1 ) is [−1], which is the falling edge. Equation (18) ensures that f m , t should have a value of 1 at least once, which is at the falling edge. At this stage, the falling edge timing is captured in f m , t .
1 × f m , t = f m , t × ( x m , t x m , t 1 )   ,     m , t  
t f m , t = 1   ,     m
To force the rise of the second PL (being available at the second station), the rising edge should take place after the falling edge of the previous station, considering the traffic, transportation time, and connecting/disconnecting time. This time is represented in the formulation as traveling time (TT). Equations (19) and (20) ensure that f m , t and the next r m , t are separated by a time interval equal to TT, as illustrated in Figure 2. At this stage, r m , t = 1 after the previous falling edge timing plus the TT. The next step is to force the rising edge to take place at this captured time.
r m + 1 , t = f m , t T T ,     m   w h e r e   t > T T  
t r m + 1 ,   t = 0   ,     m   w h e r e   t < T T  
The truck is considered to be available at the next station by forcing the rising edge to take place at the specified t in r m , t . This can be performed using Equation (21), which defines the rising time. Equation (22) ensures that only one rising edge can take place.
  r m + 1 , t = r m + 1 , t × ( x m + 1 , t x m + 1 , t 1 )   ,     m , t  
t r m + 1 , t = 1   ,     m
The MESS is considered to be a battery-based truck; Equations (23) and (24) represent the state-of-charge of the battery inside the truck, as follows:
S O C t T = S O C t 1 T + Δ S O C t T
Δ S O C t T = ( P t C H T i P   i , t D C H T P t T T ) Δ T E M E S S
where S O C t T is the SOC of the MESS battery at time t ; Δ S O C t T is the change in the SOC due to charging, discharging, and transportation; P C H T and P D C H T are the charging and discharging rates at each time segment, respectively;   P t T T is the power consumed for traveling between locations; E M E S S is the battery capacity in kWh.
The MESS is owned by multiple PLs, which contribute different percentages to the capital cost of the MESS. This percentage can vary according to each PL demand. According to this contribution, each PL should receive an amount of energy equivalent to its share, which is maintained using Equations (25) and (26), as follows:
t P   i , t D C H T Δ T γ i i ( t P   i , t D C H T Δ T )
i γ i = 1
where γ i is the percentage share of each PL i . The MESS’s battery degradation cost is calculated by dividing the total cost of the battery pack by the energy throughput, which is the total amount of energy a battery can be expected to store and deliver over its lifetime [18] using Equations (27) and (28), as follows:
C D E G = C k W h D E G i ( t P   i , t D C H T Δ T )
C k W h D E G = C t o t B A T E T P B A T + C O & M B A T
where C k W h D E G is the degradation cost in $/kWh; C t o t B A T is the total cost of the battery pack; E T is the energy throughput in kWh; C O & M B A T is the operation and maintenance (O&M) variable cost in $/kWh.
The total cost and energy throughput are calculated as in Equations (29) and (30), respectively, as follows:
C t o t B A T = C k W h B A T × E n o m B A T + C k W B A T × P C H M A X C E o L ( P V ) B A T
E T P B A T = E n o m B A T × D o D × η r o u n d × λ
where C k W h B A T is the capital cost of the energy capacity in $/kWh; E n o m B A T is the nominal energy in kWh; C k W B A T is the battery system cost per kW including the power conversion system in $/kW; C E o L ( P V ) B A T is the present value of the selling price at the end of the project lifetime; D o D is the depth of discharge; η r o u n d is the round trip efficiency; λ is the cycle life in cycles.
The present value of the second-life battery cost, which is the selling price of the battery pack at the end of the cycle life, is calculated in Equation (31), as follows:
C E o L ( P V ) B A T = C E o L B A T × N E ( 1 + d ) n
where C E o L B A T is the cost of the battery at the end of the life cycles in $/kWh; d is the discount rate; n is lifetime in years.

3.4. Decision Variables Constraints
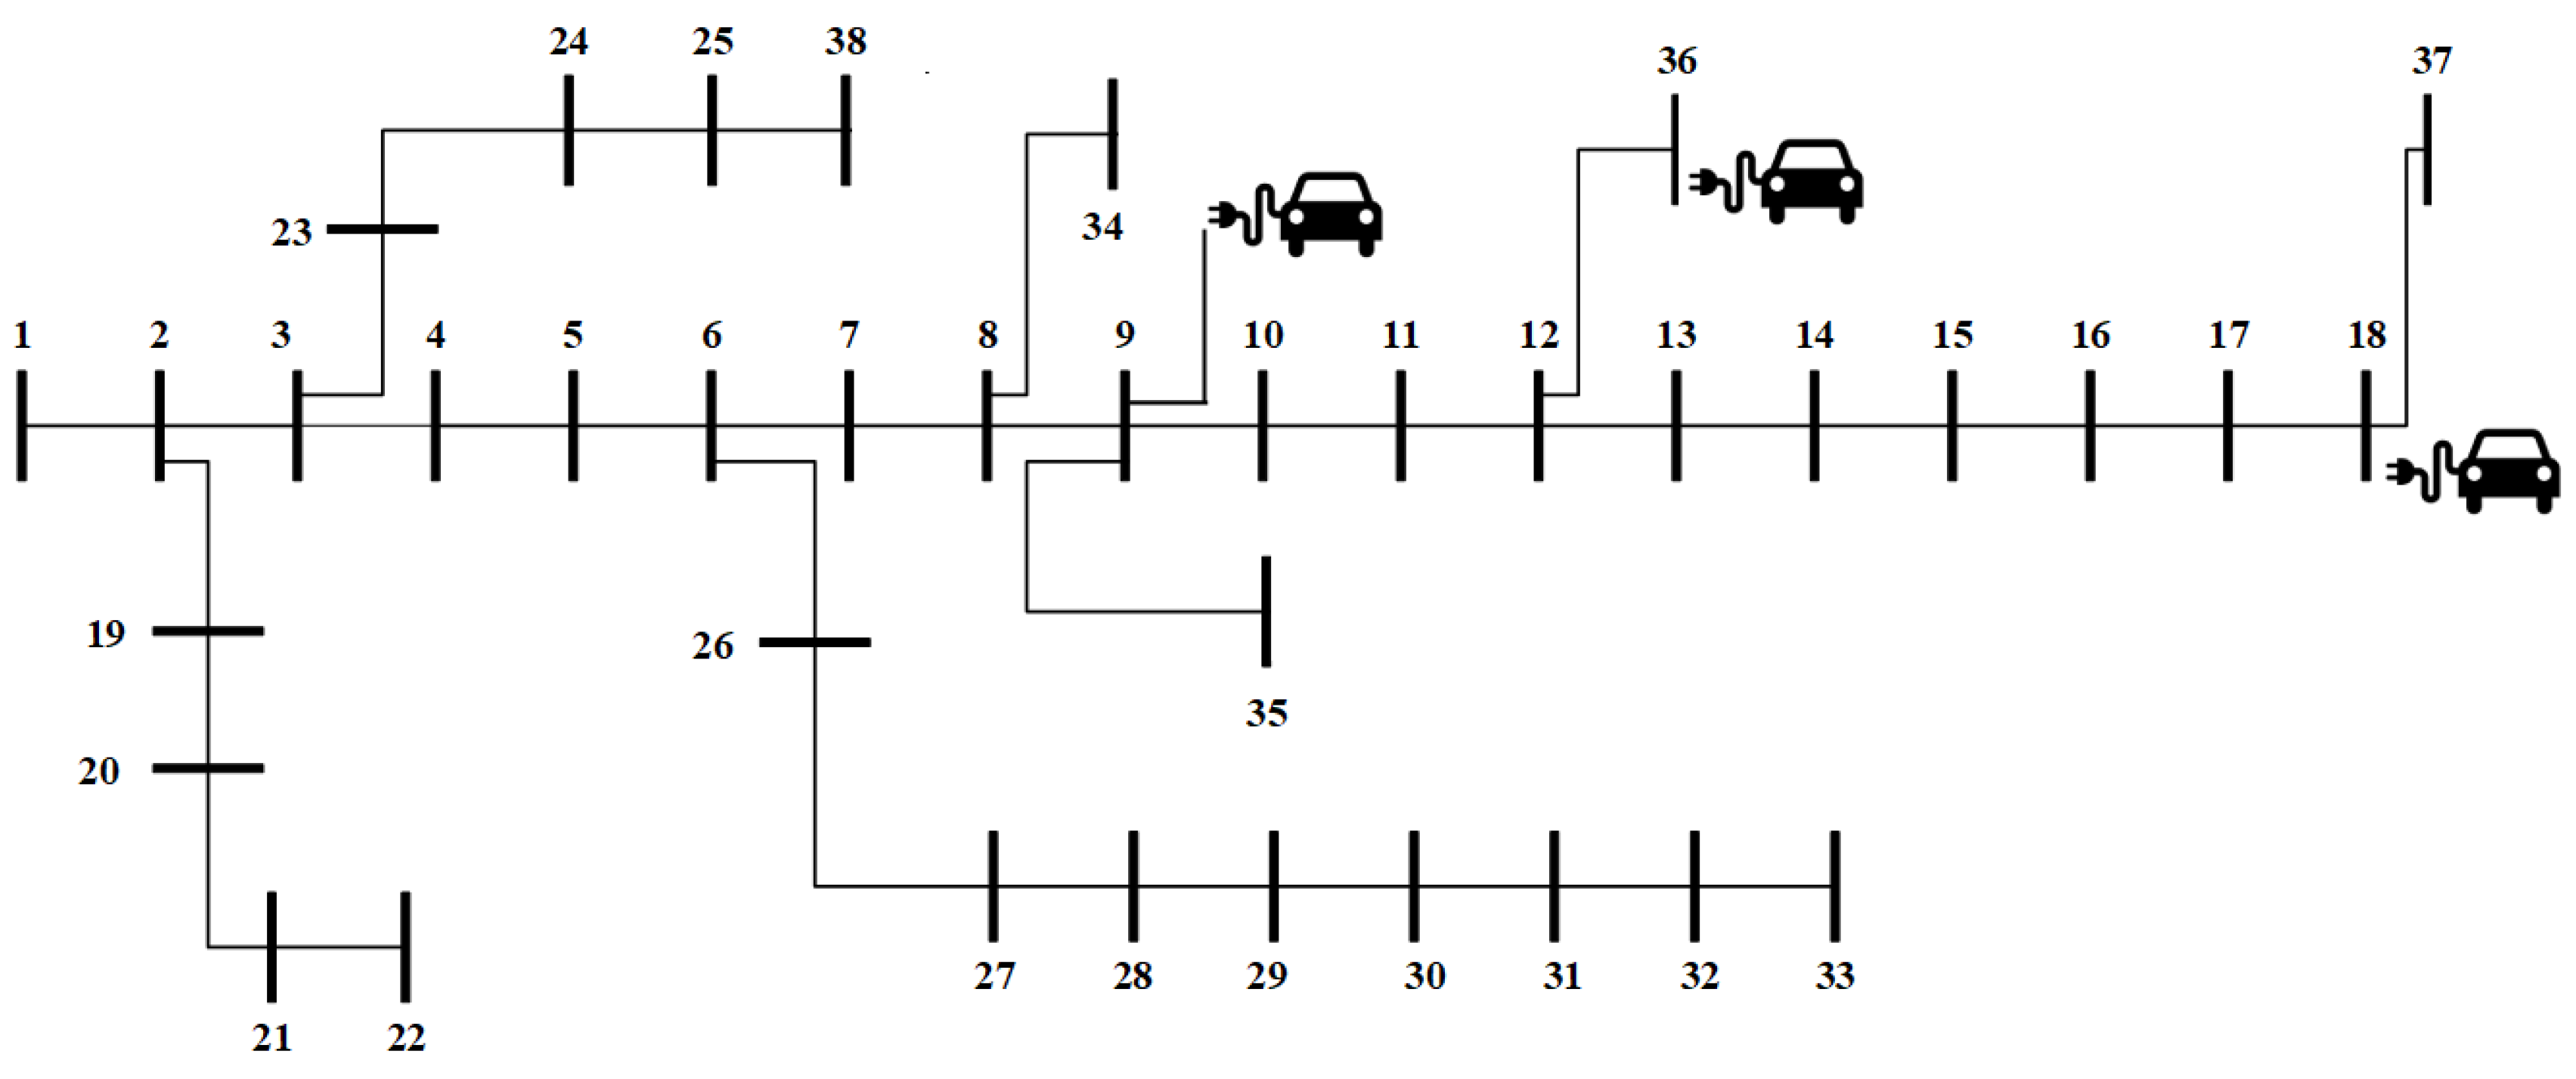
All decision variable constraints are mentioned in Equations (32)–(34), where MDOD is the maximum depth of discharge for each battery.
P n , t E V ,   P i , t E V T o t a l ,   P   i , t D C H T , P t T T   0   ,     n , i , t  
  ( 1 M D O D ) S O C n , t   ,   S O C t T   1
x m , t ,   y m , t , f m , t   , r m , t { 0 , 1 } ,     m , t
The previously mentioned set of constraints can be generalized to model any number of charging stations while taking the computational time and complexity of the model into consideration.

4. Case Studies

The case study is modeled as a mixed-integer-nonlinear programming (MINLP) problem to highlight its effectiveness and the possible contribution of the system. Simulation was conducted on the known IEEE-38 bus system, which can be seen in Figure 3. The system contains 38 buses represented as a set i = { 1 , 2 , 3 , , 38 } . Each EV is assumed to visit the PL once per day and the required energy for each car is provided day-ahead. The maximum battery capacity is set to be 40 kWh for simplicity, but this might be different for each EV. Each EV may require less than or up to this value. The problem was solved using a deterministic approach under the General Algebraic Modeling Software (GAMS) environment(Version 30.3, City Frechen, Country Germany), which is a powerful platform for power system optimization. For the proposed model, the KNITRO solver was used, which includes several algorithms for dealing with continuous problems, such as interior-point and active-set algorithms. The solver uses branch and bound techniques for problems with discrete variables [19].
Three different PLs were examined in the study with the specification illustrated in Table 1. The first PL is supplied from bus 9, whereas the second and third PLs are loaded on buses 18 and 36, respectively. The TT and the traveling energy consumption, which is assumed to be 1 kWh/km, between each PL is calculated offline based on the distance between the buses and average truck speed. Figure 4 represents the variant grid price over the day. The capital cost of the MESS is shared among the three PLs with different percentages of each PL according to its requirements and demand, which is assumed to be equal in this case study. Each PL can receive up to 33% of the available energy. The cost-sharing concept highlights the efficiency of the MESS compared to the multiple stationary ESS to serve each PL separately, because they need to optimally decide for each ESS size considering both capital and operational costs. Because the capital costs are shared (truck cost, battery packs’ costs, driver wage, and annual maintenance costs), the discharged power at each PL is limited according to its share of the capital cost. The economic analysis of the aforementioned costs is part of the long-term research, and is outside the scope of this work.
In this work, two cases were investigated. CASE-1 represents the base case with no MESS unit integrated into the system. CASE-2 represents the proposed approach with MESS dispatching. The EV arrival profiles considered in the study are taken from real parking lots data based in Toronto, Canada [20]; however, many forecasting methods can use historical data to predict the EV arrivals over a period of time, such as the long short-term memory (LSTM) neural network discussed in [21]. This uses a recurrent neural network to forecast time series. The application of such methods considers the EV arrival uncertainties while optimizing the size and location of the MESS for long-term studies, which is outside the scope of this research. In the following subsections, comparisons between the power demand and the costs associated with each PL of each case are presented.

4.1. Case Study-1

Case Study 1 represents the EVs’ demand from each PL without the integration of the MESS. Charging is uncontrolled and once the car is available at the station it starts charging (i.e., first-come-first-served basis).
As shown in Figure 5, the total power demand of each PL is presented, noting that different peaks at different times take place in this scenario. PL1 reports a peak load of 1.03 MW at 4:00 AM, PL2 has a peak load of 0.96 at 5:00 PM, and PL3 has 0.97 MW at 10:00 AM. The results exceed the historical peak by 0.13, 0.11, and 0.17 MW for PL1, PL2, and PL3, respectively. This will reflect higher monthly demand charges as discussed in the next subsection.

4.2. Case Study-2

The MESS is dispatched to serve the associated PLs. It is expected to visit PL1, followed by PL3 and then, finally, PL2, according to the peak times as per Figure 5.
Figure 6 shows the availability of the truck at each PL, in addition to the traveling time, which is mentioned between each PL in Table 1, i.e., one means MESS is available at a PL. The expected visiting order takes place, which proves the functionality of the proposed model. The MESS is available at PL1 from 11:00 AM until 8:00 AM, then travels to PL3 which takes 2 h, and stays at PL3 until 1:00 PM. Finally, it arrives at PL2 at 2:00 PM and stays until 11:00 PM.
The power drained from the system by each charging station after the visit of the MESS is presented in Figure 7, which is, overall, less than the power consumed in the first case study. Each PL has successfully maintained the historical peak, which represents significant monthly savings. The discharging rate and time at each PL are illustrated in Figure 8; this indicates the decision to discharge at the maximum discharging rate because the demand is high and there is available energy in the MESS’s battery, i.e., taking the maximum depth-of-charge into consideration.
Finally, Figure 9 represents the state-of-charge (SOC) of the battery, noting that at the end of the day, 20% of the battery is maintained, which achieves the MDOD limit. The Nikola One truck [22] was selected and used because it has a payload capacity of more than 29,000 kg, which can accommodate the battery packs with a total capacity of 4 MWh and a total weight of approximately 26,000 kg, according to [23]. According to the average speed assumed in Table 2 and the approximate energy consumption rate presented in [23], the traveling consumption is reflected in the SOC level reduction during the traveling time, as shown in Figure 9. The battery degradation cost of the MESS’s battery is calculated considering a capital cost of energy capacity of $271/kWh, power conversion system cost of $288/kW (taken from [24]), an O&M cost of 0.03 cents/kWh [24], and a second-life battery selling price of $50/kWh [25]. This results in a charge/discharge cost of $0.050616/kWh.
A summary of the total cost of all case studies is shown in Table 3. In case 1, the energy cost for PL1, PL2, and PL3 is $89.97, $205.512, and $214.88, respectively, resulting in a total energy cost of $510.307. By comparison, case 2 reports $60.847, $139.869, and $156.13 for PL1, PL2, and PL3, respectively, with a total energy cost of $356.846. The energy cost saving is $153.461, which represents a saving of 30%. The degradation cost is $151.848, resulting in a total operational cost of $508.694. The historical peaks are assumed to be 0.9, 0.85, and 0.8 MW, which represent 92%, 88%, and 83% of the peak load for PL1, PL2, and PL3, respectively. These peak powers reflect extra demand charges of $533, $450, and $697 for PL1, PL2, and PL3, respectively. The demand charge rate is assumed to be $4.1/kW. It is important to mention that the demand charges are paid monthly, i.e., extra demand charge savings are monthly savings, whereas the operational energy consumption is daily savings. With the help of the MESS, the PLs maintained the historical peak demand level, which completely removed the extra peak demand charges, in addition to providing daily operational savings and a marginal profit that could be applied on the energy sold to the EVs.

5. Conclusions

Distribution networks will face a number of challenges due to the rapid increase in the number of EVs and the increasing load demand to charge these EVs. Due to the uncertainty of these loads, many technical issues will arise, such as congestion on the distribution side and voltage drops. The technology of storage systems has gained significant attention and has been the focus of rigorous study. This paper proposes a scheduling algorithm for an MESS to address the increased demand for charging stations within a specific area. Two case studies were discussed to illustrate the contribution of the proposed algorithm. The proposed algorithm successfully reduced the total operational cost of each of the three PLs associated with the case study, as shown by a 30% reduction in the aforementioned costs in the simulation results. Additionally, if demand exceeds the generation limit, excess energy is required to fulfill this unmet demand, which can be readily supplied using the MESS; it would not be possible to meet this demand without the proposed system. Furthermore, the monthly demand charges are reduced because the peak demand maintained the historical peak level with the help of the MESS.

Author Contributions

Conceptualization, M.F.S., M.A.A. and M.M.; methodology, M.M.E. and M.F.S.; software, M.M.E.; validation, M.F.S., M.M., M.A.A. and A.A.; formal analysis, M.M.E., M.F.S., and M.M.; investigation, M.A.A. and A.A.; resources, M.F.S.; data curation, M.M.E. and M.F.S.; writing—original draft preparation, M.M.E.; writing—review and editing, M.M.E., M.F.S., M.A.A., A.A., and M.M.; visualization, M.M.E.; supervision, M.F.S., M.A.A., A.A. and M.M.; project administration, M.F.S.; funding acquisition, M.F.S. All authors have read and agreed to the published version of the manuscript.

Funding

This project was funded by the American University of Sharjah (AUS), Sharjah, UAE, under project No. (FRG19-L-E73). The authors, therefore, gratefully acknowledge AUS’s technical and financial support.

Institutional Review Board Statement

Not applicable.

Informed Consent Statement

Not applicable.

Data Availability Statement

The data presented in this study are available on request from the corresponding author upon reasonable request. The data that support the findings of this study are not openly available due to privacy.

Conflicts of Interest

The authors declare no conflict of interest. The funders had no role in the design of the study; in the collection, analyses, or interpretation of data; in the writing of the manuscript, or in the decision to publish the results.

References

  1. Olabi, A.G.; Wilberforce, T.; Abdelkareem, M.A.; Ramadan, M. Critical Review of Flywheel Energy Storage System. Energies 2021, 14, 2159. [Google Scholar] [CrossRef]
  2. Hesse, H.; Schimpe, M.; Kucevic, D.; Jossen, A. Lithium-Ion Battery Storage for the Grid—A Review of Stationary Battery Storage System Design Tailored for Applications in Modern Power Grids. Energies 2017, 10, 2107. [Google Scholar] [CrossRef] [Green Version]
  3. Babaei, S.; Steen, D.; Le, T.A.; Carlson, O.; Bertling, L. Effects of plug-in electric vehicles on distribution systems: A real case of Gothenburg. In Proceedings of the 2010 IEEE PES Innovative Smart Grid Technologies Conference Europe (ISGT Europe), Gothenburg, Sweden, 11–13 October 2010; pp. 1–8. [Google Scholar]
  4. Shalaby, A.A.; Shaaban, M.F.; Mokhtar, M.; Zeineldin, H.H.; El-Saadany, E.F. Optimal Day-ahead Operation for a PV-based Battery Swapping Station for Electric Vehicles. In Proceedings of the 2021 6th International Symposium on Environment-Friendly Energies and Applications (EFEA), Sofia, Bulgaria, 24–26 March 2021; pp. 1–8. [Google Scholar]
  5. Deshmukh, R.R.; Ballal, M.S. An energy management scheme for grid connected EVs charging stations. In Proceedings of the 2018 International Conference on Power, Instrumentation, Control and Computing (PICC), Thrissur, India, 18–20 January 2018; pp. 1–6. [Google Scholar]
  6. Chaudhari, K.; Ukil, A.; Kumar, K.N.; Manandhar, U.; Kollimalla, S.K. Hybrid Optimization for Economic Deployment of ESS in PV Integrated EV Charging Station. IEEE Trans. Ind. Inform. 2017, 14, 106–116. [Google Scholar] [CrossRef]
  7. Shojaabadi, S.; Abapour, S.; Abapour, M.; Nahavandi, A. Optimal planning of plug-in hybrid electric vehicle charging station in distribution network considering demand response programs and uncertainties. IET Gener. Transm. Distrib. 2016, 10, 3330–3340. [Google Scholar] [CrossRef]
  8. Panwar, L.K.; Reddy, S.; Verma, A.; Panigrahi, B.K.; Kumar, R. Optimal schedule of plug in electric vehicles in smart grid with constrained parking lots. In Proceedings of the 2016 IEEE 6th International Conference on Power Systems (ICPS), New Delhi, India, 4–6 March 2016; pp. 1–6. [Google Scholar]
  9. Sortomme, E.; El-Sharkawi, M.A. Optimal charging strategies for unidirectional vehicle-to-grid. IEEE Trans. Smart Grid 2011, 2, 131–138. [Google Scholar] [CrossRef]
  10. Oceano, A.; Rodella, G.; Rizzo, R.; di Noia, L.P.; Brusaglino, G. Grid balancing support through Electric Vehicles mobile storage. In Proceedings of the 2020 International Symposium on Power Electronics, Electrical Drives, Automation and Motion (SPEEDAM), Sorrento, Italy, 24–26 June 2020; pp. 108–113. [Google Scholar]
  11. SSamara, M.; Shaaban, M.F.; Osman, A. Management of Mobile Energy Generation and Storage System. In Proceedings of the 2019 IEEE PES GTD Grand International Conference and Exposition Asia (GTD Asia), Bangkok, Thailand, 19–23 March 2019; pp. 450–454. [Google Scholar]
  12. Abdeltawab, H.; Mohamed, Y.A.I. Mobile Energy Storage Sizing and Allocation for Multi-Services in Power Distribution Systems. IEEE Access. 2019, 7, 176613–176623. [Google Scholar] [CrossRef]
  13. Yu, R.; Zhong, W.; Xie, S.; Yuen, C.; Gjessing, S.; Zhang, Y. Balancing Power Demand Through EV Mobility in Vehicle-to-Grid Mobile Energy Networks. IEEE Trans. Ind. Inform. 2016, 12, 79–90. [Google Scholar] [CrossRef]
  14. Yan, Y.; Yu, B.; Ouyang, F.; Zhu, W.; Li, H. Study on the Control Strategy of Mobile Battery Energy Storage for the Overload Elimination of Distribution Transformer. In Proceedings of the 2020 12th IEEE PES Asia-Pacific Power and Energy Engineering Conference (APPEEC), Nanjing, China, 17–19 April 2020; pp. 1–5. [Google Scholar]
  15. Nakhodchi, N.; Aghli, N.; Alishahi, S.; Pourarab, M.H. Design and successful utilisation of the first multi-purpose mobile distributed energy storage system in Iran. CIRED Open Access Proc. J. 2017, 2017, 109–111. [Google Scholar] [CrossRef] [Green Version]
  16. Kim, J.; Dvorkin, Y. Enhancing Distribution System Resilience with Mobile Energy Storage and Microgrids. IEEE Trans. Smart Grid 2019, 10, 4996–5006. [Google Scholar] [CrossRef]
  17. Sanchez-Martin, P.; Sanchez, G.; Morales-Espana, G. Direct Load Control Decision Model for Aggregated EV Charging Points. IEEE Trans Power Syst. 2012, 27, 1577–1584. [Google Scholar] [CrossRef]
  18. Kronqvist, J.; Bernal, D.; Lundell, A.; Grossmann, I. A review and comparison of solvers for convex MINLP. Optim. Eng. 2019, 20, 397–455. [Google Scholar] [CrossRef] [Green Version]
  19. Haidl, P.; Buchroithner, A.; Schweighofer, B.; Bader, M.; Wegleiter, H. Lifetime Analysis of Energy Storage Systems for Sustainable Transportation. Sustainability 2019, 11, 6731. [Google Scholar] [CrossRef] [Green Version]
  20. Toronto Parking Authority, City of Toronto. 2021. Available online: https://www.toronto.ca/city-government/accountability-operations-customer-service/city-administration/city-managers-office/agencies-corporations/agencies/toronto-parking-authority/ (accessed on 2 March 2021).
  21. Le, X.-H.; Ho, H.V.; Lee, G.; Jung, S. Application of Long Short-Term Memory (LSTM) Neural Network for Flood Forecasting. Water 2019, 11, 1387. [Google Scholar] [CrossRef] [Green Version]
  22. Nikola One. Available online: https://nikolamotor.com/one (accessed on 1 May 2021).
  23. BU-1003: Electric Vehicle (EV)—Battery University, Batteryuniversity.com. Available online: https://batteryuniversity.com/learn/article/electric_vehicle_ev (accessed on 2 May 2021).
  24. Mongird, K.; Viswanathan, V.V.; Balducci, P.J.; Alam, M.J.E.; Fotedar, V.; Koritarov, V.S.; Hadjerioua, B. Hydro Wires, Energy Storage Technology and Cost Characterization Report; U.S. Department of Energy: Washington, DC, USA, 2019.
  25. Zhao, Y.; Pohl, O.; Bhatt, A.I.; Collis, G.E.; Mahon, P.J.; Rüther, T.; Hollenkamp, A.F. A Review on Battery Market Trends, Second-Life Reuse, and Recycling. Sustain. Chem. 2021, 2, 167–205. [Google Scholar] [CrossRef]
Figure 1. Distribution system with multiple PLs.
Energies 14 02969 g001
Figure 2. Capturing rising and falling edges of x m , t .
Energies 14 02969 g002
Figure 3. The 38-bus power distribution system under study.
Energies 14 02969 g003
Figure 4. Grid price per hour for one day.
Energies 14 02969 g004
Figure 5. Power demand of each PL.
Energies 14 02969 g005
Figure 6. Availability of the MESS at each PL.
Energies 14 02969 g006
Figure 7. Power demand of each PL after MESS visits.
Energies 14 02969 g007
Figure 8. Case study 2-MESS discharging rate.
Energies 14 02969 g008
Figure 9. MESS results: battery SOC.
Energies 14 02969 g009
Table 1. Model parameters.
PLs Specifications Value
EVs battery capacity40 kWh
Maximum charging rate9.6 kW
Maximum depth of discharge (MDOD)80%
Chargers Available in PL1121
Chargers Available in PL2144
Chargers Available in PL3168
TT between PL1 and PL21 h
TT between PL2 and PL32 h
TT between PL1 and PL31 h
Table 2. MESS parameters.
MESS SpecificationsValue
Maximum discharge rate of MESS200 kW
Total batteries capacity4 MWh
Battery packs weights26,000 kg
Truck payload capacity>29,000 kg
Average speed assumption60 km/h
Table 3. Summary of simulation results.
LabelHistorical PeaksDemand Charge RateCase Study-1Case Study-2
Energy CostExtra Demand ChargesEnergy CostExtra Demand ChargesBattery Degredation Cost
Parking lot 10.9 MW$4.1/kW$89.97$533$60.8470$151.848
Parking lot 20.85 MW$205.512$450$139.8690
Parking lot 30.8 MW$214.88$697$156.130
Total--$510.307$1680$356.8460$151.848
$2190.307$508.694
Publisher’s Note: MDPI stays neutral with regard to jurisdictional claims in published maps and institutional affiliations.

