
Towards 100% Renewables by 2030: Transition Alternatives for a Sustainable Electricity Sector in Isla de la Juventud, Cuba

Abstract
1. Introduction
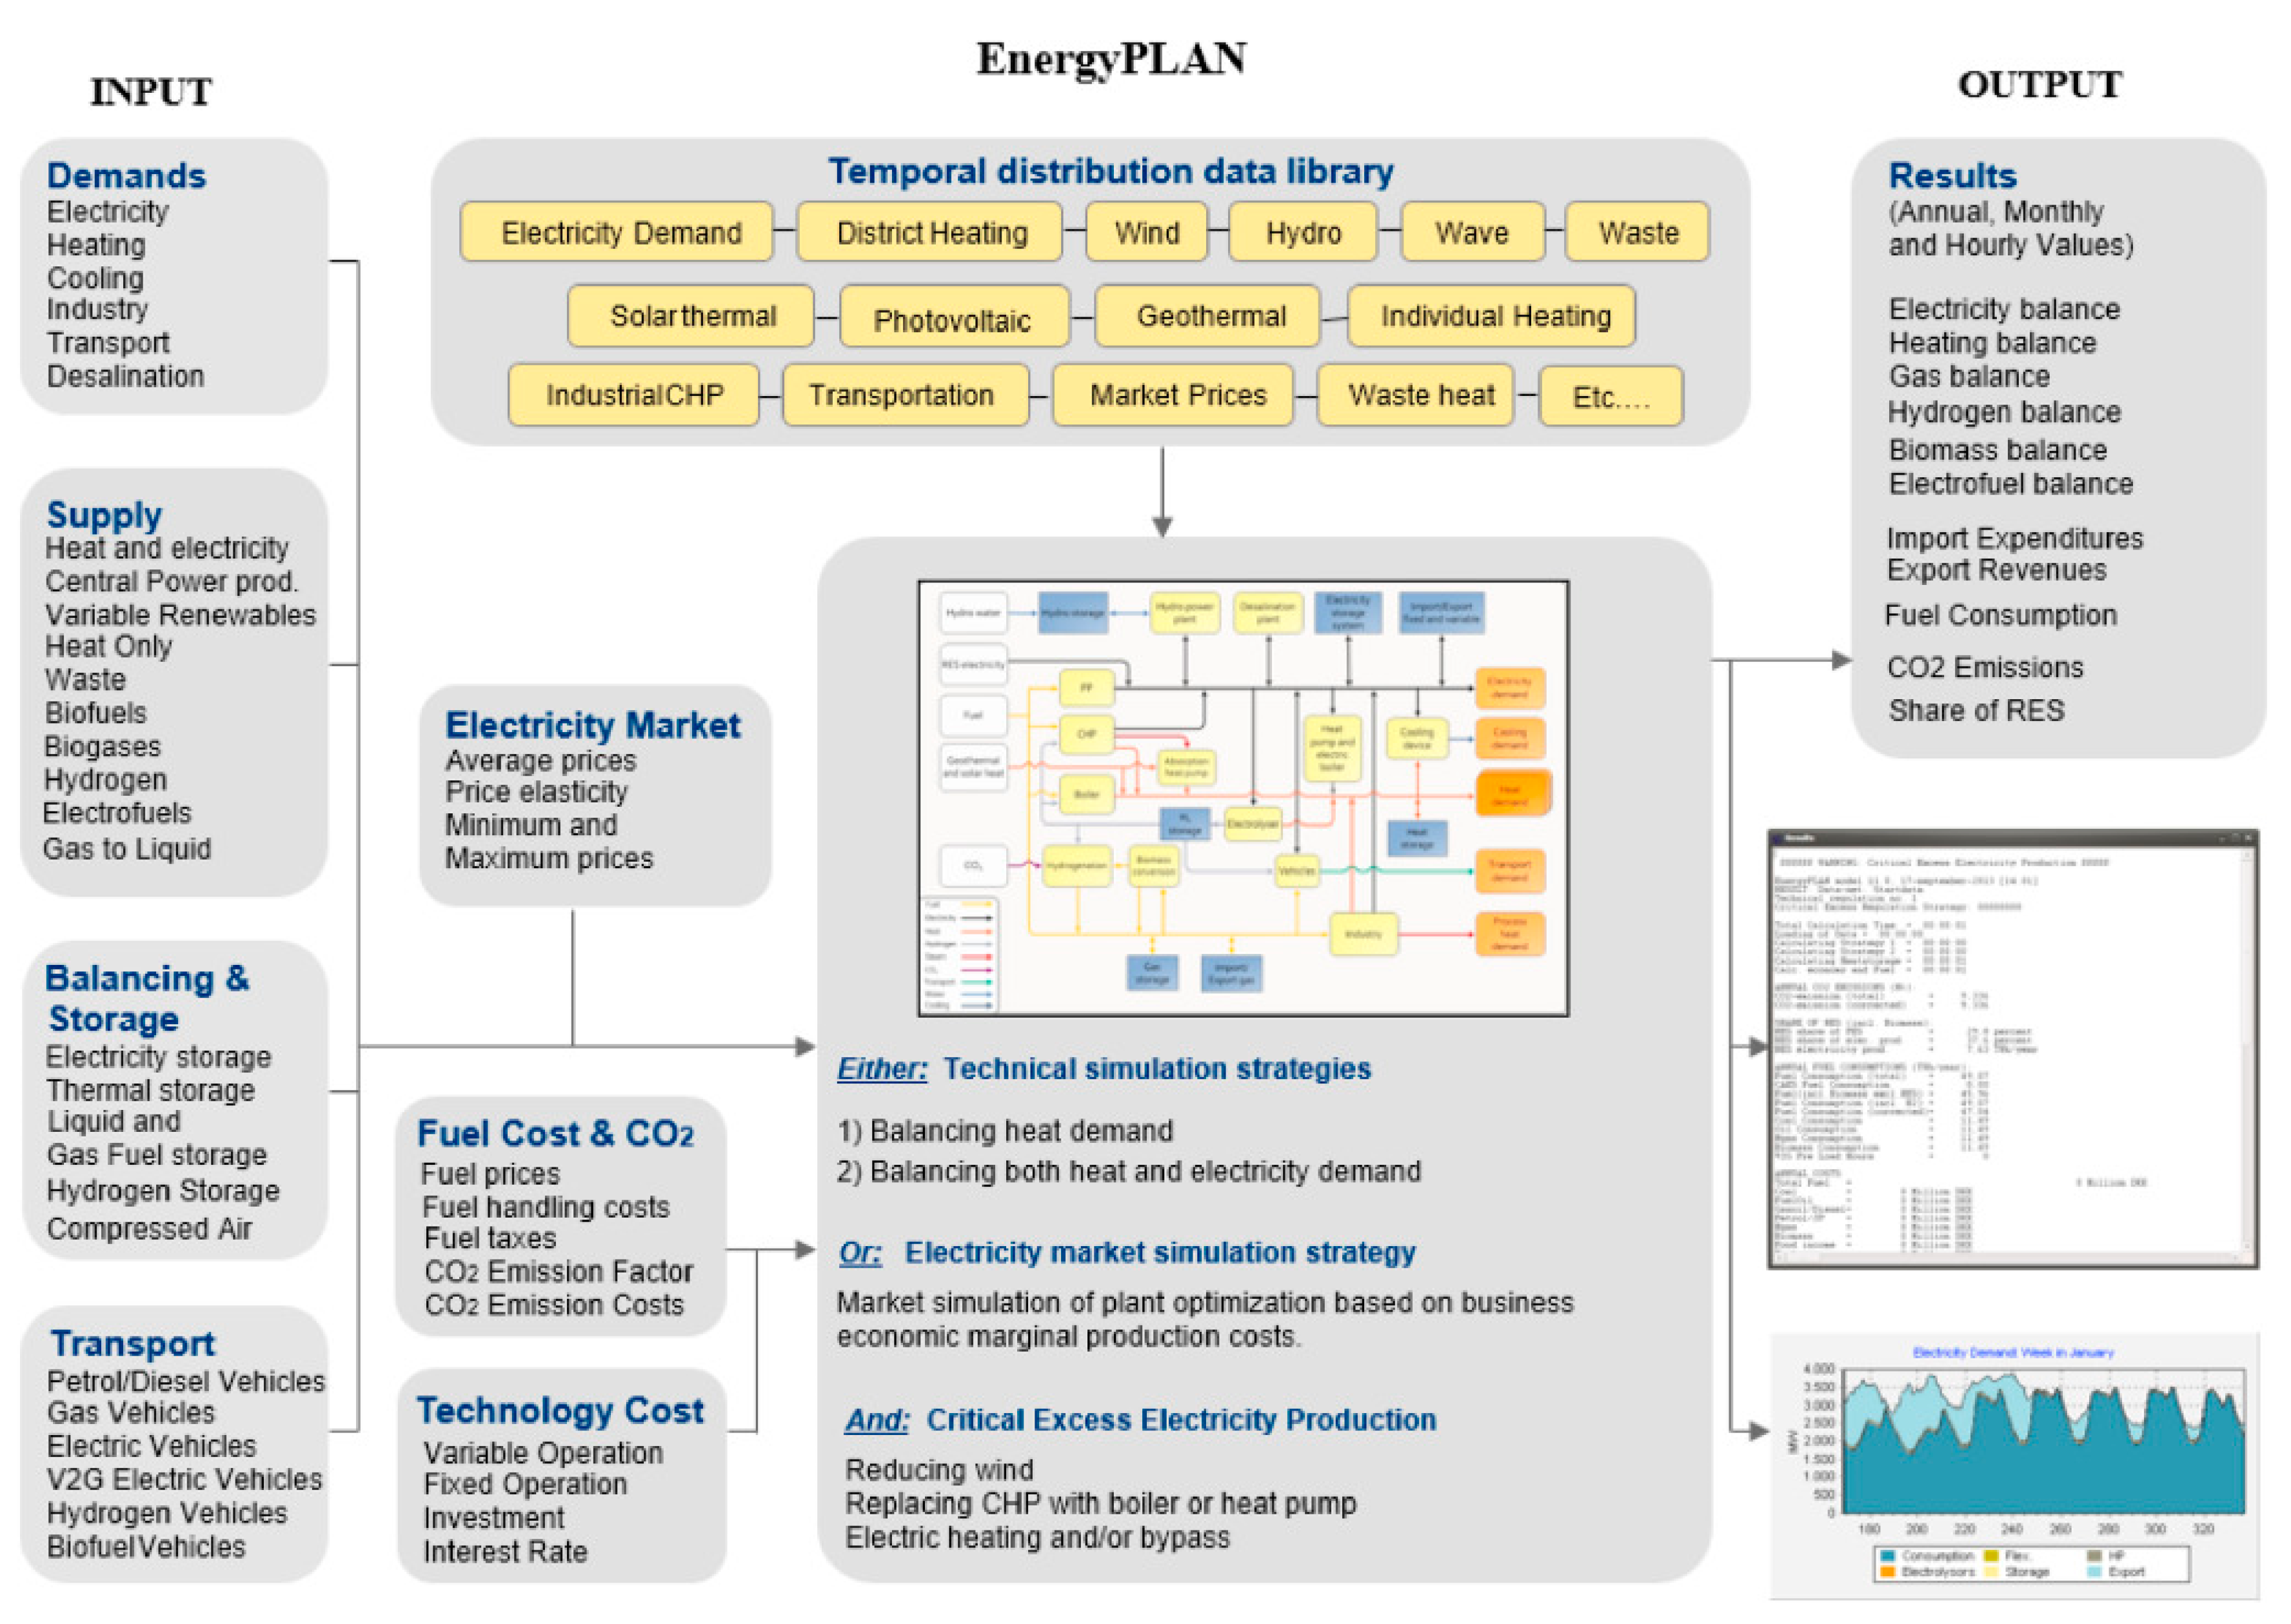
2. Materials and Methods
- Holistic, looking at the energy sector as a whole;
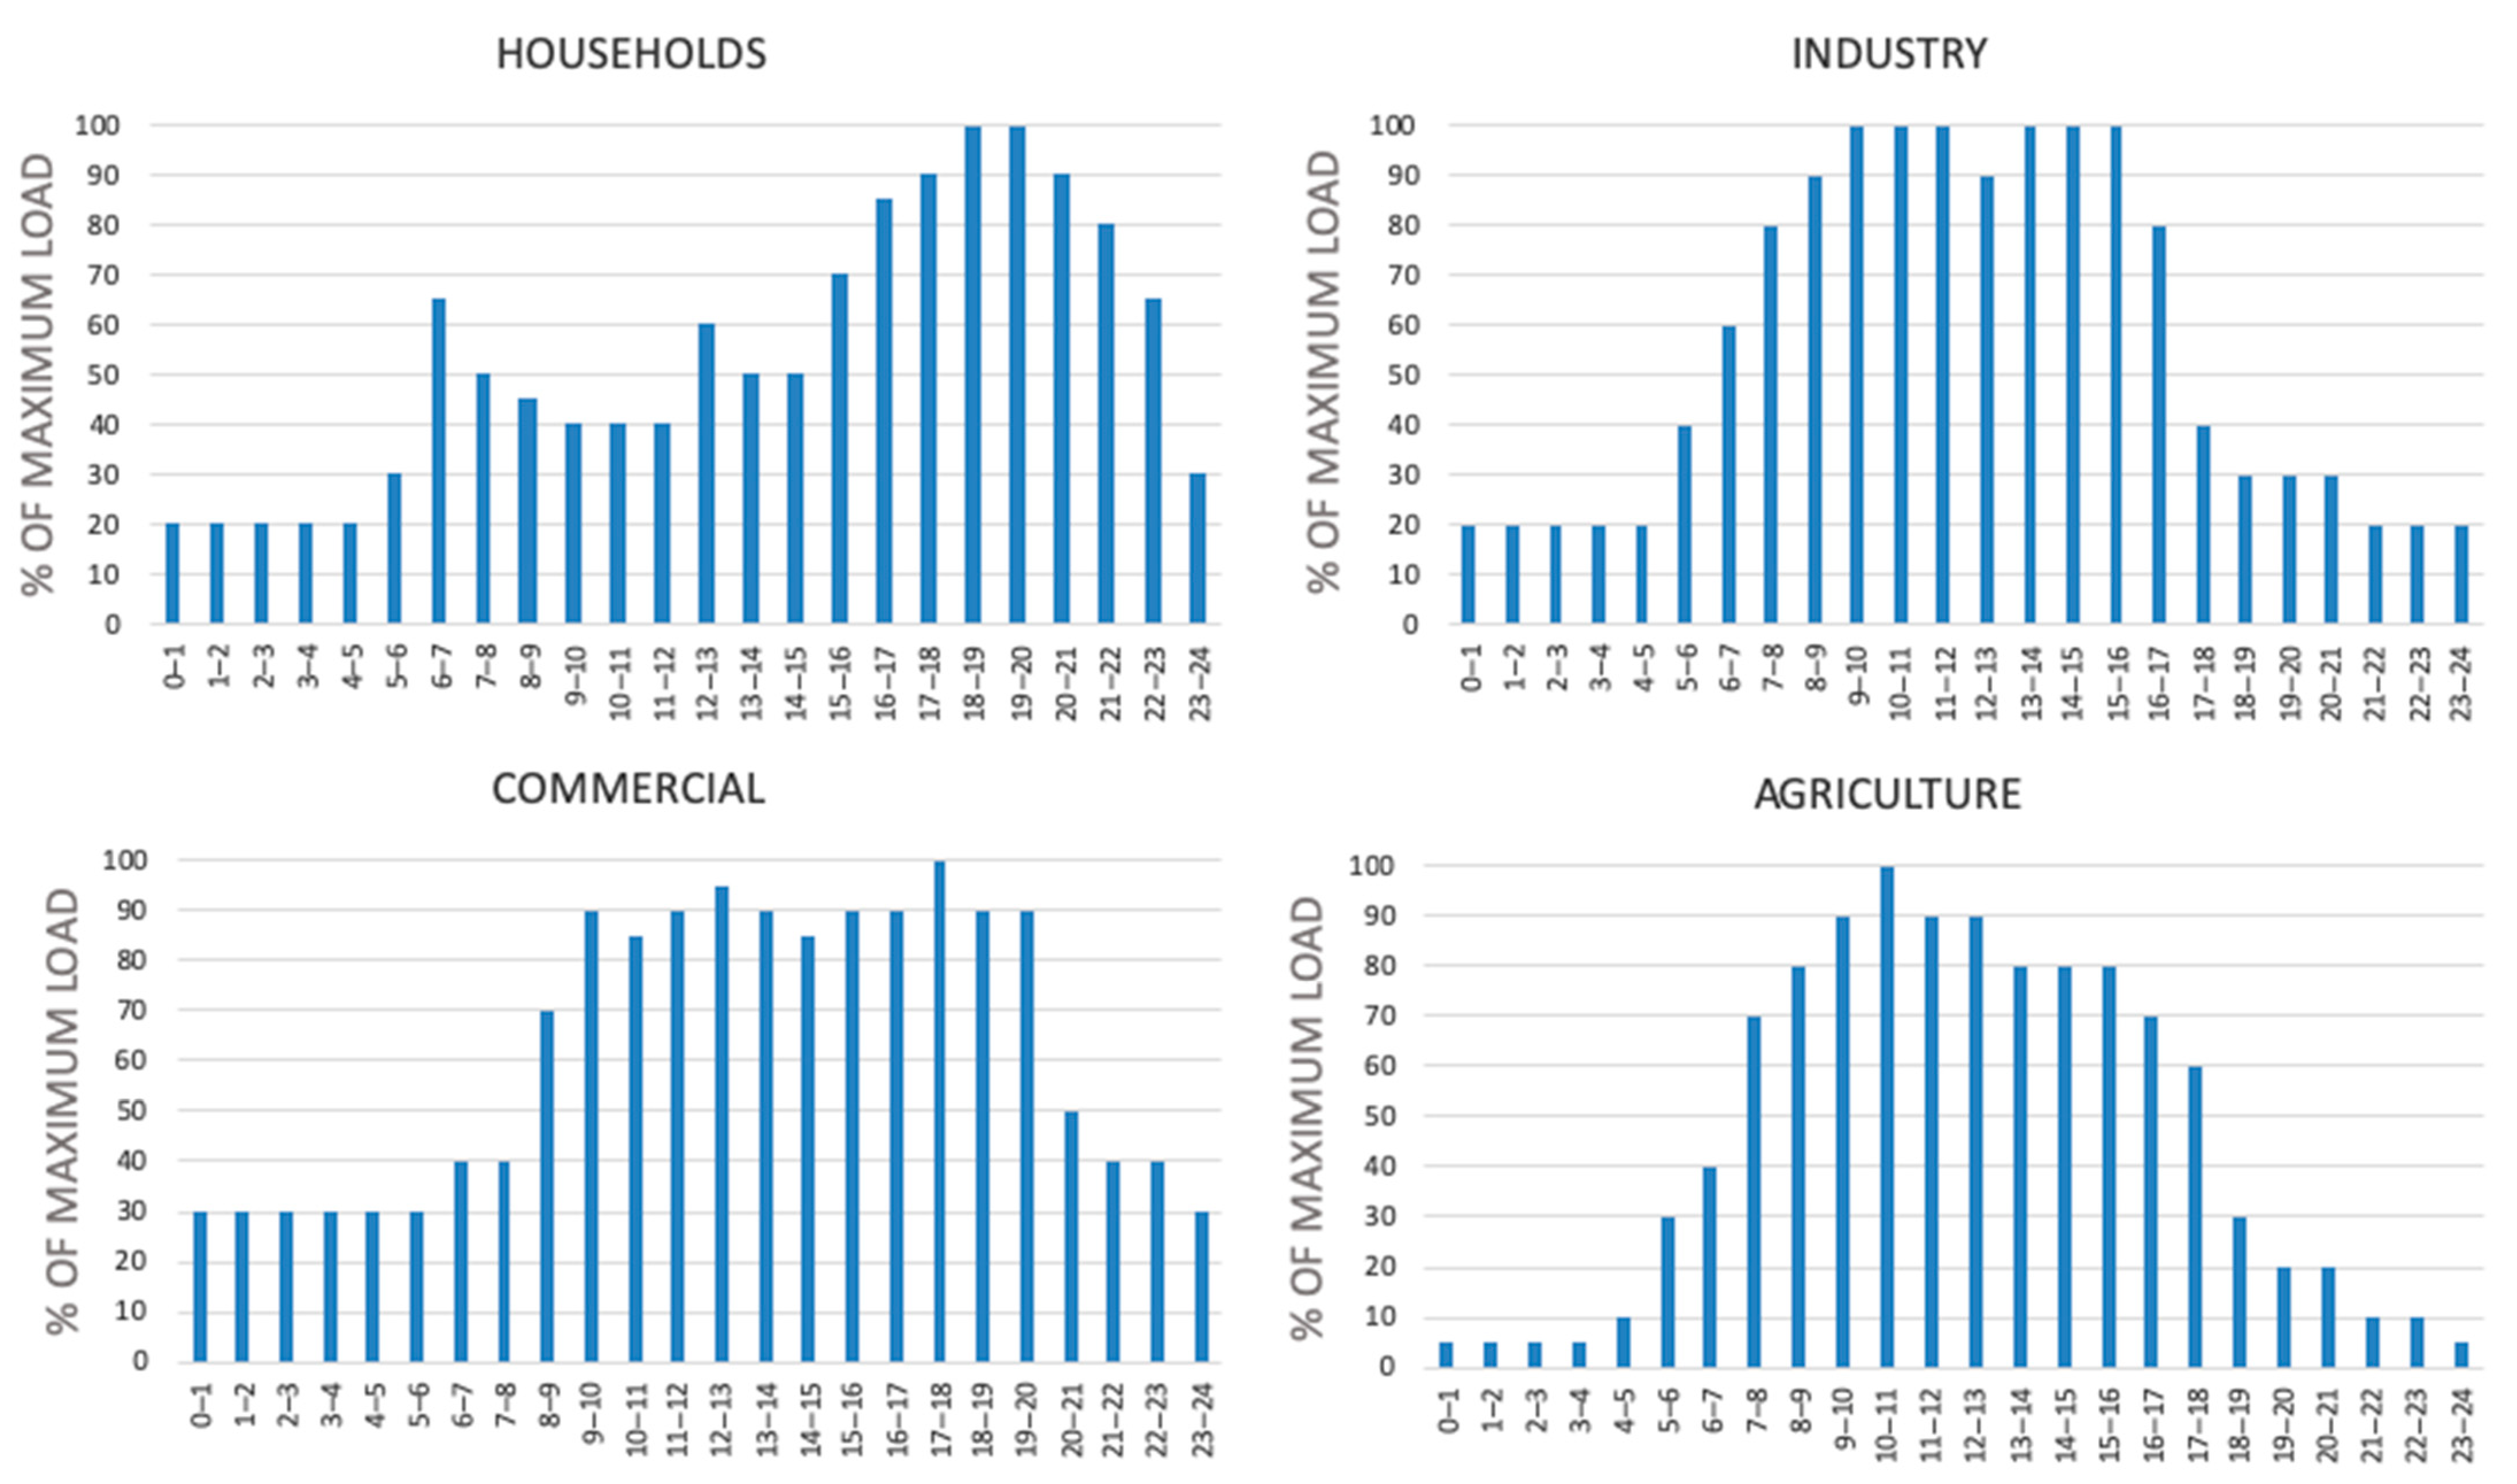
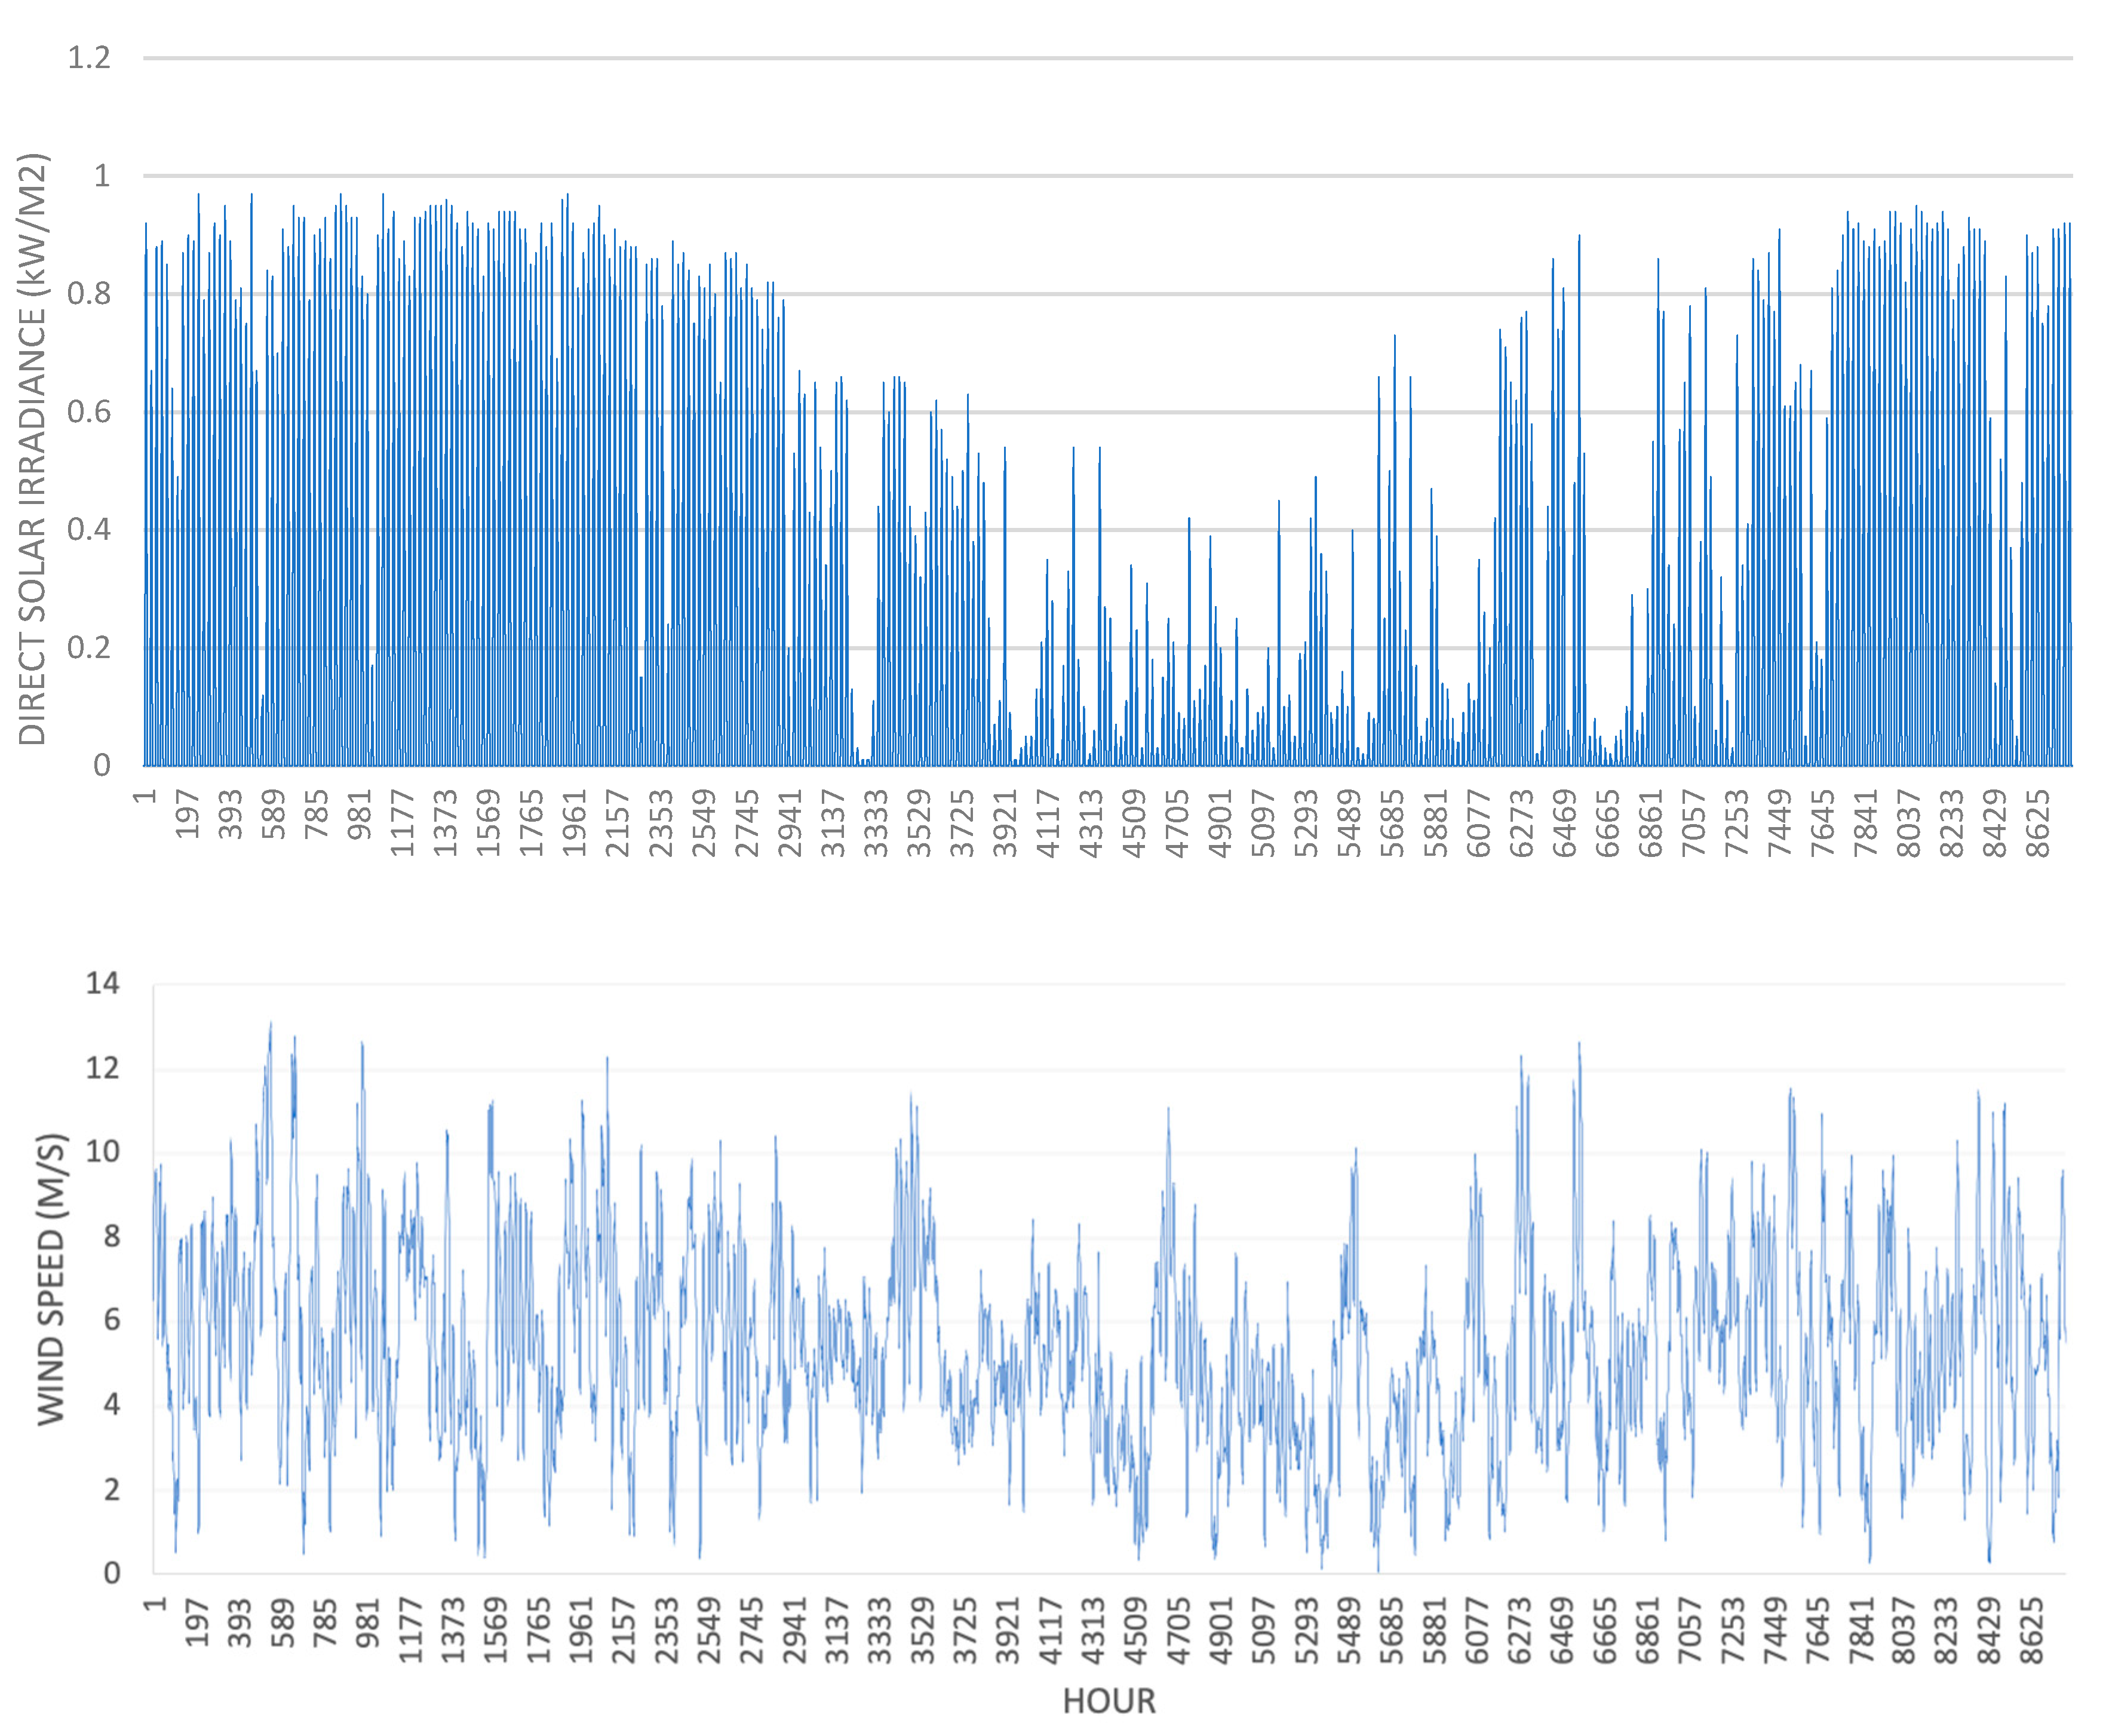
- Hourly, utilizing hourly distribution of both demand and supply;
- Yearly, providing annual analysis of the year analyzed;
- Aggregated, including both the technical and economic aspects of the energy system;
- Fast, utilizing simple programming to provide fast simulation of the input data, and
- Analytically programmed with Delphi Pascal [2].
- Eleven diesel and heavy fuel oil generators with an installed capacity of 35.44 MW, of which: four units of MAN diesel generators with a capacity of 3.85 MW (each); four units of BAZAN diesel generators with a capacity of 3.6 MW (each); three units of MTU fuel oil generators with a capacity of 1.88 MW (each). The generation system is mainly operated by the MAN generators with BAZAN providing the needed reserves and MTU generators generating for the maximum peaks;
- Three solar photovoltaic (PV) parks with a total installed capacity of 4.2 MW;
- Two biomass gasification plants with a total installed capacity of 0.5 MW;
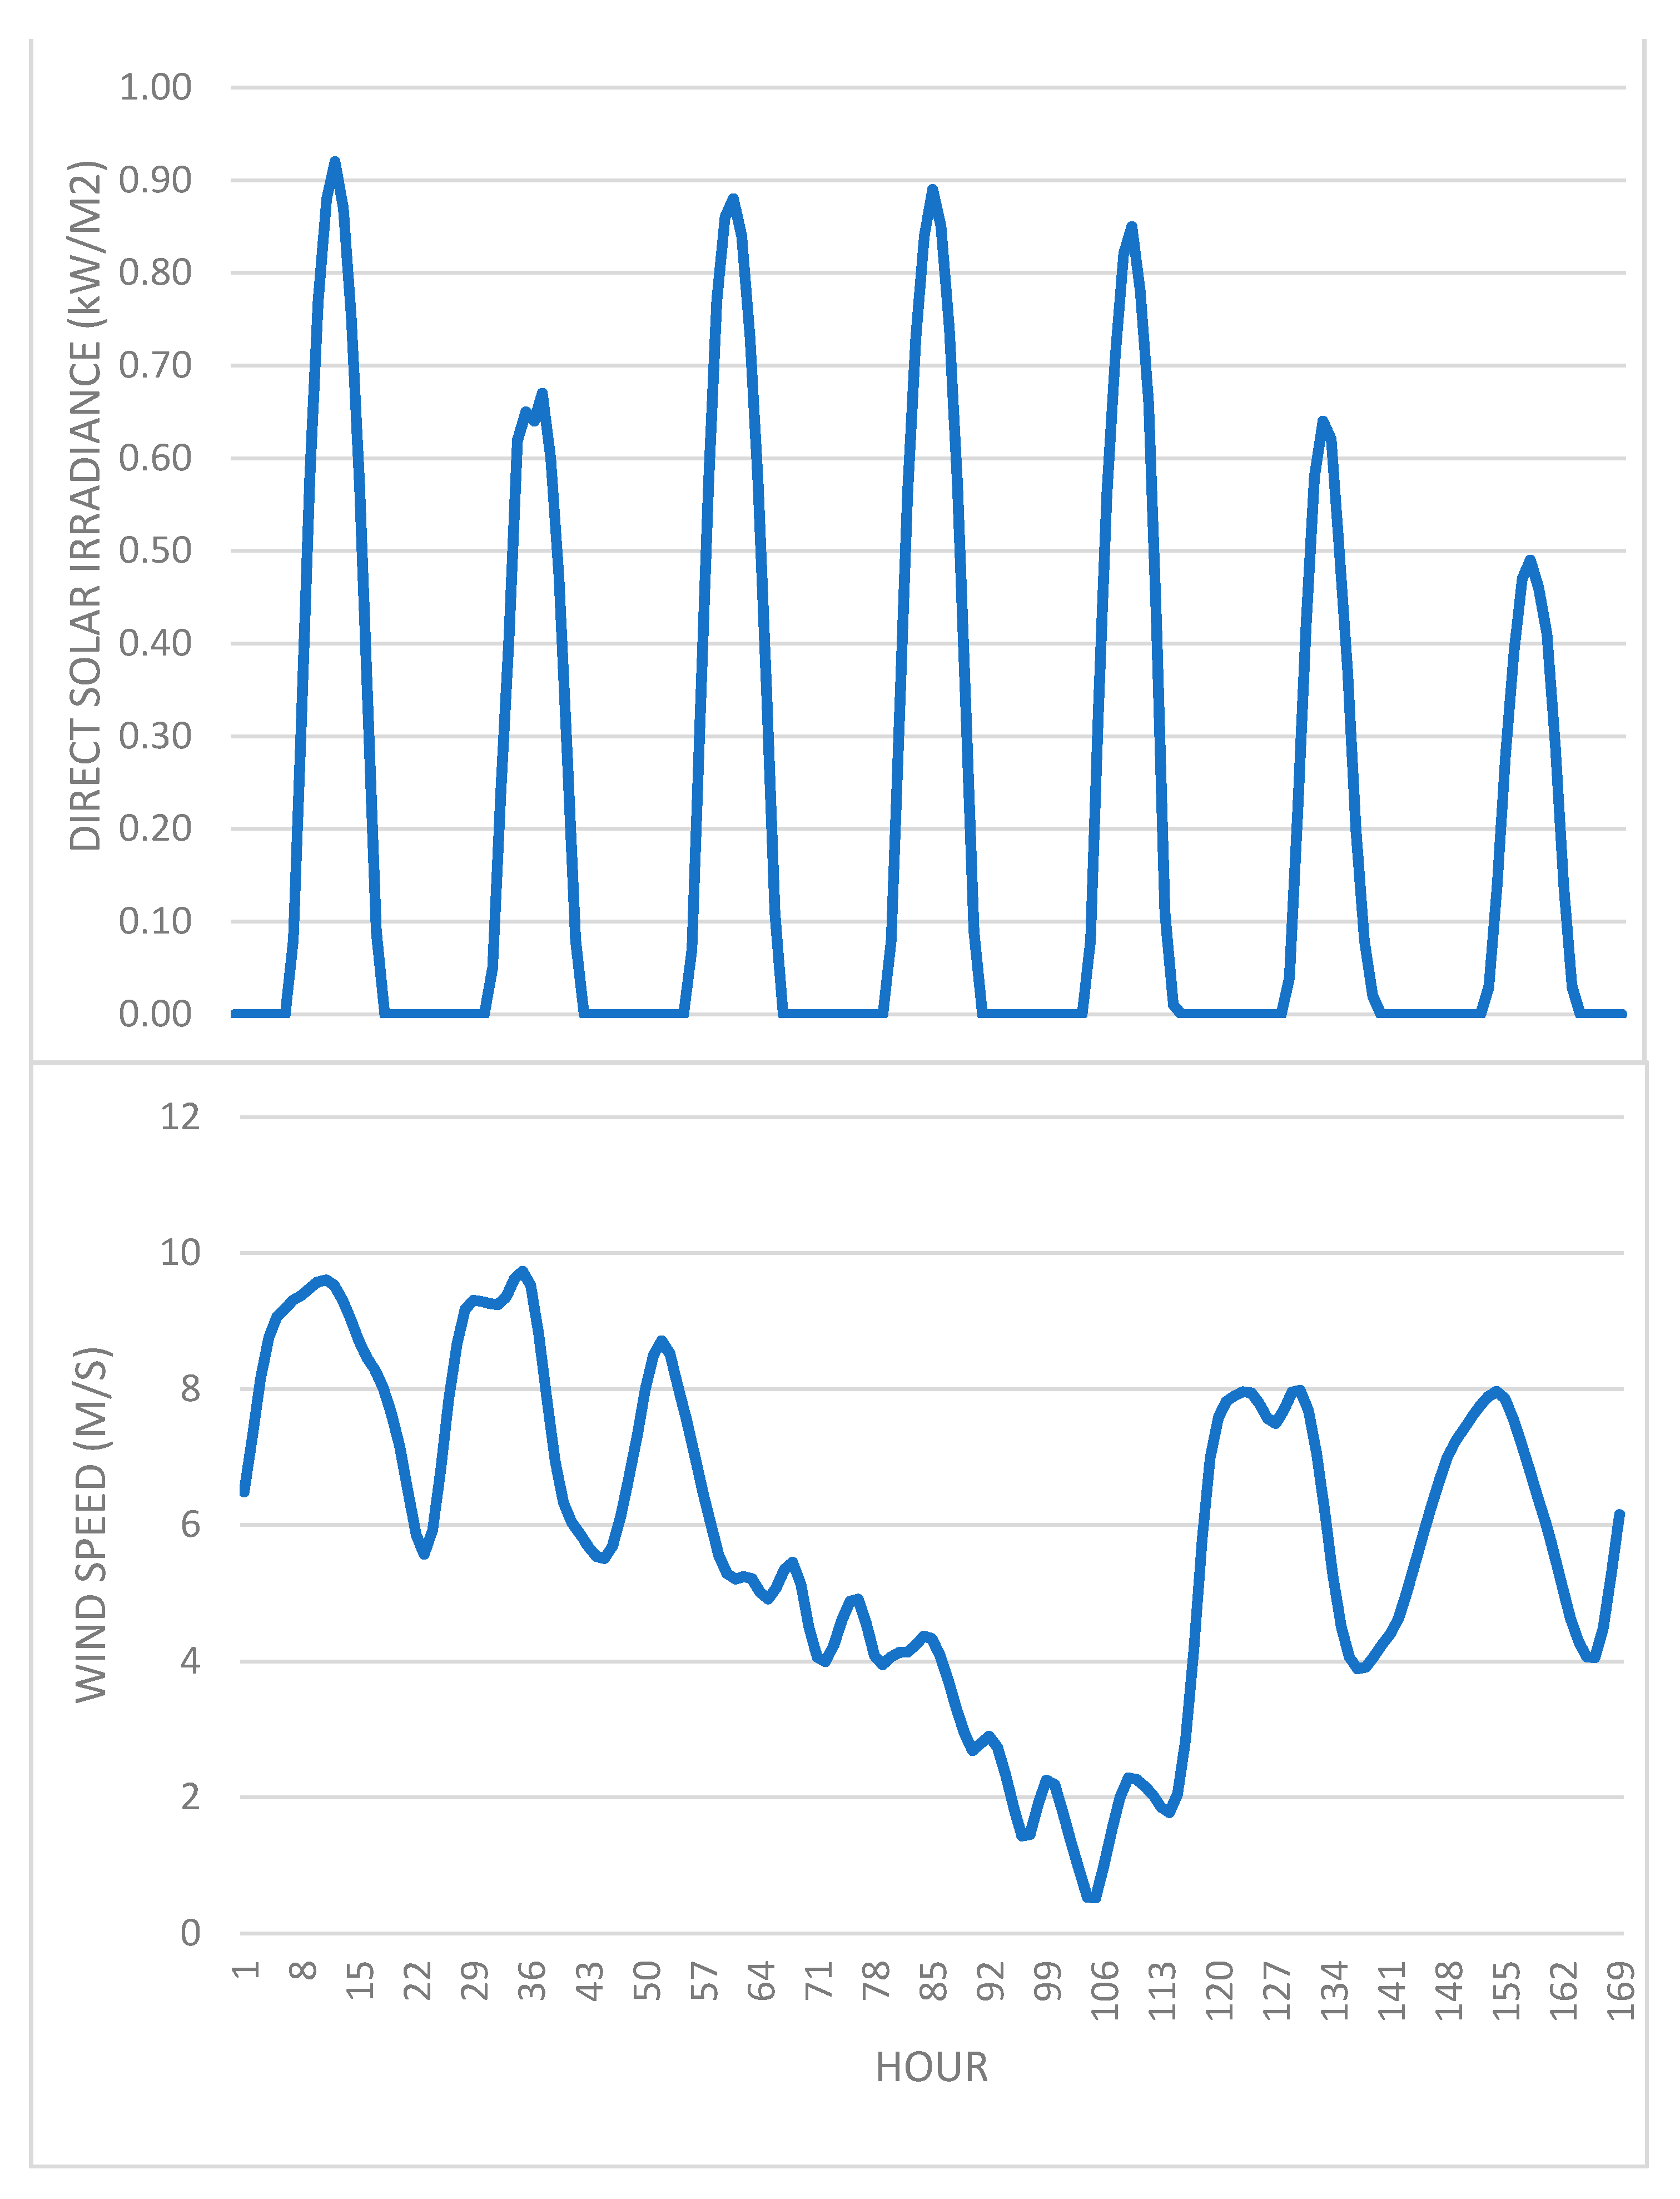
- One wind park with a total installed capacity of 1.65 MW;
- The expert estimated efficiencies of the electric generation plants are: diesel and fuel oil plants: 0.45; solar PV: 0.22 (capacity factor); wind: 0.30 (capacity factor); biomass: 0.30;
- IRENA cost database [6] is used for the investment, operational and maintenance costs, and interest rates and CO2 emission costs are set to 0.
- Operational costs in fuels utilize global market prices excluding the costs of transportation (import and local transport). Diesel and fuel oil are set to 12 USD/GJ and biofuels at 20USD/GJ.
- Investment costs of wind and solar (1473 USD/kW and 995 USD/kW), diesel and fuel oil powerplants (1000 USD/kW) with an investment period of 25 years and operation and maintenance costs of (2%, 0.1% and 2%, respectively) follow the current market prices and expert evaluations in Cuba.
3. Results
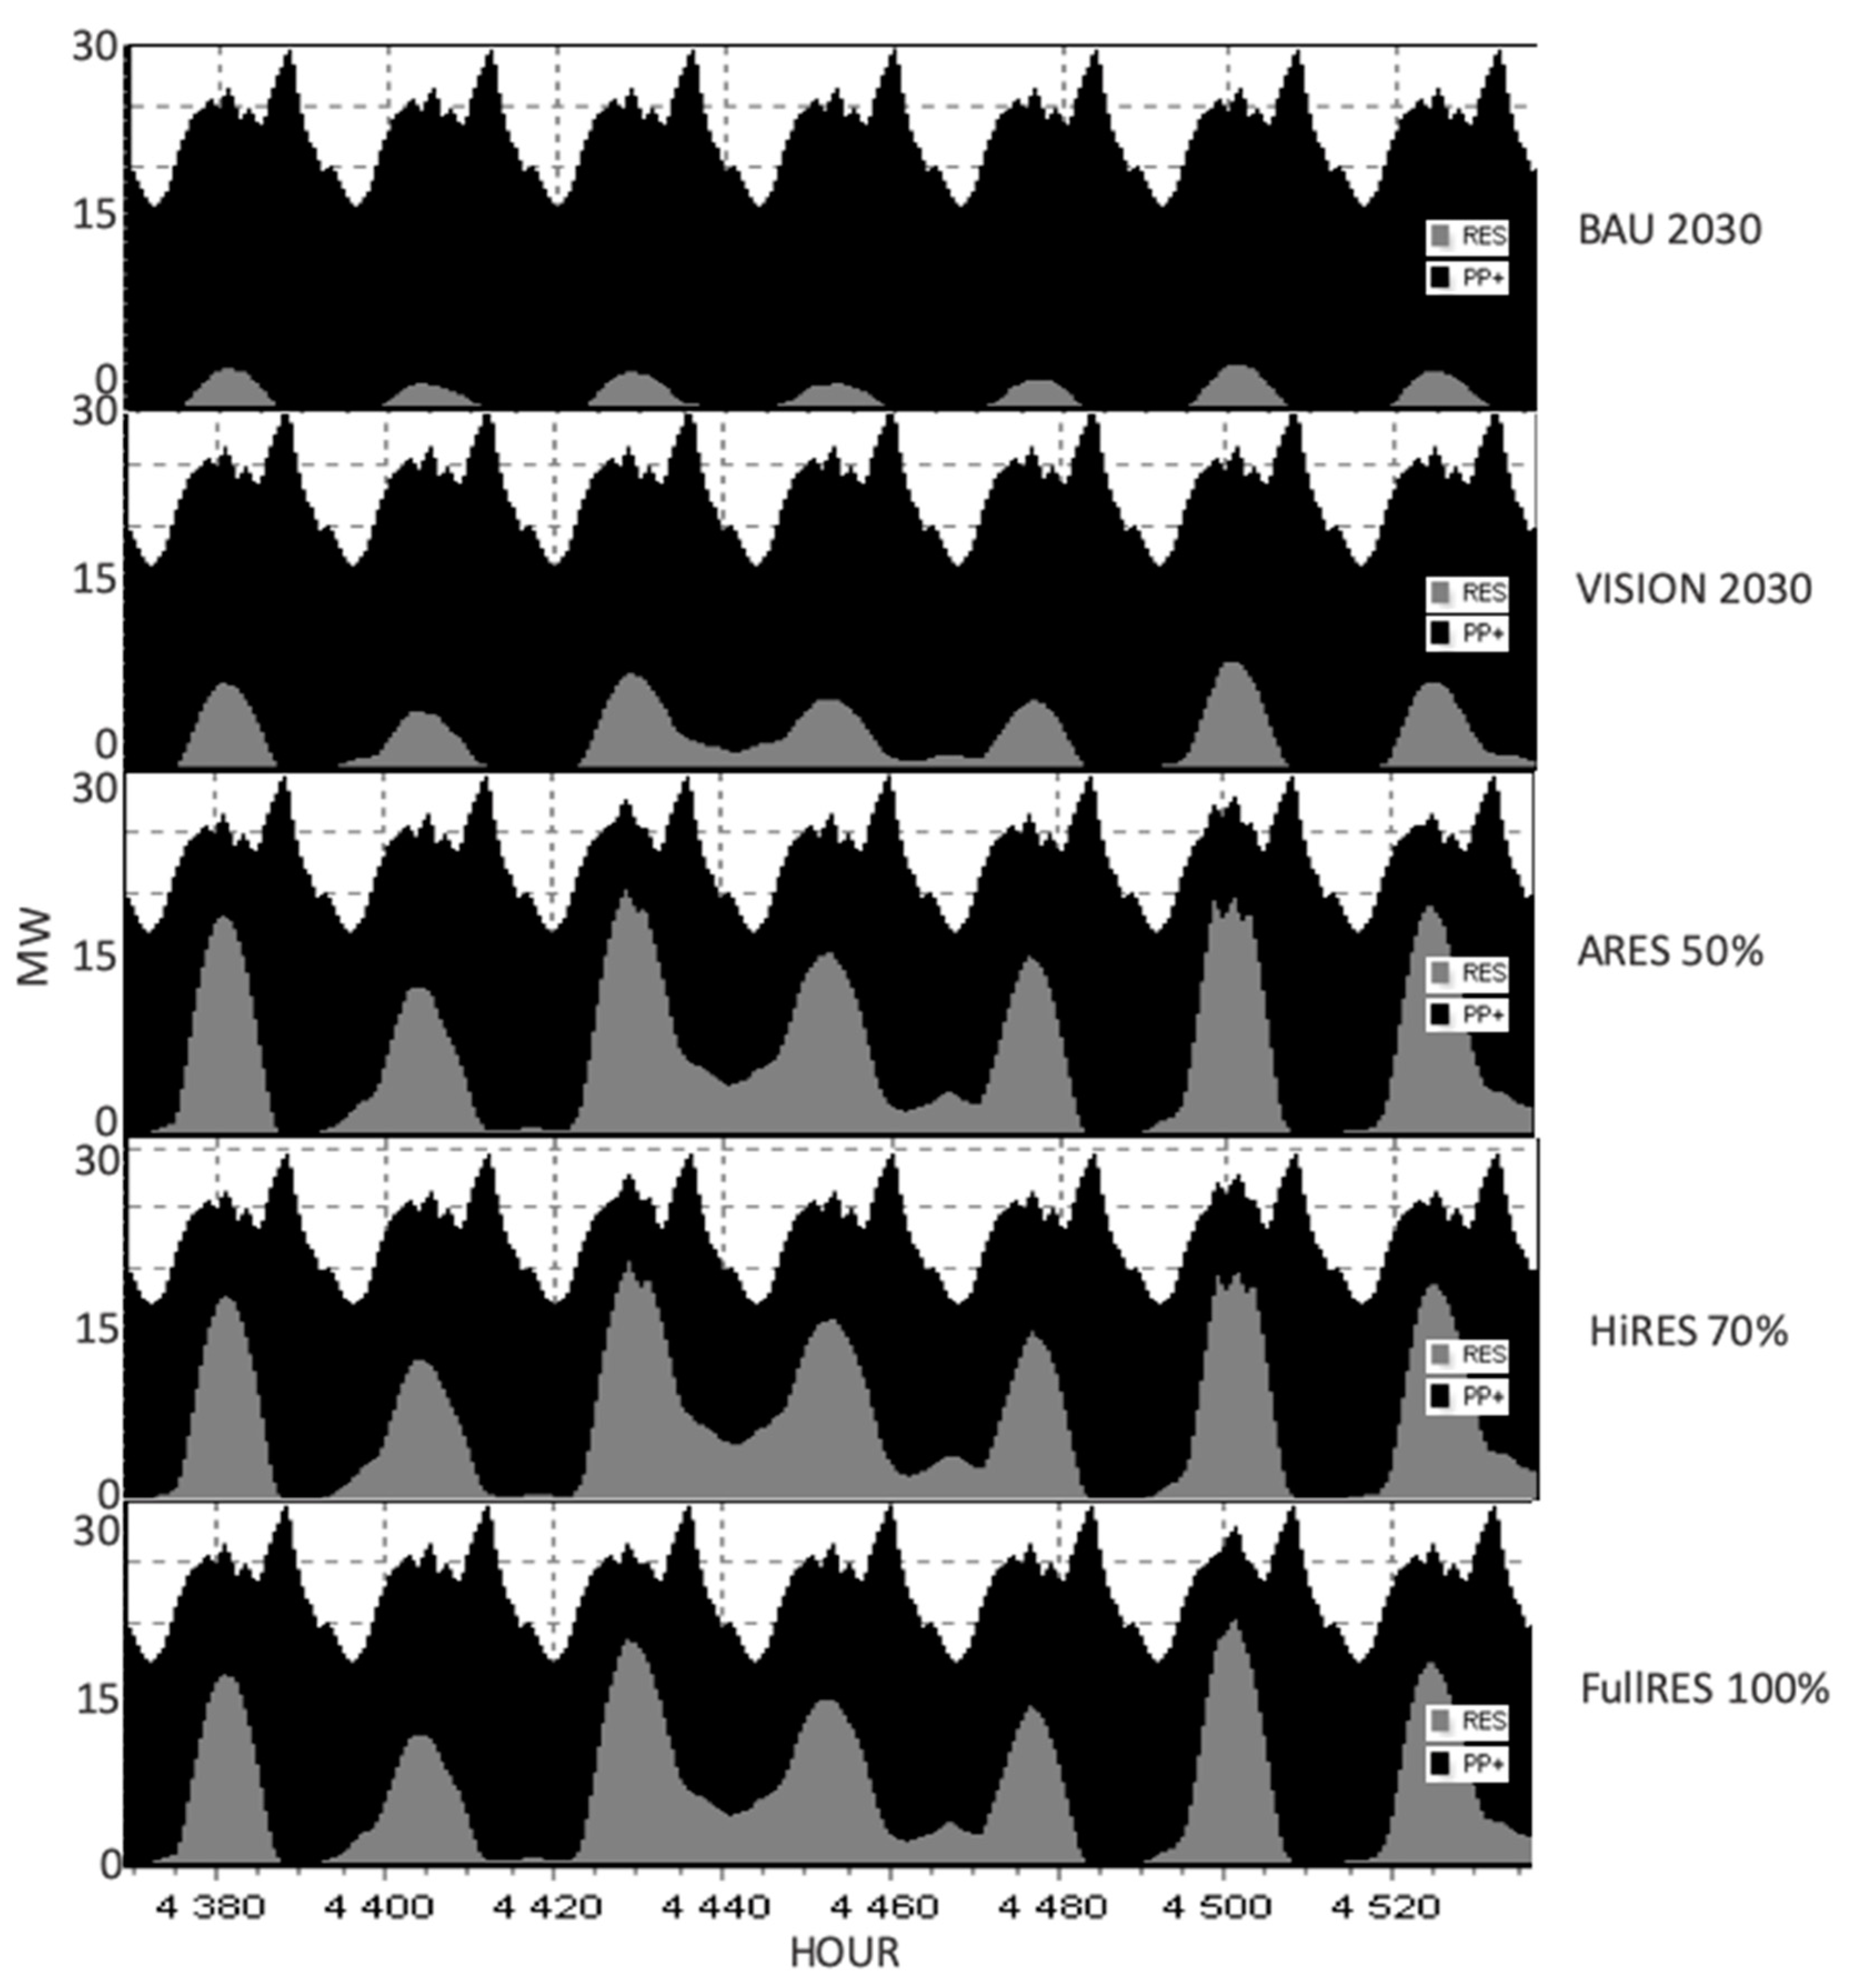
- BAU 2030 scenario assumes the electricity demand growth, but does not change the energy mix or the composition of the total installed capacities in conventional or the Renewable Energy Technologies (RETs);
- ARES achieves a 50% share of the electricity production by RES by 2030;
- HiRES reaches up to 70% of the electricity production from RES;
- FullRES is a 100% RES based system achieving the 100% share of electricity production.
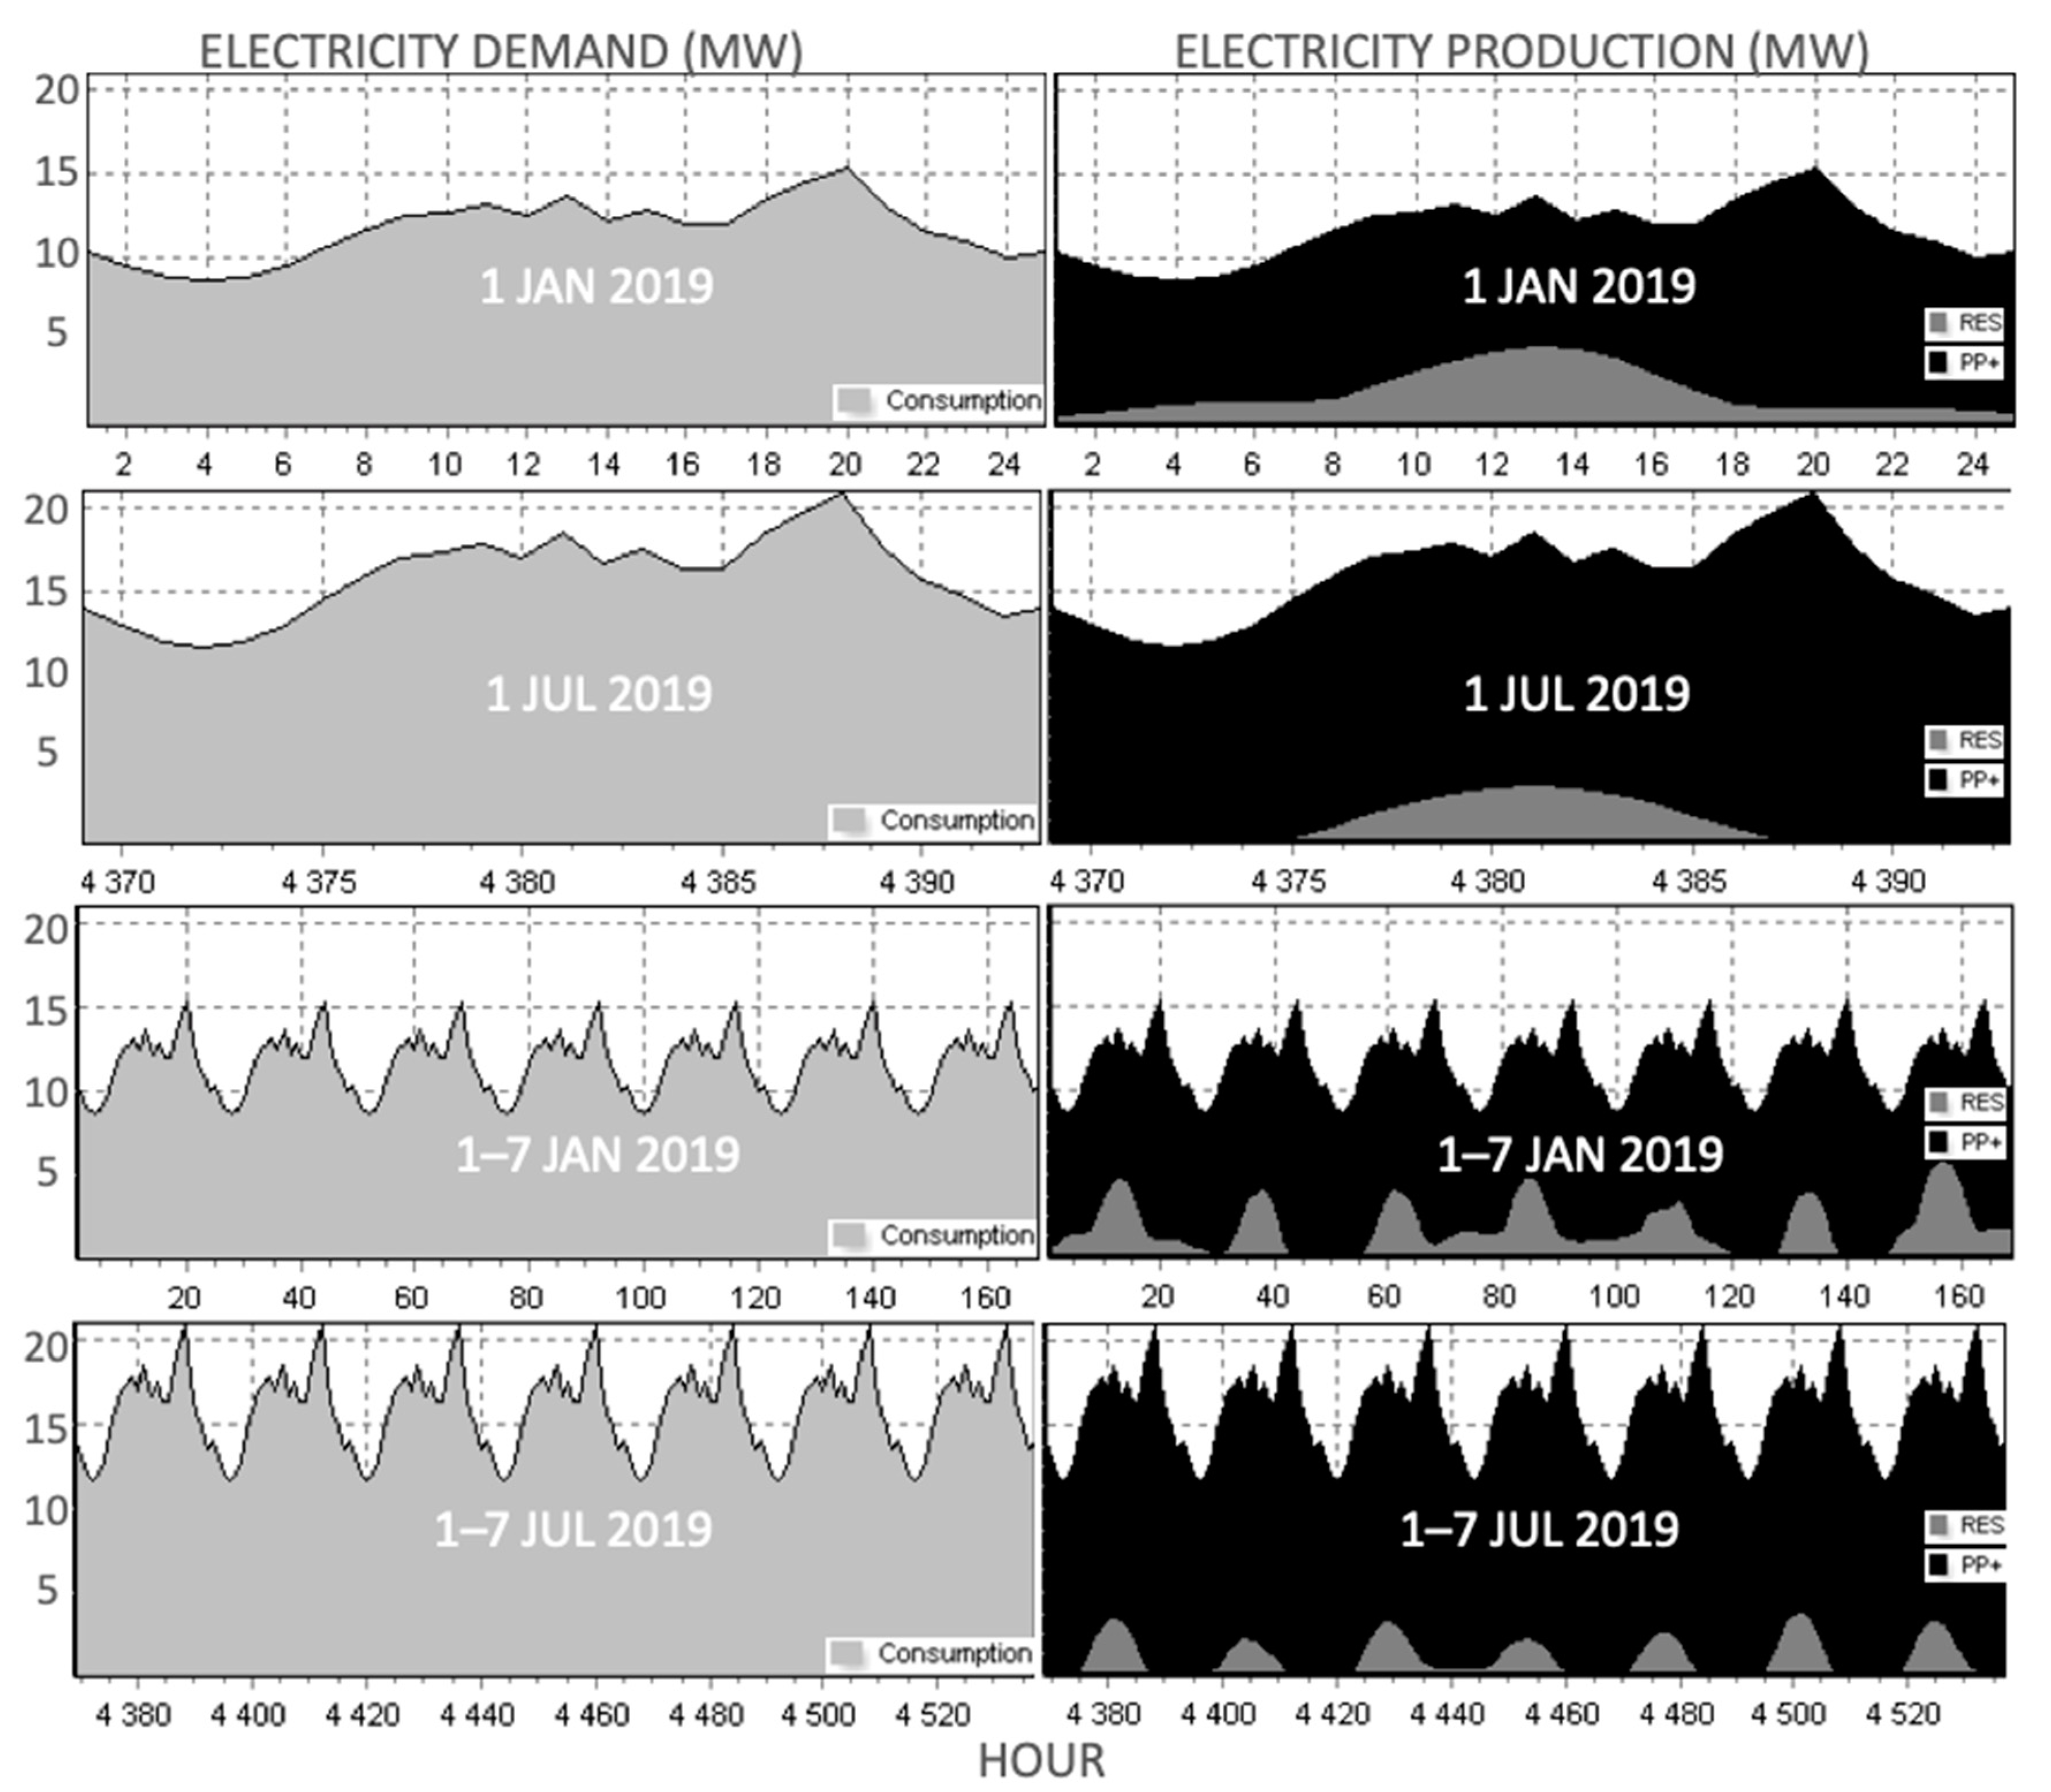
3.1. Current Situation (2019)
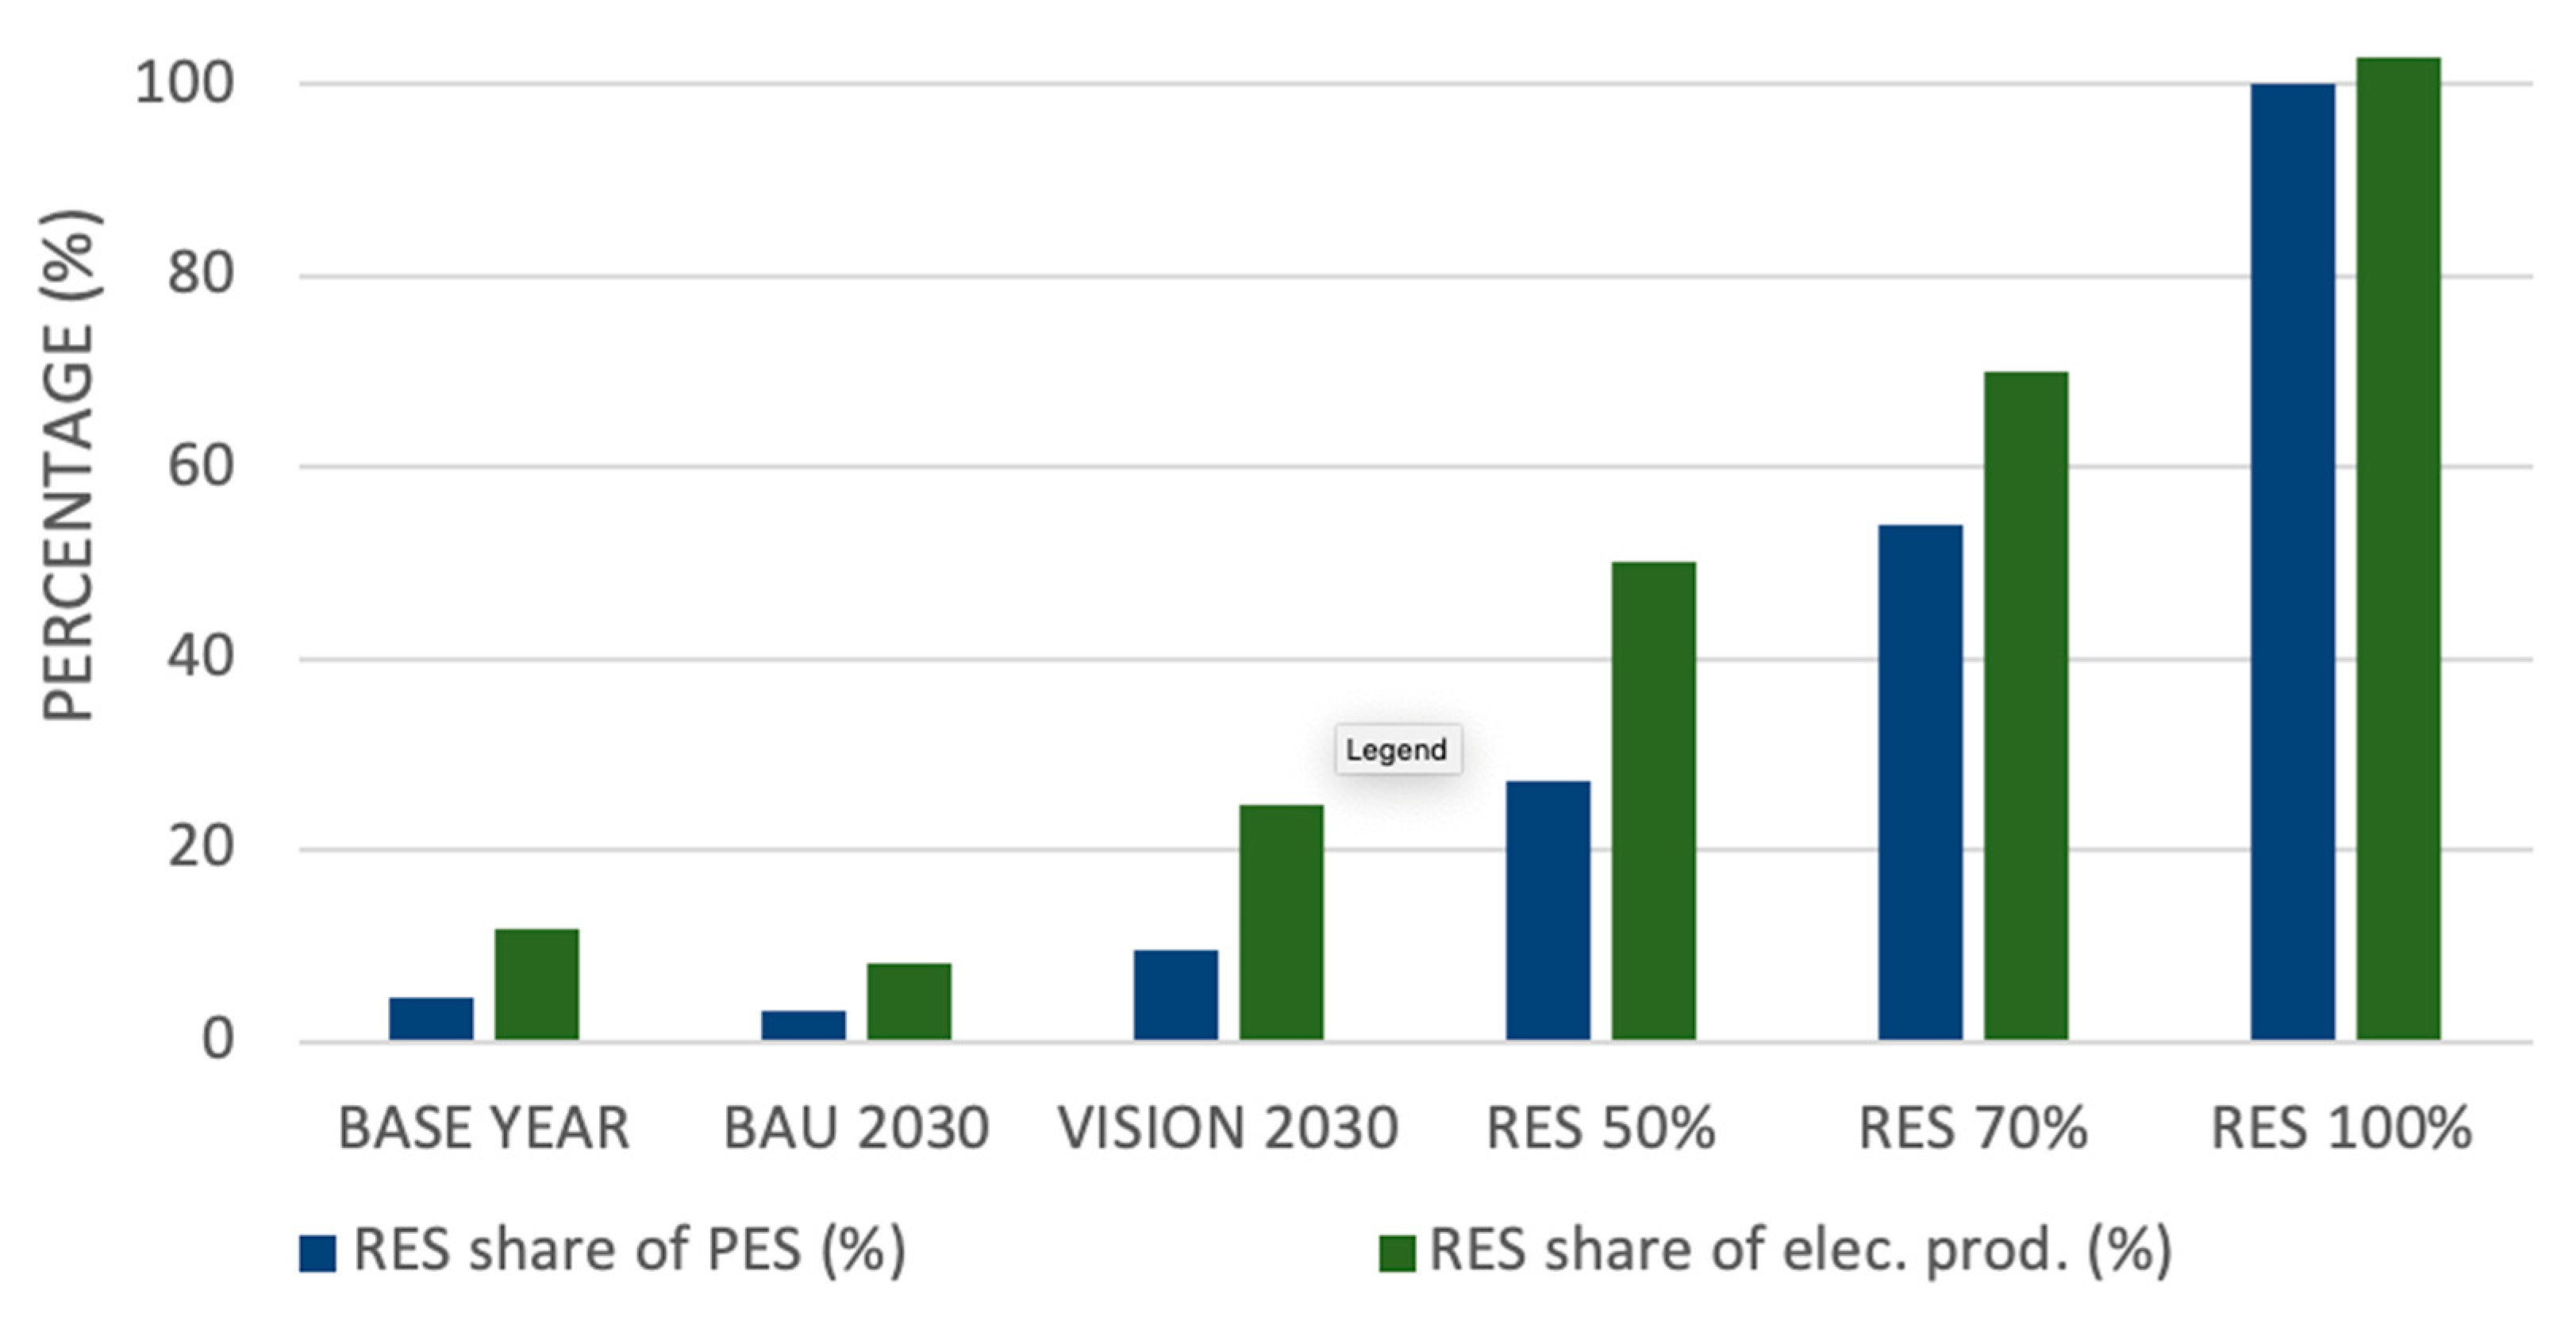
3.2. Scenarios
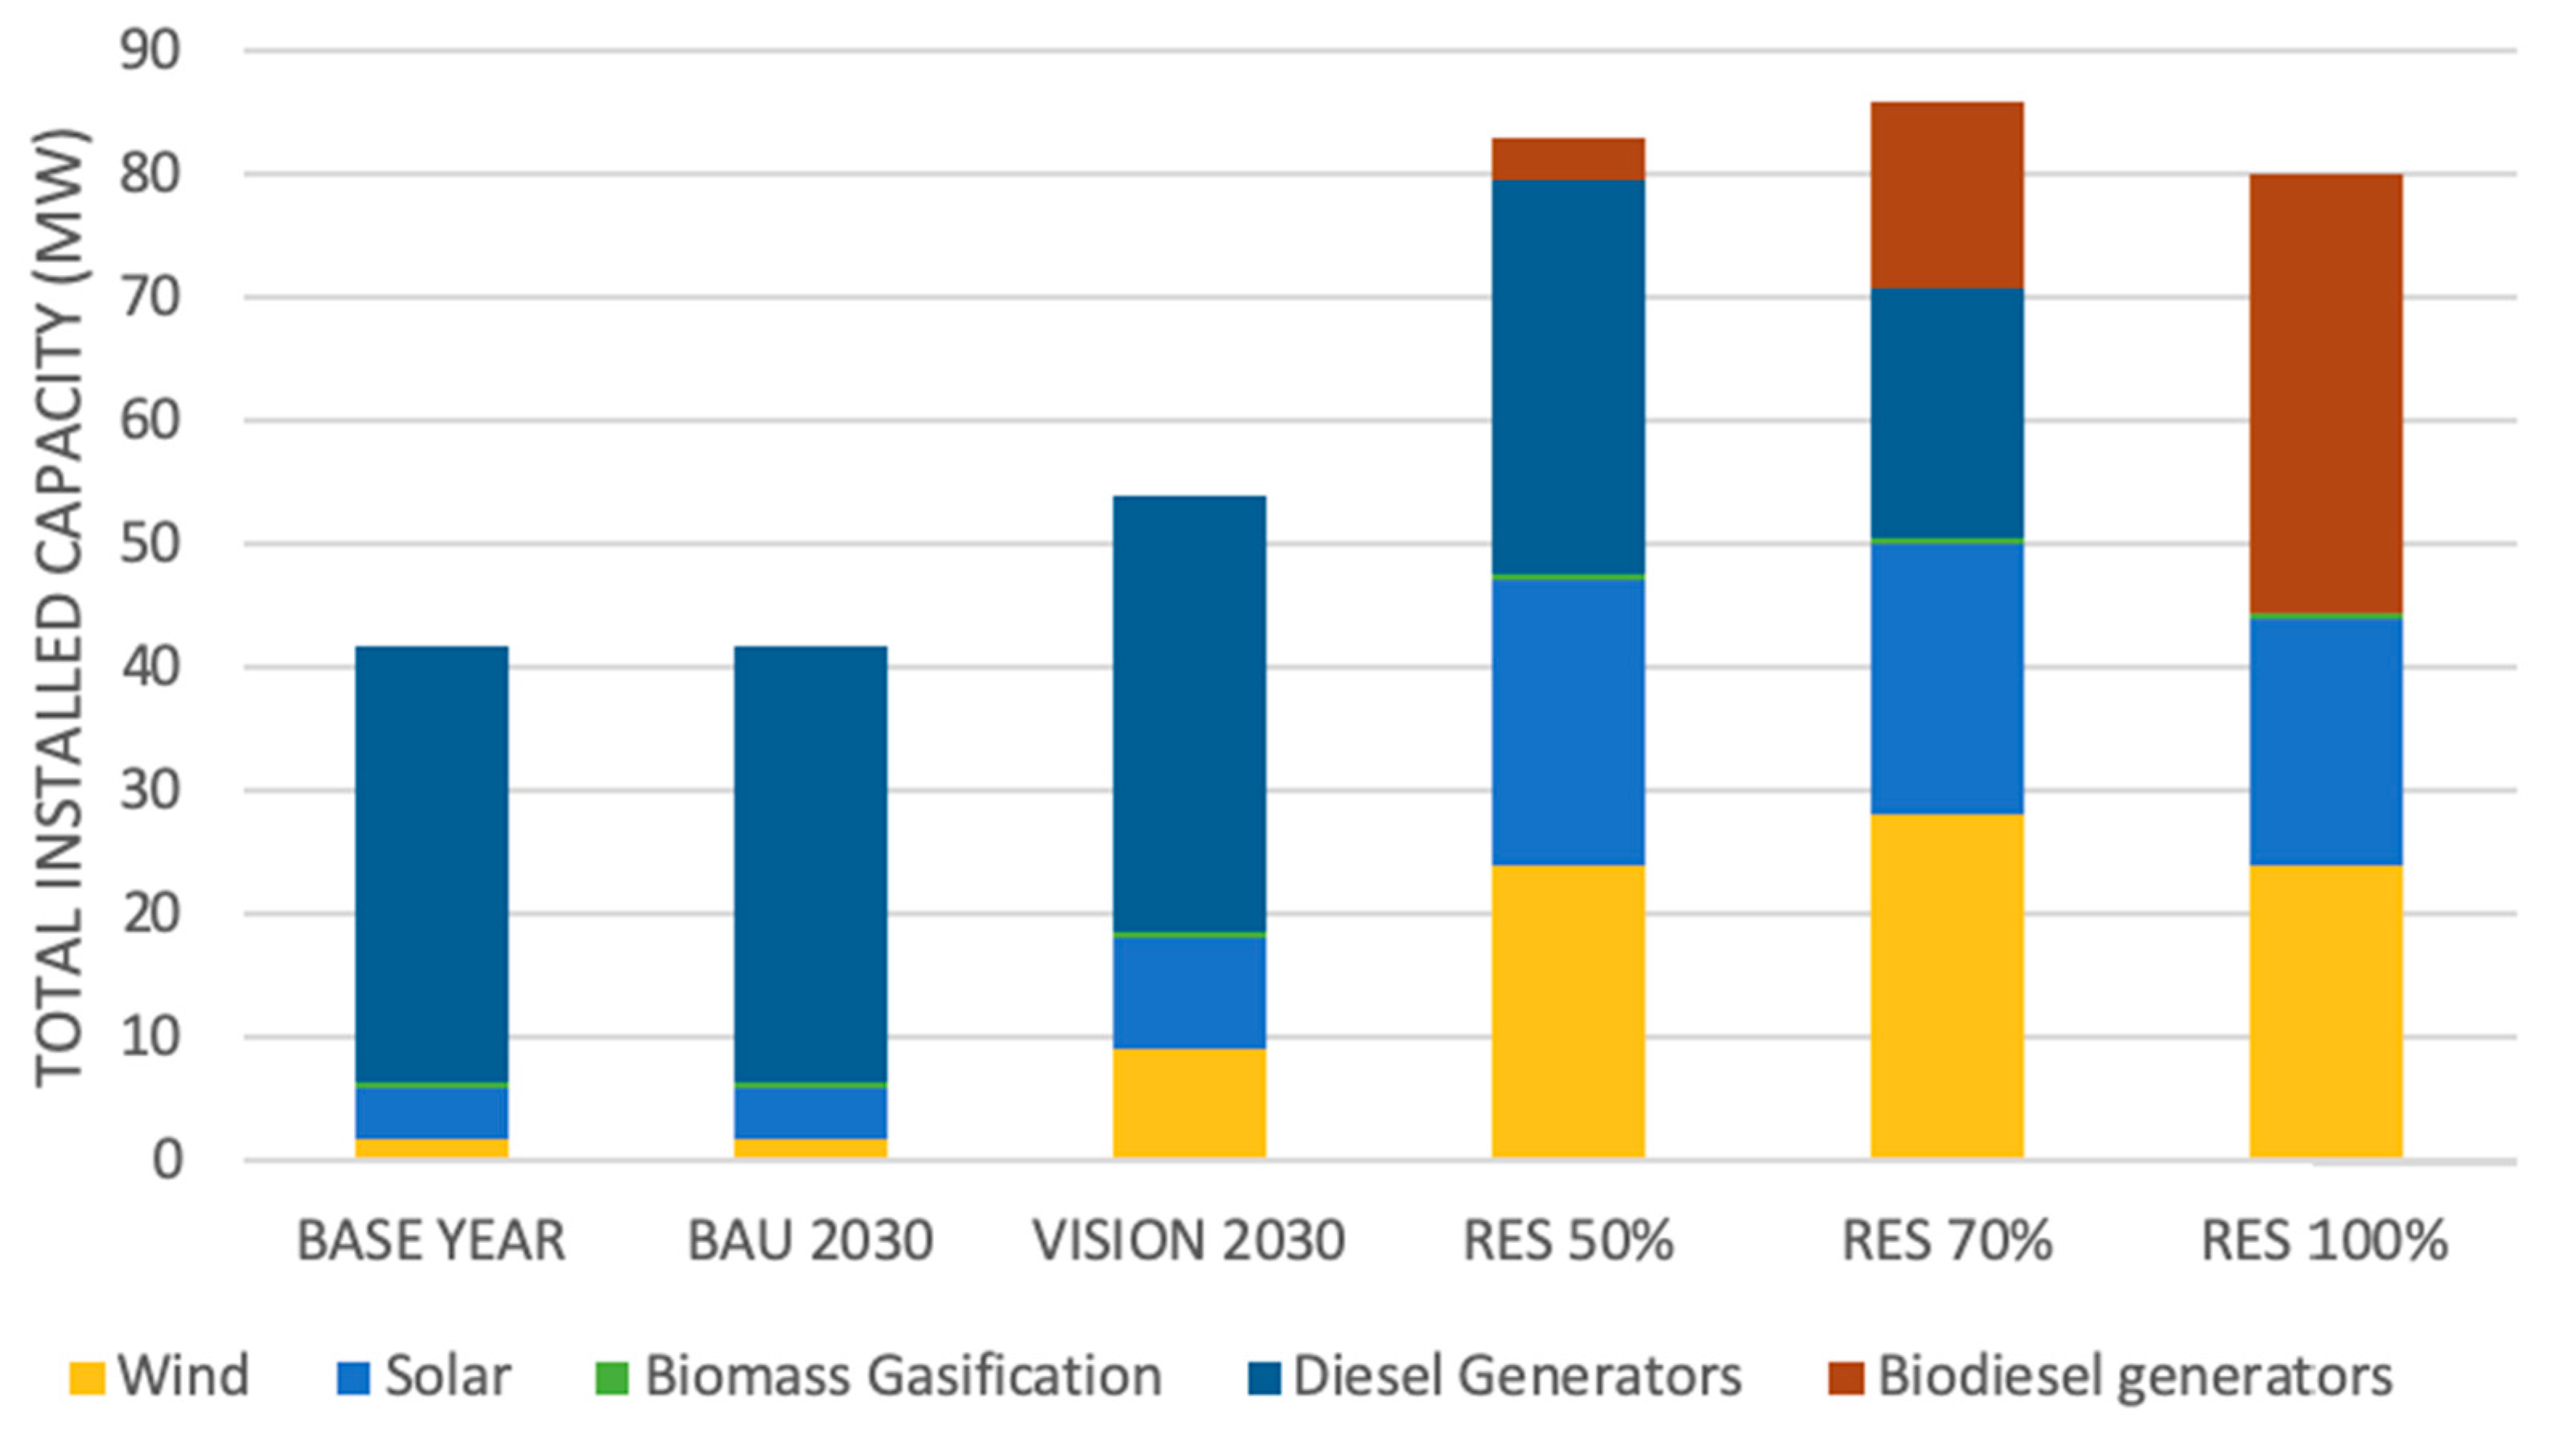
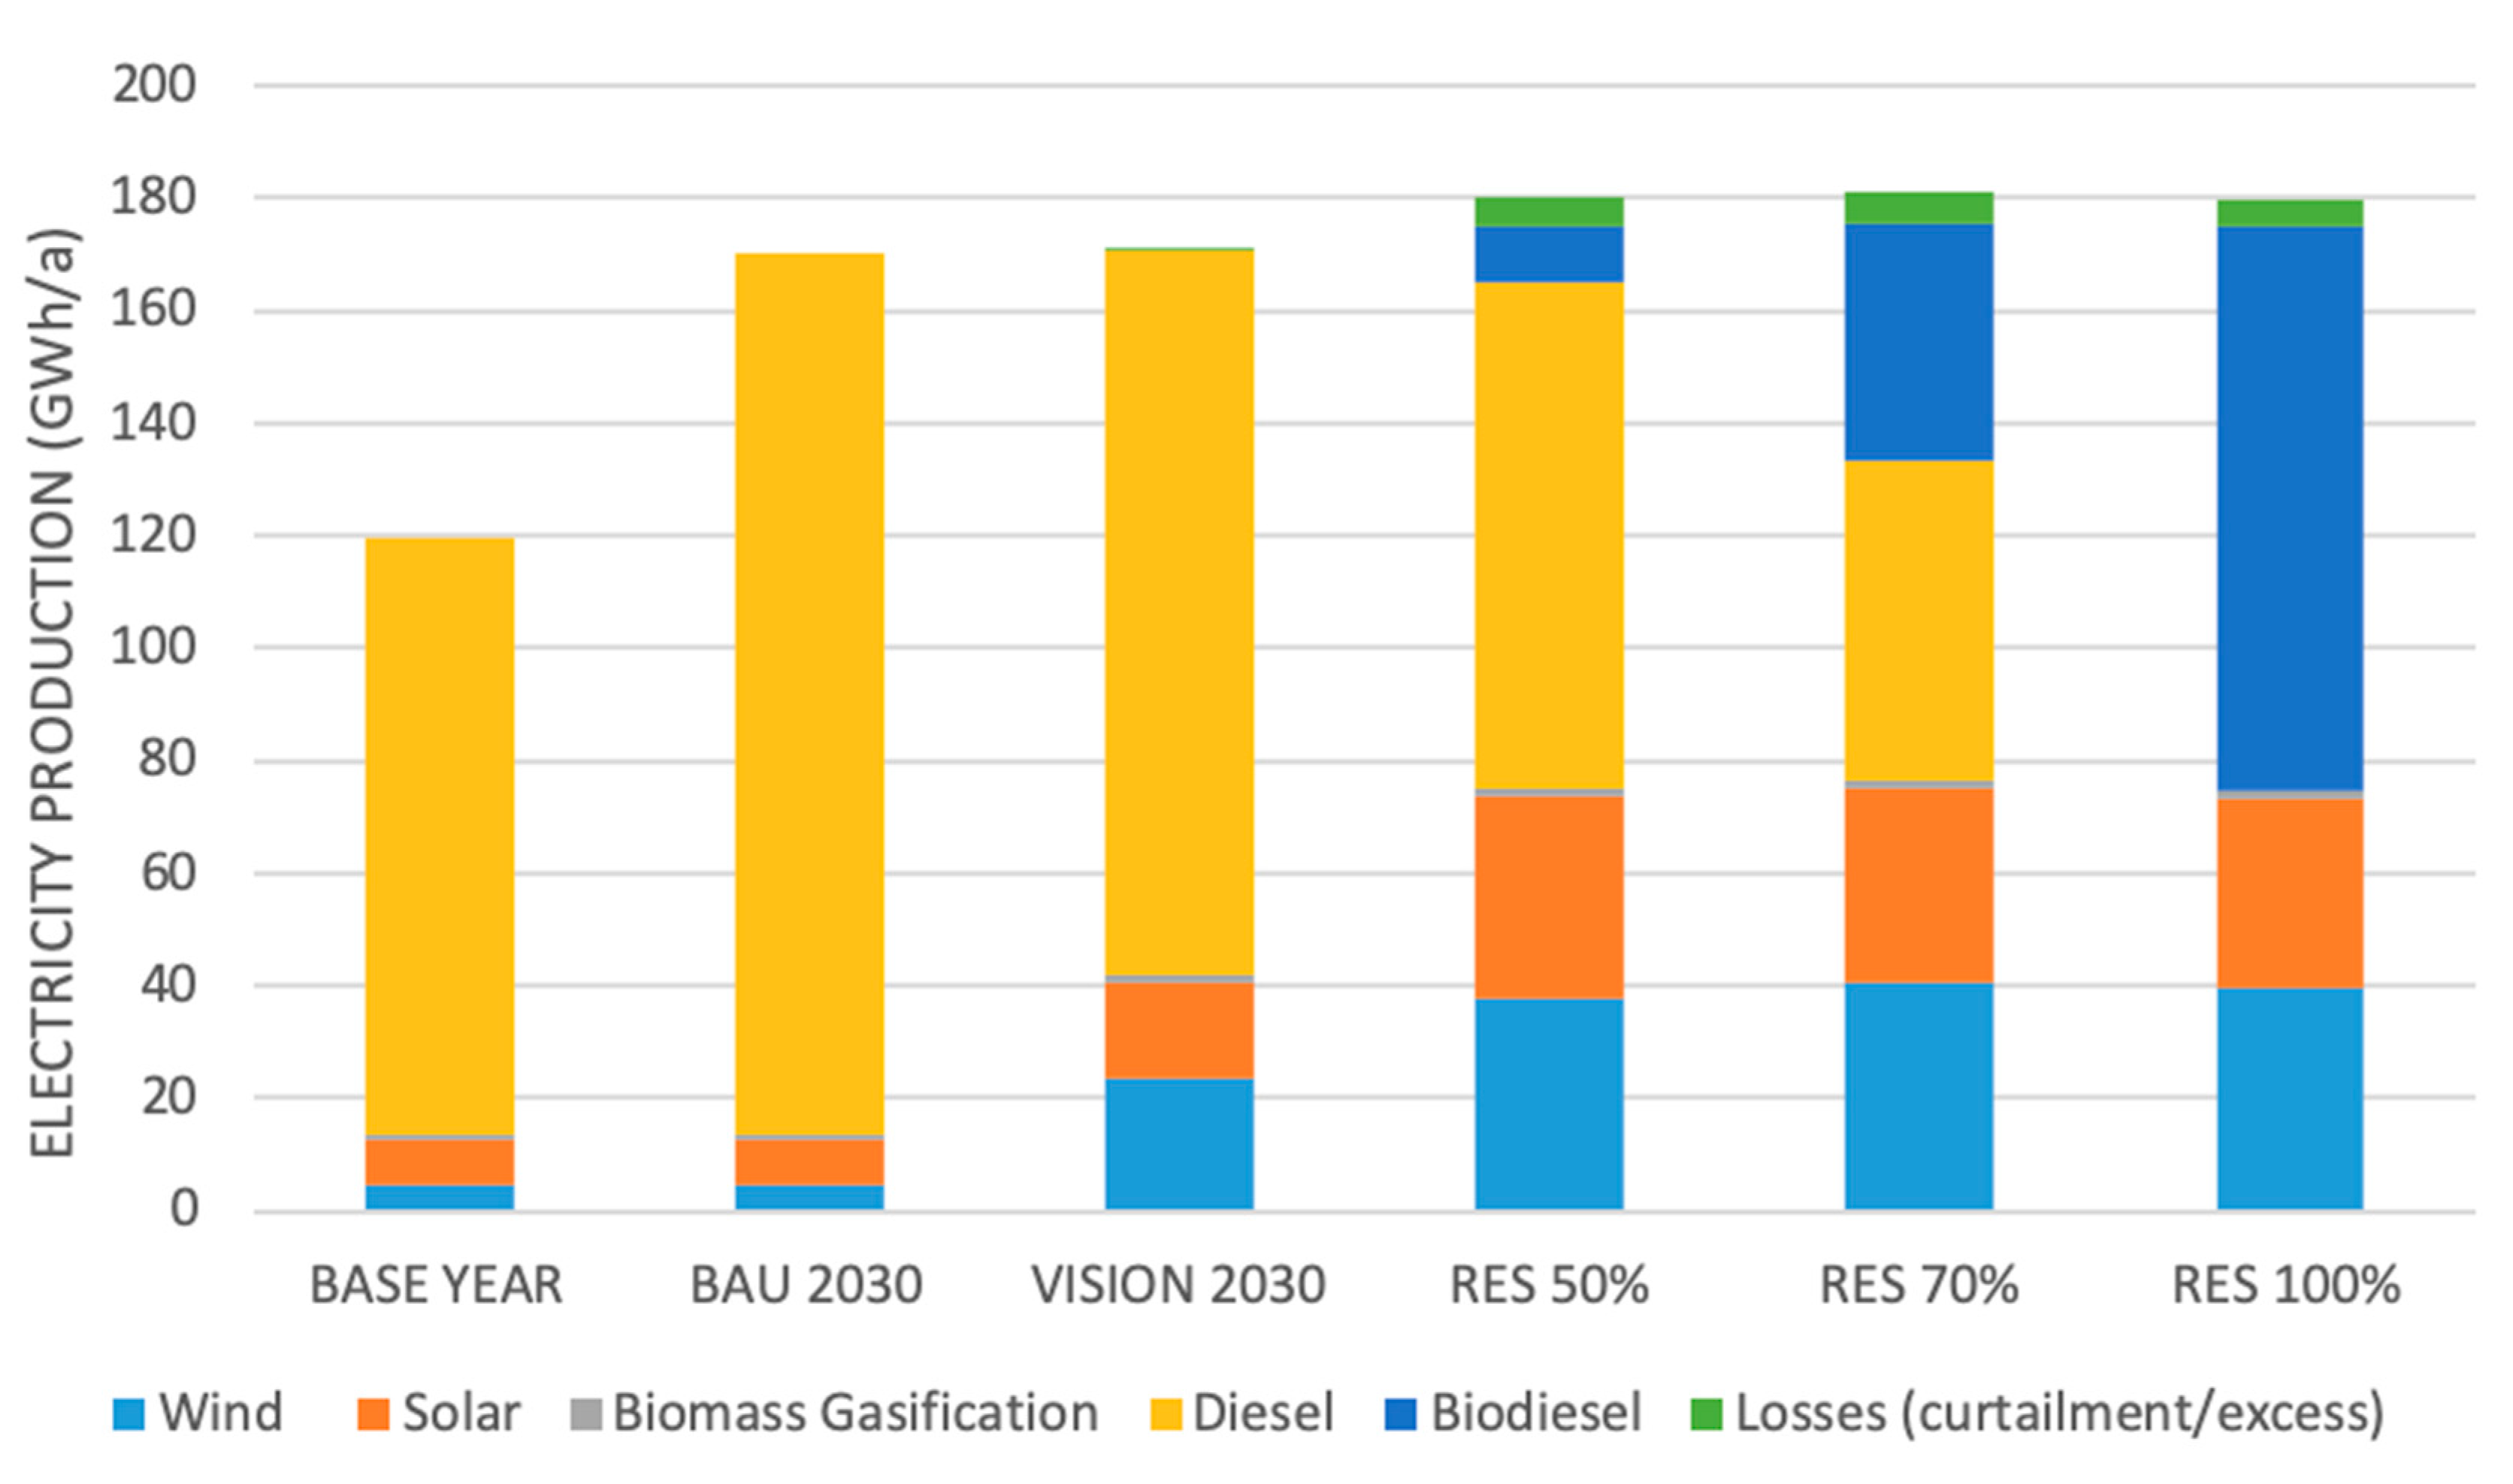
- BAU 2030 scenario is based on the current installed capacity, with no additional installed capacity. The installed capacities are: 35.44 MW of diesel and fuel oil generators, 4.2 MW of solar PV, 1.65 MW of wind, and 0.5 MW of biomass gasification.
- VISION 2030 scenario (RES 30%) is based on the Cuban government vision of reaching 24% share of RES in total annual electricity production and 30% share of RES in total installed capacity. In this scenario, both wind and solar PV generation capacities are increased up to 9 MW. The installed capacities for the simulation are: 35.44 MW of diesel and fuel oil generators, 9 MW of solar PV, 9 MW of wind, and 0.5 MW of biomass gasification.
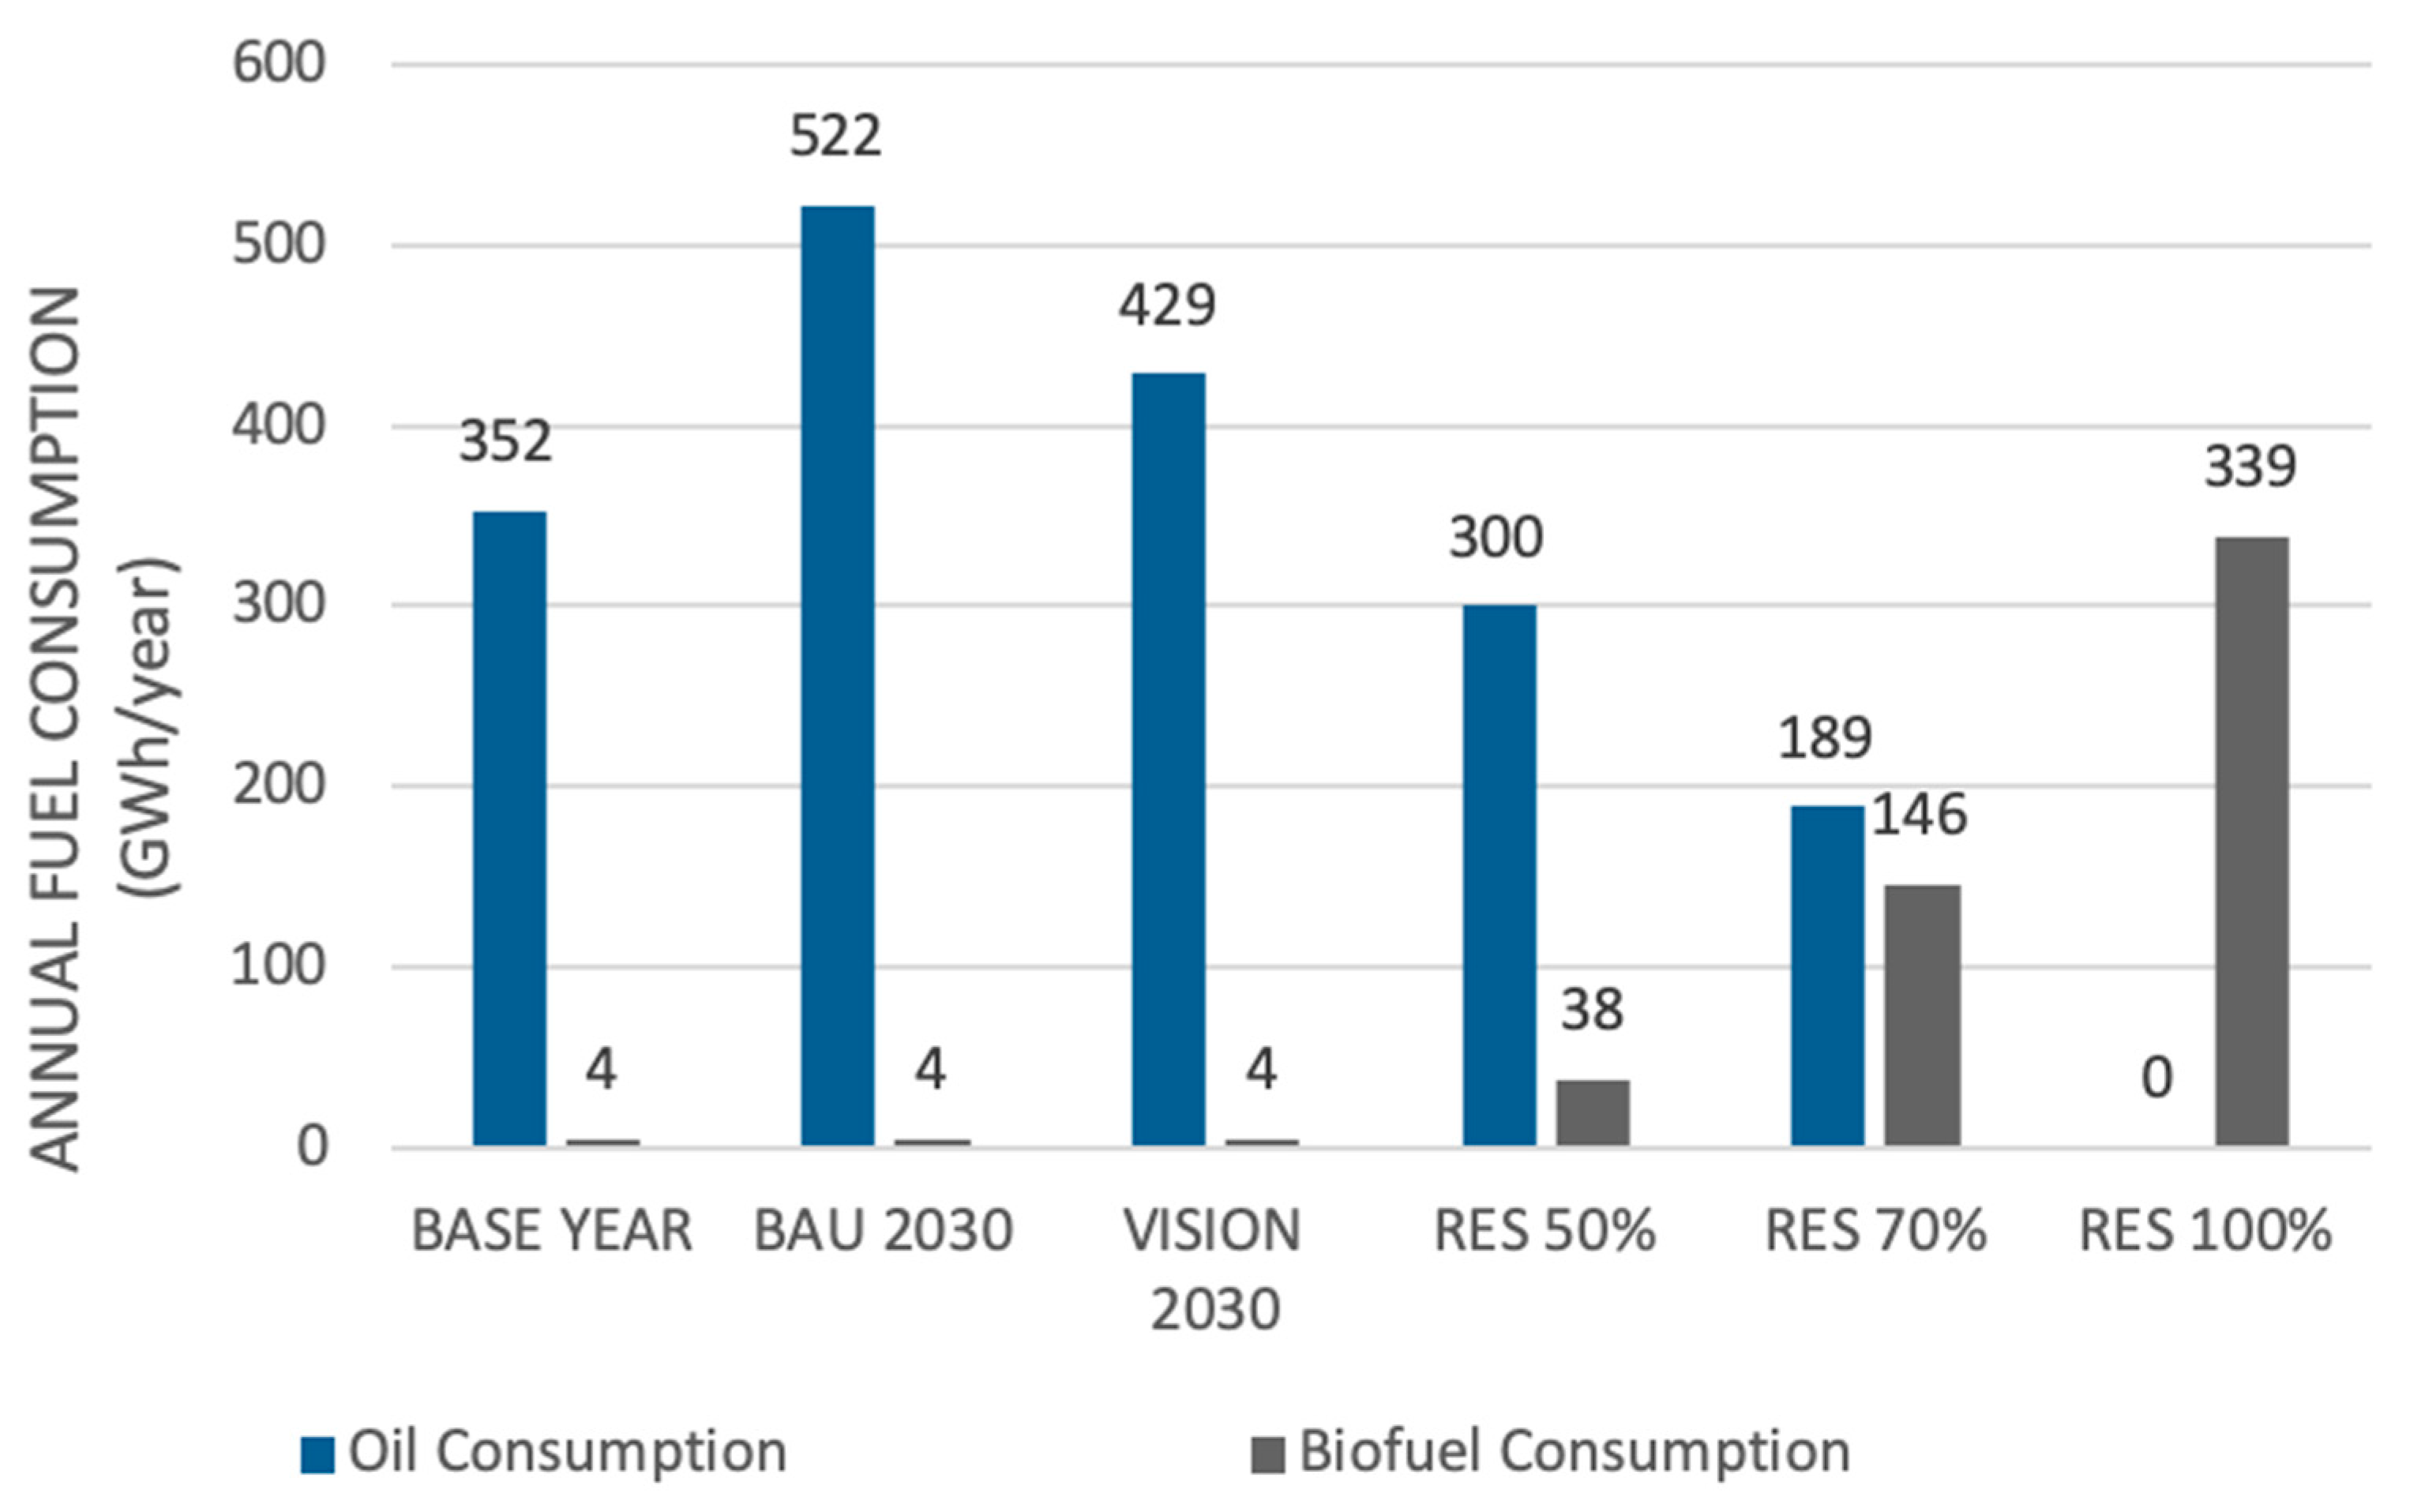
- ARES scenario (RES 50%) is based on advanced introduction of RES to the current electricity mix with a target of 50% share of RES in the total annual electricity production. In this scenario, the solar PV and wind generation capacities are increased up to 23 MW and 24 M, respectively. In addition, a fuel switch from diesel and fuel oil to biodiesel increases the capacity for biodiesel generation up to 3.5W. The installed capacities for the simulation are: 31.9 MW of diesel and fuel oil generators, 23 MW of solar PV, 24 MW of wind and 0.5 MW of biomass gasification and 3.5 MW of biodiesel generators.
- HiRES scenario (RES 70%) is based on high penetration of RES to the current electricity mix with a target of 70% share of RES in the total annual electricity production. In this scenario, the solar PV and wind generation capacities are increased up to 22 MW and 28 MW, respectively. In addition, a fuel switch from diesel and fuel oil to biodiesel increase the capacity biodiesel generation up to 15.2 MW. The installed capacities for the simulation are: 20.24 MW of diesel and fuel oil generators, 22 MW of solar PV, 28 MW of wind and 0.5 MW of biomass gasification and 15.2 MW of biodiesel generators.
- FullRES scenario (RES 100%) is based on complete transition towards RES in the current electricity mix with a target of 100% share of RES in the total annual electricity production. In this scenario, the solar PV and wind generation capacities are increased up to 20 MW and 24 MW, respectively. In addition, a fuel switch from diesel and fuel oil to biodiesel increases the capacity of biodiesel generation up to 35.44 MW. The installed capacities for the simulation are: 20 MW of solar PV, 24 MW of wind, and 0.5 MW of biomass gasification and 35.44 MW of biodiesel generators.
3.3. Summary of the Scenario Results
4. Discussion
5. Conclusions
Funding
Institutional Review Board Statement
Informed Consent Statement
Data Availability Statement
Conflicts of Interest
References
- International Energy Agency (IEA). Global CO2 Emissions in 2019. 2020. Available online: https://www.iea.org/reports/global-energy-co2-status-report-2019/emissions (accessed on 15 February 2021).
- Lund, H. Renewable Energy Systems: A Smart Energy Systems Approach to the Choice and Modeling of 100% Renewable Solutions; Academic Press: Cambridge, MA, USA, 2014; ISBN 978-0-12-410423-5. [Google Scholar]
- Østergaard, P.A. Reviewing optimisation criteria for energy systems analyses of renewable energy integration. Energy 2009, 34, 1236–1245. [Google Scholar] [CrossRef]
- Lund, H.; Østergaard, P.A.; Connolly, D.; Mathiesen, B.V. Smart energy and smart energy systems. Energy 2017, 137, 556–565. [Google Scholar] [CrossRef]
- Vazquez, L.; Hohmeyer, O.; Vilaragut, M.; Diaz, D.; Majanne, Y.; Castro, M.; Luukkanen, J. Energy System Planning towards Renewable Power System: Energy Matrix Change in Cuba by 2030. IFAC PapersOnLine 2018, 51, 522–527. [Google Scholar] [CrossRef]
- International Renewable Energy Agency (IRENA). Renewable Power Generation Costs in 2019; Abu Dhabi, United Arab Emirates, 2020; ISBN 978-92-9260-244-4. Available online: https://www.irena.org/-/media/Files/IRENA/Agency/Publication/2020/Jun/IRENA_Power_Generation_Costs_2019.pdf (accessed on 15 February 2021).
- International Renewable Energy Agency (IRENA). Planning for the Renewable Future: Long-Term Modelling and Tools to Expand Variable Renewable Power in Emerging Economies; International Renewable Energy Agency: Abu Dhabi, United Arab Emirates, 2017. Available online: https://www.irena.org/-/media/Files/IRENA/Agency/Publication/2017/IRENA_Planning_for_the_Renewable_Future_2017.pdf (accessed on 12 February 2021).
- Connolly, D.; Lund, H.; Mathiesen, B.V.; Leahy, M. A review of computer tools for analyzing the integration of renewable energy into various energy systems. Appl. Energy 2010, 87, 1059–1082. [Google Scholar] [CrossRef]
- Cabrera, P.; Lund, H.; Carta, J.A. Smart Renewable Energy Penetration Strategies on Islands: The Case of Gran Canaria. Energy 2018, 162, 421–443. Available online: https://econpapers.repec.org/article/eeeenergy/v_3a162_3ay_3a2018_3ai_3ac_3ap_3a421-443.htm (accessed on 3 March 2021). [CrossRef]
- Kuang, Y.; Zhang, Y.; Zhou, B.; Li, C.; Cao, Y.; Li, L.; Zeng, L. A review of renewable energy utilization in islands. Renew. Sustain. Energy Rev. 2016, 59, 504–513. [Google Scholar] [CrossRef]
- Thushara, D.S.M.; Hornberger, G.M.; Baroud, H. Decision analysis to support the choice of a future power generation pathway for Sri Lanka. Appl. Energy 2019, 240, 680–697. [Google Scholar] [CrossRef]
- Weir, T. Renewable energy in the Pacific Islands: Its role and status. Renew. Sustain. Energy Rev. 2018, 94, 762–771. [Google Scholar] [CrossRef]
- Makhijani, S.; Ochs, A.; Weber, M.; Konold, M.; Lucky, M.; Ahmed, A. Jamaica Sustainable Energy Roadmap: Pathways to an Affordable, Reliable, Low-Emission Electricity System; Worldwatch Institute: Washington, DC, USA, 2013; Available online: https://www.researchgate.net/publication/303811205_Jamaica_Sustainable_Energy_Roadmap_Pathways_to_an_Afordable_Reliable_Low-Emission_Electricity_System (accessed on 28 March 2021).
- Chen, A.A.; Stephens, A.J.; Koon Koon, R.; Ashtine, M.; Mohammed-Koon Koon, K. Pathways to Climate Change Mitigation and Stable Energy by 100% Renewable for a Small Island: Jamaica as an Example. Renew. Sustain. Energy Rev. 2020, 121. Available online: https://ideas.repec.org/a/eee/rensus/v121y2020ics1364032119308767.html (accessed on 16 March 2021). [CrossRef]
- Hohmeyer, O. A 100% Renewable Barbados and Lower Energy Bills—A Plan to Change Barbados’ Power Supply to 100% Renewables and Its Possible Benefits. 2015. CENTER FOR SUSTAINABLE ENERGY SYSTEMS (CSES/ZNES) System Integration Department. Europa Universität Flensburg. Available online: https://www.uni-flensburg.de/fileadmin/content/abteilungen/industrial/dokumente/downloads/veroeffentlichungen/diskussionsbeitraege/znes-discussionspapers-005-barbados.pdf (accessed on 13 February 2021).
- Salazar, I.; Luukkanen, J.; Seisdedos, L.V.; Korkeakoski, M.; Vázquez, A.S.; Majanne, Y.; Fuentefria, A.S. ELECTRICITY SUPPLY WITH RENEWABLE ENERGY SOURCES AND THE CUBAN ELECTRICITY SYSTEM: CHALLENGES OF SUPPLY-DEMAND BALANCE. 2018. Available online: https://www.researchgate.net/publication/329424950_ELECTRICITY_SUPPLY_WITH_RENEWABLE_ENERGY_SOURCES_AND_THE_CUBAN_ELECTRICITY_SYSTEM_CHALLENGES_OF_SUPPLY-DEMAND_BALANCE (accessed on 10 January 2021).
- Montes Calzadilla, R. Modelación de la Transición Energética en el Sistema Eléctrico Nacional Cubano Utilizando el Software IRENA FlexTool; Facultad de Ingeneria Eléctrica, Universidad Tecnológica de La Habana (CUJAE): Havana, Cuba, 2019. [Google Scholar]
- Mendoza-Vizcaino, J.; Sumper, A.; Sudria-Andreu, A.; Ramirez, J.M. Renewable technologies for generation systems in islands and their application to Cozumel Island, Mexico. Renew. Sustain. Energy Rev. 2016, 64, 348–361. [Google Scholar] [CrossRef]
- U.S. International Trade Commission. The Economic Impact of U.S. Sanctions with Respect to Cuba. USITC Publication 3398-Investigation No. 332-413 U.S International Trade Commission. 2001. Available online: http://ctrc.sice.oas.org/geograph/Impact_studies/Bilateral/US-Cuba.pdf (accessed on 30 March 2021).
- Reuters. U.S. Trade Embargo has Cost Cuba $130 Billion, U.N. Says. 2018. Available online: https://www.reuters.com/article/us-cuba-economy-un-idUSKBN1IA00T (accessed on 26 April 2021).
- Prensa Latina (Agencia Informativa Latinoamericana). US Blockade against Cuba Causes Huge Losses in Energy Sector. 2021. Available online: https://www.plenglish.com/index.php?o=rn&id=66046 (accessed on 25 April 2021).
- Marsh, S. Lack of Cash Clouds Cuba’s Green Energy Outlook. Reuters. 2017. Available online: https://www.reuters.com/article/us-cuba-energy-idUSKBN1720EB (accessed on 25 April 2021).
- Davis, C.; Piccione, T. Sustainable Development: The Path to Economic Growth in Cuba. Brookings. Research Initiative for the Sustainable Development of Cuba. 6 April 2017. Available online: https://www.brookings.edu/wp-content/uploads/2017/06/fp_20170627_sustainable_development_cuba.pdf (accessed on 25 April 2021).
- Guerra García, L. Presente y Futuro de la Generación Distribuida en Cuba. In Proceedings of the 18 Convención de Ingeniería y Arquitectura CUJAE, Havana, Cuba, November 2016. [Google Scholar]
- Ministerio de Justicia. Gaceta Oficial No. 95 Ordinaria de 28 de Noviembre de 2019. 2019; Política Para el Desarrollo Perspectivo de las Fuentes Renovables y el Uso Eficiente de la Energía 2014–2030. 21 June 2014. Available online: https://www.gacetaoficial.gob.cu/sites/default/files/goc-2019-o95.pdf (accessed on 30 March 2021).
- United Nations Framework Convention on Climate Change (UNFCCC). Contribución Nacionalmente Determinada Convención Marco de las Naciones Unidas Sobre el Cambio Climático. 2017. Available online: http://www4.unfccc.int/submissions/INDC/ (accessed on 20 February 2021).
- Panfil, M.D.-R. The Cuban Electric Grid: Lessons and Recommendations for Cuba’s Electric Sector. 2017. Environmental Defense Fund. Available online: https://www.edf.org/sites/default/files/cuban-electric-grid.pdf (accessed on 9 February 2021).
- Arrastía-Avila, M.; Glidden, L. Cuba’s Energy Revolution and 2030 Policy Goals: More Penetration of Renewable Energy in Electricity Generation. Int. J. Cuba. Stud. 2017, 9, 73–90. Available online: https://www.jstor.org/stable/10.13169/intejcubastud.9.1.0073 (accessed on 1 February 2021). [CrossRef]
- Periódico Granma. Lineamientos de la Política Económica y Social del Partido. 2011. Available online: http://www.cubadebate.cu/noticias/2011/05/09/descargue-en-cubadebate-los-lineamientos-de-la-politica-economica-y-social-pdf (accessed on 9 February 2021).
- Unión Eléctrica, UNE. DESARROLLO DEL SISTEMA ELÉCTRICO CUBANO. 2017. Available online: https://slideplayer.es/slide/11976486 (accessed on 9 February 2021).
- Periódico Granma. Actualización de los Lineamientos de la Política Económica y Social del Partido para el Período 2016–2021. 2017. Available online: http://www.granma.cu/file/pdf/gaceta/Lineamientos%202016-2021%20Versi%C3%B3n%20Final.pdf (accessed on 9 February 2021).
- Zhao, Y. Power Shift in Cuba: Seven Reasons to Watch the Renewable Energy Sector in the Post-Fidel and Trump Era. 2017. Renewable Energy World. Available online: https://www.renewableenergyworld.com/2017/02/10/power-shift-in-cuba-seven-reasons-to-watch-the-renewable-energy-sector-in-the-post-fidel-y-era-triunfo (accessed on 9 February 2021).
- Fuentefría Santos, A. Análisis del Límite Penetración Eólica por Capacidad Instalada en el Sistema Eléctrico de la Isla de la Juventud. 2012. La Habana: II Congreso Cubano de Ingeniería Eléctrica.United Nations 2021. Department of Economic and Social Affairs (DESA). Available online: https://unstats.un.org/sdgs/report/2019/Goal-07/ (accessed on 15 February 2021).
- Fuentefría Santos, A.; Castro Fernández, M. Influencia del Parque Eólico de Los Canarreos en el sistema eléctrico de la Isla de la Juventud. La Habana: 17 Convención Científica de Ingeniería y Arquitectura. Available online: www.researchgate.net/publication/307631026_INFLUENCIA_DEL_PARQUE_EOLICO_DE_LOS_CANARREOS_EN_EL_SISTEMA_ELECTRICO_DE_LA_ISLA_DE_LA_JUVENTUD (accessed on 9 February 2021).
- AlbertoAlvarez, E.; Korkeakoski, M.; Santos Fuentefría, A.; Lourdes Filgueiras Sainz de Rozas, M.; Arcila Padura, R.; Luukkanen, J. Long-range Integrated Development Analysis: The Cuban Study Case Isla de la Juventud. 2021. Modeling, Simulation and Control of Wind Diesel Power Systems. Wind Wave Tidal Energy 2021, in press. [Google Scholar]
- Soto Calvo, M.A. Diseño de una Microrred Eléctrica con Fuentes Renovables de Energía en la Comunidad Cocodrilo en la Isla de la Juventud. Master’s Thesis, Centro de Investigaciones y Pruebas Electroenergéticas (CIPEL), Facultad de Ingeneria Eléctrica, Universidad Tecnológica de La Habana (CUJAE), Havana, Cuba, March 2021. [Google Scholar]
- Reuters. Cuba’s Imports from China Slump 40% in 2020, Extending Long Decline. 2020. Available online: https://www.reuters.com/article/cuba-china-trade-idUSL1N2K919P (accessed on 15 January 2021).
- Lund, H.; Andersen, A.N.; Østergaard, P.A.; Mathiesen, B.W.; Connolly, D. From electricity smart grids to smart energy systems—A market operation based approach and understanding. Energy 2012, 42, 96–102. [Google Scholar] [CrossRef]
- Lund, H.; Zinck Thellufsen, J.; Østergaard, P.A.; Sorknæs, P.; Skov, I.R.; Mathiesen, B.V. EnergyPLAN—Advanced analysis of smart energy systems. Smart Energy 2021, 1, 100007. [Google Scholar] [CrossRef]
- Østergaard, P.A. Reviewing EnergyPLAN simulations and performance indicator applications in EnergyPLAN simulations. Appl. Energy 2015, 154, 921–933. [Google Scholar] [CrossRef]
- International Energy Agency (IEA). World Energy Outlook, WEO. November 2019. Available online: https://www.iea.org/reports/world-energy-outlook-2019 (accessed on 15 January 2021).
- Oficina Nacional de Estadística e Información (ONEI). Anuario Estadístico de la Isla de la Juventud 2018. 2019. Available online: http://www.onei.gob.cu/node/14626 (accessed on 15 January 2021).
- Molina Alfonso, F.M.; Santana Mena, P.A. Isla de la Juventud, su Sistema Electrico y la Asimilacion de la Generacion Con Fuentes de Energia Renovables. 2018. 19 Edición de la Convenión de Ciencia Ingeniería y Arquitectura. In Proceedings of the Conferencia Internacional de Tecnologías Aplicadas a Redes Eléctricas Inteligentes (CITREI), Havana, Cuba, 26–28 November 2018. [Google Scholar]
- Renewables.ninja. The Modern-Era Retrospective Analysis Version 2(MERRA-2). Solar PV (Point API)-21.691. 2021. -82.816-Version: 1.1 (Using GSEE v0.3.1)-License: https://creativecommons.org/licenses/by-nc/4.0/. Available online: https://www.renewables.ninja060 (accessed on 20 March 2021).
- Renewables.ninja. The Modern-Era Retrospective Analysis Version 2(MERRA-2). Wind (Point API)-21.691, -82.816-Version: 1.1-License: https://creativecommons.org/licenses/by-nc/4.0/. Available online: https://www.renewables.ninja (accessed on 20 March 2021).
- Comité Central del Partido Comunista de Cuba. Conceptualización del Modelo Económico y Social Cubano de Desarrollo Socialista. Plan Nacional de Desarrollo Económico y Social Hasta 2030: Propuesta de Visión de la Nación, Ejes y Social Hasta 2030: Propuesta de Visión de la Nación, Ejes y Sectores Estratégicos. Cuba: Granma. 2017. Available online: http://www.granma.cu/file/pdf/gaceta/%C3%BAltimo%20PDF%2032.pdf (accessed on 15 January 2021).
- Moore, W.; Korkeakoski, M.; Luukkanen, J.; Alleyne, L.; Brown, N.; Chambers, T.; Evans, A. Identifying Inconsistencies in Long-Run Development Plans: The Case of Barbados’ Vision for Energy Development. SSRN Electron. J. 2015. [Google Scholar] [CrossRef]
- Nugent, C. How Doctors Became Cuba’s Biggest Export. Time Magazine. 30 November 2018. Available online: https://time.com/5467742/cuba-doctors-export-brazil/ (accessed on 20 April 2021).
- North Africa Post. Algeria Trades Oil for Cuban Doctors. 2018. Available online: https://northafricapost.com/22028-algeria-trades-oil-cuban-doctors.html (accessed on 20 April 2021).
- Kirk, J. Cuban Medical Cooperation within Alba: The Case of Venezuela. Int. J. Cuba. Stud. 2011, 3, 221–234. Available online: http://www.jstor.org/stable/41945946 (accessed on 20 April 2021).
- Bravo Hidalgo, D. Energía y Desarrollo Sostenible en Cuba. Centro Azúcar 2015, 42, 14–25. Available online: http://scielo.sld.cu/scielo.php?script=sci_arttext&pid=S2223-48612015000400002 (accessed on 30 March 2021).
- Jacobson, M.Z. Effects of biomass burning on climate, accounting for heat and moisture fluxes, black and brown carbon, and cloud absorption effects. J. Geophys. Res. Atmos. 2014, 119, 8980–9002. [Google Scholar] [CrossRef]
- Giuntoli, J.; Agostini, A.; Caserini, S.; Lugato, E.; Baxter, D.; Marelli, L. Climate change impacts of power generation from residual biomass. Biomass Bioenergy 2016, 89, 146–158. [Google Scholar] [CrossRef]
- Berndes, G.; Cowie, A.; Pelkmans, L. The Use of Forest Biomass for Climate Change Mitigation: Dispelling some Misconceptions. International Energy Agency (IEA) Biomass Taskforce. 2020. Available online: https://www.researchgate.net/publication/344075912_The_use_of_forest_biomass_for_climate_change_mitigation_dispelling_some_misconceptions/link/5f512575458515e96d2ae197/download (accessed on 8 May 2021).
- Sterman, J.D.; Siegel, L.; Rooney-Varga, J.N. Does Replacing Coal with Wood Lower CO2 Emissions? Dynamic lifecycle analysis of wood bioenergy. Environ. Res. Lett. 2018, 13. Available online: https://iopscience.iop.org/article/10.1088/1748-9326/aaa512/pdf (accessed on 8 May 2021).
- Searchinger, T.D.; Beringer, T.; Holtsmark, B.; Kammen, D.M.; Lambin, E.F.; Lucht, W.; Raven, P.; Ypersele, J.-P.V. Europe’s renewable energy directive poised to harm global forests. Nat. Commun. 2018, 9, 3741. [Google Scholar] [CrossRef] [PubMed]
- John, L.; Field, J.L.; Richard, T.M.; Smithwick, E.A.H.; Cai, H.; Laser, M.S.; LeBauer, D.S.; Long, S.P.; Paustian, K.; Qin, Z.; et al. Robust paths to net greenhouse gas mitigation and negative emissions via advanced biofuels. Proc. Natl. Acad. Sci. USA 2020, 117, 21968–21977. [Google Scholar] [CrossRef]
- Sagastume Gutiérrez, A.; Cabello Eras, J.J.; Huisingh, D.; Vandecasteele, C.; Hens, L. The current potential of low-carbon economy and biomass-based electricity in Cuba. The case of sugarcane, energy cane and marabu (Dichrostachys cinerea) as biomass sources. J. Clean. Prod. 2018, 172, 2108–2122. [Google Scholar] [CrossRef]
- International Institute for Sustainable Development (IISD). SDG Knowledge Hub. Cuba’s 2020 NDC Update Prioritizes Energy, Agriculture, Forestry, and Other Land Use Sectors. September 2020. Available online: https://sdg.iisd.org/news/cubas-2020-ndc-update-prioritizes-energy-agriculture-forestry-and-other-land-use-sectors/ (accessed on 30 March 2021).
- World Resources Institute (WRI). 4 Charts Explain Greenhouse Gas Emissions by Countries and Sectors. Global Historical Emissions-Cuba. Available online: https://www.wri.org/insights/4-charts-explain-greenhouse-gas-emissions-countries-and-sectors (accessed on 20 April 2021).
- Reuters. EU Stresses Support for Cuba even as U.S. Hikes Sanctions. 2019. Available online: https://www.reuters.com/article/us-cuba-eu-idUSKCN1VU2BY (accessed on 12 January 2021).
- Deutsche Welt. EU Eyes a Fresh Start in Cuba Relations. 2018. Available online: https://www.dw.com/en/eu-eyes-a-fresh-start-in-cuba-relations/a-42019812 (accessed on 23 February 2021).


| Scenarios | BAU 2030 | VISION 2030 | ARES | HiRES | FullRES | |
|---|---|---|---|---|---|---|
| RES share (%) of Electricity Production | 8% | 25% | 50% | 70% | 100% | |
| Installed capacity (RES) | Solar | 4.2 MW | 9 MW | 23 MW | 22 MW | 20 MW |
| Wind | 1.65 MW | 9 MW | 24 MW | 28 MW | 24 MW | |
| Biomass | 0.5 MW | 0.5 MW | 0.5 MW | 0.5 MW | 0.5 MW | |
| Biofuel | - | - | 3.5 MW | 152 MW | 35.44 MW | |
| Installed capacity (conventional) | Diesel/ Fuel Oil | 35.44MW | 35.44 MW | 31.9 MW | 20.24 MW | - |
| Additional installed capacity | - | 12.15 MW | 41.1 MW | 44.15 MW | 38.15 MW | |
| Share of increase in installed capacity | - | 29% | 98% | 106% | 91% | |
| % RES of installed capacity | 15% | 34% | 62% | 76% | 100% | |
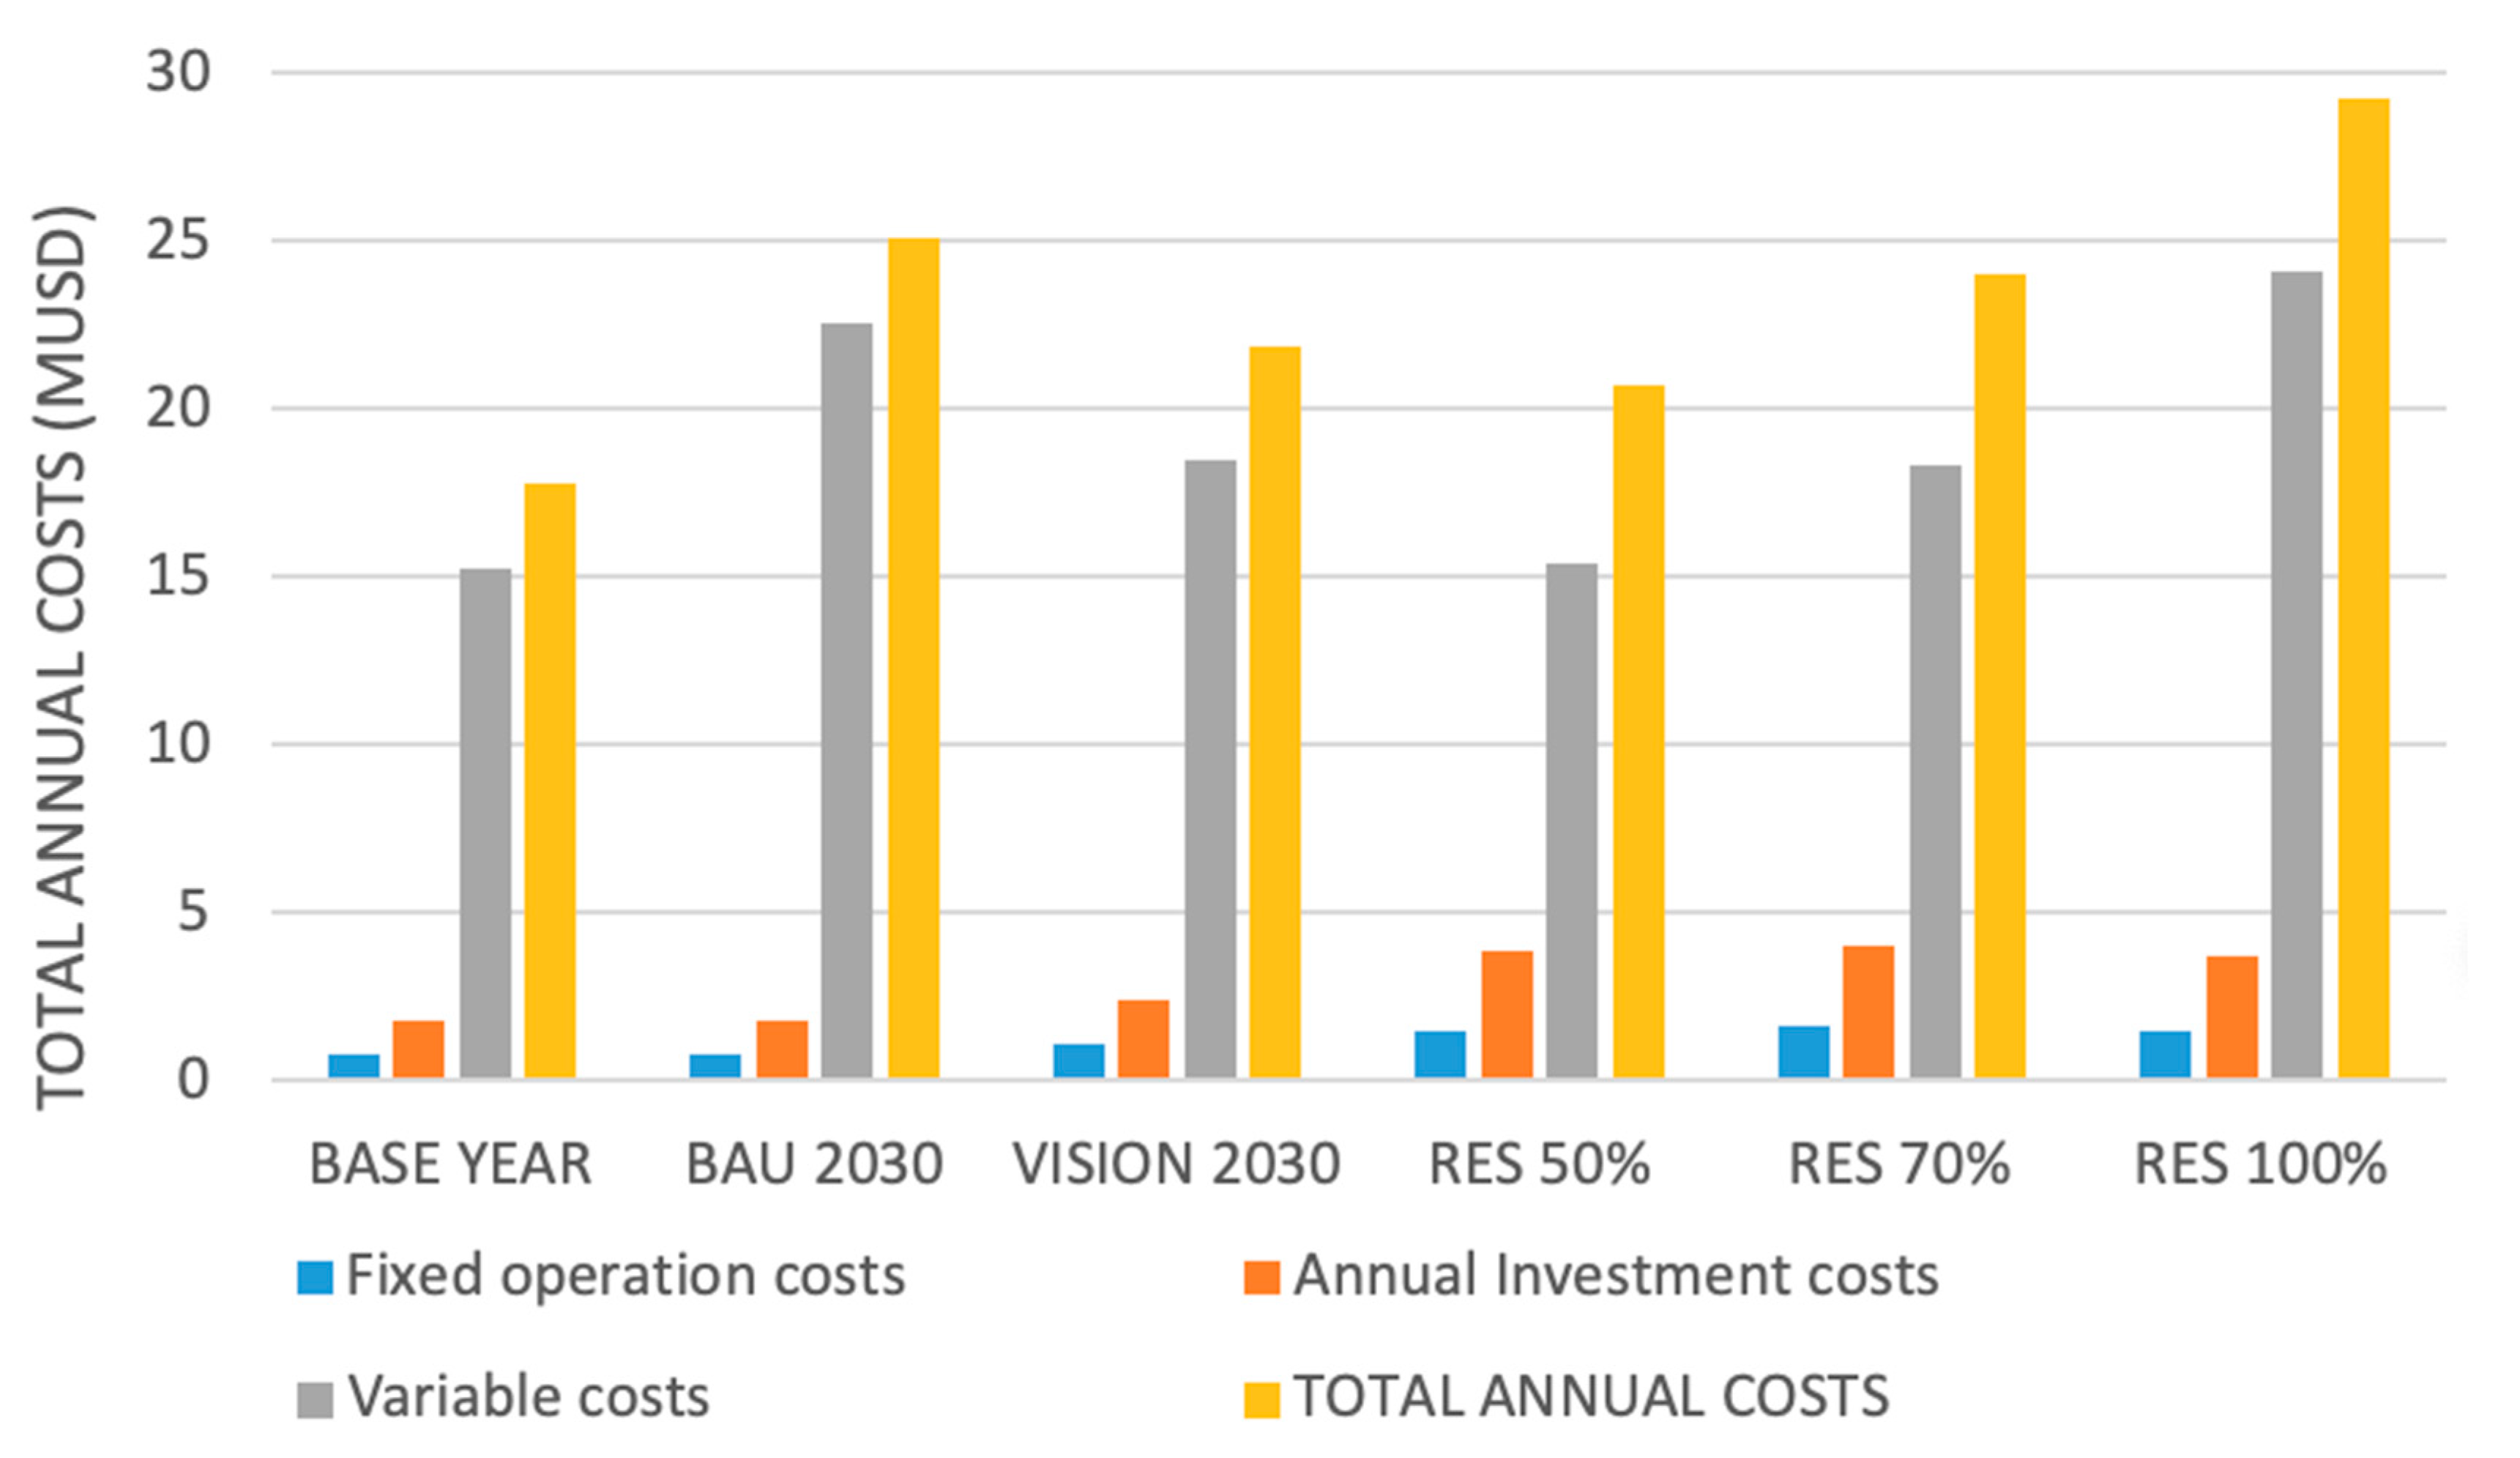
| Total Annual Costs (MUSD) | 25.1 | 21.9 | 20.7 | 24 | 29.3 | |
| Total investment Costs (MUSD) | 43.2 | 58.7 | 98.2 | 99.7 | 91.8 | |
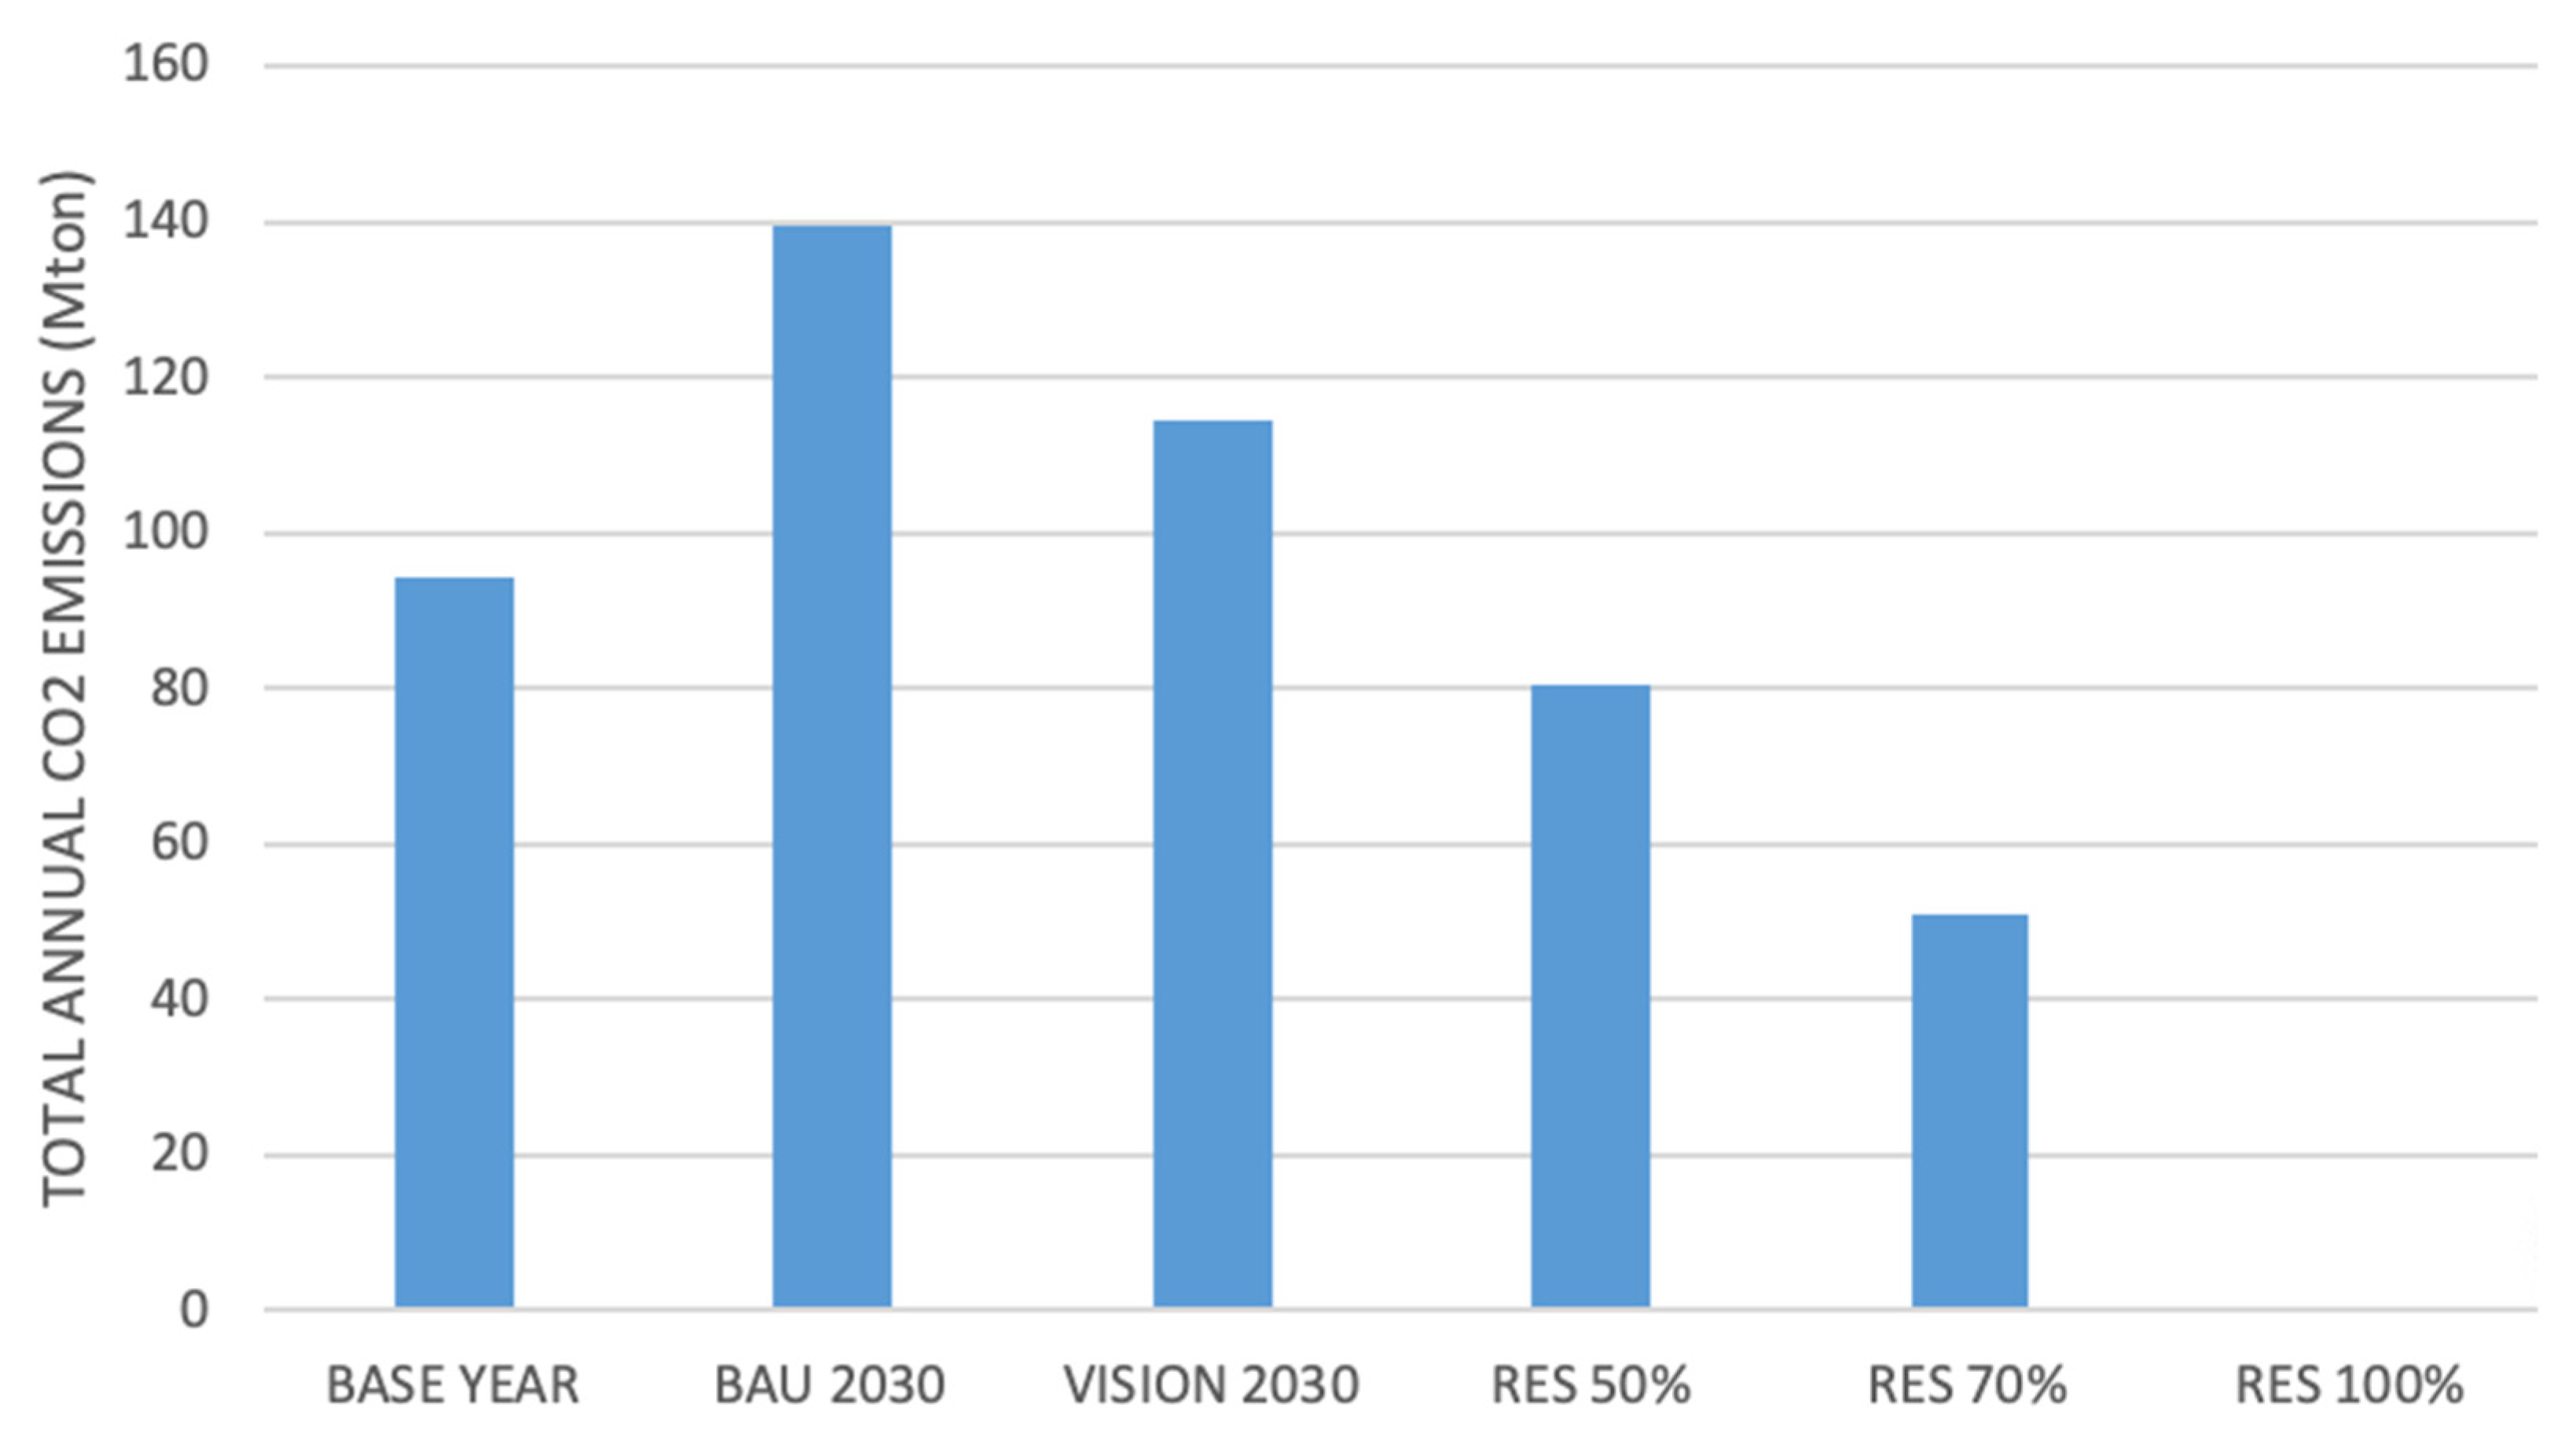
| CO2 emissions Electricity production | 139 Mton | 115 Mton | 81 Mton | 51 Mton | 0 Mton | |
| 170 GWh | 171 GWh | 175 GWh | 176 GWh | 175 GWh | ||
| Electricity consumption | 170 GWh | 170 GWh | 170 GWh | 170 GWh | 170 GWh |
Publisher’s Note: MDPI stays neutral with regard to jurisdictional claims in published maps and institutional affiliations. |
© 2021 by the author. Licensee MDPI, Basel, Switzerland. This article is an open access article distributed under the terms and conditions of the Creative Commons Attribution (CC BY) license (https://creativecommons.org/licenses/by/4.0/).
Share and Cite
Korkeakoski, M. Towards 100% Renewables by 2030: Transition Alternatives for a Sustainable Electricity Sector in Isla de la Juventud, Cuba. Energies 2021, 14, 2862. https://doi.org/10.3390/en14102862
Korkeakoski M. Towards 100% Renewables by 2030: Transition Alternatives for a Sustainable Electricity Sector in Isla de la Juventud, Cuba. Energies. 2021; 14(10):2862. https://doi.org/10.3390/en14102862
Chicago/Turabian StyleKorkeakoski, Mika. 2021. "Towards 100% Renewables by 2030: Transition Alternatives for a Sustainable Electricity Sector in Isla de la Juventud, Cuba" Energies 14, no. 10: 2862. https://doi.org/10.3390/en14102862
APA StyleKorkeakoski, M. (2021). Towards 100% Renewables by 2030: Transition Alternatives for a Sustainable Electricity Sector in Isla de la Juventud, Cuba. Energies, 14(10), 2862. https://doi.org/10.3390/en14102862