A Prediction Model for Battery Electric Bus Energy Consumption in Transit
Abstract
1. Introduction
2. BEB Energy Consumption Models
3. Methodology
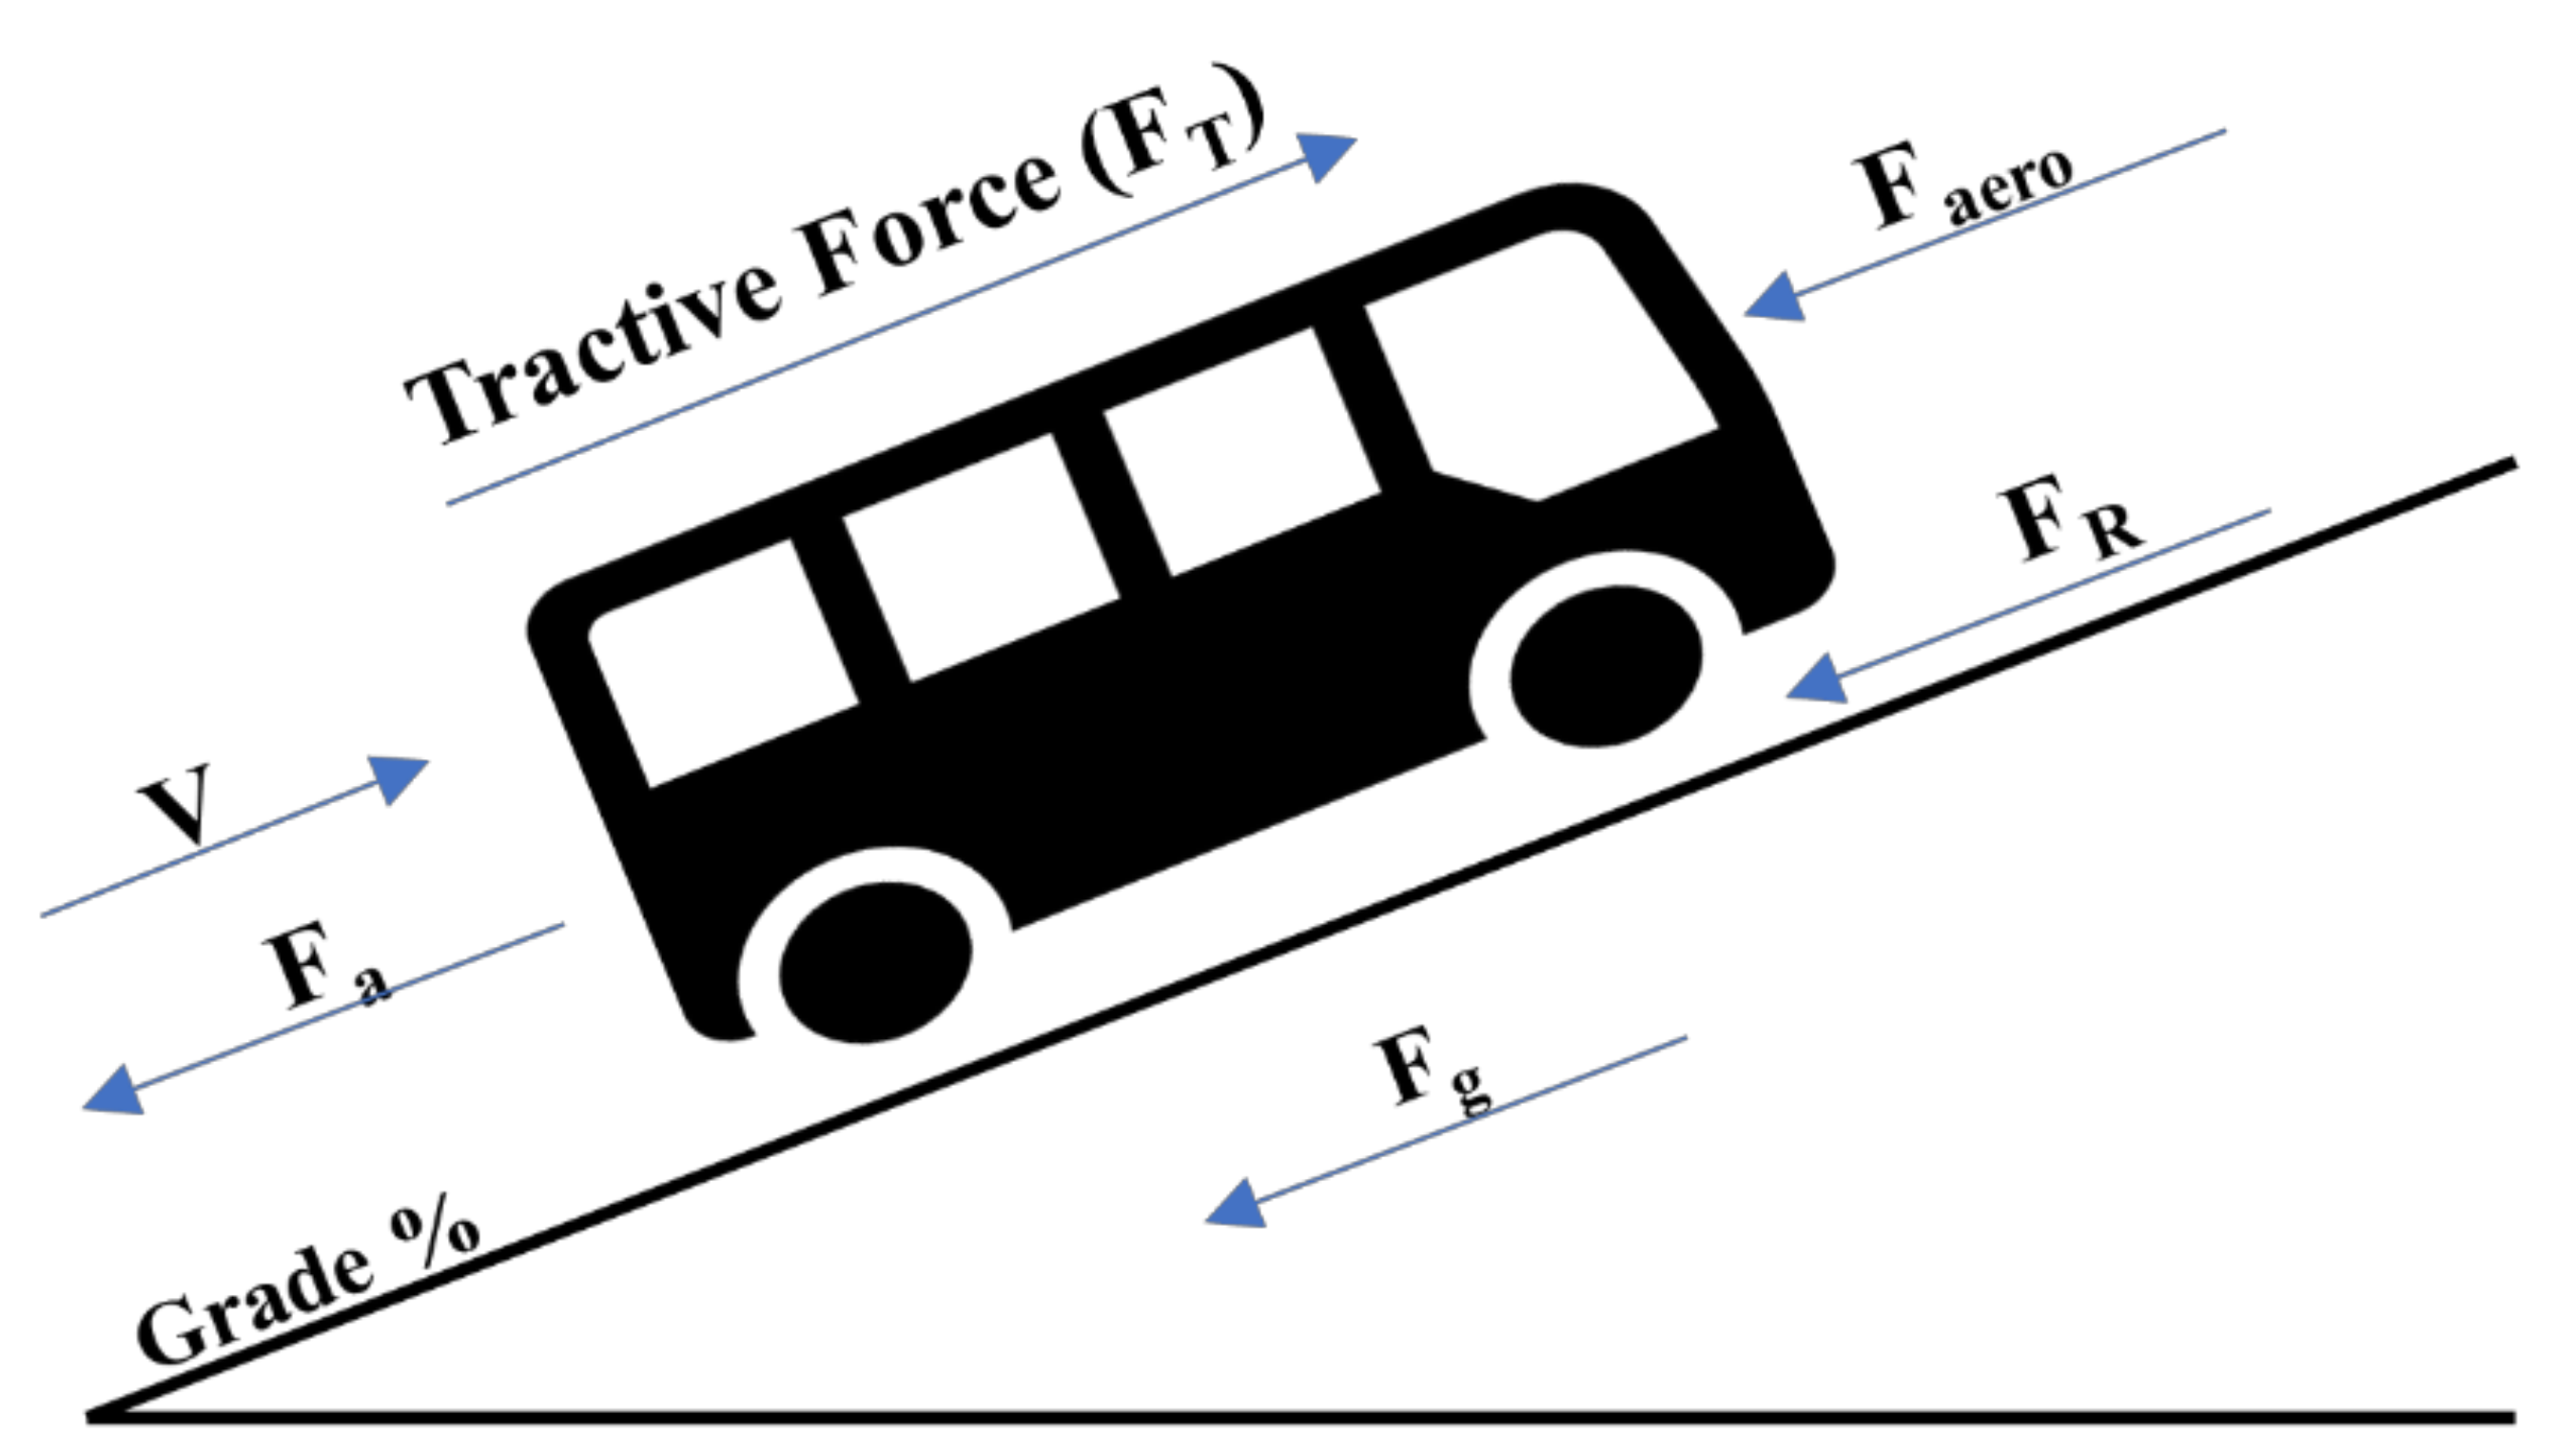
3.1. BEB Energy Estimation Simulation Models
3.2. Energy Consumption Model Validation
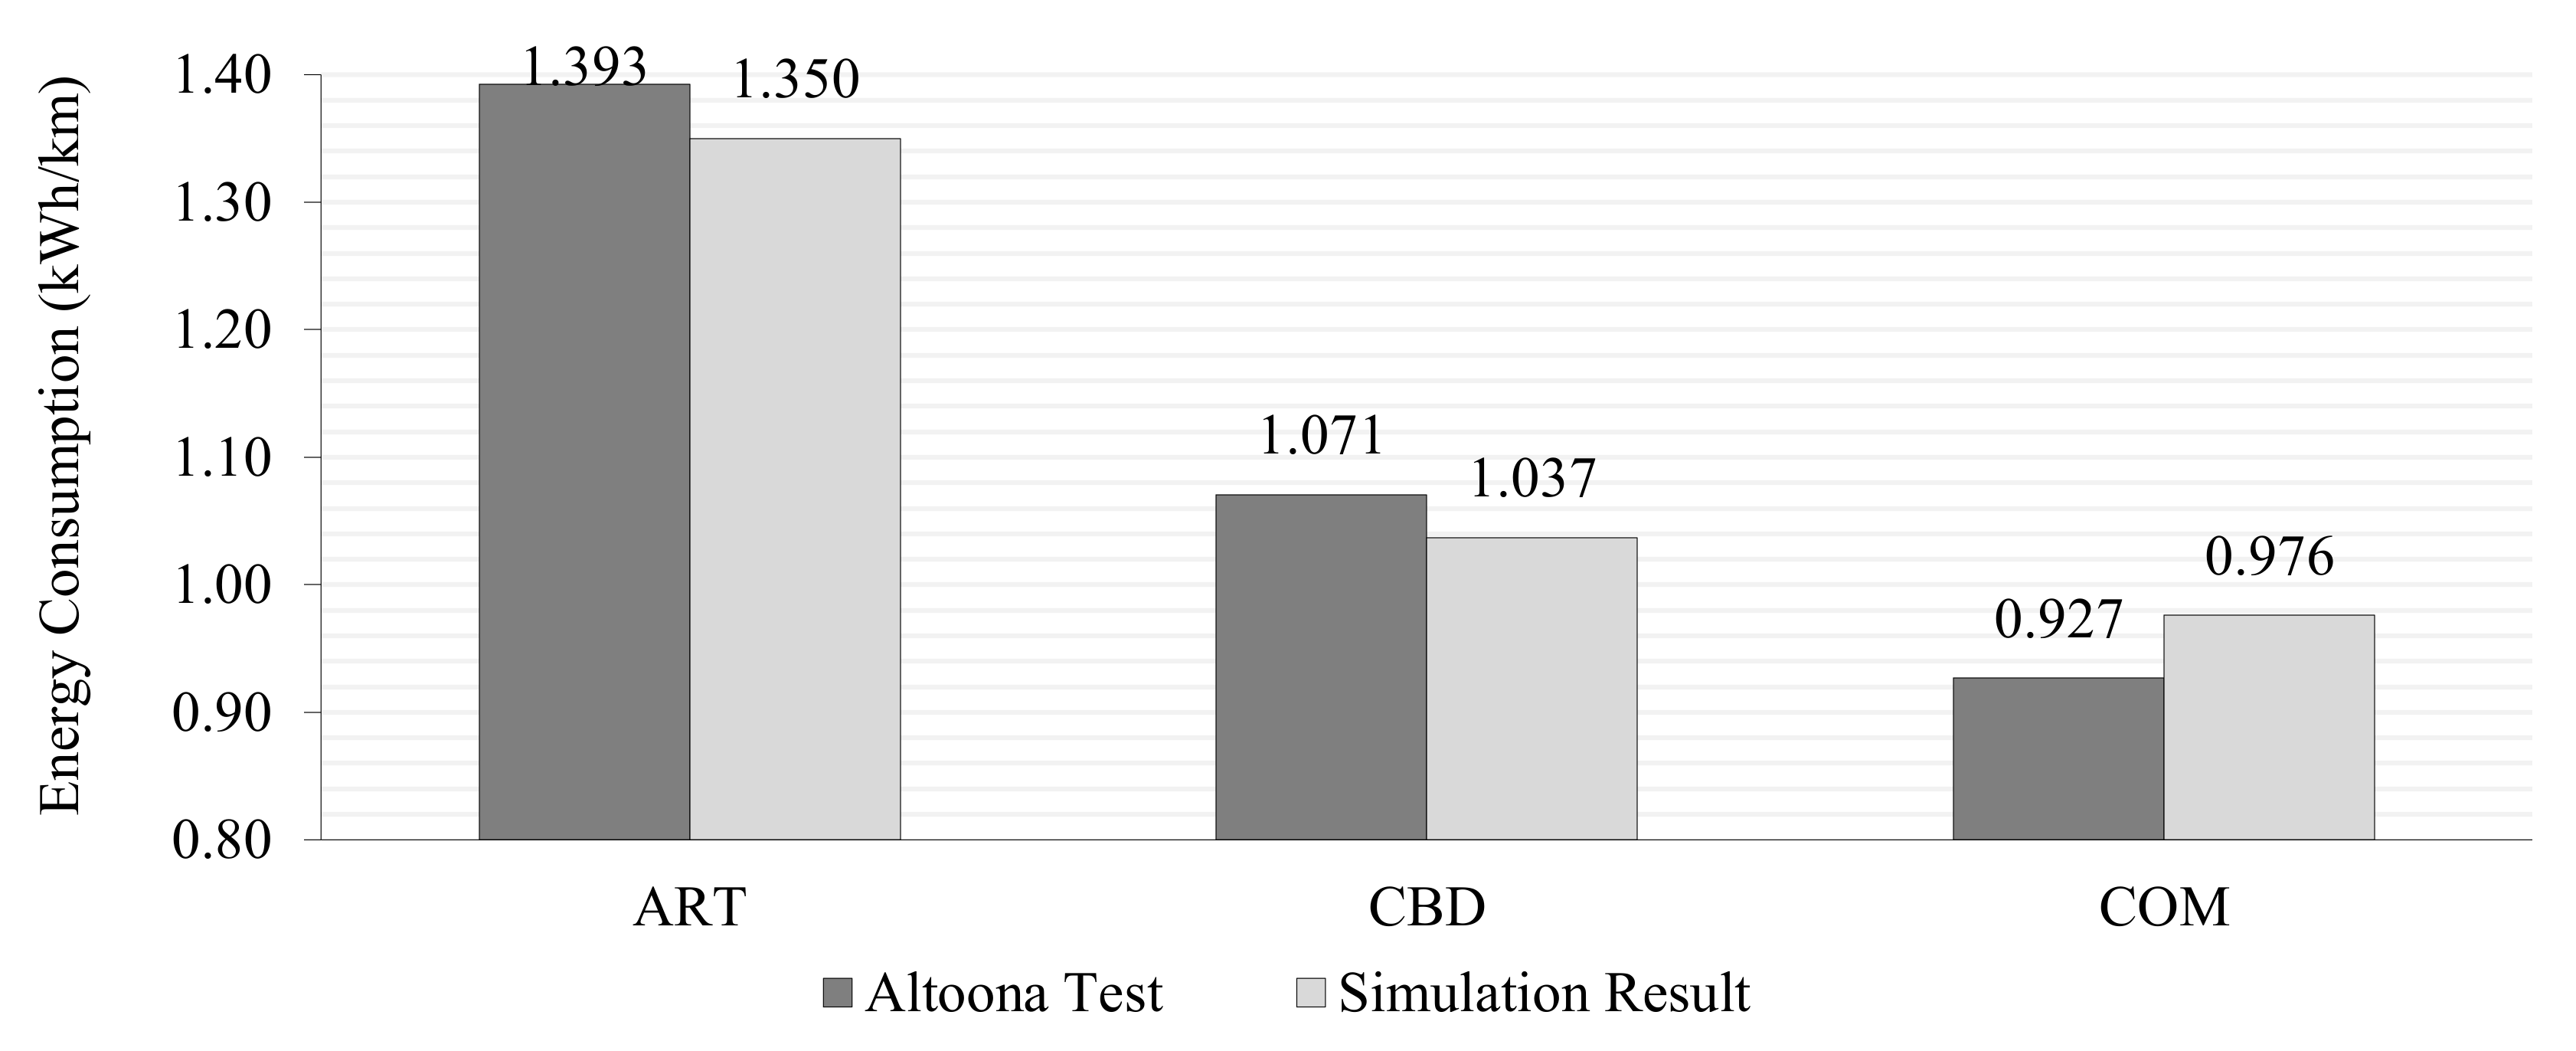
3.2.1. Validation Using Altoona Real-World Test Results
3.2.2. Validation Using Autonomie Software
3.3. Full-Factorial Experiment Design
3.4. Prediction Model
4. Results
4.1. Descriptive Statistics
4.2. BEB Energy Consumption Prediction Model
5. Discussion and Practical Relevance
5.1. Discussion of the Results
5.2. Practical Implications
6. Conclusions
Author Contributions
Funding
Institutional Review Board Statement
Informed Consent Statement
Data Availability Statement
Acknowledgments
Conflicts of Interest
Appendix A. Altoona Speed Profile

Appendix B. Autonomie-Based Validation of the Developed Simulink Model

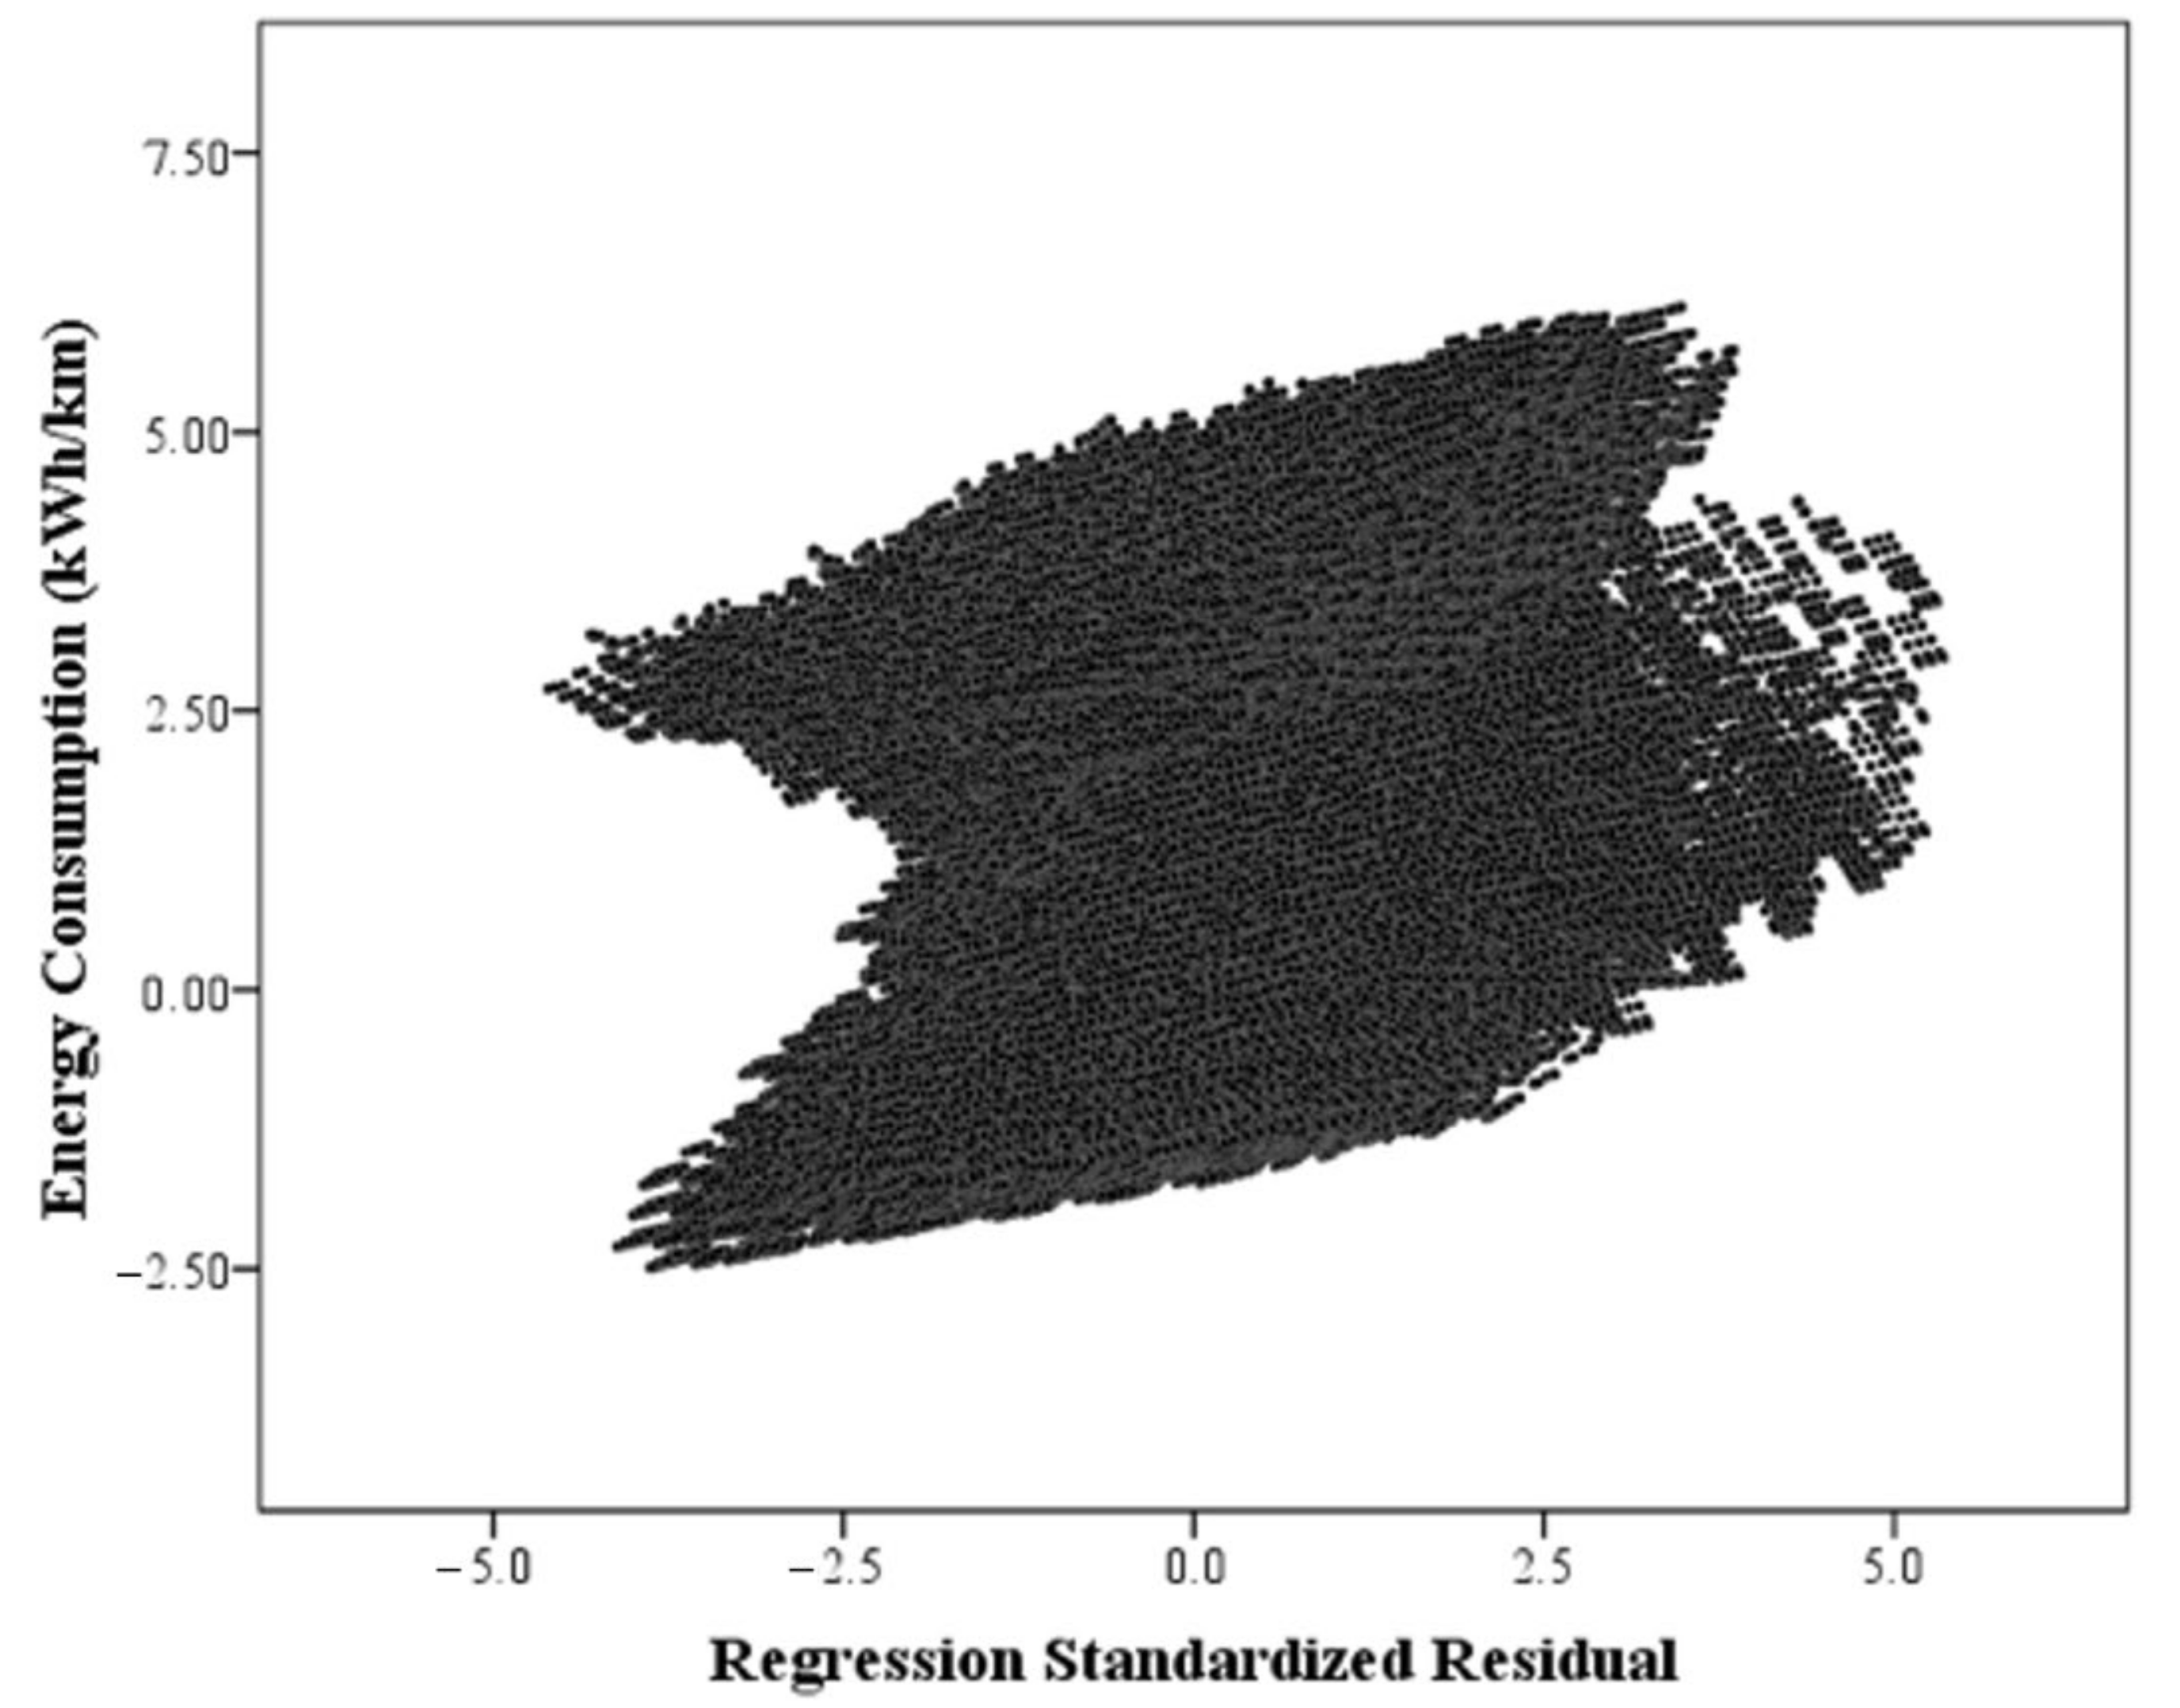
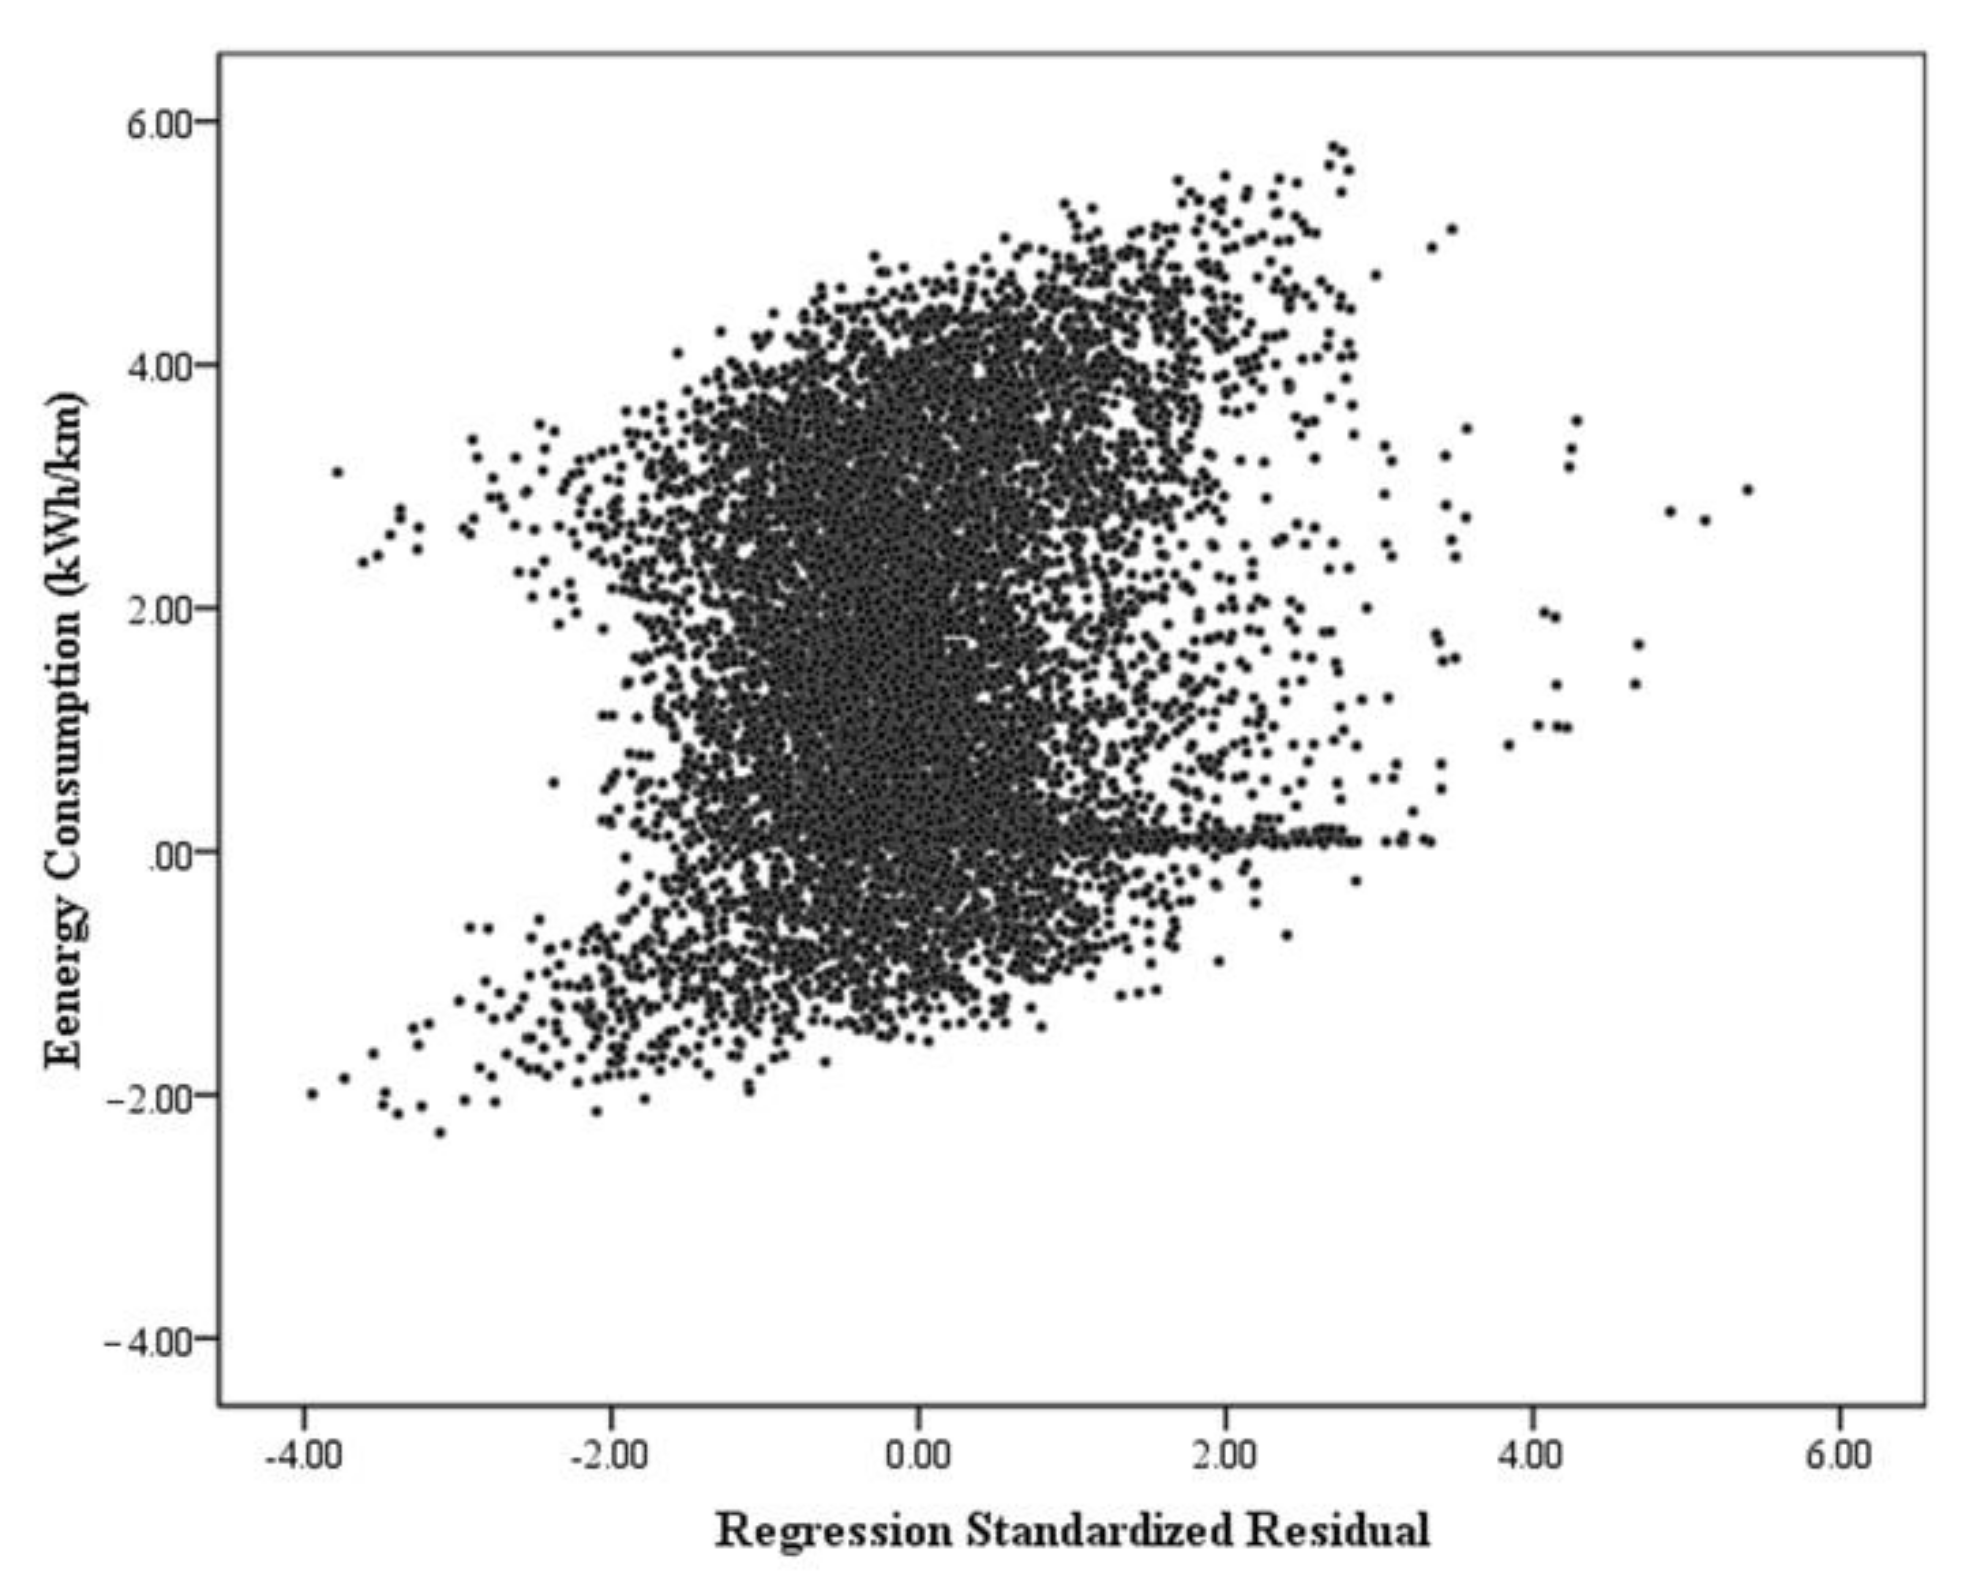
Appendix C. A Scatter Plot for the Regression Standardized Residuals (n = 907,199)
References
- Perrotta, D.; Macedo, J.L.; Rossetti, R.J.; De Sousa, J.F.; Kokkinogenis, Z.; Ribeiro, B.; Afonso, J.L. Route Planning for Electric Buses: A Case Study in Oporto. Procedia Soc. Behav. Sci. 2014, 111, 1004–1014. [Google Scholar] [CrossRef][Green Version]
- Markel, T.; Brooker, A.; Hendricks, T.; Johnson, V.; Kelly, K.; Kramer, B.; O’Keefe, M.; Sprik, S.; Wipke, K. ADVISOR: A systems analysis tool for advanced vehicle modeling. J. Power Sources 2002, 110, 255–266. [Google Scholar] [CrossRef]
- Ferguson, M.; Mohamed, M.; Maoh, H. On the Electrification of Canada’s Vehicular Fleets: National-scale analysis shows that mindsets matter. IEEE Electrif. Mag. 2019, 7, 55–65. [Google Scholar] [CrossRef]
- Mohamed, M.; Higgins, C.; Ferguson, M.; Kanaroglou, P. Identifying and characterizing potential electric vehicle adopters in Canada: A two-stage modelling approach. Transp. Policy 2016, 52, 100–112. [Google Scholar] [CrossRef]
- Kennedy, C. Key threshold for electricity emissions. Nat. Clim. Chang. 2015, 5, 179–181. [Google Scholar] [CrossRef]
- Mahmoud, M.; Garnett, R.; Ferguson, M.; Kanaroglou, P. Electric buses: A review of alternative powertrains. Renew. Sustain. Energy Rev. 2016, 62, 673–684. [Google Scholar] [CrossRef]
- Borén, S. Electric buses’ sustainability effects, noise, energy use, and costs. Int. J. Sustain. Transp. 2020, 14, 1–16. [Google Scholar] [CrossRef]
- Kühne, R. Electric buses—An energy efficient urban transportation means. Energy 2010, 35, 4510–4513. [Google Scholar] [CrossRef]
- Mohamed, M.; Farag, H.; El-Taweel, N.; Ferguson, M. Simulation of electric buses on a full transit network: Operational feasibility and grid impact analysis. Electr. Power Syst. Res. 2017, 142, 163–175. [Google Scholar] [CrossRef]
- Quarles, N.; Kockelman, K.M.; Mohamed, M. Costs and Benefits of Electrifying and Automating Bus Transit Fleets. Sustainability 2020, 12, 3977. [Google Scholar] [CrossRef]
- Wellik, T.K.; Griffin, J.R.; Kockelman, K.M.; Mohamed, M. Utility-transit nexus: Leveraging intelligently charged electrified transit to support a renewable energy grid. Renew. Sustain. Energy Rev. 2021, 139. [Google Scholar] [CrossRef]
- Mohamed, M.; Ferguson, M.; Kanaroglou, P. What hinders adoption of the electric bus in Canadian transit? Perspectives of transit providers. Transp. Res. Part D Transp. Environ. 2018, 64, 134–149. [Google Scholar] [CrossRef]
- Chen, F.; Fernandes, T.; Roche, M.Y.; Carvalho, M.D.G. Investigation of challenges to the utilization of fuel cell buses in the EU vs transition economies. Renew. Sustain. Energy Rev. 2007, 11, 357–364. [Google Scholar] [CrossRef]
- El-Taweel, N.A.; Farag, H.E.Z.; Mohamed, M. Integrated Utility-Transit Model for Optimal Configuration of Battery Electric Bus Systems. IEEE Syst. J. 2020, 14, 738–748. [Google Scholar] [CrossRef]
- Liu, Z.; Song, Z.; He, Y. Economic Analysis of On-Route Fast Charging for Battery Electric Buses: Case Study in Utah. Transp. Res. Rec. J. Transp. Res. Board 2019, 2673, 119–130. [Google Scholar] [CrossRef]
- Abdelaty, H.; Elsayed, M.; Mohamed, M. Assessing the feasibility of energy storage system for electric bus transit planning. In Proceedings of the 55th Annual Canadian Transportation Research Forum, Montreal, QC, Canada, 24–27 May 2020; pp. 1–21. [Google Scholar]
- El-Taweel, N.A.; Mohamed, M.; Farag, H.E. Optimal design of charging stations for electrified transit networks. In Proceedings of the 2017 IEEE Transportation Electrification Conference and Expo (ITEC), Chicago, IL, USA, 22–24 June 2017; pp. 786–791. [Google Scholar]
- He, Y.; Song, Z.; Liu, Z. Fast-charging station deployment for battery electric bus systems considering electricity demand charges. Sustain. Cities Soc. 2019, 48, 101530. [Google Scholar] [CrossRef]
- Rupp, M.; Rieke, C.; Handschuh, N.; Kuperjans, I. Economic and ecological optimization of electric bus charging considering variable electricity prices and CO2eq intensities. Transp. Res. Part D Transp. Environ. 2020, 81, 102293. [Google Scholar] [CrossRef]
- Liu, K.; Yamamoto, T.; Morikawa, T. Impact of road gradient on energy consumption of electric vehicles. Transp. Res. Part D Transp. Environ. 2017, 54, 74–81. [Google Scholar] [CrossRef]
- Qi, X.; Wu, G.; Boriboonsomsin, K.; Barth, M.J. Data-driven decomposition analysis and estimation of link-level electric vehicle energy consumption under real-world traffic conditions. Transp. Res. Part D Transp. Environ. 2018, 64, 36–52. [Google Scholar] [CrossRef]
- Teoh, L.E.; Khoo, H.L.; Goh, S.Y.; Chong, L.M. Scenario-based electric bus operation: A case study of Putrajaya, Malaysia. Int. J. Transp. Sci. Technol. 2018, 7, 10–25. [Google Scholar] [CrossRef]
- Vepsäläinen, J.; Kivekäs, K.; Otto, K.; Lajunen, A.; Tammi, K. Development and validation of energy demand uncertainty model for electric city buses. Transp. Res. Part D Transp. Environ. 2018, 63, 347–361. [Google Scholar] [CrossRef]
- Wang, J.; Kang, L.; Liu, Y. Optimal scheduling for electric bus fleets based on dynamic programming approach by considering battery capacity fade. Renew. Sustain. Energy Rev. 2020, 130, 109978. [Google Scholar] [CrossRef]
- Zhou, B.; Wu, Y.; Zhou, B.; Wang, R.; Ke, W.; Zhang, S.; Hao, J. Real-world performance of battery electric buses and their life-cycle benefits with respect to energy consumption and carbon dioxide emissions. Energy 2016, 96, 603–613. [Google Scholar] [CrossRef]
- Basso, R.; Kulcsár, B.; Egardt, B.; Lindroth, P.; Sanchez-Diaz, I. Energy consumption estimation integrated into the Electric Vehicle Routing Problem. Transp. Res. Part D Transp. Environ. 2019, 69, 141–167. [Google Scholar] [CrossRef]
- De Cauwer, C.; Van Mierlo, J.; Coosemans, T. Energy Consumption Prediction for Electric Vehicles Based on Real-World Data. Energies 2015, 8, 8573–8593. [Google Scholar] [CrossRef]
- Kivekäs, K.; Lajunen, A.; Vepsäläinen, J.; Tammi, K. City Bus Powertrain Comparison: Driving Cycle Variation and Passenger Load Sensitivity Analysis. Energies 2018, 11, 1755. [Google Scholar] [CrossRef]
- Vepsäläinen, J.; Otto, K.; Lajunen, A.; Tammi, K. Computationally efficient model for energy demand prediction of electric city bus in varying operating conditions. Energy 2019, 169, 433–443. [Google Scholar] [CrossRef]
- Abdelaty, H.; Mohamed, M. Uncertainty in Electric Bus Energy Consumption: The Impacts of Grade and Driving Behaviour. In Proceedings of the 55th Annual Canadian Transportation Research Forum, Montreal, QC, Canada, 24–27 May 2020. [Google Scholar]
- Abdelaty, H.; Al-Obaidi, A.; Mohamed, M.; Farag, H.E.Z. Machine Learning Prediction Models for Battery-Electric Bus Energy Consumption in Transit. Transp. Res. Part D Transp. Environ. 2021. [Google Scholar]
- Kunith, A.; Mendelevitch, R.; Goehlich, D. Electrification of a city bus network—An optimization model for cost-effective placing of charging infrastructure and battery sizing of fast-charging electric bus systems. Int. J. Sustain. Transp. 2017, 11, 707–720. [Google Scholar] [CrossRef]
- Franca, A. Electricity Consumption and Battery Lifespan Estimation for Transit Electric Buses: Drivetrain Simulations and Electrochemical Modelling; University of Victoria: Victoria, BC, Canada, 2015. [Google Scholar]
- Gallet, M.; Massier, T.; Hamacher, T. Estimation of the energy demand of electric buses based on real-world data for large-scale public transport networks. Appl. Energy 2018, 230, 344–356. [Google Scholar] [CrossRef]
- Lajunen, A. Energy consumption and cost-benefit analysis of hybrid and electric city buses. Transp. Res. Part C Emerg. Technol. 2014, 38, 1–15. [Google Scholar] [CrossRef]
- Lajunen, A. Lifecycle costs and charging requirements of electric buses with different charging methods. J. Cleaner Prod. 2018, 172, 56–67. [Google Scholar] [CrossRef]
- Vepsäläinen, J.; Ritari, A.; Lajunen, A.; Kivekäs, K.; Tammi, K. Energy Uncertainty Analysis of Electric Buses. Energies 2018, 11, 3267. [Google Scholar] [CrossRef]
- Gao, Z.; Lin, Z.; LaClair, T.J.; Liu, C.; Li, J.-M.; Birky, A.K.; Ward, J. Battery capacity and recharging needs for electric buses in city transit service. Energy 2017, 122, 588–600. [Google Scholar] [CrossRef]
- Lajunen, A.; Tammi, K. Energy consumption and carbon dioxide emission analysis for electric city buses. In Proceedings of the 29th World Electric Vehicle Symposium and Exhibition (EVS29), Montreal, QC, Canada, 19–22 June 2016. [Google Scholar]
- Diaz Alvarez, A.; Serradilla Garcia, F.; Naranjo, J.E.; Anaya, J.J.; Jimenez, F. Modeling the Driving Behavior of Electric Vehicles Using Smartphones and Neural Networks. IEEE Intell. Transp. Syst. Mag. 2014, 6, 44–53. [Google Scholar] [CrossRef]
- Basma, H.; Mansour, C.; Nemer, M.; Stabat, P.; Haddad, M. Sensitivity analysis of bus line electrification at different operating conditions. In Proceedings of the 8th Transport Research Arena TRA, Helsinki, Finland, 27–30 April 2020; pp. 1–10. [Google Scholar]
- Bajtelsmit, V. Risk Analysis and the Optimal Capital Budget; Lecture notes; University of Missouri: St. Louis, MO, USA, 1997. [Google Scholar]
- Christopher Frey, H.; Patil, S.R. Identification and Review of Sensitivity Analysis Methods. Risk Anal. 2002, 22, 553–578. [Google Scholar] [CrossRef]
- Yuan, X.; Zhang, C.; Hong, G.; Huang, X.; Li, L. Method for evaluating the real-world driving energy consumptions of electric vehicles. Energy 2017, 141, 1955–1968. [Google Scholar] [CrossRef]
- De Cauwer, C.; Verbeke, W.; Coosemans, T.; Faid, S.; Van Mierlo, J. A Data-Driven Method for Energy Consumption Prediction and Energy-Efficient Routing of Electric Vehicles in Real-World Conditions. Energies 2017, 10, 608. [Google Scholar] [CrossRef]
- Pamula, T.; Pamula, W. Estimation of the Energy Consumption of Battery Electric Buses for Public Transport Networks Using Real-World Data and Deep Learning. Energies 2020, 13, 2340. [Google Scholar] [CrossRef]
- Galvin, R. Energy consumption effects of speed and acceleration in electric vehicles: Laboratory case studies and implications for drivers and policymakers. Transp. Res. Part D Transp. Environ. 2017, 53, 234–248. [Google Scholar] [CrossRef]
- Wang, J.-B.; Liu, K.; Yamamoto, T.; Morikawa, T. Improving Estimation Accuracy for Electric Vehicle Energy Consumption Considering the Effects of Ambient Temperature. Energy Procedia 2017, 105, 2904–2909. [Google Scholar] [CrossRef]
- Neaimeh, M.; Hill, G.A.; Hübner, Y.; Blythe, P.T. Routing systems to extend the driving range of electric vehicles. IET Intell. Transp. Syst. 2013, 7, 327–336. [Google Scholar] [CrossRef]
- Kivekäs, K.; Vepsäläinen, J.; Tammi, K.; Anttila, J. Influence of Driving Cycle Uncertainty on Electric City Bus Energy Consumption. In Proceedings of the 2017 IEEE Vehicle Power and Propulsion Conference (VPPC), Belfort, France, 11–14 December 2017; pp. 1–5. [Google Scholar]
- Lajunen, A.; Kivekaes, K.; Baldi, F.; Vepsaelaeinen, J.; Tammi, K. Different Approaches to Improve Energy Consumption of Battery Electric Buses. In Proceedings of the 2018 IEEE Vehicle Power and Propulsion Conference (VPPC), Chicago, IL, USA, 27–30 August 2018; pp. 1–6. [Google Scholar]
- Qi, Z.; Yang, J.; Jia, R.; Wang, F. Investigating Real-World Energy Consumption of Electric Vehicles: A Case Study of Shanghai. Procedia Comput. Sci. 2018, 131, 367–376. [Google Scholar] [CrossRef]
- Liu, K.; Wang, J.; Yamamoto, T.; Morikawa, T. Exploring the interactive effects of ambient temperature and vehicle auxiliary loads on electric vehicle energy consumption. Appl. Energy 2018, 227, 324–331. [Google Scholar] [CrossRef]
- Zhang, R.; Yao, E. Electric vehicles’ energy consumption estimation with real driving condition data. Transp. Res. Part D Transp. Environ. 2015, 41, 177–187. [Google Scholar] [CrossRef]
- Badin, F.; Le Berr, F.; Briki, H.; Dabadie, J.-C.; Petit, M.; Magand, S.; Condemine, E. Evaluation of EVs energy consumption influencing factors, driving conditions, auxiliaries use, driver’s aggressiveness. In Proceedings of the 2013 World Electric Vehicle Symposium and Exhibition (EVS27), Barcelona, Spain, 17–20 November 2013; pp. 1–12. [Google Scholar]
- Hahn, B.; Valentine, D. SIMULINK® Toolbox. In Essential MATLAB for Engineers and Scientists; Academic Press: Cambridge, MA, USA, 2019. [Google Scholar]
- De Filippo, G.; Marano, V.; Sioshansi, R. Simulation of an electric transportation system at The Ohio State University. Appl. Energy 2014, 113, 1686–1691. [Google Scholar] [CrossRef]
- Rodríguez Pardo, M. Uncertainty in Electric Bus Mass and Its Influence in Energy Consumption; Aalto University: Espoo, Finland, 2017. [Google Scholar]
- Beckers, C.J.J.; Besselink, I.J.M.; Frints, J.J.M.; Nijmeijer, H. Energy consumption prediction for electric city buses. In Proceedings of the 13th ITS European Congres, Eindhoven, The Netherlands, 3–6 June 2019. [Google Scholar]
- Reimpell, J.; Stoll, H.; Betzler, J.W. The Automotive Chassis: Engineering Principles; Butterworth-Heinemann: Woburn, MA, USA, 2001. [Google Scholar]
- Hogan, C.M.; Latshaw, G.L. The relationship between highway planning and urban noise. In Proceedings of the ASCE Urban Transportation Division Environment Impact Specialty Conference, Chicago, IL, USA, 21–23 May 1973; pp. 109–126. [Google Scholar]
- Pelkmans, L.; De Keukeleere, D.; Bruneel, H.; Lenaers, G. Influence of Vehicle Test Cycle Characteristics on Fuel Consumption and Emissions of City Buses. SAE Trans. 2001, 110, 1388–1398. [Google Scholar]
- NewFlyer-XE40. Xcelsior Charge Technical Summary—40′ Electric Bus; New Flyer: Anniston, AL, USA, 2017. [Google Scholar]
- James, G.M.; Hastie, T.; Witten, D.; Tibshirani, R. An Introduction to Statistical Learning: With Applications in R; Springer: New York, NY, USA, 2013. [Google Scholar]
- Altoona. Federal Transit Bus Test, Manufacturer: New Flyer, Model: XE40; Pennsylvania Transportation Institute: Pennsylvania, PA, USA, 2015. [Google Scholar]
- Sagaama, I.; Kchiche, A.; Trojet, W.; Kamoun, F. Impact of Road Gradient on Electric Vehicle Energy Consumption in Real-World Driving; Barolli, L., Amato, F., Moscato, F., Enokido, T., Takizawa, M., Eds.; Springer International Publishing: Cham, Switzerland, 2020; pp. 393–404. [Google Scholar]
- Government of Canada. Canada Daily Data Report, Environment and Natural Resources. Weather, Climate and Hazard; Government of Canada: Toronto, ON, Canada, 2019.
- Kontou, A.; Miles, J. Electric Buses: Lessons to be Learnt from the Milton Keynes Demonstration Project. Procedia Eng. 2015, 118, 1137–1144. [Google Scholar] [CrossRef]
- Joseph, F.; Hair, J.; Black, W.C.; Babin, B.J.; Anderson, R.E. Multivariate Data Analysis, 7th ed.; Pearson Education Limited: Harlow, UK, 2009. [Google Scholar]
- George, D.; Mallery, P. SPSS for Windows Step by Step: A Simple Guide and Reference; Prentice Hall Press: Hoboken, NJ, USA, 2010. [Google Scholar]
- Hair, J.; Black, W.; Babin, B.; Anderson, R. Multivariate Data Analysis; Pearson Prentice Hall: Upper Saddle River, NJ, USA, 2010. [Google Scholar]
- Liu, K.; Wang, J.; Yamamoto, T.; Morikawa, T. Modelling the multilevel structure and mixed effects of the factors influencing the energy consumption of electric vehicles. Appl. Energy 2016, 183, 1351–1360. [Google Scholar] [CrossRef]
- Melaina, M.; Bush, B.; Eichman, J.; Wood, E.; Stright, D.; Krishnan, V.; Keyser, D.; Mai, T.; McLaren, J. National Economic Value Assessment of Plug-In Electric Vehicles; National Renewable Energy Laboratory (NREL): Golden, CO, USA, 2016.





| Vehicular Parameters | Operational Parameters | Topological Parameters | External Parameters | ||||||||||||||
|---|---|---|---|---|---|---|---|---|---|---|---|---|---|---|---|---|---|
| Mass | Frontal Area | Drag Coefficient | Rolling Resistance | Battery Temperature | Initial State of Charge | Number of Stops | Spacing between Stops | Average Speed | Acceleration Rate | Deceleration Rate | Route Length | Road Grade | Ambient Temperature | Air Density | Auxiliary Power | HVAC | |
| m‰ (ton) | (m2) | (°C) | (%) | (m) | (Km/h) | a‰ (m/s2) | d‰ (m/s2) | (Km) | GR‰ (%) | (°C) | (Kg/m3) | (kW) | HVAC (kW) | ||||
| Gallet [34] | 10.00 12.50 15.00 17.50 18.50 | 8.30 10.35 | 0.60 0.70 0.80 | 0.006 0.008 0.010 | - | - | 5 | - | 11.50 18.90 19.10 20.00 36.60 | 0.70 1.00 2.00 | 1.00 1.50 2.50 | 0.236 0.384 0.600 0.662 0.948 | - | - | 1.18 | 8 10 12 15 | - |
| Vepsäläinen [29] | 8.50 to 15.00 | - | - | 0.006 to 0.020 | 15 to 30 | 100 to 50 | - | - | - | - | - | - | - | −30 to 35 | - | 2 to 7 | 2 to 25 |
| Vepsäläinen [23] | 12.40 14.80 | 6.20 | 0.60 | 0.010 | 20 | 89 | 18 | - | 24.20 | 1.67 (max) | 2.57 (max) | 10.100 | - | 5 | 1.27 | - | - |
| Kivekäs [50] | 10.35 12.35 15.00 | 6.20 | 0.50 | 0.008 | - | - | 25 | - | 20.58 | 0.55 (avg.) | 0.51 (avg.) | 10.422 | - | - | - | 1.50 | - |
| Lajunen [35] | 8.50 to 15.00 | 6.20 | 0.70 | 0.008 | - | - | - | - | 20.38 | 0.54 (avg.) | 0.50 (avg.) | - | - | - | - | - | - |
| Lajunen [51] | 12.70 14.65 | - | - | 0.008 0.012 | - | - | - | - | 10.9 to 41.2 | 0.15 to 0.33 | - | 3.3 to 42.4 | 0.00 to +9.69 | - | - | 6.00 9.00 | - |
| Franca [33] | 16.92 | 8.90 | 0.66 | 0.008 | - | - | - | - | 20.23 | 1.50 1.30 (avg.) | 2.50 2.70 (max) | 3.22 | - | - | - | 2.50 | - |
| Gao [38] | 10.44 15.63 | 8.50 | 0.79 | 0.0098 | - | - | - | - | 5.75 11.00 13.42 19.85 | 3.00 4.06 4.60 6.10 | 4.30 4.50 5.13 5.60 | 0.98 6.65 6.86 10.53 | - | - | - | 3.75 | - |
| Lajunen [36] | 10.00 | 6.20 | 0.60 | 0.010 | - | - | - | 99 175 344 384 714 1250 | 5.90 11.00 19.80 22.50 31.50 41.20 | 1.40 1.80 2.10 2.40 2.80 - | 1.90 2.10 2.30 2.50 3.60 - | 1.00 3.30 10.30 10.50 10.90 28.60 | - | - | - | - | - |
| Kunith [32] | 12.50 17.50 | 8.28 10.35 | 0.66 | 0.008 | - | - | - | - | - | - | - | - | - | −15 to 30 | 1.29 | 2.57 to 17.06 | - |
| Minimum | 8.50 | 6.20 | 0.50 | 0.006 | 15 | 50 | 5 | 99 | 5.75 | 0.15 | 0.50 | 0.236 | 0.00 | −30 | 1.18 | 1.50 | 2.00 |
| Maximum | 20.00 | 10.35 | 0.80 | 0.020 | 30 | 100 | 25 | 1250 | 41.20 | 6.10 | 5.60 | 42.40 | 9.69 | 35 | 1.29 | 17.06 | 25.00 |
| Mean, (St. d) | 14.260 (3.35) | 7.948 (1.674) | 0.661 (0.0920) | 0.0094 (0.0035) | 21.667 (7.638) | 79.667 (26.274) | 16 (10.149) | 494.333 (427.15) | 20.262 (10.232) | 2.000 (1.563) | −2.688 (1.504) | 8.095 (10.486) | 4.845 (6.852) | 5 (28.062) | 1.247 (0.059) | 7.414 (5.072) | 13.50 (16.26) |
| Model Parameters | Model Type | Mode | |
|---|---|---|---|
| Pamula and Pamula [46] | Spacing between Stops, Travel Time, Elevation Differences, Weather Condition | Linear Regression | Bus |
| Teoh [22] | Route Length, Number of Passengers | Linear Regression | Bus |
| Vepsäläinen [37] | Idle Time, Driver Aggressiveness, Average speed, Stops per Km, Ambient Temperature, initial State of Charge | Linear Regression | Bus |
| Qi [52] | Initial State of Charge, Average Temperature, Route Length, Average Speed | Linear Regression | Vehicle |
| Liu [53] | HVAC, Average speed, Route Length, Ambient Temperature, Road Grade (−9% to 9%) | Ordinary Least Squares Regression Multilevel Mixed Effects Linear Regression. | Vehicle |
| Wang [48] | Linear Regression Multilevel Linear Regression | Vehicle | |
| Liu [20] | Route Length, Average Speed, A/C and Heater Usage Ratio, Road Grade (−9% to 11%) | Linear Regression Three-Level Mixed Effects Models | Vehicle |
| De Cauwer [45] | Rolling Resistance, Aerodynamic Drag, Temperature, Auxiliary Power, Route Length, Travel Time, Acceleration/Deceleration Rates, Vehicle and Wind Speed, Elevation | Linear Regression | Vehicle |
| Yuan [44] | Road Grade, Acceleration/Deceleration Rates, Air Conditioning, Rolling Resistance, Aerodynamic Drag, Ambient Temperature | Linear Regression | Vehicle |
| Galvin [47] | Acceleration/Deceleration Rates, Maximum Speed, Route Length, Average Speed, Travel Time | Linear Regression | Vehicle |
| De Cauwer [27] | Rolling resistance, Aerodynamic Drag, Auxiliary Power, Elevation, Acceleration/Deceleration Rates | Linear Regression | Vehicle |
| Zhang and Yao [54] | Instantaneous Speed, Acceleration Rates, State of Charge | Linear Regression | Vehicle |
| Neaimeh [49] | Road Grade (−6% to 6%), Average Speed | Linear Regression | Vehicle |
| Badin [55] | Average Speed, Acceleration Rates, Stop Duration, Auxiliary Power, Regenerative Brake | Simulation Model resulted in a Non-linear effect | Vehicle |
| Parameter | Value | |
|---|---|---|
| Bus Specification | Battery Initial State of Charge (%) | 100 |
| Max. Torque (N.m.) | 2500 | |
| Battery Capacity (kWh) | 200 | |
| Frontal area (m2) | 8.32 | |
| Dynamic Radius of the Tires (m) | 0.5 | |
| Gear Ratio | 4.66 | |
| Curb Weight (kg) | 14,860 | |
| Recharge Efficiency | 0.978 | |
| Round Trip Efficiency | 0.971 | |
| Motor Efficiency | 0.916 | |
| Discharge Efficiency | 0.992 | |
| Base-model Specification | Drag Coefficient | 0.6 |
| Rolling Resistance | 0.01 | |
| Air Density (kg/m3) | 1.27 | |
| Ambient Temperature (o) | 20 | |
| HVAC (kW) | 0 | |
| Auxiliary Power (kW)* | 0 | |
| Parameter—Unit | Parameter | Levels | Min. | Max. | Mean | Standard Deviation |
|---|---|---|---|---|---|---|
| Initial state of charge (SoCi)—% | Vehicular and External | 4 | 40 | 100 | 70.00 | 22.36 |
| Mass (m)—Kg | 5 | 14,932 | 20,557 | 17,482 | 1975.792 | |
| HVAC—kW | 6 | 1.25 | 13.75 | 6.24 | 4.66 | |
| Rolling resistance (Cr)—Unitless | 3 | 0.006 | 0.02 | 0.0120 | 0.0059 | |
| Road grade (GR)—% | Operational and Topological | 7 | −6 | +6 | 0.00 | 4.00 |
| Average speed (Va)—Km/h | 120 | 19.99 | 49.95 | 31.96 | 6.81 | |
| Maximum speed (Vm)—Km/h | 120 | 31.60 | 72.91 | 51.67 | 13.66 | |
| Acceleration rates (a)—m/s2 | 6 | 0.5 | 2.5 | 1.38 | 0.70 | |
| Deceleration rates (d)—m/s2 | 6 | 1 | 4 | 2.33 | 0.99 | |
| Spacing between stops (SS)—m | 4 | 300 | 600 | 450.00 | 111.80 | |
| Cycle Length (L)—m | 120 | 860.54 | 1817.000 | 1347.89 | 332.35 | |
| Total number of unique scenarios | 907,199 | |||||
| Parameter | Min | Max | Mean | Standard Error | St.D | Skewness | Skewness Std. Error | Kurtosis | Kurtosis Std. Error |
|---|---|---|---|---|---|---|---|---|---|
| EC—(kWh/km) | −2.490 | 6.119 | 1.654 | 0.002 | 1.609 | 0.055 | 0.003 | −0.890 | 0.005 |
| g—(%) | −6.000 | 6.000 | 0.000 | 0.042 | 4.000 | 0.000 | 0.003 | −1.250 | 0.005 |
| SoCi—(%) | 40.000 | 100.000 | 70.000 | 0.000235 | 22.361 | 0.000 | 0.003 | −1.360 | 0.005 |
| RC—(level) | 1.000 | 3.000 | 2.000 | 0.001 | 0.816 | 0.000 | 0.003 | −1.500 | 0.005 |
| PL—(passenger) | 0.000 | 75.000 | 34.000 | 0.028 | 26.344 | 0.293 | 0.003 | −1.190 | 0.005 |
| DAgg.—(level) | 1.000 | 3.000 | 2.000 | 0.001 | 0.816 | 0.000 | 0.003 | −1.500 | 0.005 |
| Va—(km/h) | 19.986 | 49.954 | 31.964 | 0.007 | 6.807 | 0.459 | 0.003 | −0.559 | 0.005 |
| SD—(Stop/km) | 1.651 | 3.486 | 2.377 | 0.0006 | 0.625 | 0.477 | 0.003 | −1.194 | 0.005 |
| HVAC—(kW) | 1.250 | 13.750 | 6.242 | 0.005 | 4.661 | 0.461 | 0.003 | −1.359 | 0.005 |
| L—(m) | 860.536 | 1817.000 | 1347.891 | 0.350 | 333.354 | 0.006 | 0.003 | −1.353 | 0.005 |
| EC | g | SoCi | RC | PL | DAgg. | Va | SD | HVAC | L | |
|---|---|---|---|---|---|---|---|---|---|---|
| EC | 1.000 | |||||||||
| GR | 0.945 ** | 1.000 | ||||||||
| SoCi | 0.172 ** | 0.000 | 1.000 | |||||||
| RC | 0.132 ** | 0.000 | 0.000 | 1.000 | ||||||
| PL | 0.078 ** | 0.000 | 0.000 | 0.000 | 1.000 | |||||
| DAgg. | 0.049 ** | 0.000 | 0.000 | 0.000 | 0.000 | 1.000 | ||||
| Va | 0.027 ** | 0.000 | 0.000 | 0.000 | 0.000 | 0.491 ** | 1.000 | |||
| SD | 0.039 ** | 0.000 | 0.000 | 0.000 | 0.000 | 0.025 ** | −0.388 * | 1.000 | ||
| HVAC | 0.105 ** | 0.000 | 0.000 | 0.000 | 0.000 | 0.000 | 0.000 | 0.000 | 1.000 | |
| L | −0.037 ** | 0.000 | 0.000 | 0.000 | 0.000 | −0.023 ** | 0.389 ** | −0.979 ** | 0.000 | 1.000 |
| Parameters | Unstandardized Coefficients | Standardized Coefficients | t-Test | Sig. | Collinearity Statistics | Adjusted R Square | RMSE | ||
|---|---|---|---|---|---|---|---|---|---|
| B | Std. Error | Beta | Tolerance | VIF | |||||
| (Constant) | −0.782 | 0.003 | - | −259.778 | 0.000 | - | - | 0.961 | 0.3167 |
| GR | 0.380 | 0.008 | 0.945 | 4572.399 | 0.000 | 1.000 | 1.000 | ||
| SoCi | 0.0124 | 0.001 | 0.172 | 834.537 | 0.000 | 1.000 | 1.000 | ||
| RC | 0.260 | 0.000 | 0.132 | 638.564 | 0.000 | 1.000 | 1.000 | ||
| HVAC | 0.036 | 0.000 | 0.105 | 506.847 | 0.000 | 1.000 | 1.000 | ||
| PL | 0.005 | 0.000 | 0.078 | 379.674 | 0.000 | 1.000 | 1.000 | ||
| DAgg. | 0.065 | 0.000 | 0.033 | 133.459 | 0.000 | 0.704 | 1.420 | ||
| SD | 0.128 | 0.001 | 0.050 | 213.328 | 0.000 | 0.788 | 1.269 | ||
| Va | 0.007 | 0.000 | 0.030 | 111.380 | 0.000 | 0.599 | 1.670 | ||
| Parameter | Unit | Coefficient | Scenario I | Scenario II | Scenario III | Scenario IV | Scenario V |
|---|---|---|---|---|---|---|---|
| Road Grade | % | 0.380 | 0 | 0 | 0 | 0 | 0 |
| Initial State of Charge | % | 0.012 | 40 | 50 | 50 | 75 | 100 |
| Road Condition | Level | 0.260 | 3 | 3 | 3 | 3 | 3 |
| HVAC (Temperature) | kWh (°C) | 0.036 | 1.25 (20 °C) | 6.70 (−10 °C) | 6.70 (−10 °C) | 13.75 (−20 °C) | 13.75 (−20 °C) |
| Passenger loading | Passenger | 0.005 | 25 | 25 | 50 | 75 | 75 |
| Driver Aggressiveness | Level | 0.065 | 1 | 1 | 2 | 2 | 3 |
| Stop Density | Stops/km | 0.128 | 2 | 2.5 | 3 | 3 | 4 |
| Average Speed | Km/h | 0.007 | 20 | 20 | 30 | 30 | 40 |
| Energy Consumption | kWh/km | Dependent | 1.109 | 1.489 | 1.813 | 2.492 | 3.055 |
| Difference (relative to Scenario I) % | NA | 134.28% | 163.50% | 224.71% | 275.47% | ||
Publisher’s Note: MDPI stays neutral with regard to jurisdictional claims in published maps and institutional affiliations. |
© 2021 by the authors. Licensee MDPI, Basel, Switzerland. This article is an open access article distributed under the terms and conditions of the Creative Commons Attribution (CC BY) license (https://creativecommons.org/licenses/by/4.0/).
Share and Cite
Abdelaty, H.; Mohamed, M. A Prediction Model for Battery Electric Bus Energy Consumption in Transit. Energies 2021, 14, 2824. https://doi.org/10.3390/en14102824
Abdelaty H, Mohamed M. A Prediction Model for Battery Electric Bus Energy Consumption in Transit. Energies. 2021; 14(10):2824. https://doi.org/10.3390/en14102824
Chicago/Turabian StyleAbdelaty, Hatem, and Moataz Mohamed. 2021. "A Prediction Model for Battery Electric Bus Energy Consumption in Transit" Energies 14, no. 10: 2824. https://doi.org/10.3390/en14102824
APA StyleAbdelaty, H., & Mohamed, M. (2021). A Prediction Model for Battery Electric Bus Energy Consumption in Transit. Energies, 14(10), 2824. https://doi.org/10.3390/en14102824


