1. Introduction
Indoor positioning systems (IPS) are used for locating people or objects in an indoor environment. In recent years, more interest has grown in IPS technologies as they enable a number of location-based indoor tracking solutions, including applications such as behavior recognition, asset tracking, healthcare, and smart building. With the increasing popularization of smartphones, the number of smartphone users has increased considerably. Over the recent years, location-based services such as geographic information, street view and satellite map have been developed for smartphone users by using the global positioning system (GPS) [
1], which works well in outdoor positioning. However, the performance is not good for indoor positioning as the indoor terminal cannot get the signal from satellites directly. Various other techniques are introduced to resolve the problem associated with the indoor environment. Radio-frequency identification (RFID) [
2] is one of the most commonly used methods for indoor positioning. However, the localization accuracy largely depends on the density of reference tags. The increased density with increased number of reference tags may generate RF interferences. The Wi-Fi based localization technique is another prominent tool for indoor positioning. Wi-Fi-based indoor positioning [
3] have been more widely used in buildings than other local methods like RFID. Multiple methods can be employed to track indoor Wi-Fi-enabled terminals. Received signal strength indicator (RSSI) and time of flight (ToF) are two primary methods in use. However, wireless signal-strength based approaches suffer from location errors, whereas time-of-flight (ToF) based solutions provide good accuracy but are not scalable. Similarly, Bluetooth [
4], and Beacon [
5,
6,
7,
8] based methods are also widely used for recognizing positions in indoor environments.
In recent days, vision-based positioning method is gaining popularity because it provides reliable and low-cost services using a camera without extra pre-deployed hardware. The vision based IPS tracks objects by matching the current images with stored frames or pre-constructed models for relative or global pose estimation are commonly used for indoor positioning systems.
In this study, we aim to track the position of a user using the vision-based system in indoor environment. We use the smart phone camera to acquire the image data and QR codes to store the location information. We measure the position of the user by determining the current position of a smartphone device accurately based on the QR code recognized with a smartphone camera. The smartphone camera captures the images of the QR codes attached on the wall in different locations in the room. Each one of this QR codes has unique identifier and coded to contain the indoor reference location information. Next, the two-dimensional location of QR codes is converted to three-dimensional coordinates using the camera calibration algorithm. The position information is acquired in real time using the focal length and angle of the camera, which were obtained by converting the aforementioned information. Similarly, the direction of the user is estimated based on the lengths of the left and right side vertices within the QR code.
The remainder of this paper is organized as follows.
Section 2 consists of related works, followed by the overall descriptions of the proposed algorithm and the camera calibration mechanism in
Section 3. In
Section 4 and
Section 5, the detailed description of the proposed algorithm and the experimental results are provided, respectively.
Section 6 concludes this study.
2. Related Works
Numerous vision-based algorithms have been proposed for track the objects in indoor environment. Fundamentally, they are classified into three categories, matching based [
9], marker based [
10], barcode based and infrared based. As a method of image matching, for instance, fingerprinting [
11,
12] creates the database of images captured form various indoor spaces and angles. Next the images capture from the user’s position is matched with images in the database to determine the actual position. Image matching techniques such as SURF and SIFT are commonly used to query images. An extended period of time of infrared is required for determining the positions; thus, this method has low efficiency and convenience. Second, a marker-based position recognition method can obtain different types of information according to the marker shape and minimize the errors in positioning through geometric computations. Markers have the advantages of being able to obtain two-dimensional information or a high recognition rate. Marker based IPS for mobile robot was proposed by Li et al. [
13]. The robots capture and process markers attached to the ceiling while moving from one place to next. In this method, the location information and direction information are obtained based on the markers. Subsequently, a marker map was constructed based on location and direction information. However, an insufficient amount of information may be obtained from markers. There is a high probability of occurrence of errors when objects having an identical shape are input, as markers generally have a simple geometric shape. Third, a barcode-based method can contain a greater amount of information and has a higher recognition rate compared with the marker-based method [
14]. However, this method is inappropriate for geometrical transformations, such as a rotation or tilt, and requires a specific program or hardware device for generating and recognizing barcodes.
Fourth, an infrared-based position recognition method involves installing several infrared sensors in various places within a relevant indoor space, and users possess an infrared generator [
15]. Their position is tracked by detecting the signals generated by the infrared generator. One of the first indoor localization systems, active badge [
16], used IR signals. This system was intended for personnel tracking using a set of tags each emitting IR signal with a unique code every 15 s. Signals are picked up by badge sensors installed at various rooms inside the building providing room-level accuracy. Badge sensors were powered and connected to a network using a special four wire system using telephone twisted-pairs cable and RS232 data-transfer format.
Additionally, QR codes have been increasingly used in recent years [
17,
18] for indoor positioning. QR codes can contain a considerable amount of information, and they have a high recognition rate, recognition speed, and restorability compared with barcodes. Li and Huang [
17] used high-definition RGB camera and the depth sensor of the Kinect to detect the QR-code based landmarks for IPS. The RGB camera of the Kinect sensor was used to capture the images of the QR codes attached on the wall in different locations in the room. The distance between the Kinect sensor and the QR code was measured using the depth sensor of the Kinect. Based on the measured distance and location information of QR code the exact position of user was estimated.
3. Proposed Algorithm
The vision-based indoor positioning technology is proposed to improve the performance of existing wireless communication methods, such as GPS and beacon, comprehensively [
19,
20]. In indoor environments, the methods involving communication or sensors within a smartphone device entail a high probability of occurrence of errors depending on the surrounding environment. Accordingly, to reduce errors and improve accuracy, QR codes that can carry a large amount of information are used, and the camera calibration algorithm is used to obtain the position information. The proposed algorithm consists of three steps as shown in
Figure 1.
Step 1
A QR code of size 50 × 50 to be input is created and captured with a smartphone camera in real time. Once the QR code is recognized within an image, the indoor information is verified when the recognized QR code is created, and the basic information of the current space is obtained.
Step 2
All the planar data of the QR code recognized in Step 1 are computed using the algorithm for obtaining the current position information of a smartphone user.
The reference symbols are created at the four corners of the QR codes. The center points of the four quadrangle symbols are connected to create a new quadrangle. The center of gravity is extracted using the area of the newly created quadrangle. If the obtained center point is defined as two-dimensional planar coordinates, the coordinates of a point in a three-dimensional space are computed inversely to create the coordinate information of the current position.
Based on the lengths of the top, bottom, left, and right sides of the quadrangle created when the QR code is captured from a distance of 1 m, the information of the current direction can be obtained according to the changes in the length.
Step 3
The position is detected with a high accuracy based on the coordinates of the center of gravity from the obtained QR code and the area, side length, and fixed height of the quadrangle created using the reference symbols of the QR code.
3.1. Camera Calibration
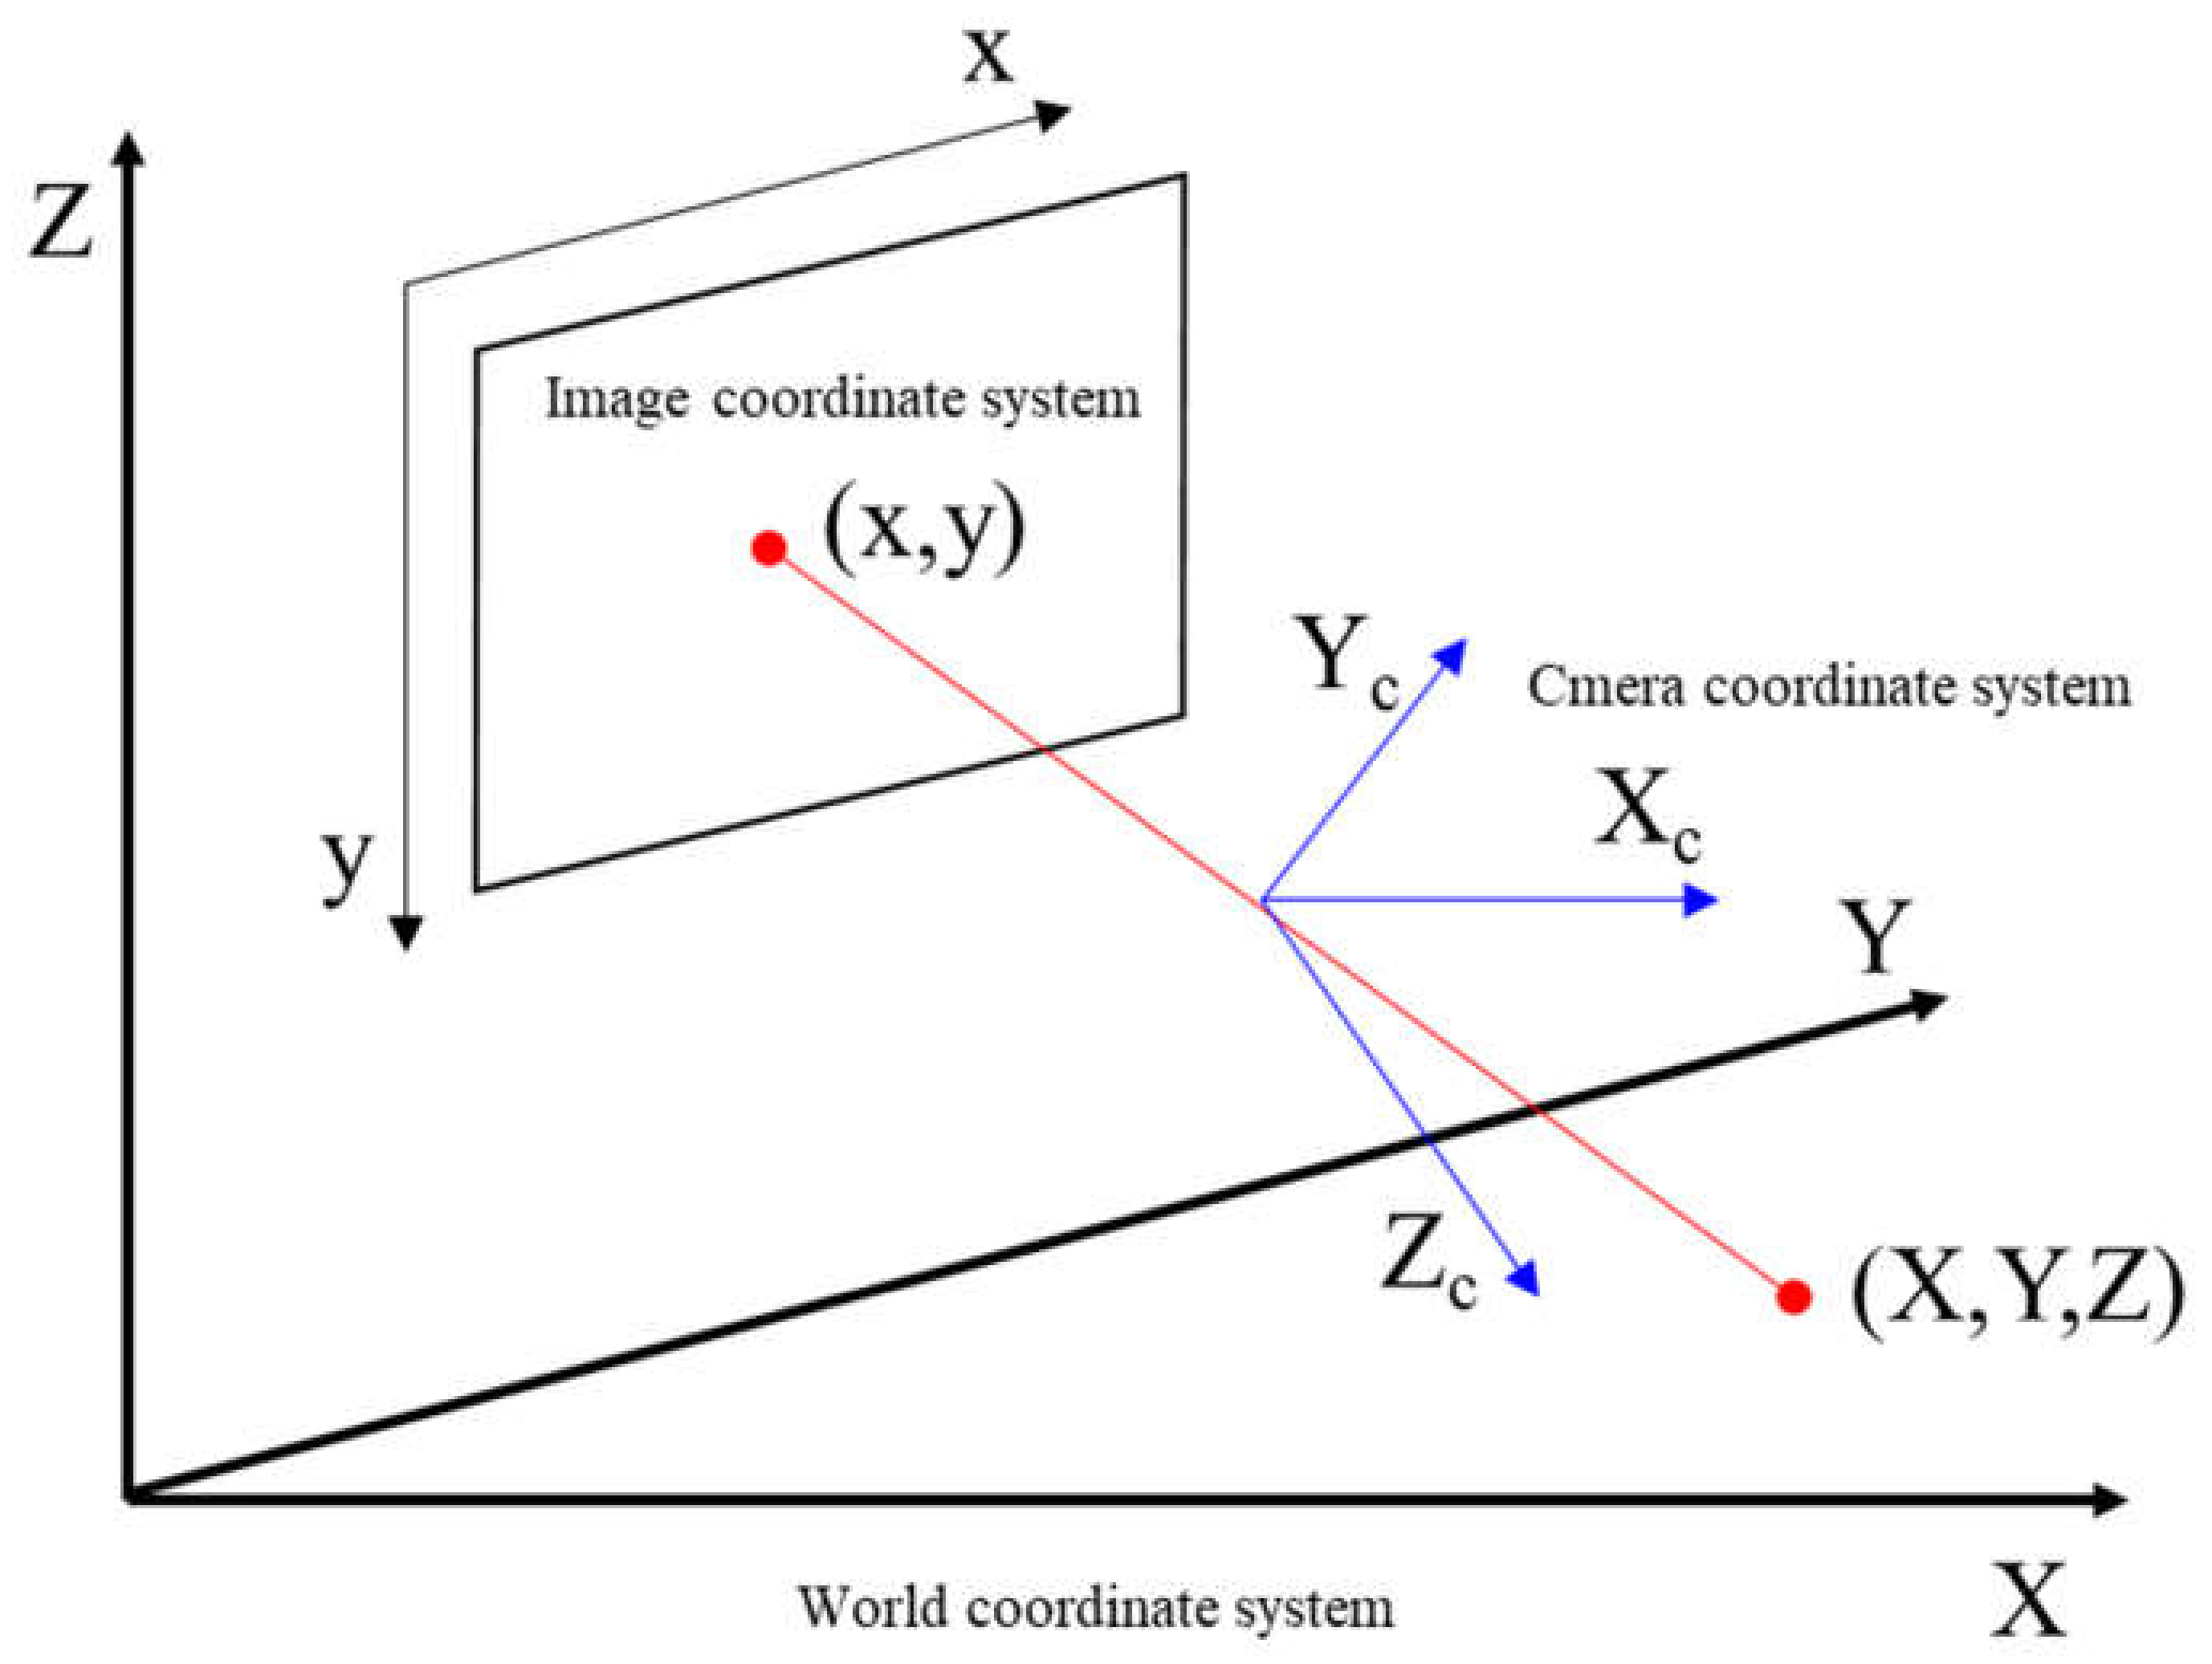
Camera calibration is the process of extracting the position on a two-dimensional plane onto which three-dimensional coordinates are projected, or inversely, extracting the parameters for restoring the three-dimensional spatial coordinates using the two-dimensional planar coordinates.
Figure 2 shows the process of converting three-dimensional spatial coordinates to two-dimensional planar coordinates.
The coordinate values of the QR code, which is a two-dimensional image, are used to obtain three-dimensional coordinates, which are recognized by a smartphone camera. The intrinsic and extrinsic parameters of a camera are extracted to restore the three-dimensional spatial coordinates. The intrinsic parameters have an inherent relationship, such as the focal length or center point of a camera, whereas the extrinsic parameters have a geometrical relationship with external spaces, such as the current height or direction of a camera. Equation (1) shows the relationship between the three-dimensional coordinates and the two-dimensional coordinates.
In this equation,
is the coordinate of a point on a two-dimensional plane,
is the intrinsic parameter of the camera,
is the extrinsic parameter between the camera and an external space, and
is the coordinate of a point in a three-dimensional space. Here,
consists of a
rotation matrix and
translation vector.
is formed as the distance between the center of the camera lens and a point in a three-dimensional space, optical center, and the direction of distortion. Accordingly, Equation (2) can be obtained.
In the equation,
is the focal length of the camera,
are the coordinates of a point in a three-dimensional space of the camera,
are the changes in the size of the coordinates in the camera and image, and
is the optical center.
Figure 3 shows the focal length, which is the distance from the camera lens to an image sensor.
The relationship between the two-dimensional planar coordinates of a point that can be obtained from Equation (2) and the three-dimensional spatial coordinates of the point can be defined as in Equation (3).
The distance between the center point of the input QR code and the center point of the camera lens can be measured using Equation (3). When converting the coordinates of a point on a two-dimensional plane to the coordinates of the point in the three-dimensional space of the camera, are divided by and then multiplied with, which is the focal length of the camera.
3.2. Detecting Camera Direction
The angle between the user and the QR code can be obtained by finding the rotation and tilt of the direction of the QR code recognized by a smartphone camera. Assuming that a point
in a three-dimensional space has the coordinates
, the coordinates of the center of the camera lens are
, the rotation matrix is
, and the translation vector is
, Equation (4) can be obtained.
A quadrangle is formed by connecting the center points of the reference symbols obtained when the QR code is recognized for acquiring the direction information as shown in
Figure 4. The lengths of the top, bottom, left, and right sides of the newly created quadrangle are measured.
The area of the quadrangle is calculated using the measured lengths as follows:
The area of the quadrangle is measured using
, which connects the corner points
a and
c, and
, which connects
b and
d. Then, the center of gravity of the quadrangle is calculated. With respect to the diagonal segments
and
, four triangles
,
,
, and
are created. The center of gravity of each triangle is calculated using Equation (6).
If the calculated centers of gravity of the four triangles are respectively defined as , , , and , the intersection of the segment connecting and , and the segment connecting and becomes the center of gravity of the quadrangle.
5. Experiment Result
Through the experiment proposed in this study, the distance between the QR code and the smartphone camera was measured from the front, left, and right, and the user’s current position and direction could be presumed. The minimum measurement distance in the experiment was 1 m because the size of the QR code is 50 × 50, and the camera could not capture the QR code entirely from less than 1 m away; thus, the minimum distance was set to 1 m.
Figure 6 shows the values of the distance measured from the front.
In
Figure 6a, the green bar in the graph represents the actual distance measured, whereas the blue bar represents the average distance measured 10 times repeatedly at the interval of 25 cm only when the angle is perfectly toward the front. Using the application designed with the proposed algorithm, the QR code is recognized, and a quadrangle is created by connecting the four center coordinates of the four reference symbols. Four triangles are created from the two diagonal segments of the quadrangle. Then, their centers of gravity are obtained to calculate the center of gravity of the quadrangle. By matching the coordinates of the center of gravity and those of the camera’s center point, the user is determined to be at the front when the distance between the two coordinates is (0, 0). In
Figure 6b, the average margin of error is less than 0.02, which is very small until the difference in the distance between the actual QR code and the user and the distance measured with the application program designed with the proposed algorithm is 1–8 m. Beyond 8 m, a significant error of 0.08–04 occurs because of the complexity of the QR code recognized by the smartphone camera and a lowered recognition rate due to the increased distance. The user position can be estimated with an error range between 0 cm and 4 cm with a high accuracy.
Figure 7 shows the values of the distance measured from the left (10°).
The graph in
Figure 7a shows the distance measured from 10° to the left with respect to the QR code and the actual distance. The average of the distance measured 10 times repeatedly from 10° to the left at the interval of 25 cm was taken. The shape of a quadrangle created when the QR code is recognized changes as the angle changes. The current direction of the user can be detected based on the center of gravity of the changed quadrangle and the length of the sides obtained from the reference images taken at 1 m from the front. The shape of the QR code recognized by the camera transformed from a square to a trapezoid. The left-side segment became longer than the right-side segment as the shape changed to a trapezoid; thus, the user is determined to be on the left-hand side with respect to the QR code. The graph in
Figure 7b shows that the average error value increases by 0.03 when the distance is measured from the left (10°) compared with when measured from the front. The error value increases in a similar manner for each interval overall, as the recognition rate of a small alignment pattern in the bottom-right corner among the four reference symbols of the QR code is low as the camera moves toward the left. Therefore, the current position of the user can be estimated with the error range between 0 and 8 cm, whereas the overall average error value is 0.07.
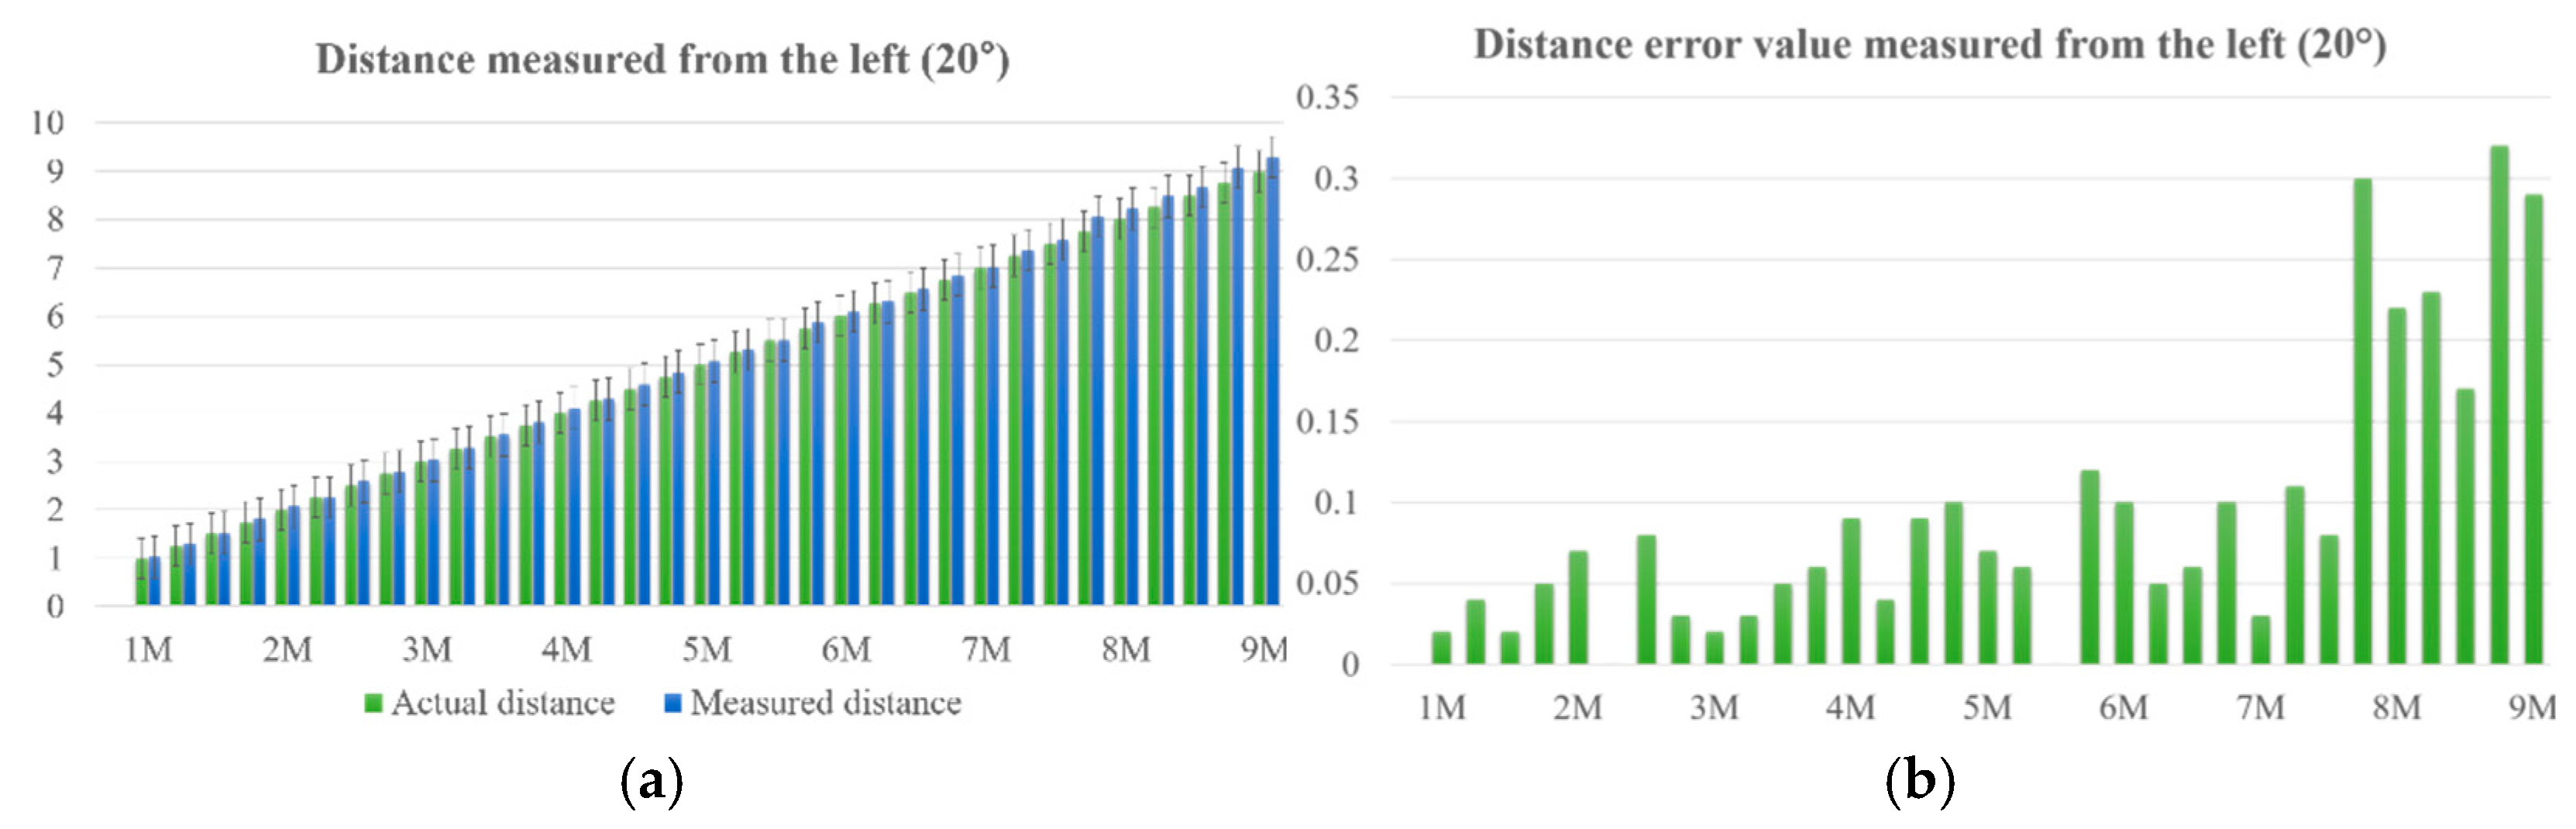
Figure 8 shows the values of the distance measured from the left (20°).
The graph in
Figure 8a shows the distance measured from 20° to the left with respect to the QR code and the actual distance. The average of the distance measured repeatedly for 10 times from 20° to the left at the interval of 25 cm was taken. As the measurement angle is greater than the previous experiment condition, which was 10° to the left, the direction of the user can be detected more accurately as the shape of the QR code changes greatly. In
Figure 8b, the distance measured from the left (20°) decreases as the angle of a small alignment pattern in the bottom-right corner among the reference symbols of the QR code increases. This results in a higher average error due to a low recognition rate. Therefore, the current position of the user can be estimated with the error range between 0 cm and 32 cm, whereas the overall average error value is 0.09. A higher error is observed in specific sections compared with the average error value, most likely due to the recognition error of the alignment pattern mentioned above.
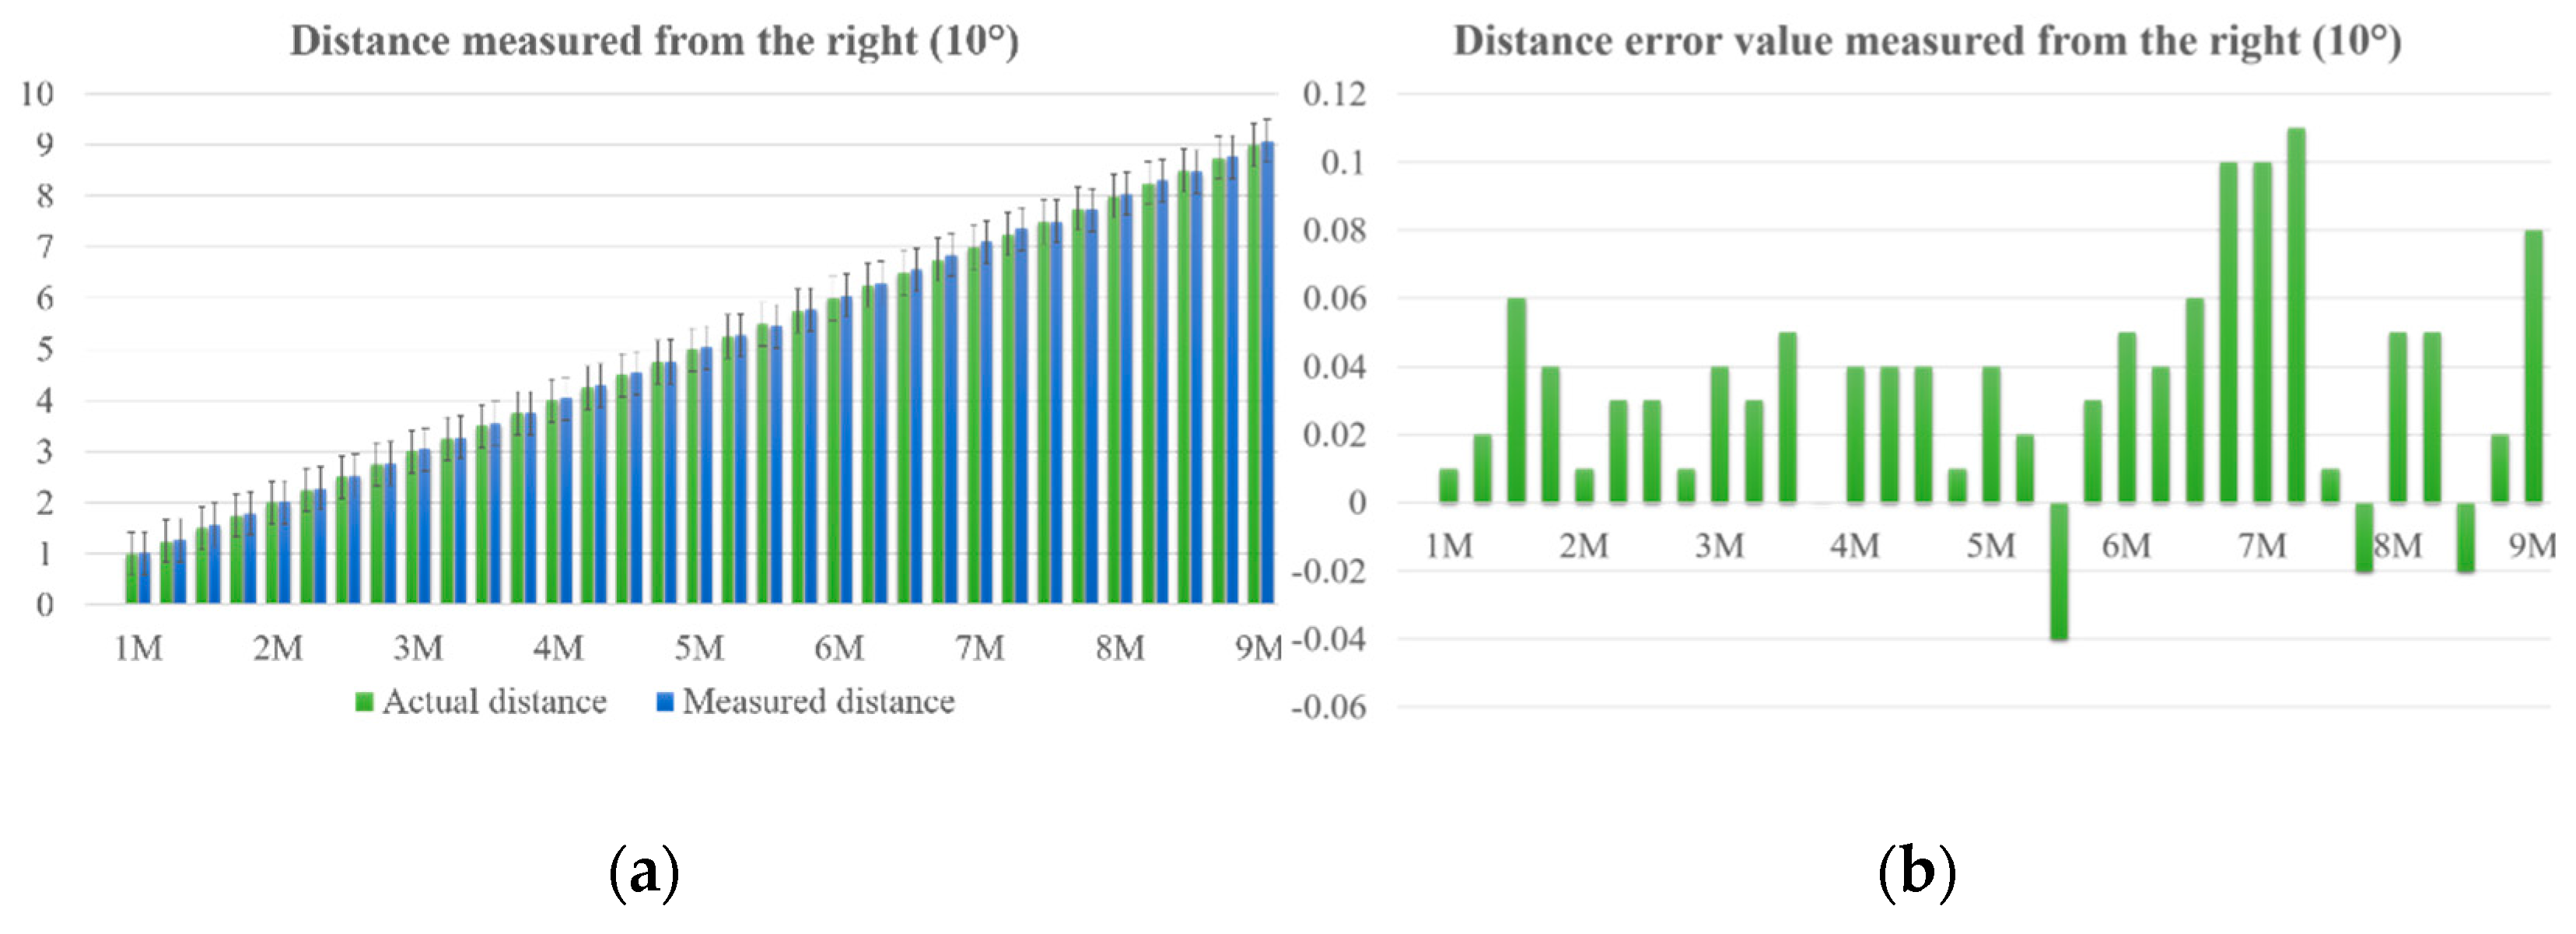
Figure 9 shows the values of the distance measured from the right (10°).
The graph in
Figure 9a shows the distance measured from 10° to the right with respect to the QR code and the actual distance. The average of the distance measured 10 times repeatedly from 10° to the right at the interval of 25 cm was taken. The distance measured from the right shows more accurate results than the distance measured from the left at the same angle. It can be inferred that the recognition error of an alignment pattern that occurred in the left-hand side did not occur as frequently in the right-hand side. In
Figure 9b, the distance measured from the right (10°) is almost identical to the distance measured from the front and has a higher accuracy than the distance measured from the left (10°). No significant difference from the actual distance is observed, and only a small error is observed. Therefore, the current position of the user can be estimated with the error range between 0 cm and 8 cm, whereas the overall average error value is 0.05.
Figure 10 shows the values of the distance measured from the right (20°).
The graph in
Figure 10a shows the distance measured from 20° to the right with respect to the QR code and the actual distance. The average of the distance measured 10 times repeatedly from 20° to the right at the interval of 25 cm was taken. Unlike the left side, a recognition error of a small alignment pattern did not occur when the camera was moved 20° to the right, thus exhibiting a similar level of accuracy as when the camera was moved 10° to the right. The graph in
Figure 10b shows that the distance measured from 20° to the right is almost identical to the distance measured from 10° to the right, with a high accuracy and a very small error. Therefore, the current position of the user can be estimated with the error range between 0 cm and 11 cm, whereas the overall average error value is 0.06.
Table 1 presents the average error between the measurement distance and the actual distance.
The overall average error between the measurement distance and the actual distance is listed in
Table 1. From the front, the margin of error was small up to the distance at which the QR code was recognized accurately and then increased with the distance due to a low recognition rate caused by the complexity of the QR code and the hardware issues of a smartphone. On the left side, the recognition rate was low due to the problem of failing to recognize a small alignment pattern in the bottom-right corner among the four reference symbols of the QR code when finding the center of gravity used in the proposed algorithm. On the right side, the recognition rate was almost identical to the recognition rate from the front, and a high accuracy was observed except for the lowered recognition rate when the shape of the recognized QR code changed from a square to a trapezoid. A constant value was computed as the position of the smartphone was fixed in this experiment. A high accuracy and performance were obtained as the experimental errors could easily occur at the actual position of a smartphone held by users.
To measure complex positioning performance, performance was evaluated using beacon and PDR positioning data.
Table 2 shows the results of measuring distances using only beacon and PDR positioning data.
Our study is backward compatible with IPS using hybrid localization technology proposed in [
8]. Based on this technology we measured distance combined with the positioning data of the beacon and PDR as shown in the
Table 2. One set measured the distance from 1 to 9 m in each of the front and left 10°, left 20°, right 10° and right 20° directions. There are a total of 5 sets was performed. If the measured position value exceeds 1 m, the error rate increases rapidly. Accordingly, the average error increases as the distance increases. The average error of the total measurement distance is 1.24 m, which is a high value. These beacons and PDR positioning data are combined with positioning data using a QR code. The experimental results are shown in
Table 3.
Table 3 shows the average error of the measurement distance combined with vision positioning, beacon, and PDR. One set measured the distance from 1 to 9 m in each of the front and left 10°, left 20°, right 10° and right 20° directions. There are a total of 5 sets was performed. Measurements from set 1 to set 3 resulted in a very small amount of error. In the 4th set, the measurement error of the beacon increased due to noise generated in the surrounding environment. The total average error of the measurement distance is 1 m, showing a very slight error.
6. Conclusions
This paper has proposed a vision-based indoor positioning technology using a smartphone camera and QR code. The proposed algorithm analyzes the current position of a user based on camera calibration, and the center of gravity and the lengths of the sides of a quadrangle obtained using a QR code recognized by the smartphone camera. Through camera calibration, the coordinates of a three-dimensional space of the smartphone camera are inversely computed using the coordinates of a two-dimensional plane of the QR code. A quadrangle is created by connecting the center points of the four reference symbols of the QR code, and the direction is obtained using the area and side lengths of the created quadrangle. Moreover, the quadrangle is divided into four triangles to compute their centers of gravity, which are in turn used to calculate the center of gravity of the quadrangle. Accordingly, the distance between the smartphone and the QR code was measured within a range of 1–9 m. The measured position values had a high accuracy and efficiency.
In future studies, measures to replace the alignment pattern of reference symbols or reduce the complexity of QR codes will be examined to improve the problem of low recognition rate. Furthermore, studies will be conducted on combining wireless communication technology, such as beacon or PDR, and sensor- or vision-based positioning technology using QR codes for developing a complex positioning technology.


