Core Temperature Estimation for a Lithium ion 18650 Cell


Abstract
1. Introduction
2. Literature Review
3. Thermal Model
4. Experimental Setup
5. Results and Analysis
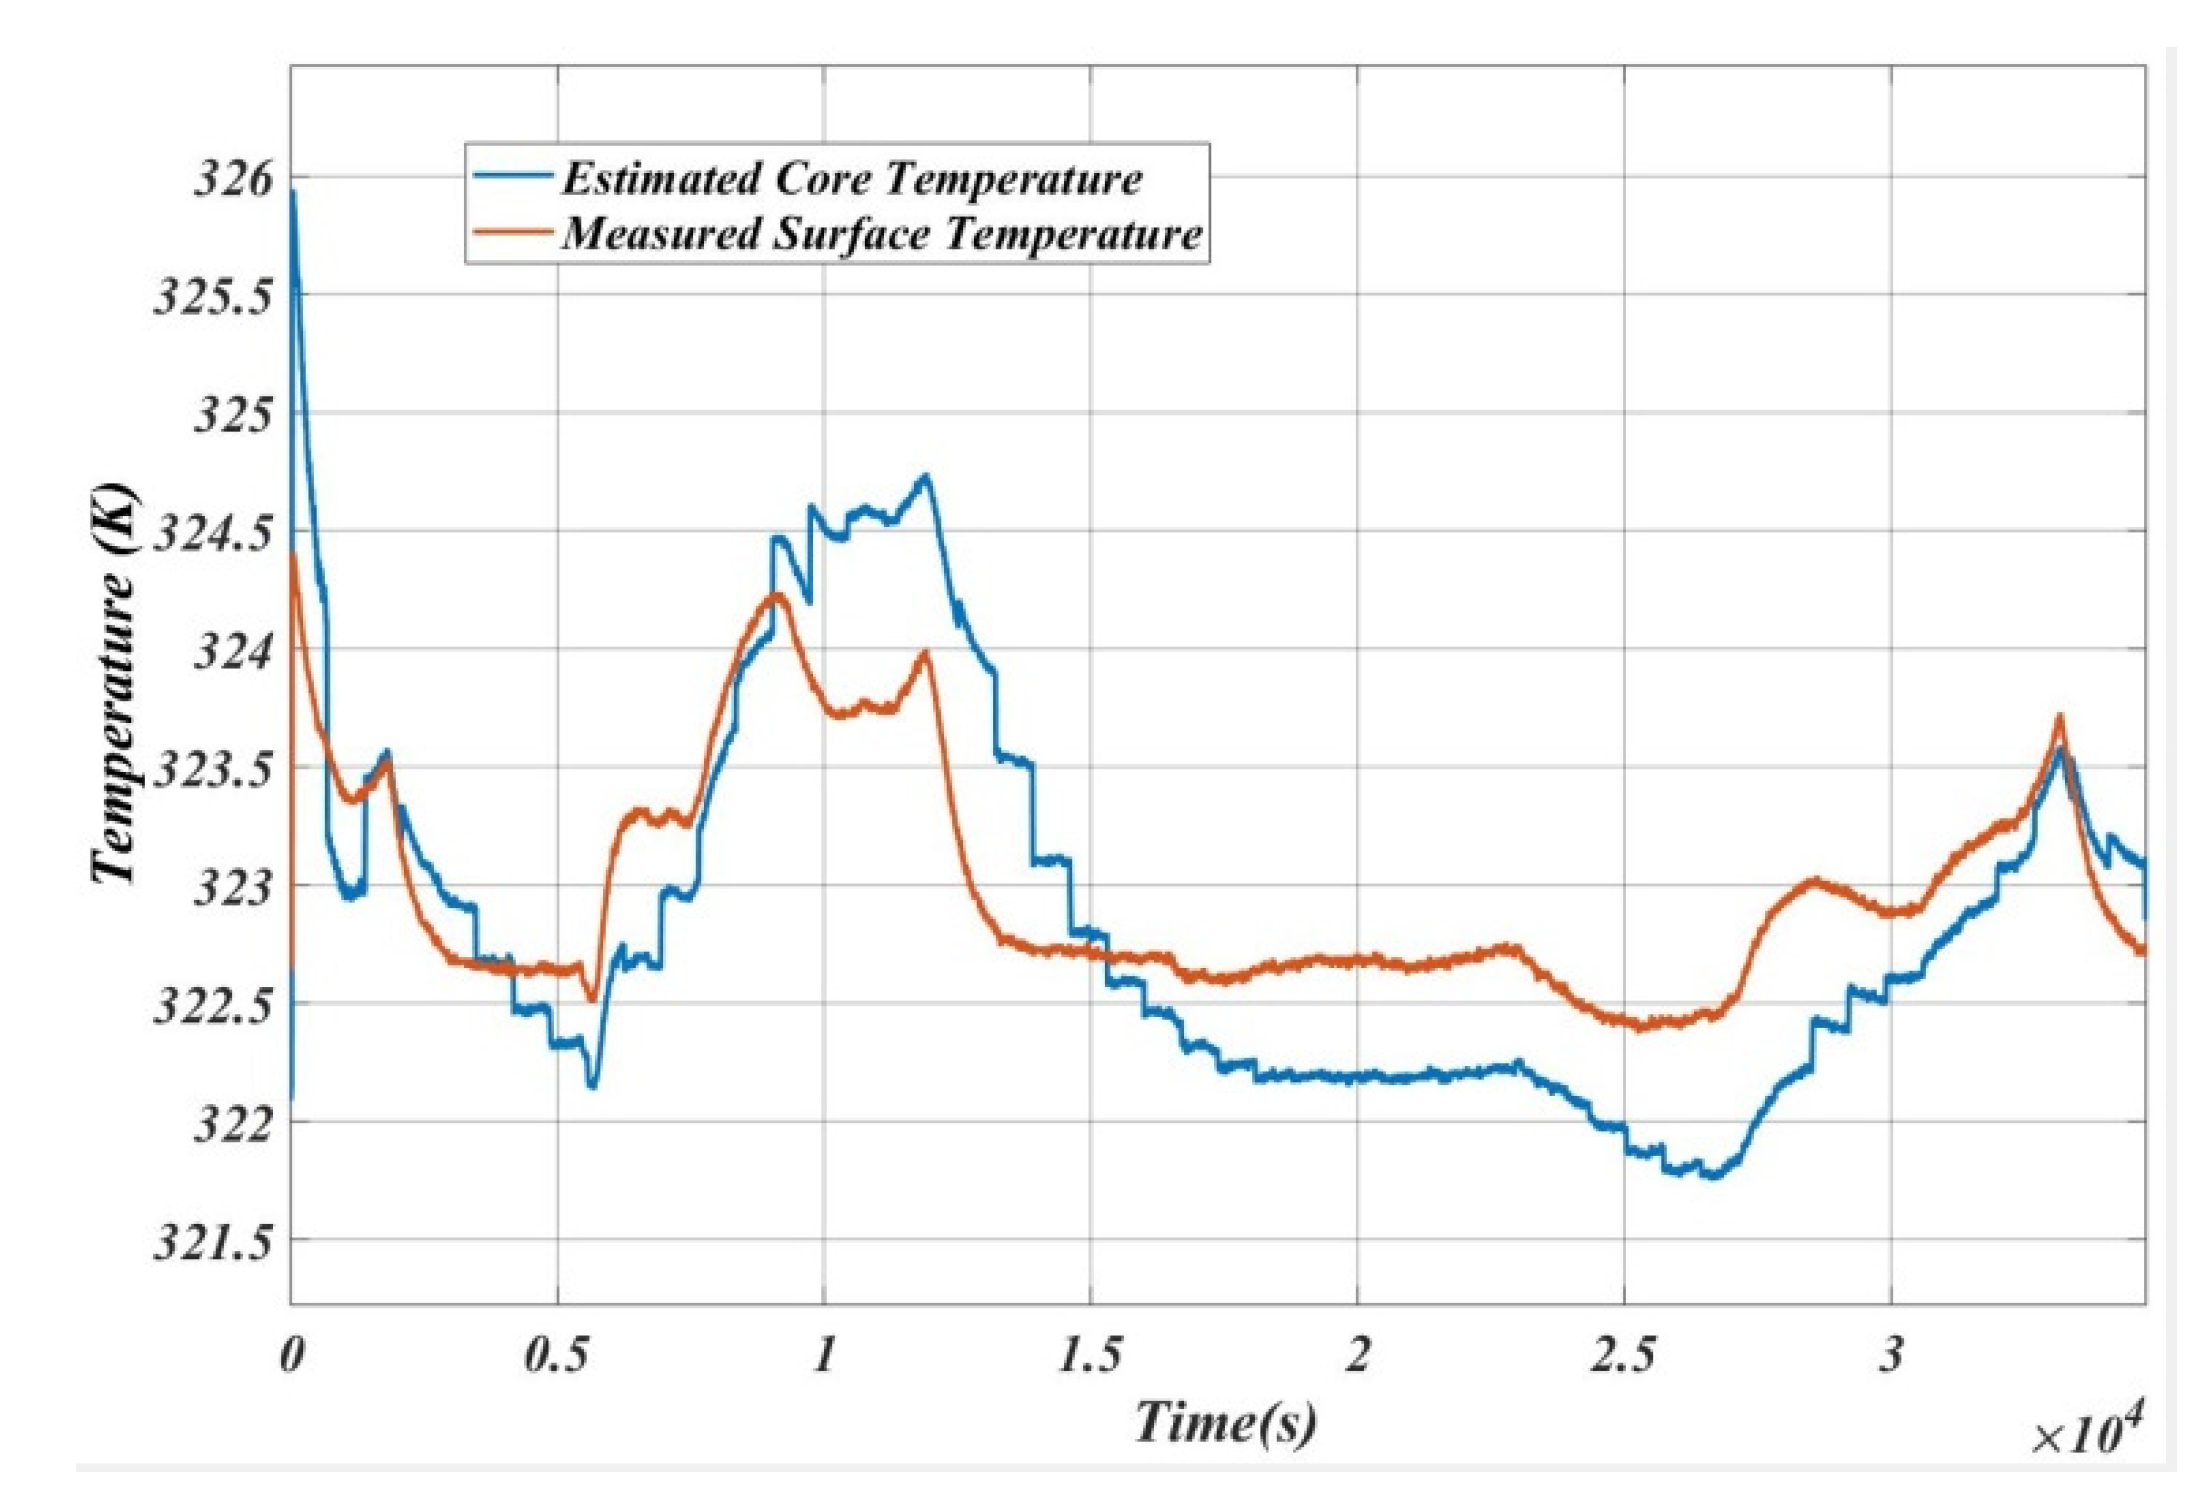
5.1. Case 1
5.2. Case 2
5.3. Case 3
5.4. Case 4
6. Inverse Calculation for the Verification of the Algorithm
7. Conclusions
Author Contributions
Funding
Conflicts of Interest
Nomenclature
| SL.No | Abbreviation | Meaning |
| 1 | Tamb | Ambient temperature |
| 2 | Ts | Surface temperature |
| 3 | Tc | Core temperature |
| 4 | Rc | Convective resistance between core and surface temperatures |
| 5 | Ru | Convective resistance between surface and ambient temperatures |
| 6 | Cc | Heat capacity of the core of the battery |
| 7 | Cs | Heat capacity of the surface of the battery |
| 8 | Q | Quantity of heat |
| 9 | I | Current |
References
- Plett, G.L. Battery Management Systems, Volume I: Battery Modeling; Artech House: Norwood, MA, USA, 2015. [Google Scholar]
- Dai, H.; Zhu, L.; Zhu, J.; Wei, X.; Sun, Z. Adaptive Kalman filtering based internal temperature estimation with an equivalent electrical network thermal model for hard-cased batteries. J. Power Sources 2015, 293, 351–365. [Google Scholar] [CrossRef]
- Baghdadi, I.; Briat, O.; Eddahech, A.; Vinassa, J.M.; Gyan, P. Electro-thermal model of lithium-ion batteries for electrified vehicles applications. In Proceedings of the 2015 IEEE 24th International Symposium on Industrial Electronics (ISIE), Rio de Janeiro, Brazil, 3–5 June 2015. [Google Scholar]
- Machado, H.; Cicero, L.; Tanougast, C.; Ramenah, H.; Sieler, L.; Jean, P.; Milhas, P.; Dandache, A. VHDL-AMS electro-thermal modeling of a lithium-ion battery. In Proceedings of the 2013 25th International Conference on Microelectronics (ICM), Beirut, Lebanon, 15–18 December 2013. [Google Scholar]
- Lin, X.; Perez, H.E.; Siegel, J.B.; Stefanopoulou, A.G.; Li, Y.; Anderson, R.D.; Ding, Y.; Castanier, M.P. Online parameterization of lumped thermal dynamics in cylindrical lithium ion batteries for core temperature estimation and health monitoring. IEEE Trans. Control Syst. Technol. 2012, 21, 1745–1755. [Google Scholar]
- Surya, S.; Bhesaniya, A.; Gogate, A.; Ankur, R.; Patil, V. Development of thermal model for estimation of core temperature of batteries. Int. J. Emerg. Electr. Power Syst. 2020. [Google Scholar] [CrossRef]
- Patnaik, L.; Williamson, S. A Five-Parameter Analytical Curvefit Model for Open-Circuit Voltage Variation with State-of-Charge of a Rechargeable Battery. In Proceedings of the 2018 IEEE International Conference on Power Electronics, Drives and Energy Systems (PEDES), Madras, India, 18–21 December 2018. [Google Scholar]
- Sumukh, S.; Janamejaya, C.; Abhay, S.J.; Shantanu, D.D.; Ashita, V. Accurate Battery Modeling Based on Pulse Charging using MATLAB/Simulink. In Proceedings of the Power Electronics Drives and Energy System (PEDES), Jaipur, India, 16–19 December 2020. [Google Scholar]
- Mochnac, J.; Marchevsky, S.; Kocan, P. Bayesian filtering techniques: Kalman and extended Kalman filter basics. In Proceedings of the 19th International Conference Radioelektronika, Bratislava, Slovakia, 22–23 April 2009. [Google Scholar]
- Brown, R.G.; Hwang, P.Y. Introduction to Random Signals and Applied Kalman Filtering: With MATLAB Exercises; John Wiley & Sons: New York, NY, USA, 2012; Volume 4. [Google Scholar]
- Welch, G.; Gary, B. An Introduction to the Kalman Filter. Available online: http://www.ceri.memphis.edu/people/smalley/ESCI7355/welch%20and%20bishop%20-%20kalman.pdf (accessed on 25 December 2020).
- Plett, G.L. Battery Management Systems, Volume II: Equivalent-Circuit Methods; Artech House: Norwood, MA, USA, 2015. [Google Scholar]
- Tran, N.T.; Vilathgamuwa, M.; Farrell, T.; Li, Y.; Teague, J. A computationally-efficient electrochemical-thermal model for small-format cylindrical lithium ion batteries. In Proceedings of the 2018 IEEE 4th Southern Power Electronics Conference (SPEC), Singapore, 10–13 December 2018. [Google Scholar]
- Sangiri, J.B.; Ghosh, S.; Chakraborty, C. Electro-thermal modeling of Lithium-ion cell for higher discharge rate applications. In Proceedings of the 21st Century Energy Needs-Materials, Systems and Applications (ICTFCEN), Kharagpur, India, 17–19 November 2016. [Google Scholar]
- Hu, X.; Lin, S.; Stanton, S. A novel thermal model for HEV/EV battery modeling based on CFD calculation. In 2010 IEEE Energy Conversion Congress and Exposition; IEEE: New York, NY, USA, 2010. [Google Scholar]
- Surya, S.; Chennegowda, J.; Naraharisetti, K. Generalized Circuit Averaging Technique for Two Switch DC-DC Converters. In Proceedings of the 8th International Conference on Power Electronics Systems and Applications PESA, Hong Kong, China, 7–10 December 2020. [Google Scholar]
- Richardson, R.R.; Howey, D.A. Sensorless Battery Internal Temperature Estimation Using a Kalman Filter With Impedance Measurement. IEEE Trans. Sustain. Energy 2015, 6, 1190–1199. [Google Scholar] [CrossRef]
- Patnaik, L.; Praneeth, A.V.J.S.; Williamson, S.S. A Closed-Loop Constant-Temperature Constant-Voltage Charging Technique to Reduce Charge Time of Lithium-Ion Batteries. IEEE Trans. Ind. Electron. 2019, 66, 1059–1067. [Google Scholar] [CrossRef]
- Marcis, V.A.; Praneeth, A.V.J.S.; Patnaik, L.; Williamson, S.S. Analysis of CT-CV Charging Technique for Lithium-ion and NCM 18650 Cells. In 2020 IEEE International Conference on Power Electronics, Smart Grid and Renewable Energy (PESGRE2020); IEEE: New York, NY, USA, 2020. [Google Scholar]


| Specifications | Values |
|---|---|
| Manufacturer | LG Chem |
| Model | INR18650HG2 |
| Chemical System | LiNiMnCo02HNMC |
| Nominal Voltage | 3.6 V |
| Nominal Capacity | 3000 mAh |
| Standard Charging (CC-CV) | 1.5 A, 4.2 V max, Cut Off: 50 mA |
| Fast Charging (CC-CV) | 4 A 4.2 V max, Cut Off: 100 mA |
| Discharging Condition | 20 A |
| Discharge Cut Off Voltage | 2 V |
| Operating Temperature | Charge: 0 to 50 °C, Discharge: −30 to 60 °C |
| Weight | 48 g |
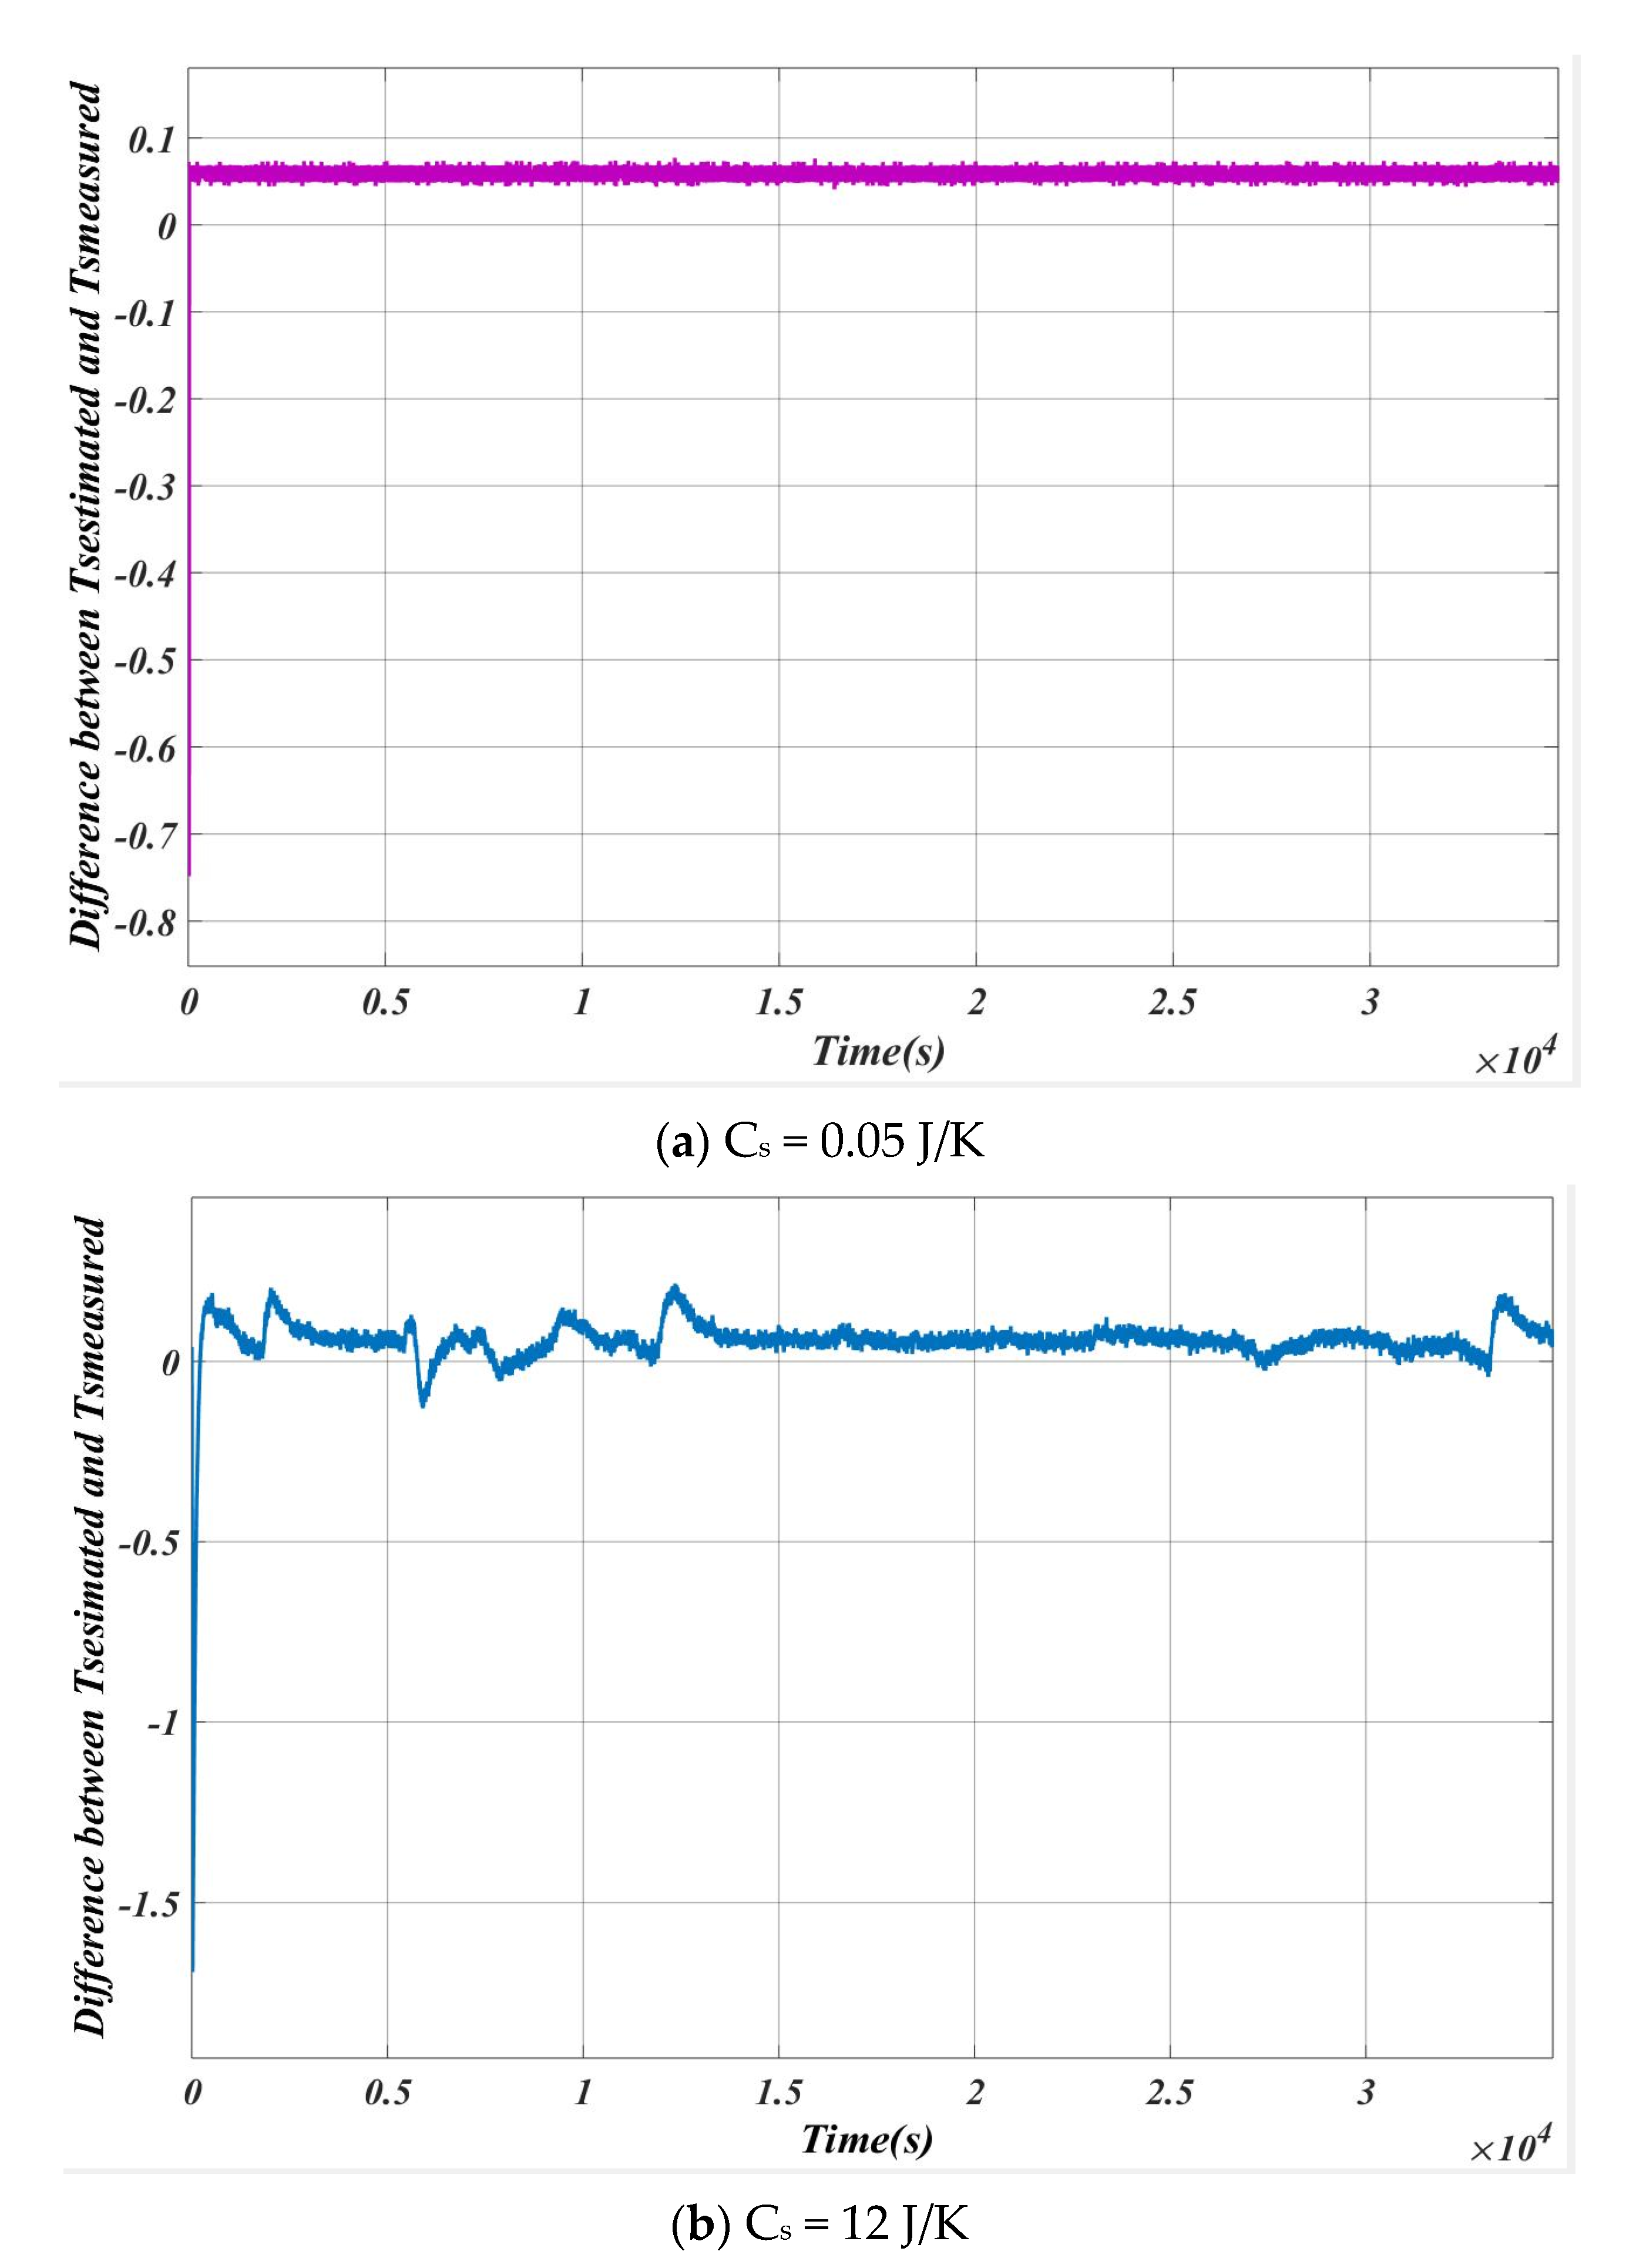
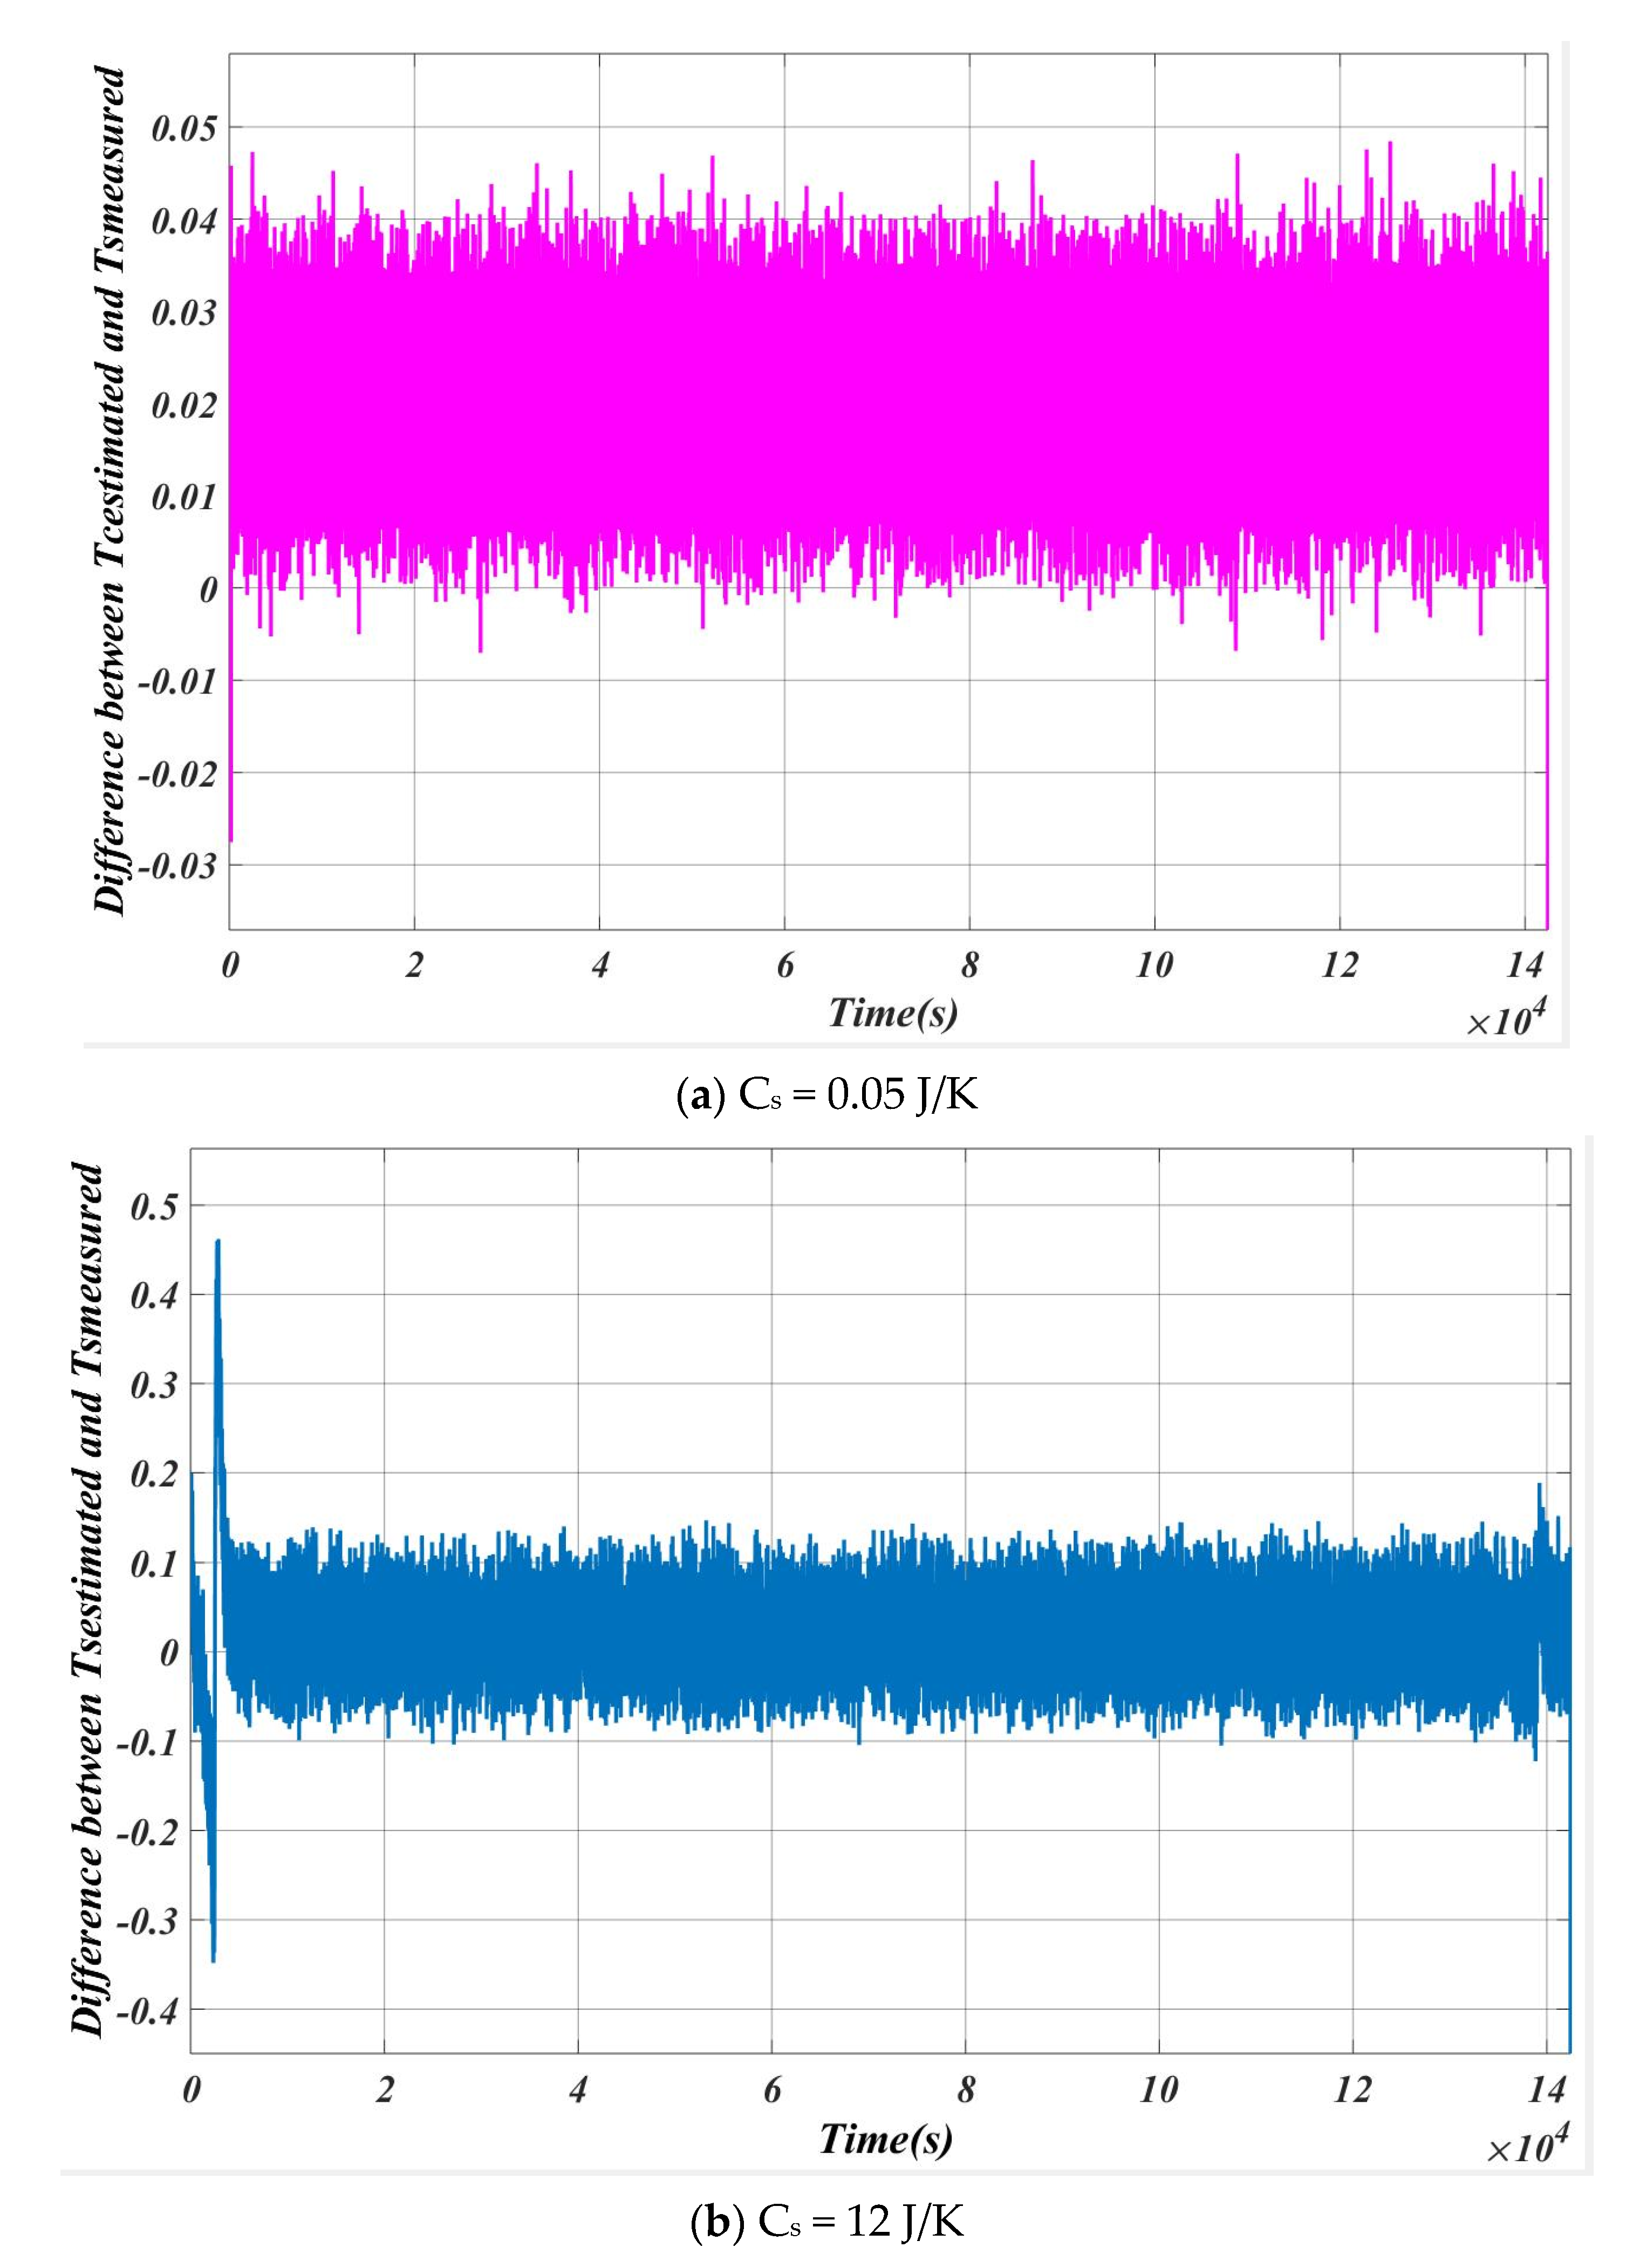
| SL. NO | Cs (J/K) | Max Error (Ts estimation~Ts measured) |
|---|---|---|
| 1 | 0.05 | 0.02 |
| 2 | 0.50 | 0.11 |
| 3 | 1.00 | 0.18 |
| 4 | 5.00 | 0.32 |
| SL.NO | Capacity (Ah) | Type of Chemistry | % Change in Tc |
|---|---|---|---|
| 1 | 40 | LiFePO4 | About 37 |
| 2 | 60 | Lead acid | About 40 |
| 3 | 68 | Lead acid | About 25 |
| 4 | 3 | LiNiMnCo02HNMC | About 1 |
Publisher’s Note: MDPI stays neutral with regard to jurisdictional claims in published maps and institutional affiliations. |
© 2020 by the authors. Licensee MDPI, Basel, Switzerland. This article is an open access article distributed under the terms and conditions of the Creative Commons Attribution (CC BY) license (http://creativecommons.org/licenses/by/4.0/).
Share and Cite
Surya, S.; Marcis, V.; Williamson, S. Core Temperature Estimation for a Lithium ion 18650 Cell. Energies 2021, 14, 87. https://doi.org/10.3390/en14010087
Surya S, Marcis V, Williamson S. Core Temperature Estimation for a Lithium ion 18650 Cell. Energies. 2021; 14(1):87. https://doi.org/10.3390/en14010087
Chicago/Turabian StyleSurya, Sumukh, Vinicius Marcis, and Sheldon Williamson. 2021. "Core Temperature Estimation for a Lithium ion 18650 Cell" Energies 14, no. 1: 87. https://doi.org/10.3390/en14010087
APA StyleSurya, S., Marcis, V., & Williamson, S. (2021). Core Temperature Estimation for a Lithium ion 18650 Cell. Energies, 14(1), 87. https://doi.org/10.3390/en14010087