Impact of Changes in the Required Thermal Insulation of Building Envelope on Energy Demand, Heating Costs, Emissions, and Temperature in Buildings


Abstract
:1. Introduction
2. Materials and Methods
2.1. Method for Calculating the Index of Annual Demand for Usable Energy for Heating
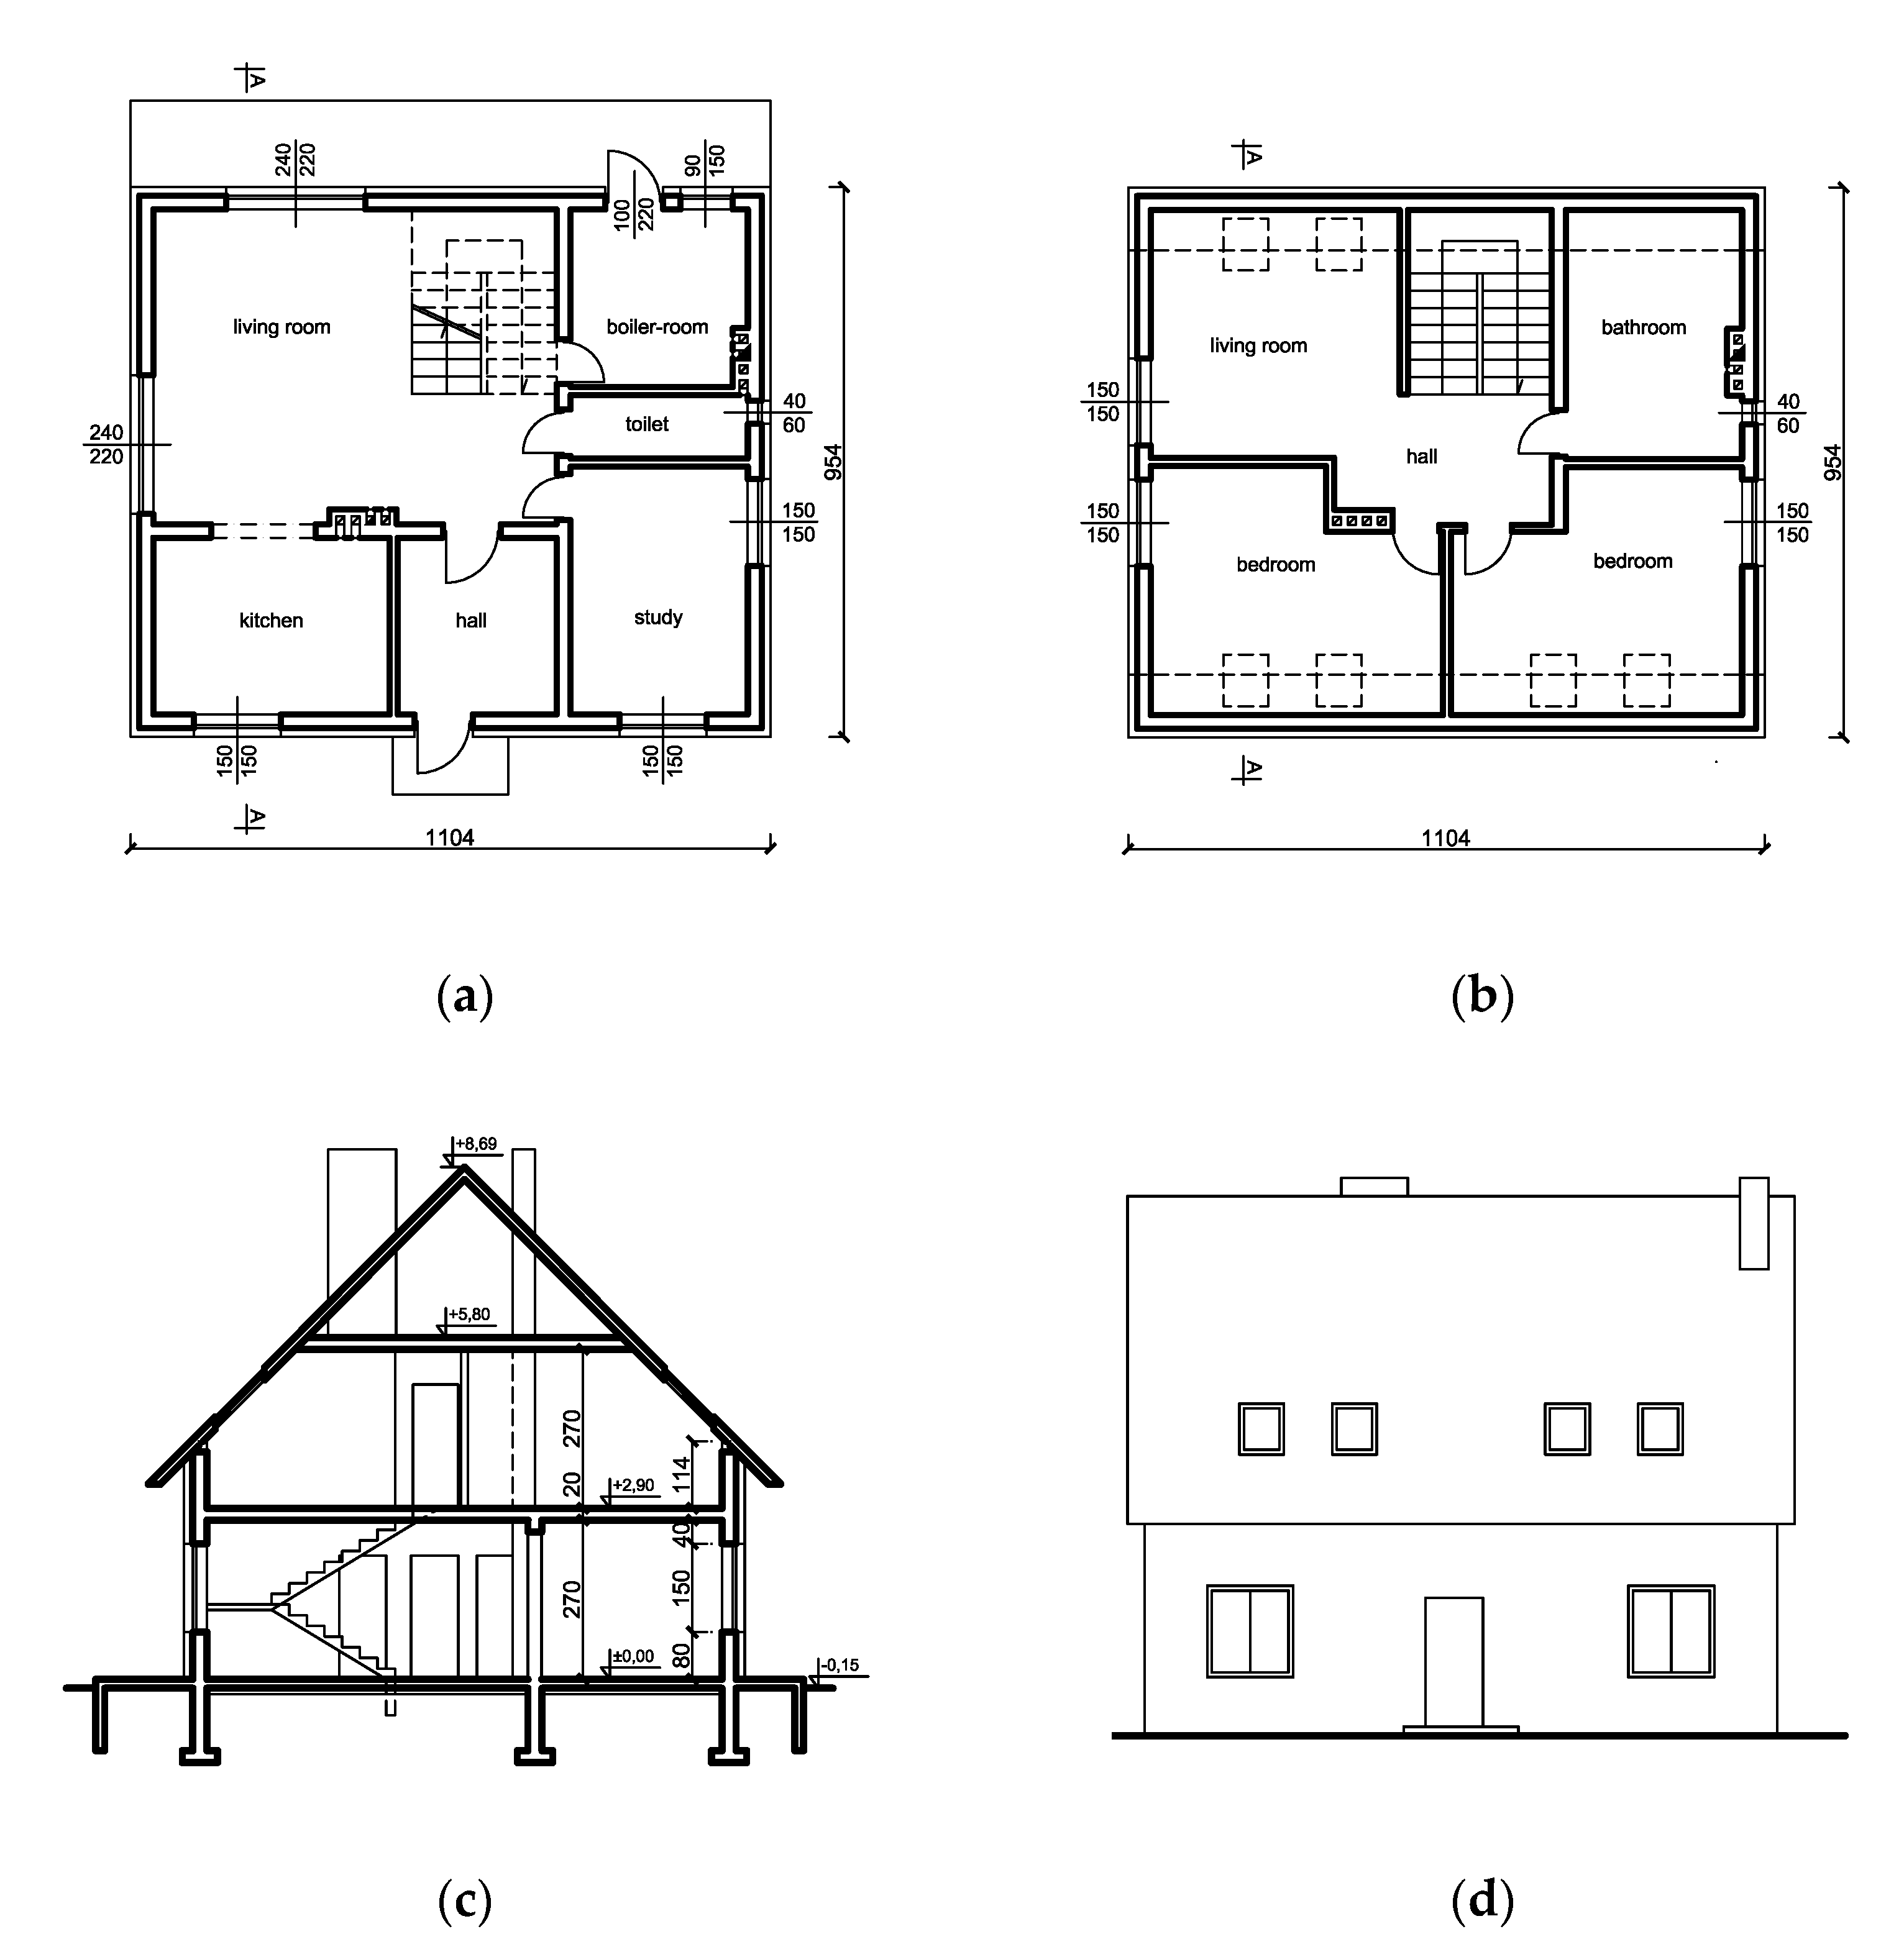
2.2. Characteristics of the Selected Residential Building
- -
- Building development area: 105.32 m2;
- -
- Total area: 162.48 m2;
- -
- Usable area: 150.11 m2;
- -
- Clear height of rooms: 2.70 m;
- -
- Volume: 690 m3.
2.3. Mathematical Model of the Annual Usable Energy Demand Index for Heating of a Selected Residential Building
2.4. Methods for Assessing Savings in Heating Costs, Emissions, and Perceptible Temperature in a Building
3. Result and Discussion
4. Conclusions
- -
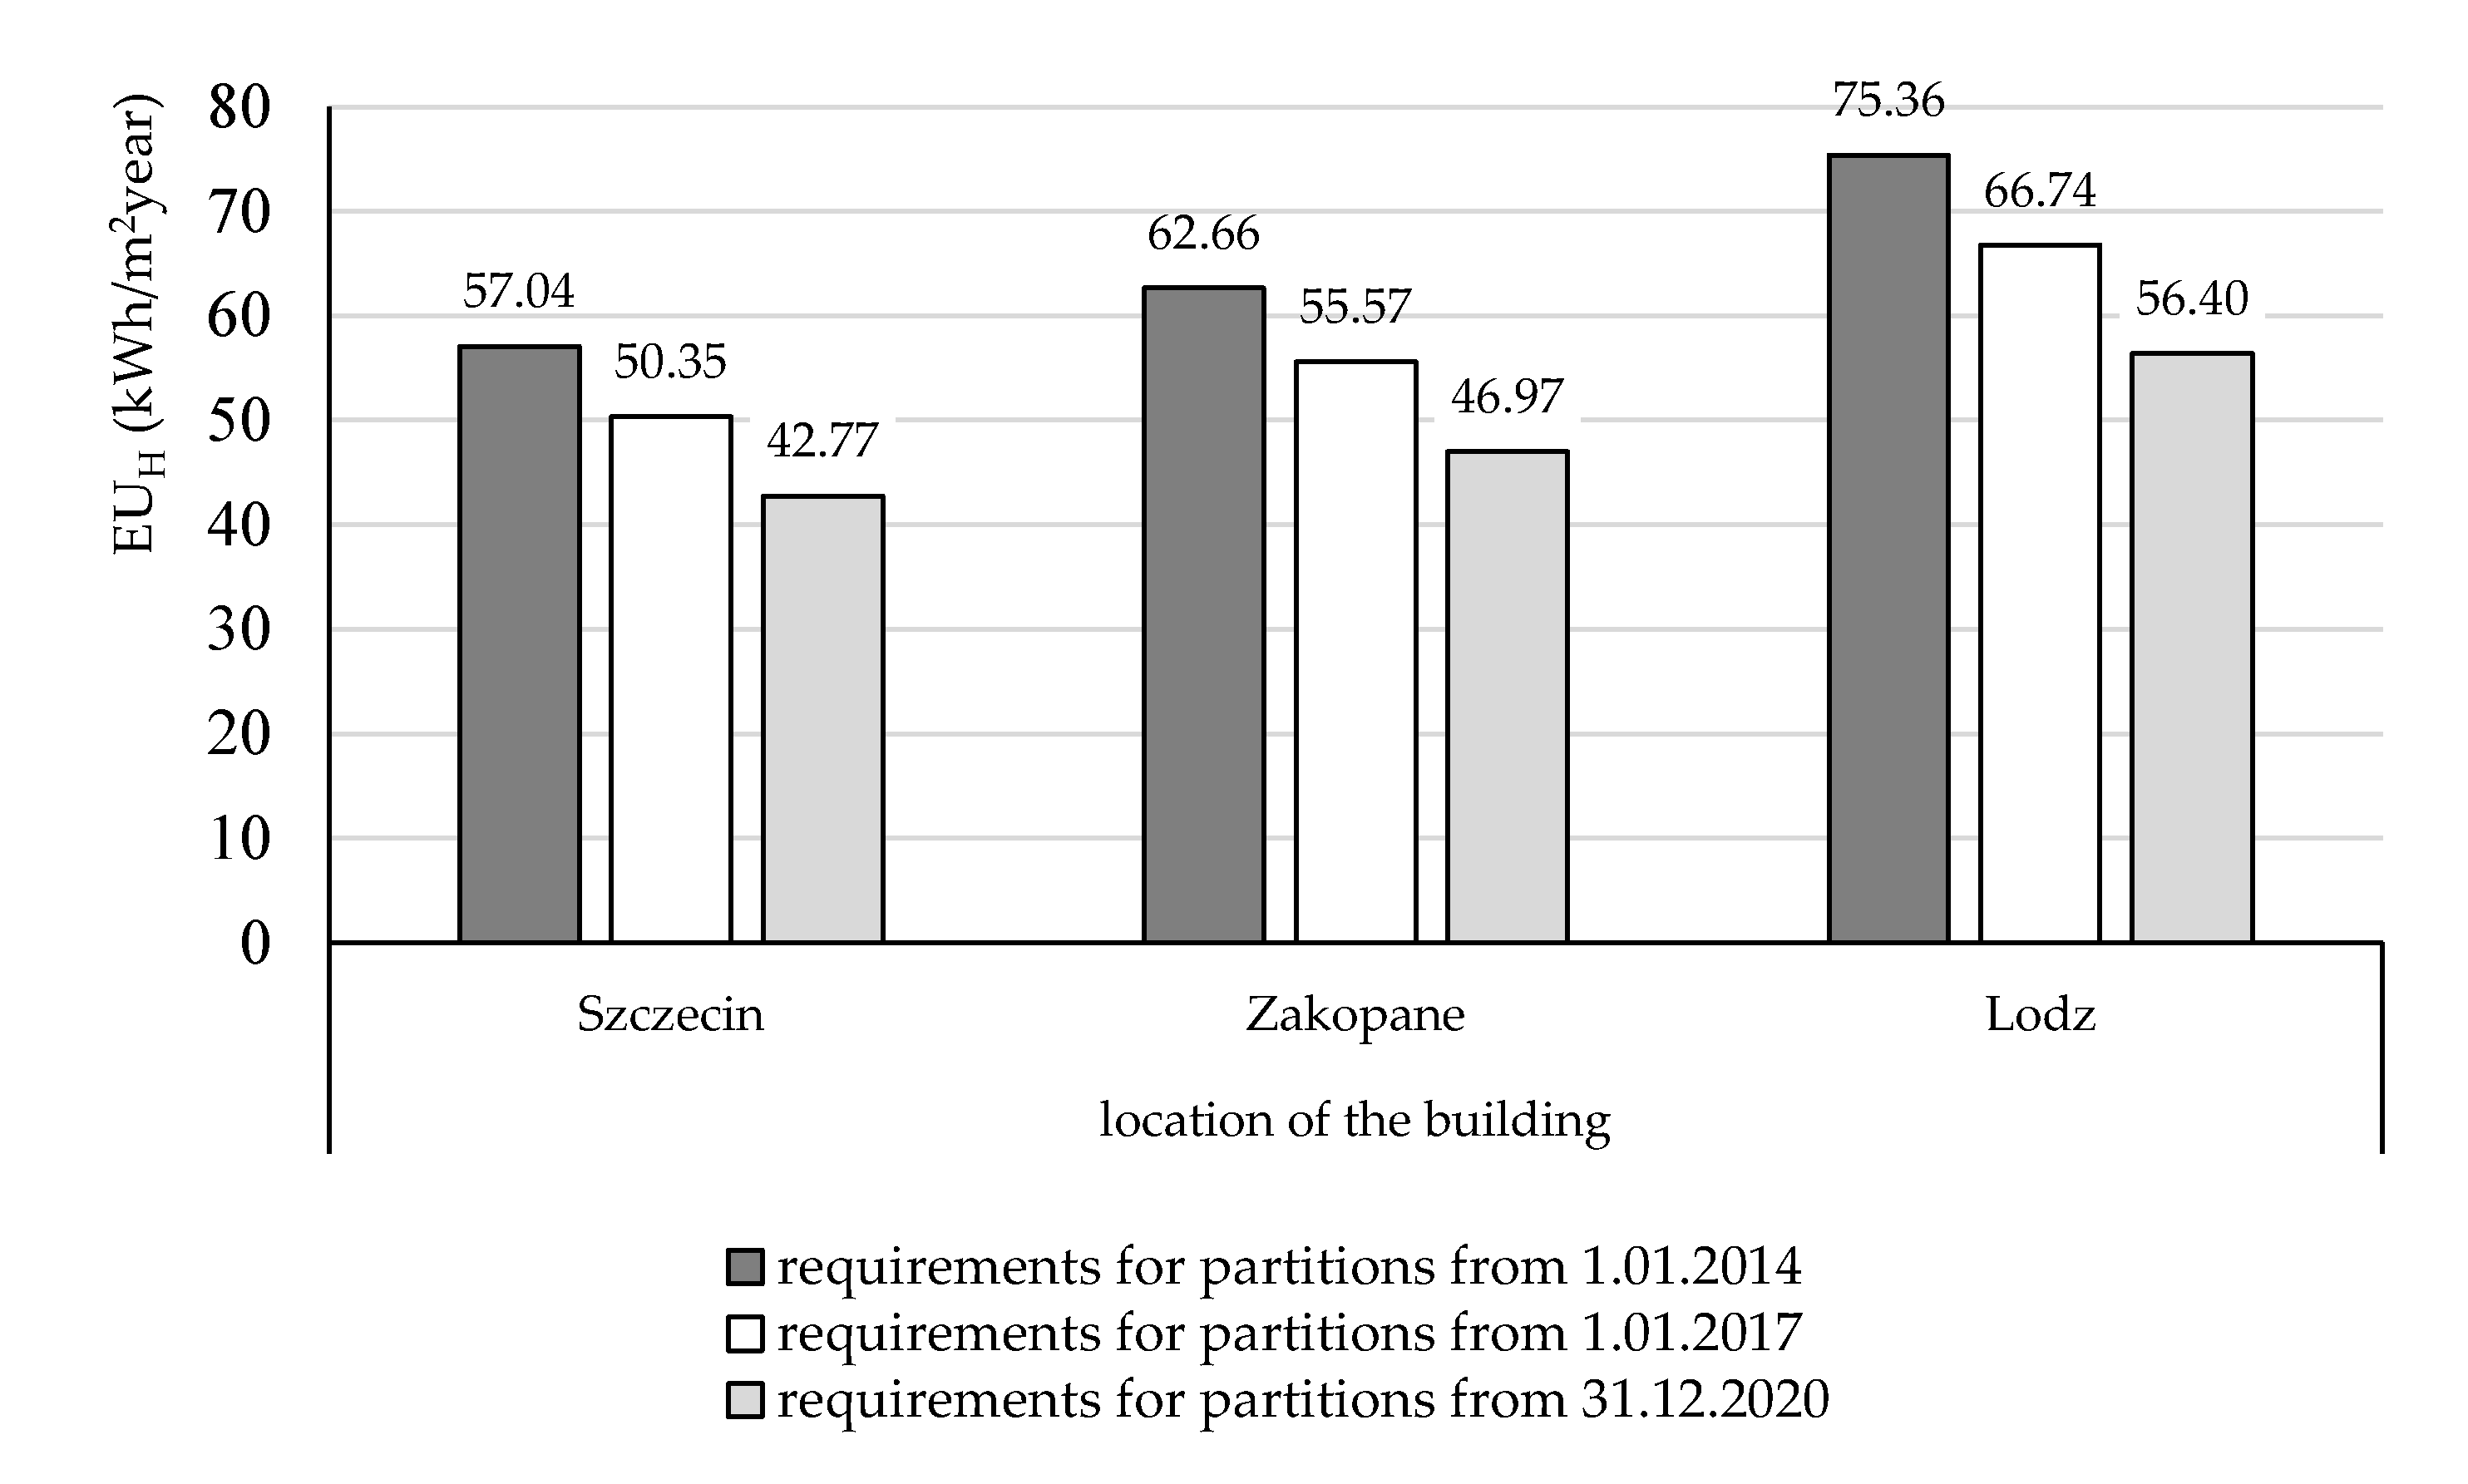
- It was found that the change in the required Ui,max the selected building envelopes, from the level in force from 1 January 2014 to the current one, caused a decrease in the EUH for the selected residential building, typical for Polish conditions and with natural ventilation, by over 11% in each of the considered locations. The change in the required Ui,max of the selected building envelope from the current level to the requirements from 1 January 2021 will result in a further reduction of the EUH by over 15%.Differences in the energy demand of the same building in different locations in Poland are significant and amount to even 32.6% in the cases considered in the article. Therefore, it is reasonable to return to the approach of determining the requirements for thermal protection of heated buildings in Poland, not uniform for the whole country, but varied, taking into account the climatic conditions of the construction site.
- -
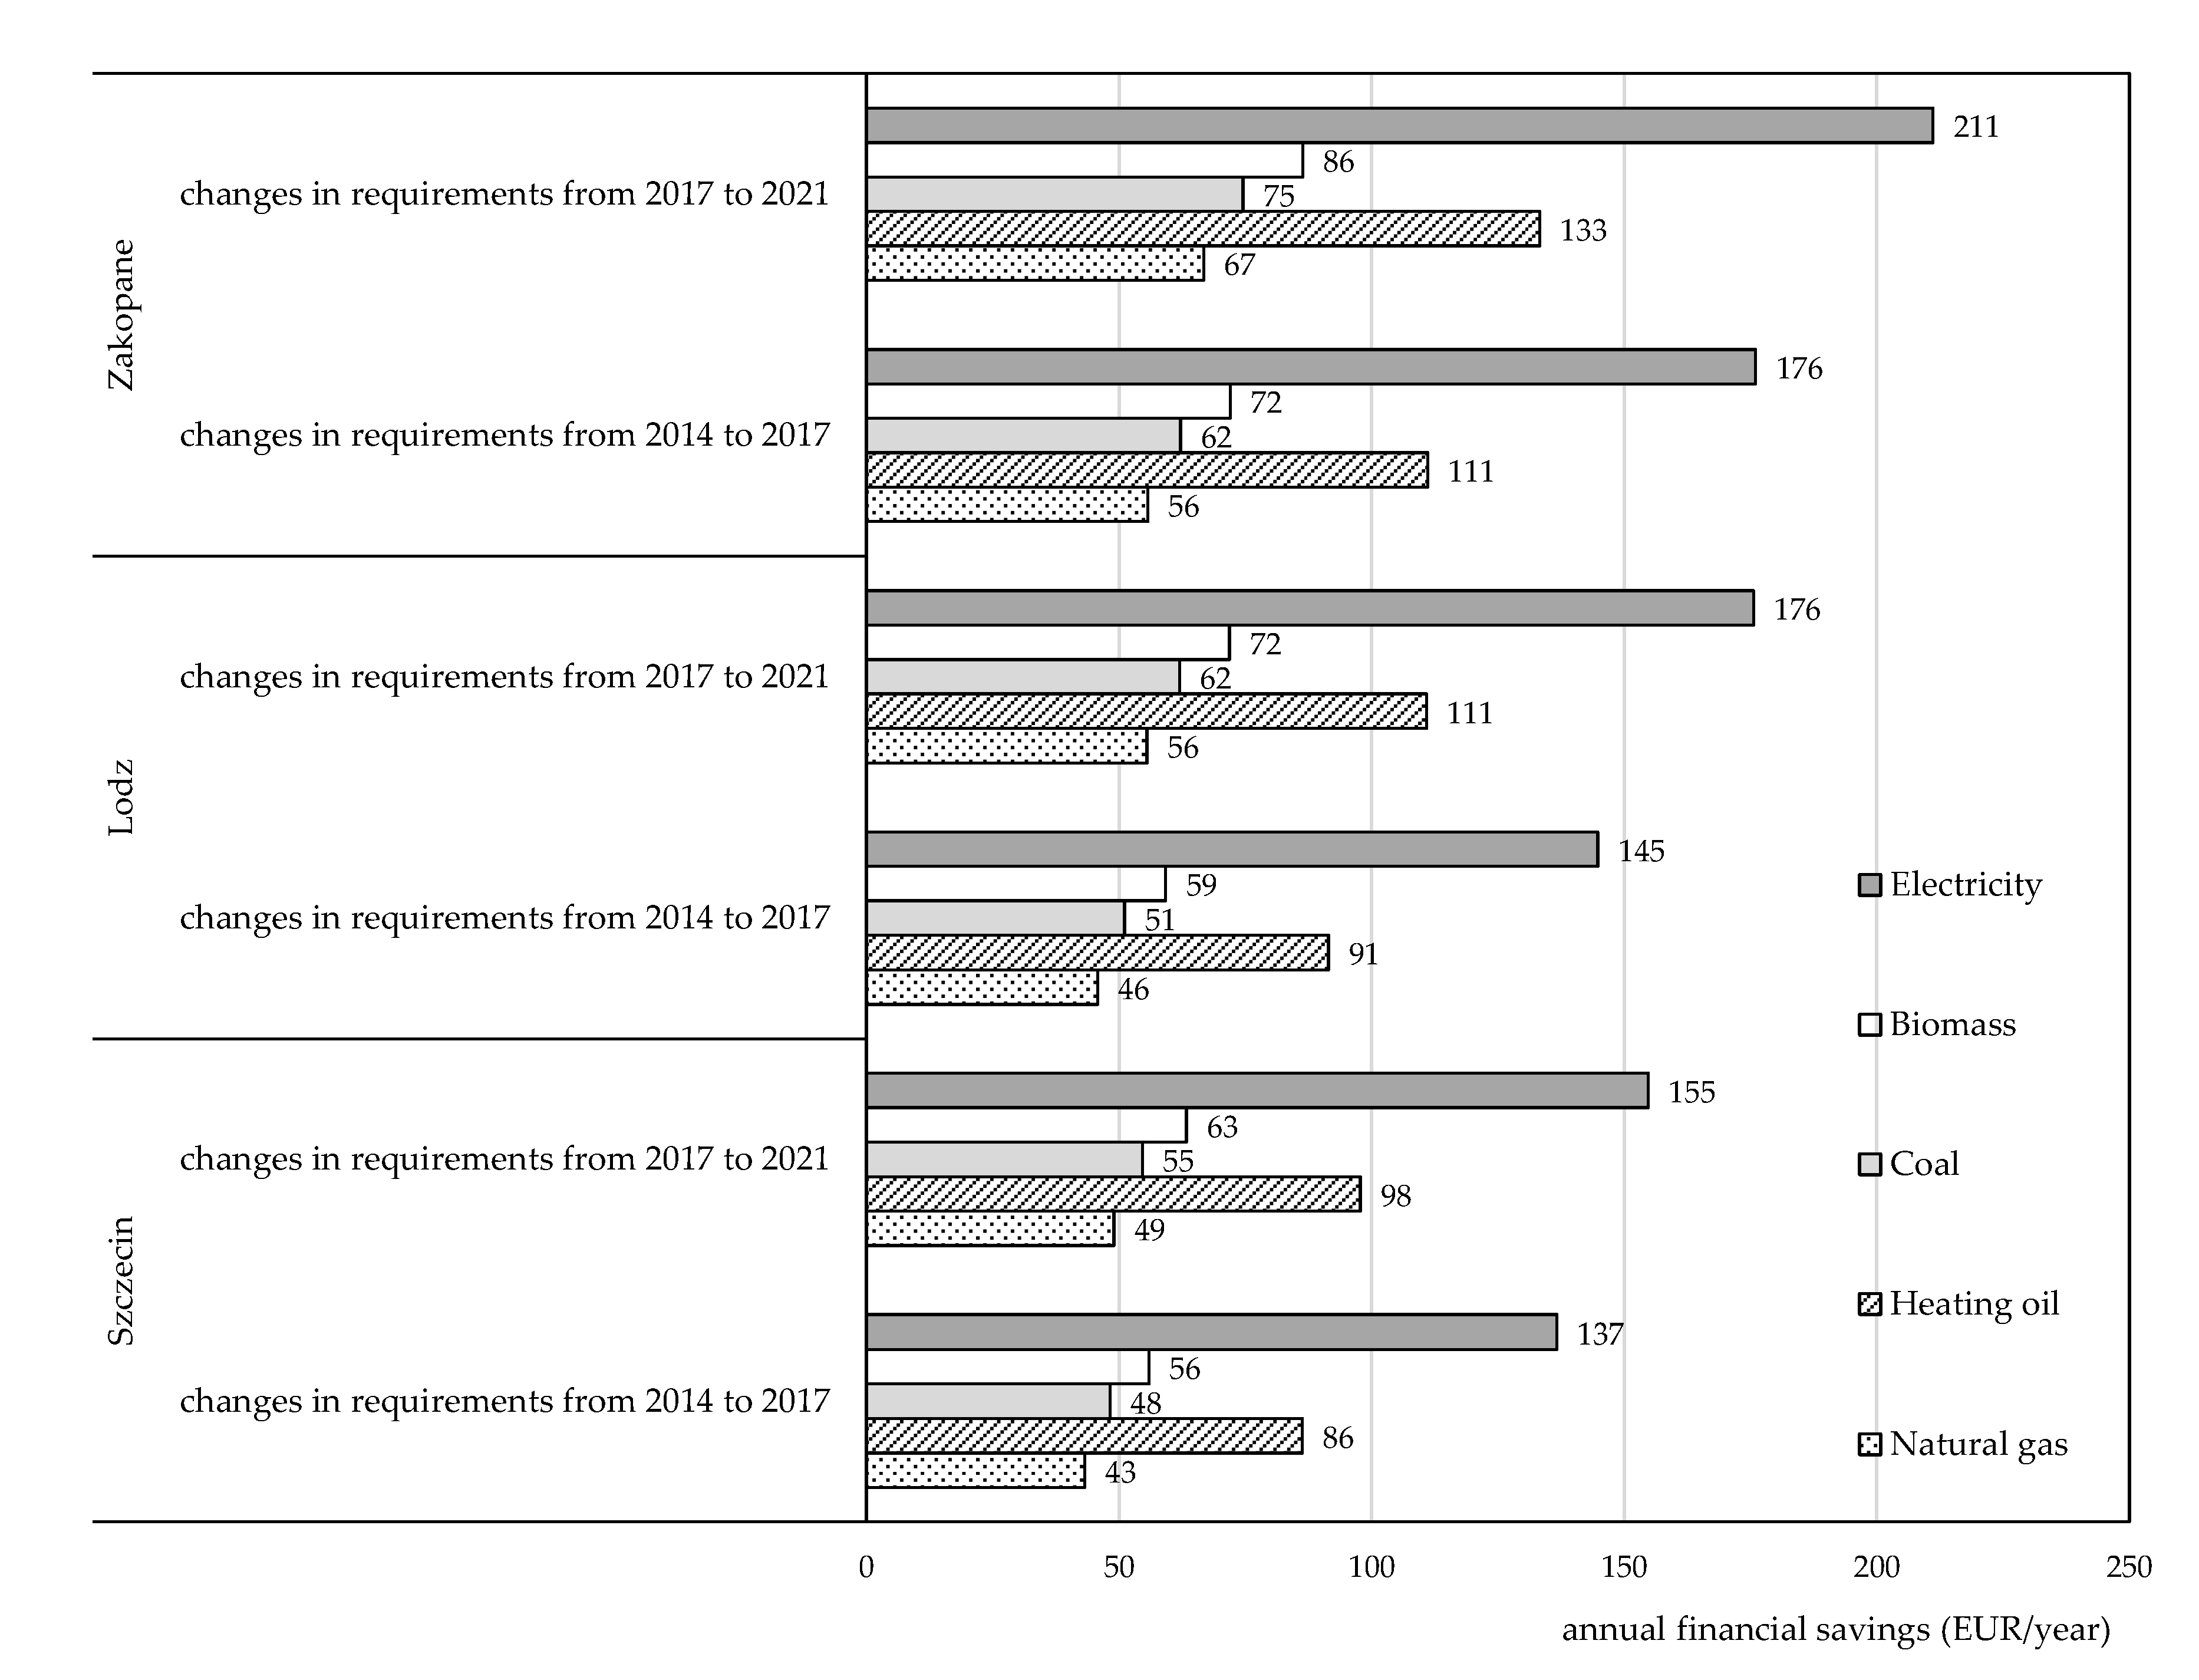
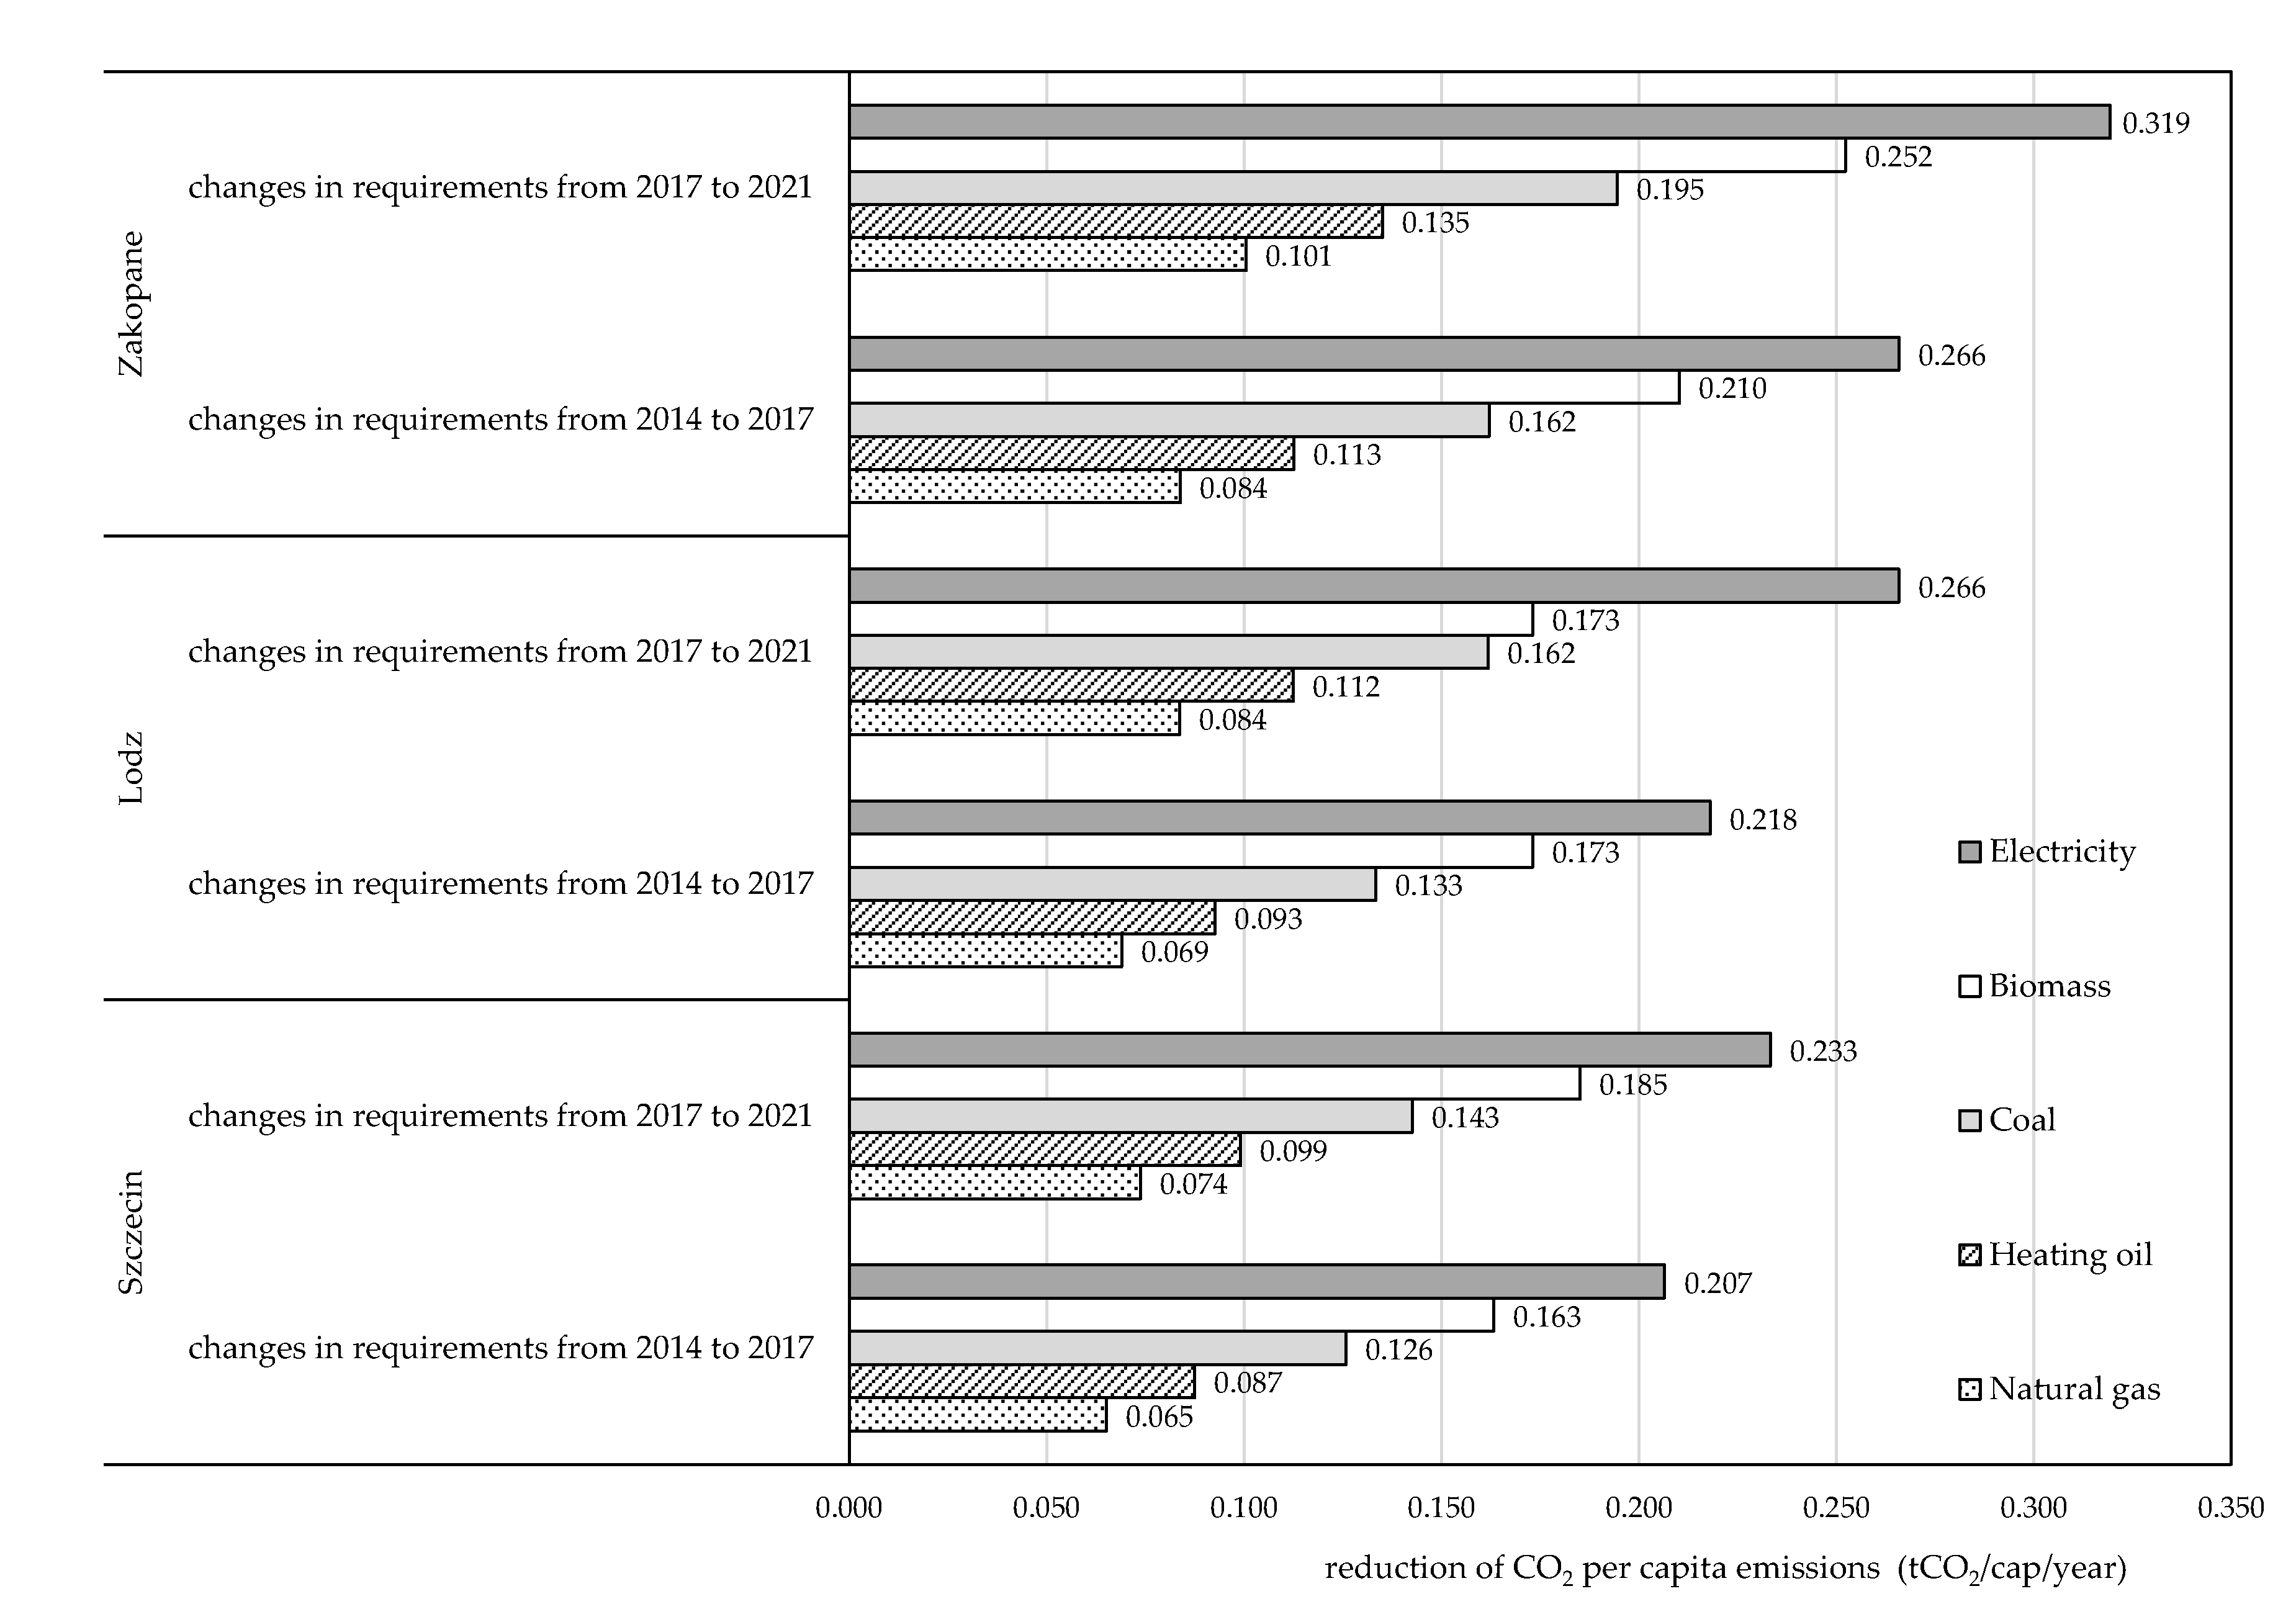
- Annual financial savings associated with changes in the required thermal insulation of the building envelope in the years 2014–2021, depending on the fuel used in the building, range from 43 EUR for gas supplying a building located in Szczecin, up to 211 EUR in a building located in Zakopane, when heating it with electricity. The reduction of carbon dioxide emissions in this respect may reach from 0.88% to 3.89% of current annual CO2 emissions per capita in Poland.
- -
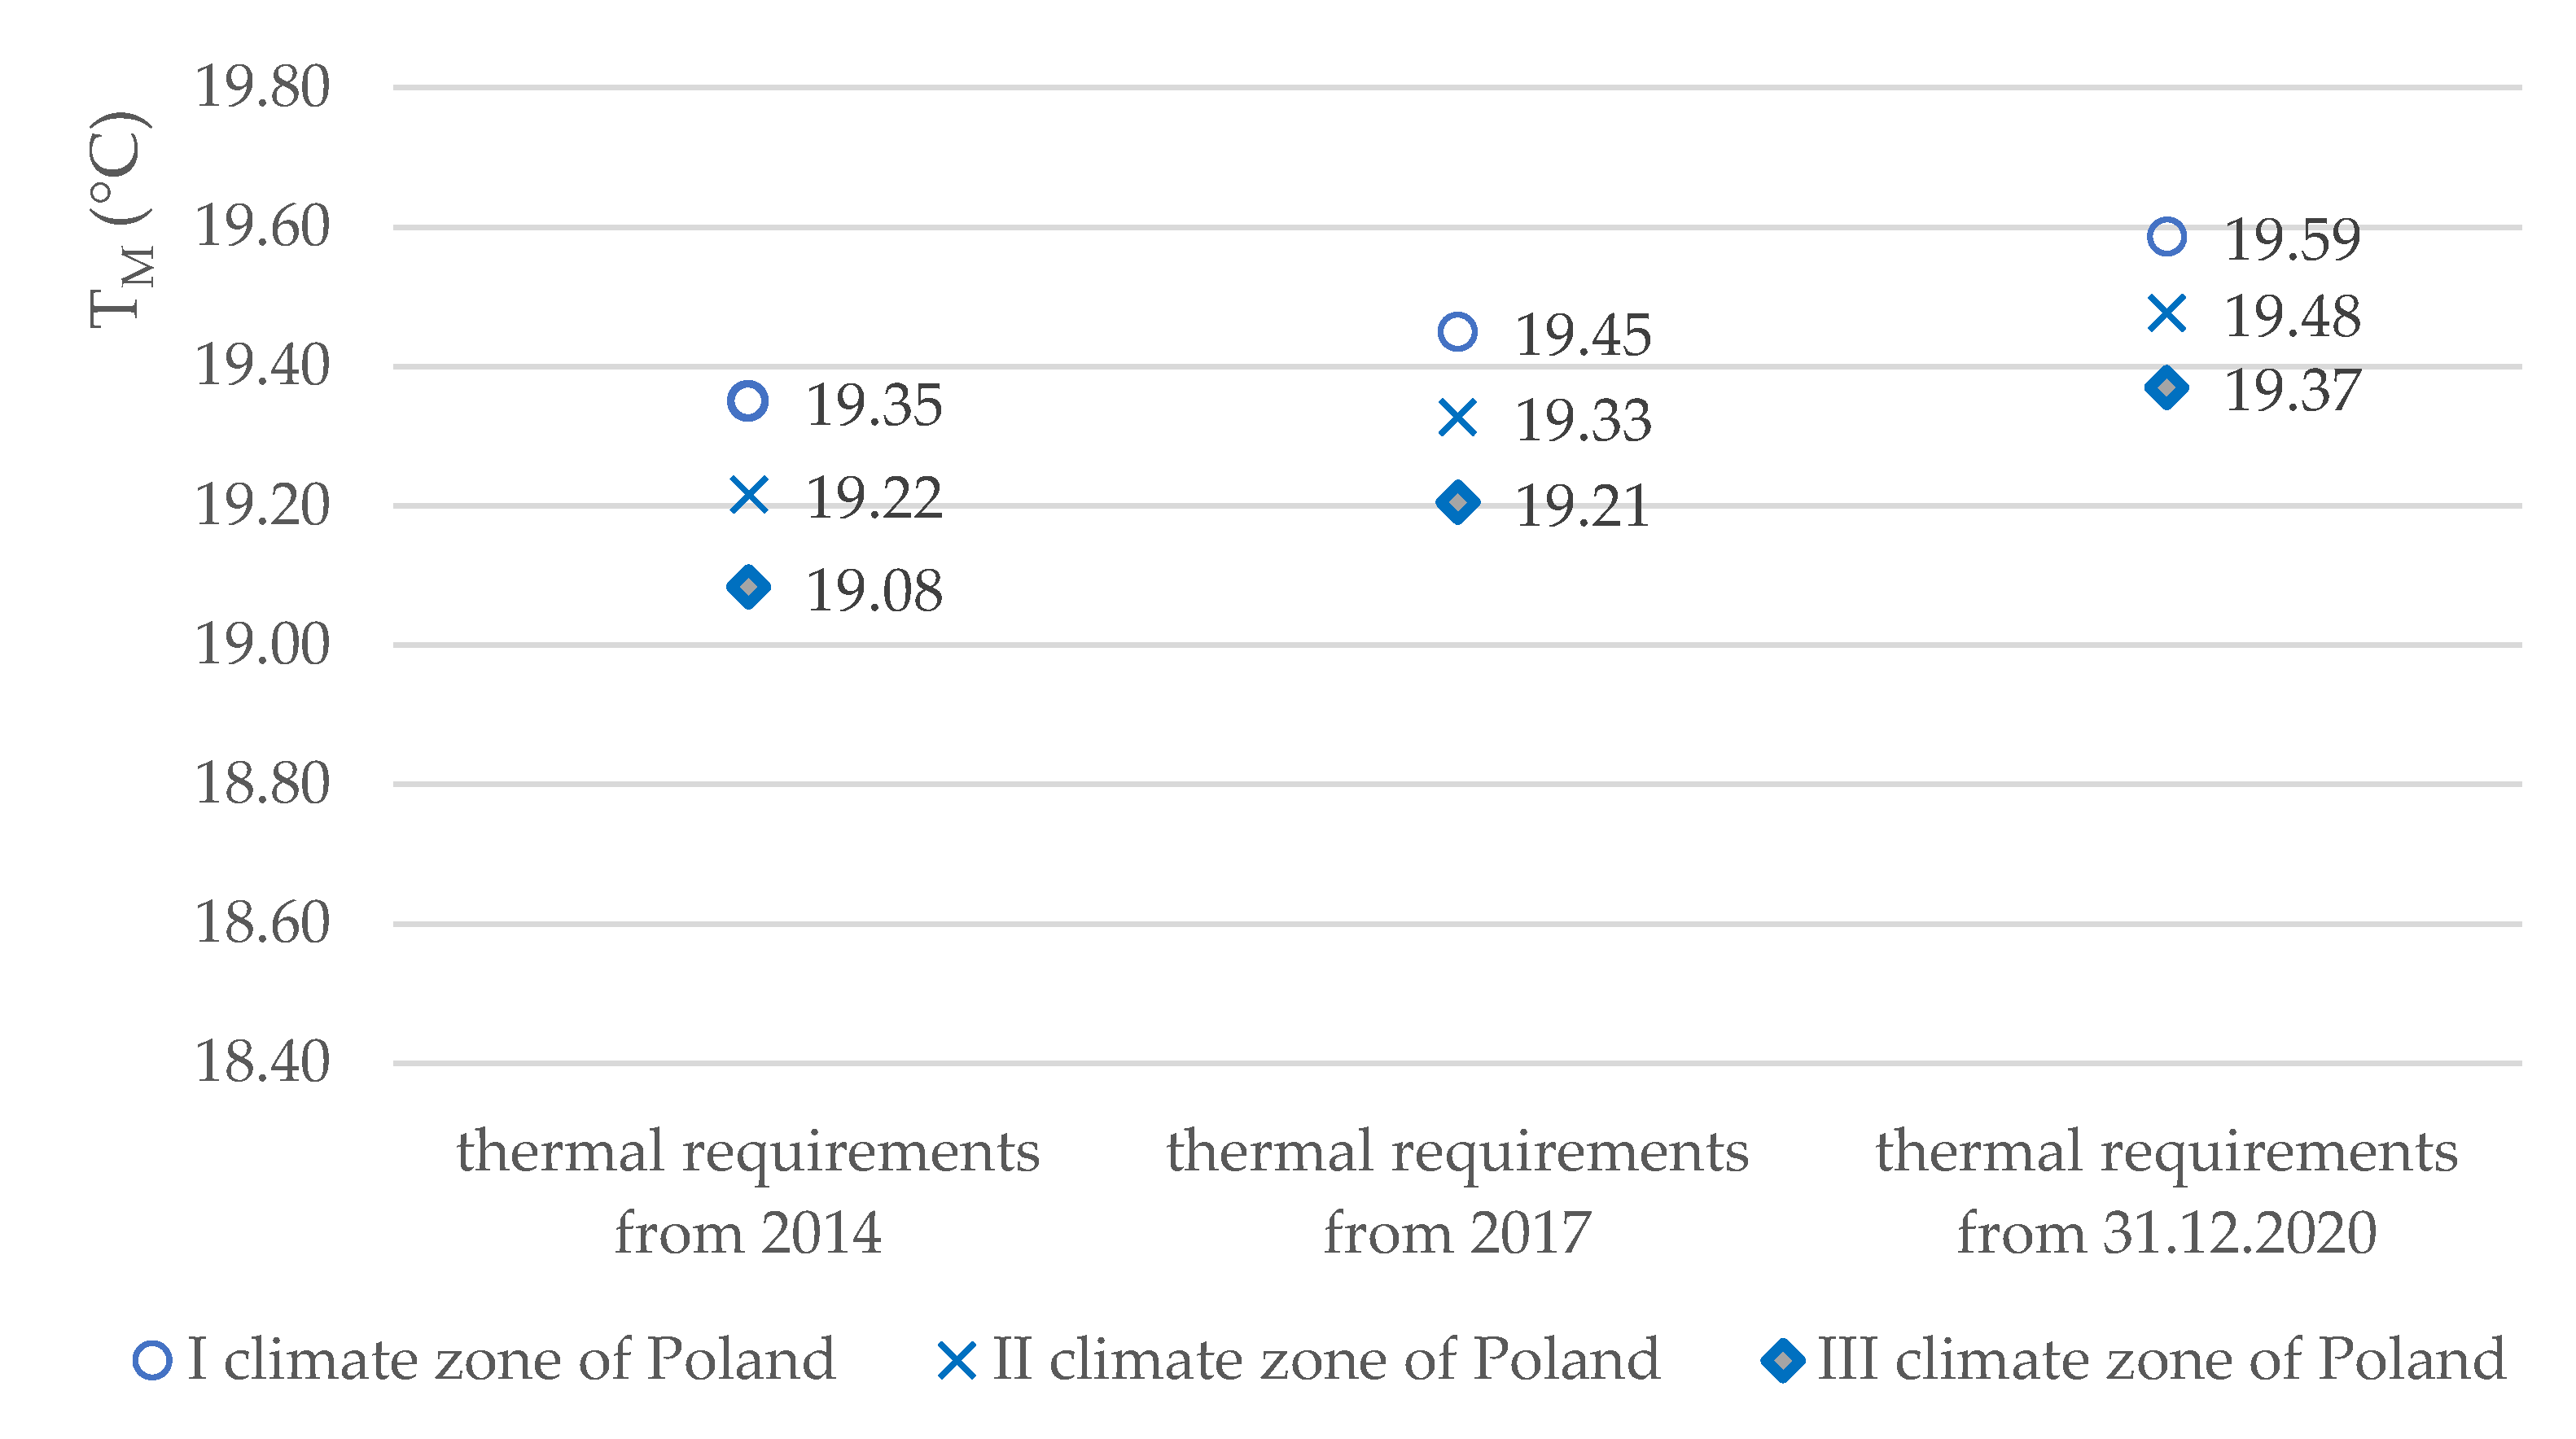
- Increasing the thermal insulation of the walls has a slight but positive effect on the parameters of thermal comfort in rooms. The increase in the perceptible temperature resulting from the tightening of thermal requirements for external walls in Poland in the period from 2017 to 2021 ranges from 1.22% to 1.50%, depending on the location of the building.
Author Contributions
Funding
Conflicts of Interest
Abbreviations
| the total heat transfer from the heated zone s in the n-th month of the year | |
| the total heat sources in the heated zone s in the n-th month of the year | |
| the dimensionless gain utilization factor in the heated zone s in the n-th month of the year | |
| the total heat transfer by transmission from the heated zone s in the n-th month of the year | |
| the total heat transfer by ventilation from the heated zone s in the n-th month of the year | |
| the total heat transfer coefficient by transmission of the building or building zone s | |
| average internal temperature of the heated building zone | |
| average external temperature | |
| the number of hours in a month | |
| the reduction factors for the adjacent unheated spaces | |
| Ai | the area of element i of the building envelope |
| Ui | the thermal transmittance coefficient of element i of the building envelope |
| li | the length of linear thermal bridge |
| Ψi | the linear thermal transmittance of linear thermal bridge |
| the total heat transfer coefficient by ventilation of the building or building zone s | |
| the heat capacity of air per volume | |
| the airflow rate through the heated space | |
| the sum of solar heat sources from solar radiation through windows or door opening | |
| the sum of internal heat sources | |
| the share of glass plane surface area to the total area of the window | |
| surface area of window or door opening | |
| the average solar radiation in the considered month on the plane in which there is a window | |
| the shading reduction factor for movable shading devices | |
| the reducing factor due to shading from the external envelope | |
| the total solar energy transmittance factor of the transparent part of the element | |
| the heat flow from users and devices | |
| the seasonal average total efficiency of the heating system | |
| the seasonal average efficiency of heat generation of the heating system | |
| the seasonal average efficiency of regulation and heat use in the heated space/heating system | |
| the seasonal average efficiency of heat transfer of the heating system | |
| the seasonal average energy storage efficiency | |
| the demand for final energy | |
| the cost of heating | |
| the unit price of energy | |
| emission factor depending on the type of fuel and pollution | |
| the perceptible temperature |
References
- Directive 2010/31/EU of The European Parliament and of the Council of 19 May 2010 on the Energy Performance of Buildings. Available online: https://eur-lex.europa.eu/legal-content/PL/ALL/?uri=CELEX%3A32010L0031 (accessed on 28 April 2020).
- Polish Ministry of Transport, Construction and Maritime Economy. Regulation of the Minister of Transport, Construction and Maritime Economy of 5 July 2013 on the Technical Conditions That Buildings and Their Location Should Satisfy; Polish Ministry of Transport, Construction and Maritime Economy: Warsaw, Poland, 2015. [Google Scholar]
- Życzyńska, A.; Cholewa, T. The modifications to the requirements on energy savings and thermal insulation of buildings in Poland in the years 1974–2021. Bud. Archit. 2015, 14, 145–154. [Google Scholar] [CrossRef]
- United Nations Economic Commission for Europe Joint Task Force on Energy Efficiency Standards in Buildings. Mapping of Existing Energy Efficiency Standards and Technologies in Buildings in the UNECE Region; UNECE: Geneva, Switzerland, 2018; Available online: https://www.unece.org/fileadmin/DAM/hlm/Meetings/2018/09_05-07_St._Petersburg/EE_Standards_in_Buildings_full_version.ENG.pdf (accessed on 28 April 2020).
- D’Agostino, D.; de’Rossi, F.; Marigliano, M.; Marino, C.; Minichiello, F. Evaluation of the optimal thermal insulation thickness for an office building in different climates by means of the basic and modified “cost-optimal” methodology. J. Build. Eng. 2019, 24. [Google Scholar] [CrossRef]
- Concerted Action Energy Performance of Buildings. Database. Available online: https://epbd-ca.eu/database-of-outputs (accessed on 28 April 2020).
- Österreichisches Institut für Bautechnik. OIB Guidelines, Austria, OIB-330.6-026/19. Available online: https://www.oib.or.at/de/oib-richtlinien (accessed on 25 November 2020).
- Main Office of Building Control. Construction Market in Poland in 2018. Warsaw, Poland, 2018. Available online: https://www.gunb.gov.pl/aktualnosc/ruch-budowlany-w-2018-r (accessed on 28 April 2020).
- Statistics Poland. Occupied Buildings. National Census of Population and Housing 2011 in Poland; Central Statistical Office: Warsaw, Poland, 2013; p. 18. [Google Scholar]
- Eurostat. Living Conditions in Europe; Publications Office of the European Union: Luxembourg, 2018; Available online: https://ec.europa.eu/eurostat/web/income-and-living-conditions/overview (accessed on 28 April 2020).
- Ministry of Infrastructure and Development of Poland. National plan for increasing the number of nearly zero-energy buildings as required by directive 2010/31/EU on the energy performance of buildings (EPBD recast)—Poland. J. Laws Repub. Pol. 2015, 614. Available online: http://isap.sejm.gov.pl/isap.nsf/DocDetails.xsp?id=WMP20150000614 (accessed on 23 December 2020).
- Statistics Poland. Household Energy Consumption in 2018; Central Statistical Office: Warsaw, Poland, 2019. Available online: https://stat.gov.pl/obszary-tematyczne/srodowisko-energia/energia/zuzycie-energii-w-gospodarstwach-domowych-w-2018-roku,12,1.html (accessed on 28 April 2020).
- Krawczyk, D.A.; Sadowska, B. Modernization of Existing Buildings. Buildings 2020+ Constructions, Materials and Installations; Printing House of Bialystok University of Technology: Wiejska, Poland, 2019; pp. 107–129. [Google Scholar]
- Jezierski, W.; Sadowska, B. Economic effects of changes in the required thermal insulation of building partitions in Poland. Econ. Environ. 2020, 1, 109–126. [Google Scholar]
- Narowski, P. Energy simulations of buildings—What they are and what they are used for. Energ. Budynek 2007, 9, 4–13. [Google Scholar]
- Statistics Poland. In Statistical Snalyses: Environment 2019; Spatial and Environmental Surveys Department: Warsaw, Poland, 2019. Available online: https://stat.gov.pl/obszary-tematyczne/srodowisko-energia/srodowisko/ochrona-srodowiska-2019,1,20.html (accessed on 28 April 2020).
- Crippa, M.; Oreggioni, G.; Guizzardi, D.; Muntean, M.; Schaaf, E.; Lo Vullo, E.; Solazzo, E.; Monforti-Ferrario, F.; Olivier, J.G.J.; Vignati, E. Fossil CO2 and GHG Emissions of All World Countries—2019 Report, EUR 29849 EN.; Publications Office of the European Union: Luxembourg, 2019; ISBN 978-92-76-11100-9. JRC117610. [Google Scholar] [CrossRef]
- Polish Ministry of Infrastructure. Regulation of the minister of infrastructure of 27 February 2015 on the methodology for calculating the energy performance of a building or part of a building and energy performance certificates. J. Laws Repub. Pol. 2015, 376. Available online: http://isap.sejm.gov.pl/isap.nsf/DocDetails.xsp?id=WDU20150000376 (accessed on 23 December 2020).
- Gutenbaum, J. Mathematical Modeling of Systems; EXIT: Warsaw, Poland, 2003. [Google Scholar]
- Typical Meteorological Years and Statistical Climate Data for Poland for Energy Calculations of Buildings. Available online: https://dane.gov.pl/dataset/797,typowe-lata-meteorologiczne-i-statystyczne-dane-klimatyczne-dla-obszaru-polski-do-obliczen-energetycznych-budynkow (accessed on 28 April 2020).
- StatSoft Electronic Statistics Textbook. Available online: https://www.statsoft.pl/textbook/stathome.html (accessed on 26 November 2019).
- Korzyński, M. Methodology of the Experiment. Planning, Implementation, and Statistical Analysis of the Results of Technological Experiments; WNT: Warsaw, Poland, 2006. [Google Scholar]
- Durakovic, B. Design of experiments application, concepts, examples. State Art Period. Eng. Nat. Sci. 2017, 5, 421–439. [Google Scholar]
- Price of Electricity. Available online: http://www.cena-pradu.pl/ (accessed on 14 November 2019).
- Fuel Exchange. Available online: http://gielda-paliw.com/ogloszenia/kategoria/238/olej-opalowy (accessed on 14 November 2019).
- Portal Krosno24. Available online: https://krosno24.pl/anonse/kategoria/21 (accessed on 14 November 2019).
- ISO 10211:2017 Thermal Bridges in Building Construction—Heat Flows and Surface Temperatures—Detailed calculations. Available online: https://www.iso.org/standard/65710.html (accessed on 14 December 2020).
- Ickiewicz, I.; Sarosiek, W.; Ickiewicz, J. Building Physics—Selected Issues; Printing House of Bialystok University of Technology: Bialystok, Poland, 2000. [Google Scholar]
- Dylla, A. Building Physics in Practice; PWN: Warsaw, Poland, 2015. [Google Scholar]
- Poland’s National Inventory Report 2019. Heating Values and CO2 Emission Factors in 2017 for Reporting under the Emissions Trading System for 2019; KOBiZE: Warsaw, Poland, 2019. [Google Scholar]
- Poland’s National Inventory Report 2019. CO2, SO2, NOx, CO and Total Dust Emission Ratios for Electricity based on Information Contained in the National Database of Greenhouse Gas Emissions and Other Substances for 2018; KOBiZE: Warsaw, Poland, 2019. [Google Scholar]
- Emissions Trading System EU ETS. Available online: https://ec.europa.eu/clima/policies/ets_en (accessed on 28 April 2020).
- EEA. EMEP/EEA Air Pollutant Emission Inventory Guidebook 2019—Part B, 1.A.4 Small Combustion; European Environment Agency; Report No 13/2019; Available online: https://www.eea.europa.eu/publications/emep-eea-guidebook-2019 (accessed on 28 April 2020).


| Period of Validity | Document Constituting the Legal Basis | Type of Building Envelope | ||||
|---|---|---|---|---|---|---|
| External Walls | Roofs | Windows and Balcony Doors | Roof Windows | Doors | ||
| UC(max) (W/(m2K)) | ||||||
| 1957–1964 | PN-57/B-02405 (as a recommendation) | 1.16 or 1.42 (depending on the climate zone) | 0.87 | - | - | - |
| 1964–1974 | PN-64/B-03404 | 0.87 | - | - | - | |
| 1974–1982 | PN-74/B-03404 | 0.70 | 2.0–5.8 (depending on the climate zone) | 1.60–5.80 | ||
| 1982–1991 | PN-82/B-02020 | 0.75 | 0.45 | 2.0–2.6 (depending on the climate zone) | - | 1.10–5.60 |
| 1991–2002 | PN-91/B-02020 | 0.55–0.70 | 0.30 | - | 3.0 | |
| 2002–2008 | Journal of laws of the Republic of Poland, 2002, no 7, Item 690 | 0.30–0.50 | 0.30 | 2.00 | 2.60 | |
| 2009–2013 | Journal of laws of the Republic of Poland, 2008, no 201, Item 1238 | 0.30 | 0.25 | 1.70–1.80 | 1.80 | 2.60 |
| 2014–2016 | Journal of laws of the Republic of Poland, 2013, Item 926 | 0.25 | 0.20 | 1.30 | 1.50 | 1.70 |
| 2017–2019 | 0.23 | 0.18 | 1.10 | 1.30 | 1.50 | |
| since 31 December 2020 | 0.20 | 0.15 | 0.90 | 1.10 | 1.30 | |
| Type of Building Envelope | Germany (Since 1 January 2016) | Austria (Since April 2019) | Slovak Republic (Since 1 January 2016) | Czech Republic (Since 1 January 2013) |
|---|---|---|---|---|
| Required U Value (W/(m2K)) | ||||
| External walls | 0.28 | 0.35 | 0.22 | 0.30 |
| Roofs | 0.20 | 0.20 | 0.15 | 0.24 |
| Windows | 1.30 | 1.40 | 1.00 | 1.70 |
| Doors | 1.80 | 1.70 | 2.50 | 3.50 |
| Procedure for Calculating the Index of Annual Usable Energy Demand for Heating and Ventilation |
|---|
| Introduction of input variables U1, U2, U3, U4, U5 |
| Introduction of permanent parameters Ui, Ai, Ψi, li, btr,i, θint,s,H, θe,n, tm, Aoi, Ci, Ii, Fsh,gl, Fsh, ggl, qint, Af, bve,k, Vve,s |
| Calculation of heat losses by ventilation Hve,s, Qv,e,s,n |
| Calculation of heat losses by transmission Htr,s, Qtr,s,n, QH,ht,s,n, QH,nd,s,n |
| Calculation of heat gains Qsol,H, Qint,H |
| Calculation of the annual demand for usable energy for heating and ventilation QH,nd,s,n |
| Determination of the index of annual energy demand for heating and ventilation EUH = QH,nd,s,n/Af |
| Group of Climatic Conditions | City | The Energy of Solar Radiation on the Plane with the Window S Orientation ƩIi (kWh/(m2∙Month)) | The Average Monthly External Temperature θe (°C) | The Sum of Hours of the Heating Season Ʃtm (h) |
|---|---|---|---|---|
| I | Szczecin | 48,188.5 | 4.49 | 5808 |
| II | Lodz | 46,763.7 | 2.70 | 5328 |
| III | Zakopane | 63,734.3 | 1.99 | 6048 |
| Factor Level Ẋi | U1 (X1) | U2 (X2) | U3 (X3) | U4 (X4) | U5 (X5) |
|---|---|---|---|---|---|
| (W/(m2K)) | |||||
| bottom (−1) | 0.20 | 0.15 | 0.90 | 1.10 | 1.30 |
| middle (0) | 0.23 | 0.18 | 1.10 | 1.30 | 1.50 |
| upper (+1) | 0.26 | 0.21 | 1.30 | 1.50 | 1.70 |
| range of factor change ΔXi | 0.03 | 0.03 | 0.20 | 0.20 | 0.20 |
| No | X1 | X2 | X3 | X4 | X5 | EUHI (YI,i) | EUHII (YII,i) | EUHIII (YIII,i) |
|---|---|---|---|---|---|---|---|---|
| (kWh/(m2year)) | ||||||||
| 1 | −1 | −1 | −1 | −1 | +1 | 43.2 | 48.0 | 57.6 |
| 2 | +1 | −1 | −1 | −1 | −1 | 47.6 | 52.7 | 63.2 |
| 3 | −1 | +1 | −1 | −1 | −1 | 45.9 | 50.9 | 61.1 |
| 4 | +1 | +1 | −1 | −1 | +1 | 52.2 | 57.6 | 69.1 |
| … | … | … | … | … | … | … | … | … |
| 23 | 0 | 0 | 0 | −1 | 0 | 49.7 | 54.9 | 66.0 |
| 24 | 0 | 0 | 0 | +1 | 0 | 51.0 | 56.2 | 67.5 |
| 25 | 0 | 0 | 0 | 0 | −1 | 49.9 | 55.1 | 66.2 |
| 26 | 0 | 0 | 0 | 0 | +1 | 50.8 | 56.1 | 67.3 |
| Fuel Type | The Seasonal Average Efficiency | Unit Prices Oz (EUR/kWh) | ||||
|---|---|---|---|---|---|---|
| ƞH,g | ƞH,e | ƞH,d | ƞH,s | ƞH,tot | ||
| Natural gas | 0.94 | 0.89 | 0.96 | 1.00 | 0.80 | 0.0687 |
| Heating oil | 0.94 | 0.89 | 0.96 | 1.00 | 0.80 | 0.0344 |
| Coal | 0.82 | 0.89 | 0.96 | 1.00 | 0.70 | 0.0336 |
| Biomass | 0.70 | 0.89 | 0.96 | 1.00 | 0.62 | 0.0345 |
| Electricity | 0.99 | 0.89 | 1.00 | 1.00 | 0.93 | 0.1265 |
| Lodz (III Climate Zone of Poland) | Szczecin (I Climate Zone of Poland) | Zakopane (V Climate Zone of Poland) | |
|---|---|---|---|
| θi(°C) | 20 | 20 | 20 |
| θe (°C) | −20 | −16 | −24 |
| θe*) (°C) | −1.0 | −0.2 | −3.0 |
| Energy Carrier | Emission Factor WEH,CO2 [30,31] | Building Location | |||||
|---|---|---|---|---|---|---|---|
| Szczecin | Lodz | Zakopane | |||||
| Final Energy Savings ΔOk,H When Changing Requirements: from: 2014 to 2017 2017 to 2021 | Emission Reduction ΔECO2 | Final Energy Savings ΔOk,H When Changing Requirements: from: 2014 to 2017 2017 to 2021 | Emission Reduction ΔECO2 | Final Energy Savings ΔOk,H When Changing Requirements: from: 2014 to 2017 2017 to 2021 | Emission Reduction ΔECO2 | ||
| (kgCO2/GJ or MgCO2/MWh) | (GJ/Year or MWh/Year) | (kgCO2/Year) | (GJ/Year or MWh/Year) | (kgCO2/Year) | (GJ/Year or MWh/Year) | (kgCO2/Year) | |
| Natural gas (in GJ/year) | 57.6 | 4.52 | 260.35 | 4.79 | 275.9 | 5.82 | 335.23 |
| 5.12 | 294.91 | 5.81 | 334.66 | 6.98 | 402.05 | ||
| Heating oil (in GJ/year) | 77.4 | 4.52 | 349.85 | 4.79 | 370.75 | 5.82 | 450.47 |
| 5.12 | 396.29 | 5.81 | 449.69 | 6.98 | 540.25 | ||
| Coal (in GJ/year) | 97.5 | 5.16 | 503.10 | 5.47 | 533.33 | 6.65 | 648.38 |
| 5.85 | 570.38 | 6.64 | 647.4 | 7.98 | 778.05 | ||
| Biomass (in GJ/rok) | 112 | 5.83 | 652.96 | 6.18 | 692.16 | 7.51 | 841.12 |
| 6.61 | 740.32 | 7.50 | 840 | 9.01 | 1009.12 | ||
| 0 1 | 5.83 | 0 | 6.18 | 0 | 7.51 | 0 | |
| 6.61 | 0 | 7.5 | 0 | 9.01 | 0 | ||
| Electricity (in MWh/year) | 0.765 | 1.08 | 826.2 | 1.14 | 872.1 | 1.39 | 1063.35 |
| 1.22 | 933.3 | 1.39 | 1063.35 | 1.67 | 1277.55 | ||
| Energy Carrier | Emission Factor WEH [31,32,33] | Building Location | ||||||
|---|---|---|---|---|---|---|---|---|
| Szczecin | Lodz | Zakopane | ||||||
| Emission Reduction ΔE (g/Year) When Changing Requirements from: 2014 to 2017 2017 to 2021 | ||||||||
| SO2 | NOx | SO2 | NOx | SO2 | NOx | SO2 | NOx | |
| Natural gas | 0.5 g/GJ | 50 g/GJ | 2.26 | 226 | 2.40 | 239.5 | 2.91 | 291 |
| 2.56 | 256 | 2.91 | 290.5 | 3.49 | 349 | |||
| Heating oil | 140 g/GJ | 70 g/GJ | 632.8 | 316.4 | 670.6 | 335.3 | 814.8 | 407.4 |
| 716.8 | 358.4 | 813.4 | 406.7 | 977.2 | 488.6 | |||
| Coal | 450 g/GJ | 165 g/GJ | 2322 | 851.4 | 2461.5 | 902.55 | 2992.5 | 1097.25 |
| 2632.5 | 965.25 | 2988 | 1095.6 | 3 591 | 1316.7 | |||
| Biomass | 11 g/GJ | 91 g/GJ | 64.13 | 530.53 | 67.98 | 562.38 | 82.61 | 683.41 |
| 72.71 | 601.51 | 67.98 | 562.38 | 99.11 | 819.91 | |||
| Electricity | 0.681 kg/MWh | 0.631 kg/MWh | 735.48 | 681.48 | 776.34 | 719.34 | 946.59 | 877.09 |
| 830.82 | 769.82 | 946.59 | 877.09 | 1137.27 | 1053.77 | |||
| θsi (°C) | |||
|---|---|---|---|
| Variant I | Variant II | Variant III | |
| θi = 20 °C; θe = −20 °C | 17.58 | 17.78 | 18.05 |
| θi = 20 °C; θe = −1 °C | 18.73 | 18.84 | 18.98 |
| θi = 20 °C; θe = −16 °C | 17.82 | 18.00 | 18.25 |
| θi = 20 °C; θe = −0.2 °C | 18.78 | 18.88 | 19.02 |
| θi = 20 °C; θe = −24 °C | 17.34 | 17.56 | 17.86 |
| θi = 20 °C; θe = −3 °C | 18.61 | 18.73 | 18.88 |
| θsi (°C) | |||
|---|---|---|---|
| Variant I | Variant II | Variant III | |
| θi = 20 °C; θe = −20 °C | 18.06 | 18.23 | 18.50 |
| θi = 20 °C; θe = −1 °C | 18.98 | 19.07 | 19.21 |
| θi = 20 °C; θe = −16 °C | 18.26 | 18.41 | 18.65 |
| θi = 20 °C; θe = −0.2 °C | 19.03 | 19.11 | 19.24 |
| θi = 20 °C; θe = −24 °C | 17.87 | 18.06 | 18.35 |
| θi = 20 °C; θe = −3 °C | 18.89 | 18.98 | 19.14 |
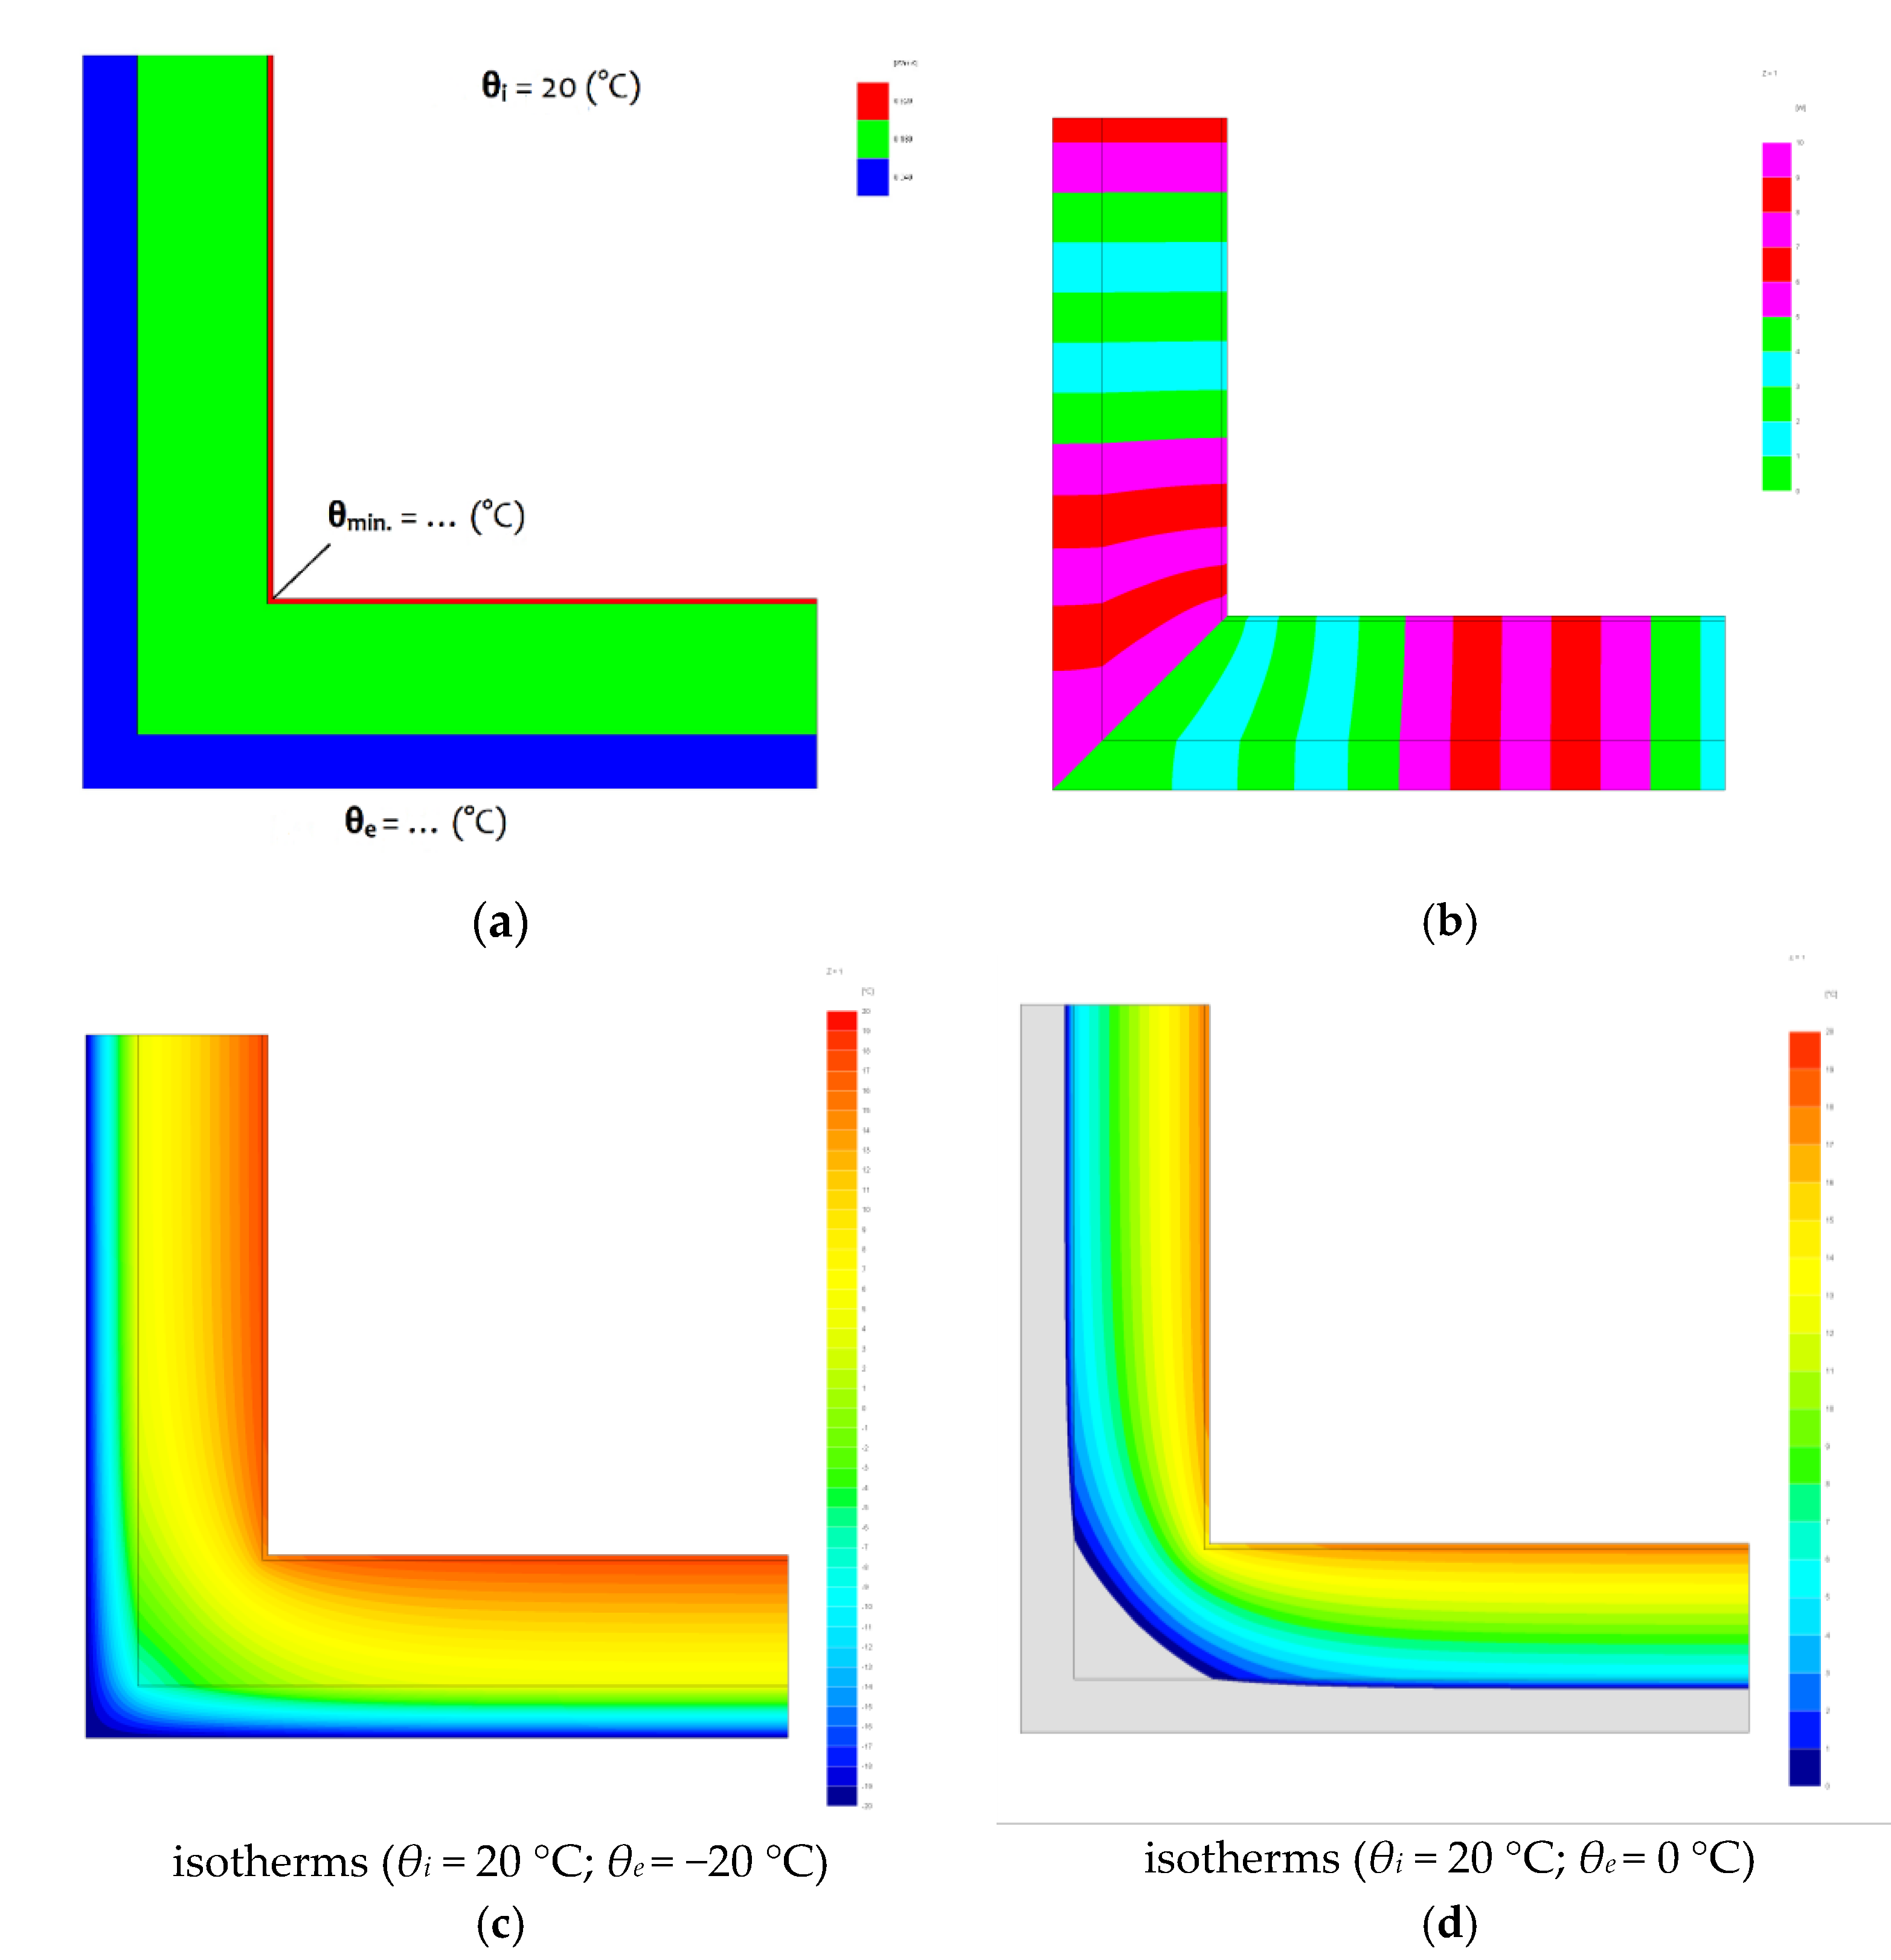
| θmin (°C) | |||
|---|---|---|---|
| Variant I | Variant II | Variant III | |
| θi = 20 °C; θe = −20 °C | 14.56 | 14.56 | 15.38 |
| θi = 20 °C; θe = −1 °C | 17.14 | 17.14 | 17.58 |
| θi = 20 °C; θe = −16 °C | 15.10 | 15.10 | 15.84 |
| θi = 20 °C; θe = −0.2 °C | 17.25 | 17.25 | 17.67 |
| θi = 20 °C; θe = −24 °C | 14.01 | 14.01 | 14.92 |
| θi = 20 °C; θe = −3 °C | 16.87 | 16.87 | 17.34 |
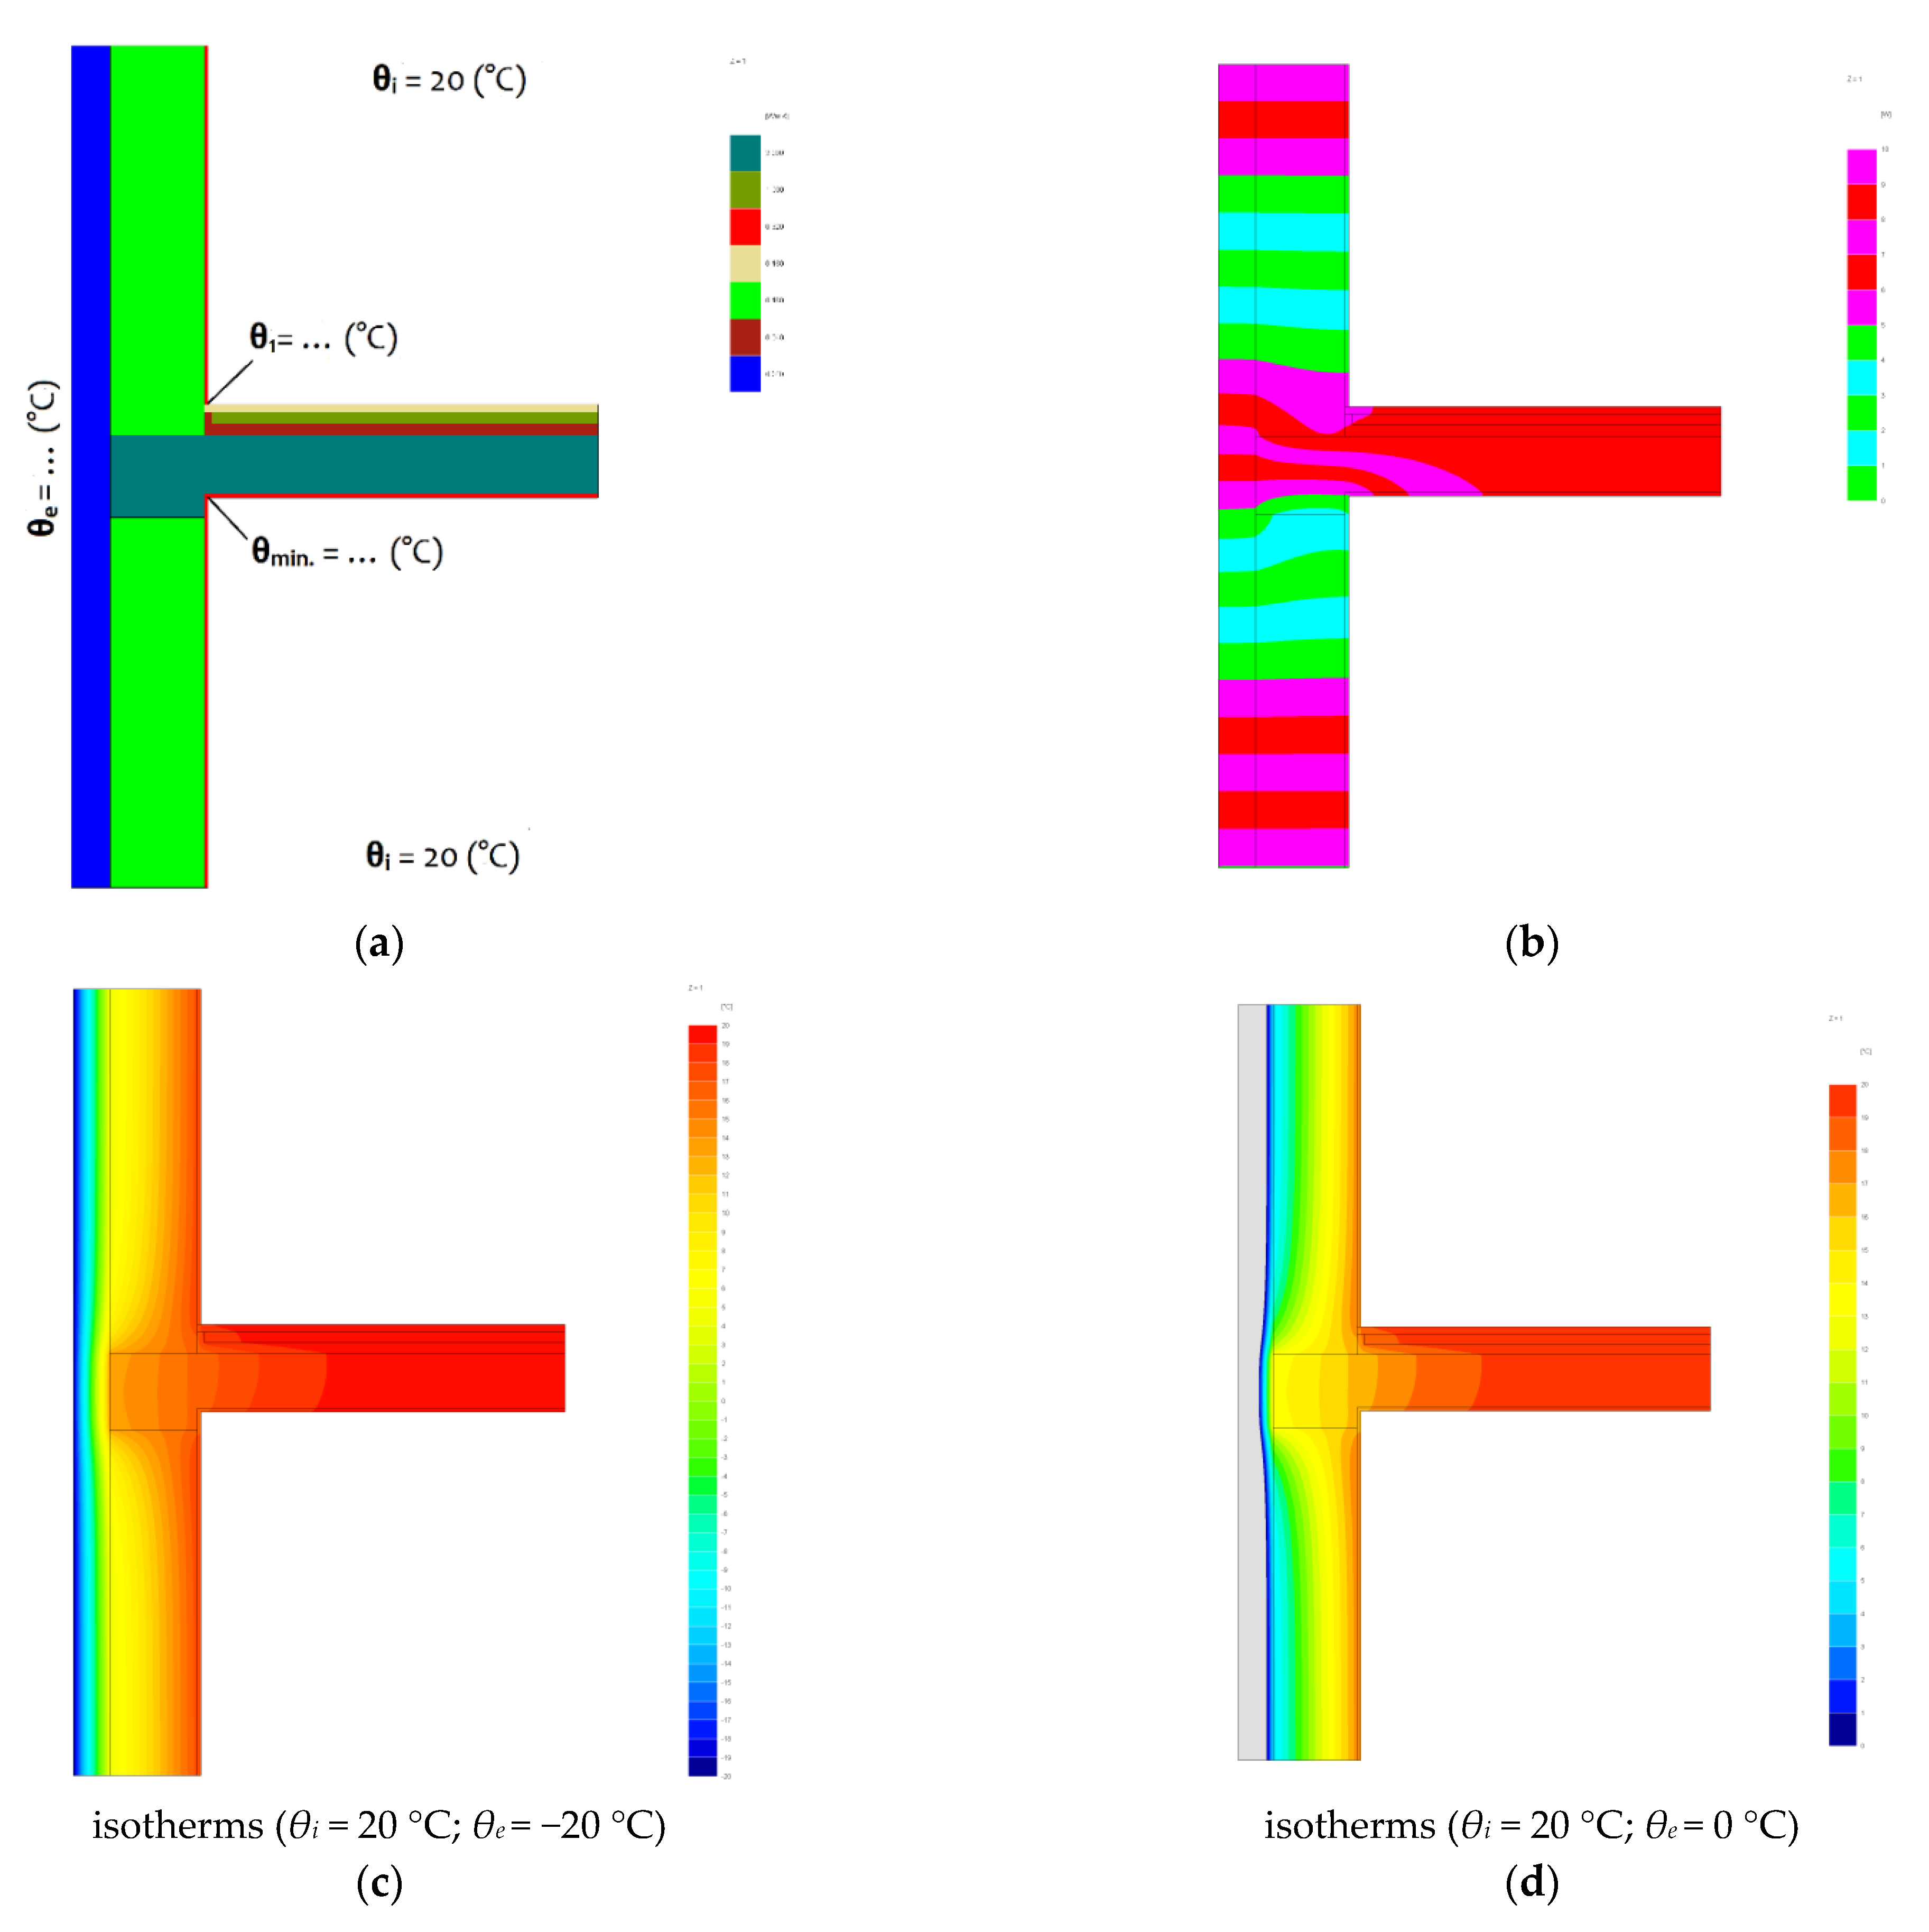
| θmin (°C)/θ1 (°C) | |||
|---|---|---|---|
| Variant I | Variant II | Variant III | |
| θi = 20 °C; θe = −20 °C | 16.55/18.03 | 16.89/18.21 | 17.33/18.46 |
| θi = 20 °C; θe = −1 °C | 18.19/18.96 | 18.37/19.06 | 18.60/19.19 |
| θi = 20 °C; θe = −16 °C | 16.89/18.22 | 17.20/18.39 | 17.59/18.61 |
| θi = 20 °C; θe = −0.2 °C | 18.26/19.00 | 18.43/19.10 | 18.65/19.22 |
| θi = 20 °C; θe = −24 °C | 16.20/17.83 | 16.58/18.03 | 17.06/18.30 |
| θi = 20 °C; θe = −3 °C | 18.02/18.86 | 18.21/18.97 | 18.46/19.11 |
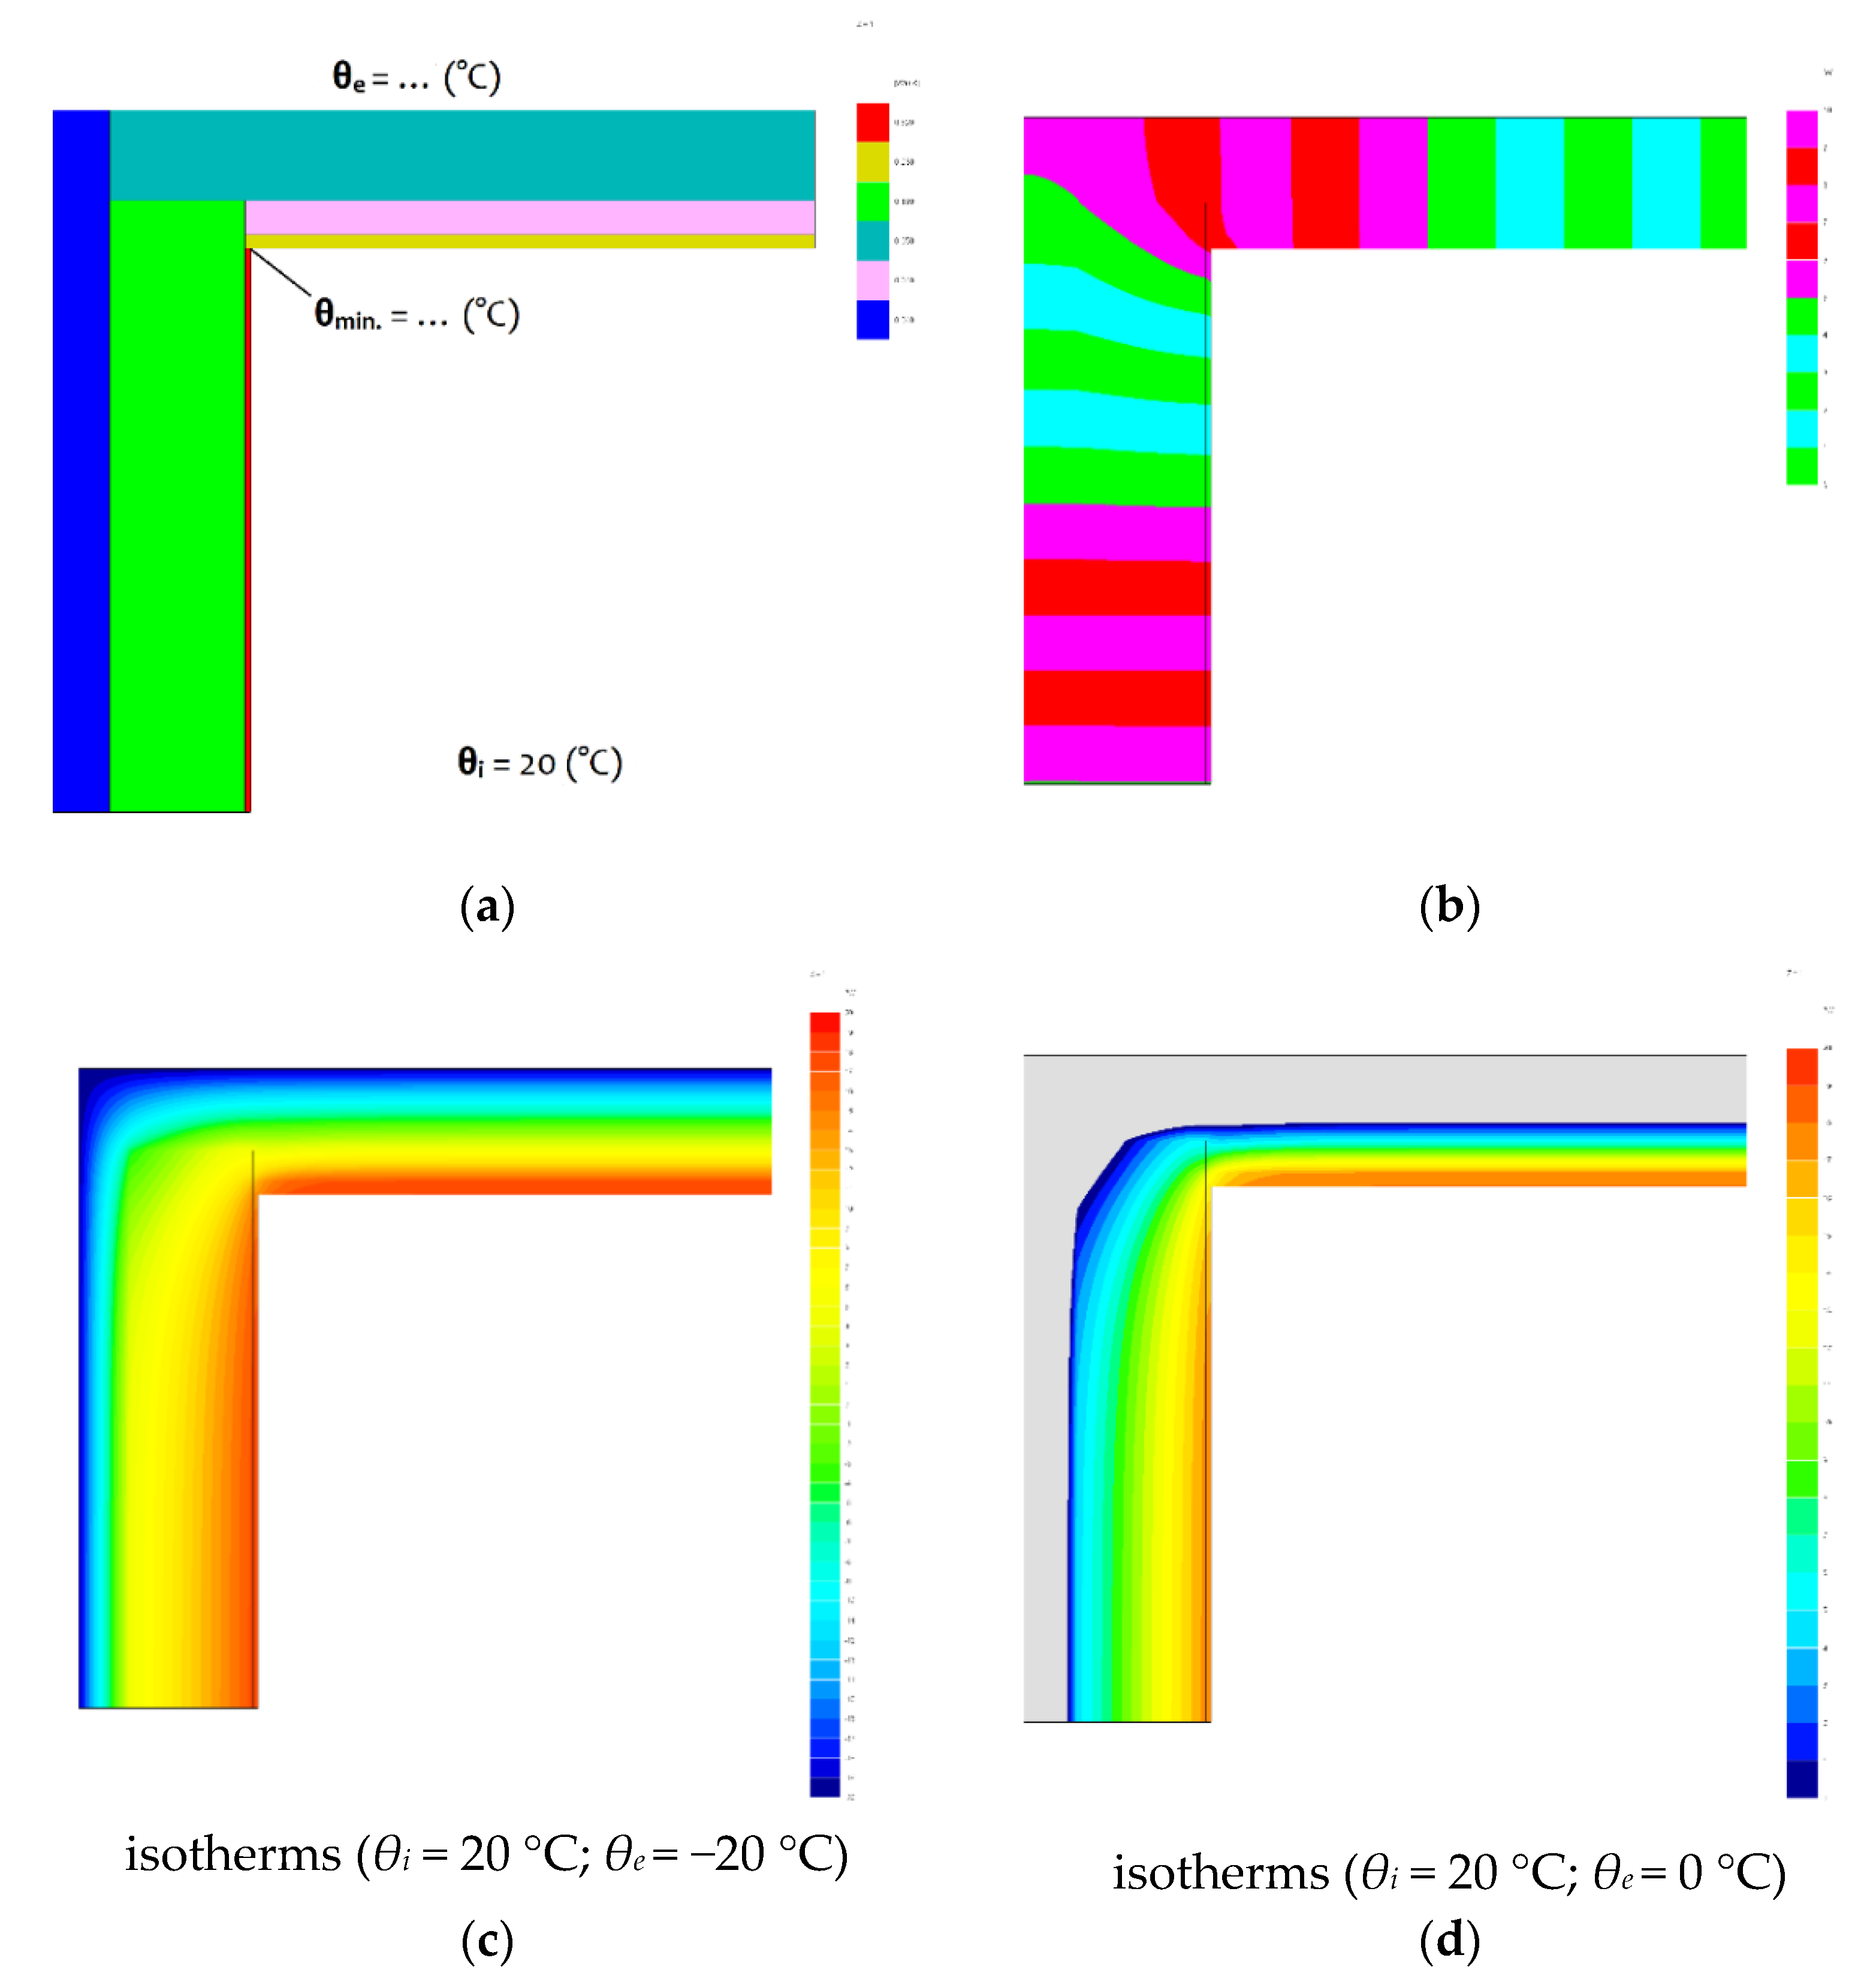
| θmin (°C) | |||
|---|---|---|---|
| Variant I | Variant II | Variant III | |
| θi = 20 °C; θe = −20 °C | 14.48 | 14.63 | 14.89 |
| θi = 20 °C; θe = −1 °C | 17.10 | 17.18 | 17.32 |
| θi = 20 °C; θe = −16 °C | 15.03 | 15.17 | 15.40 |
| θi = 20 °C; θe = −0.2 °C | 17.21 | 17.29 | 17.42 |
| θi = 20 °C; θe = −24 °C | 13.93 | 14.10 | 14.38 |
| θi = 20 °C; θe = −3 °C | 16.83 | 16.91 | 17.06 |
Publisher’s Note: MDPI stays neutral with regard to jurisdictional claims in published maps and institutional affiliations. |
© 2020 by the authors. Licensee MDPI, Basel, Switzerland. This article is an open access article distributed under the terms and conditions of the Creative Commons Attribution (CC BY) license (http://creativecommons.org/licenses/by/4.0/).
Share and Cite
Jezierski, W.; Sadowska, B.; Pawłowski, K. Impact of Changes in the Required Thermal Insulation of Building Envelope on Energy Demand, Heating Costs, Emissions, and Temperature in Buildings. Energies 2021, 14, 56. https://doi.org/10.3390/en14010056
Jezierski W, Sadowska B, Pawłowski K. Impact of Changes in the Required Thermal Insulation of Building Envelope on Energy Demand, Heating Costs, Emissions, and Temperature in Buildings. Energies. 2021; 14(1):56. https://doi.org/10.3390/en14010056
Chicago/Turabian StyleJezierski, Walery, Beata Sadowska, and Krzysztof Pawłowski. 2021. "Impact of Changes in the Required Thermal Insulation of Building Envelope on Energy Demand, Heating Costs, Emissions, and Temperature in Buildings" Energies 14, no. 1: 56. https://doi.org/10.3390/en14010056
APA StyleJezierski, W., Sadowska, B., & Pawłowski, K. (2021). Impact of Changes in the Required Thermal Insulation of Building Envelope on Energy Demand, Heating Costs, Emissions, and Temperature in Buildings. Energies, 14(1), 56. https://doi.org/10.3390/en14010056