Abstract
Voltage dips represent a significant power quality problem. The main cause of voltage dips and short-term interruptions is an electrical short circuit that occurs in transmission or distribution networks. Faults in the power system are stochastic by nature and the main cause of voltage dips. As faults in the transmission system can affect more customers than faults in the distribution system, to reduce the number of dips, it is not enough to invest in a small part of the transmission or distribution system. Only targeted investment in the whole (or a large part of the) power system will reduce voltage dips. Therefore, monitoring parts of the power system is very important. The ideal solution would be to cover the entire system so that a power quality (PQ) monitor is installed on each bus, but this method is not economically justified. This paper presents an advanced method for determining the optimal location and the optimal number of voltage dip measuring devices. The proposed algorithm uses a monitor reach area matrix created by short-circuit simulations, and the coefficient of the exposed area. Single-phase and three-phase short circuits are simulated in DIgSILENT software on the IEEE 39 bus test system, using international standard IEC 60909. After determining the monitor reach area matrix of all potential monitor positions, the binary bat algorithm with a coefficient of the exposed area of the system bus is used to minimize the proposed objective function, i.e., to determine the optimal location and number of measuring devices. Performance of the binary bat algorithm is compared to the mixed-integer linear programming algorithm solved by using the GNU Linear Programming Kit (GLPK).
1. Introduction
Power quality (PQ) covers a wide range of electricity characteristics such as voltage fluctuations, voltage dips, interruptions of electricity supply, harmonics, flickers, voltage symmetry, frequency changes, etc. PQ measuring and monitoring devices are used to measure and monitor power quality and they are the first step in detecting and eliminating power quality problems. The issue of power quality and PQ measuring and identification is the subject of numerous scientific studies such as [1,2,3]. The ideal case would be if PQ measuring and monitoring devices were installed on every bus in the observed system. Due to limited resources, the goal is to cover the power system with the smallest possible number of monitors [4]. In accordance with the above, it is necessary to develop an optimization method that will determine the optimal number and location of PQ measuring and monitoring devices (metering devices). Criteria for the optimal location of metering devices can be different aspects of power quality, and in this paper, voltage dips are taken into consideration.
Olguin and Bollen [5] introduced a concept for determining the optimal location and number of metering devices for voltage dip measurement based on the Monitor Reach Area (MRA). The method presented is developed for a transmission system. The proposed model was tested on a simplified model of the Colombian National Interconnected Transmission System 230 kV and 500 kV. Only three-phase short circuits were used to form the voltage dip matrix. In [5], the authors also point out that there is more than one optimal solution in the search space that gives the same value to the objective function. In [4], the simplified transmission system proposed in [5] is used for optimal placement of voltage dip monitoring devices and the binary optimization problem is formed and solved by using the branch and bound method. Additionally, a genetic algorithm is used to search the solution space in order to find other optimal solutions. As a result, 35 different optimal solutions were found, which met the set constraints and allowed the whole system to be covered for a voltage threshold of 0.9 p.u. with eight voltage dip measuring devices. In [6], the authors used simulation results of 3908 single-phase short circuits in a grounded network to form a monitor reach area. They used a genetic algorithm to determine the optimal number and location of devices for voltage dip monitoring. Haghbin and Farjah [7] proposed the use of a fuzzy matrix of the monitor reach area and a genetic algorithm to determine the optimum number and location of voltage dip measuring devices, which was successfully tested on the IEEE 118 bus test system. Ibrahim et al. [8] used a monitor reach area matrix to determine the optimum location and number of meters in the IEEE 34 test system. A genetic algorithm was used to solve the optimization problem. To better determine the best location, the authors introduced the sag severity index. This index is defined as the ratio of the sum of the phases at which a voltage drops below 0.9 p.u. and the total number of phases in the system. García-Martínez et al. [9] used the monitor reach area matrix to determine the optimal location and number of voltage dip measuring devices in the IEEE 57 bus test system by using the Tabu Search algorithm. They used symmetrical and non-symmetrical short circuits with a voltage threshold value ranging from 0.5 to 0.9 p.u. The branch and bound method was used in [10] to solve the problem of optimal placement and the optimal number of measuring devices in the IEEE 30 bus test system, taking into account the severity index of voltage dips.
In this paper, the bat algorithm is used to solve the optimization problem of voltage dip measuring device placement. The metaheuristic bat algorithm, based on the echolocation behavior of bats, was proposed in 2010 by Yang [11]. As the bat algorithm has proven to be a good meta-heuristic method for solving real-world optimization problems, various authors have proposed methods for its improvement [12]. Sravanthi and Karthikaikannan [13] used a bat algorithm to optimally dispose of reactive power with the aim of reducing active power losses in the transmission system. The method was tested on the IEEE 14 and IEEE 57 bus test systems. Adarsh et al. [14] used a chaotic bat algorithm to solve the economic dispatching problem with the goal of optimally allocating generating units to reduce costs. The authors also concluded that the chaotic bat algorithm is capable of solving large-scale problems with several constraints and can be successfully applied to other power system optimization problems. Shukla and Singh [15] also solved the problem of economic dispatching, but unlike [14], they suggested using pseudocode for a chaotic bat algorithm to solve problems while satisfying optimization constraints. The simulation results showed that pseudocode of the chaotic bat algorithm produces better results compared to the chaotic bat algorithm which uses a penalty function. Rao and Kumar [16] proposed the use of bat algorithms to determine optimal power flows in the presence of a unified power flow controller. Khooban and Niknam [17] proposed a hybrid method consisting of a Self-Adaptive Modified Bat Algorithm and Fuzzy Logic to solve the load frequency control problem. Ali [18] suggested using a bat algorithm to optimally design power system stabilizers in a multi-machine environment with the aim of minimizing system oscillations due to changes in load and interference. The optimal arrangement of phasor measurement units was successfully solved by applying the binary bat algorithm hybridized with the Taguchi method in [19].
Ravindra and Rao [20] proposed an upgraded binary bat algorithm for the optimal location of phasor measuring units. By using the bat algorithm, Yang and Le [21] successfully solved the problem of power quality by optimizing the design of a passive power filter, with the aim of suppressing critical harmonics and improving power factors. The bat algorithm has also been used to determine the optimal power of energy storage when using renewable energy sources in [22] and the optimal location of solar photovoltaic systems in the distribution network [23]. The bat algorithm was used to monitor maximum power point tracking of a photovoltaic system under partial shading conditions in [24]. The fact that the bat algorithm was successful in many above-mentioned power system applications motivated us to try the bat algorithm in this problem as well. As the optimization problem defined in this paper is binary, the binary bat algorithm (BBA) introduced in [25] is used to solve it. BBA is chosen since it shows good performance in comparison with other heuristic algorithms such as the genetic algorithm (GA) and particle swarm optimization (PSO), which is proven in [25]. The authors of paper [25] compared the performance of the BBA with binary PSO and GA in a comparative study over twenty-two benchmark functions. In addition, Wilcoxon’s rank-sum nonparametric statistical test was carried out in [25] at 5% significance level to judge the results of the comparative study in a statistically significant way. Based on the comparative study results, the authors of [25] claim “The results prove that the proposed binary bat algorithm (BBA) can significantly outperform others on the majority of the benchmark functions.”
The concept of the monitor reach area is also adopted in this paper. It is expanded by using the coefficients of the exposed area introduced in [26]. A new objective function for minimizing the number of voltage dip measuring devices is introduced in this paper. The proposed method is capable of taking into consideration both three-phase and single-phase to ground short circuits. The IEEE 39 bus test system is used to verify the proposed method. A monitor reach area matrix is created by short-circuit simulations (three-phase and single-phase) using DIgSILENT software (Version 2018, DIgSILENT GmbH, Gomaringen, Germany), and coefficients of the exposed area are calculated. The binary bat algorithm is used to minimize the number of measuring devices and determine their optimal locations. Performance of the binary bat algorithm is compared to the mixed-integer linear programming algorithm solved using the GNU Linear Programming Kit. The main contributions of this study can be summarized as follows:
- Introduction of a new objective function including constraints (optimization problem) for determining the optimal number and location of voltage dip measuring devices.
- Application of the binary bat algorithm for solving the proposed optimization problem.
- Verification of the proposed optimization methodology by the traditional mixed-integer linear programming algorithm.
The structure of this study is as follows: firstly, a detailed description of the developed optimization methodology for determining the optimal number and location of voltage dip monitors is presented in Section 2. A procedure for solving the proposed optimization problem by the binary bat algorithm is described in detail in Section 3. In Section 4, a case study containing a IEEE 39 bus test system is presented and the optimal number and location of voltage dip monitors are calculated. Additionally, solutions are compared for the optimal location and number of devices for measuring voltage dips obtained by the binary bat algorithm and mixed-integer linear programming.
2. Method for the Optimal Number and Location of Power Quality Monitors
2.1. The Existing Method Based on the Monitor Reach Area
The Monitor Reach Area (MRA) provides an area of the network that can be viewed from a specific monitor position. By definition in [5], if the fault is inside the MRA, then the event will trigger a voltage dip meter, otherwise it will not. The part of the network that can be observed using a monitor installed at node k can be considered as an area containing node k and its electrical neighborhood. The size of this range mainly depends on the setting of the monitor voltage threshold p and it is called a p-monitor reach area for node k. An alternative way of describing the monitor reach area of all potential monitor positions is to use a binary matrix called MRAp whose size is equal to an N x N–system busbar number with –as the fault position, where is the input voltage of the voltage dip matrix [27].
This means that if a matrix element is equal to 1, a short circuit on busbar j will cause a voltage dip on busbar i.
When the voltage dip matrix is formed, the optimization problem can be defined. The observed binary vector X of length N (the number of system buses) indicates the need to install a measuring device on the system bus. As indicated in Equation (2), the elements of X are . The vector X is called the monitor position vector. According to [27], the value of the monitor position vector indicates where the monitors are installed:
The number of monitor reach areas containing the fault position j is determined by the product of a given value of the monitor position vector X with a given column j of the MRAp matrix, Equation (4). The product must be greater than 1 or equal to 1 for each fault position. As it is necessary that at least one monitor is activated on each fault, every fault has to be within at least one monitor reach area.
According to [27], the optimization problem is represented by Equation (3).
with constraints defined by Equation (4):
where N, mraj, bj, and xi are the number of potential monitor positions (system buses), the (i,j) entrance from MRAp, the j-th input of the unity vector b, and a binary number (0 or 1), respectively. The resulting optimization problem is an integer programming problem [5,27].
2.2. Exposed Area
The above-mentioned reach area of the monitor installed on bus k is the exactly exposed area of that bus for the same voltage threshold.
The exposed area includes buses and lines where the appearance of a short circuit causes lower voltages than the voltage threshold set on the observed bus [5]. As it is easier to explain the exposed area graphically, it is presented in Figure 1. The smaller area covered by the curve represents the area where the occurrence of a short circuit will cause a voltage dip value on bus 2 to be lower than the voltage threshold set at 0.5 p.u. The larger area represents the same, but for a voltage threshold of 0.7 p.u.

Figure 1.
The exposed area of bus 2 for voltage thresholds of 0.5, 0.7 and 0.9 p.u.
In practice, the exposed areas are compared only qualitatively; however, this method of comparison is not accurate because system buses do not have the same level of sensitivity and system lines have different lengths. To solve the problem of comparing exposed areas, Klaić [26] proposed the use of the weighted coefficient of the exposed area shown in Equation (5).
Equation (6) gives the length of the lines in the exposed area:
where the exposed length of the area, is the sum of the exposed lengths of lines Lcrit,ki in the area, and Equation (7) gives the total length of lines in the system, :
where Lj is the individual length of the line j.
Then the weighted coefficient of the exposed area can be represented by Equation (8):
where k is the bus for which the exposed area is calculated, n is the total number of lines, m is the number of lines in the exposed area, and is the voltage threshold value of the exposed area.
The smaller the number of weighted coefficients of the exposed area, the more robust the bus is, that is, the failure of a small percentage of the length of lines will cause the residual voltage on the bus to be less than a certain limiting voltage of 0.9 p.u.
2.3. Proposed Objective Function
After determining the monitor reach area matrix of all potential monitor positions and the coefficient of the exposed area, it is necessary to determine the objective function. In order to determine the optimal number of measuring devices, it will be necessary to minimize the objective function. In [20], phasor measuring units are used, which are devices that measure bus voltage and current phasors. In [20], the connection matrix is built ion the principle that a measuring device on the observed bus only covers its electrical neighborhood. The objective function from the aforementioned paper will be improved because the monitor reach area and the weighted ratio of the exposed area are used here to determine the optimal location of voltage dip monitor devices. The objective function used in this paper is given by Equation (9):
where xi is a system bus (with value 0 or 1), and ki are weighted coefficients of the exposed area, with the constraints given by Equation (4). So, the first part of the objective function (9) presents the optimal number and location of buses where the monitors should be placed, and the second part ensures that an optimal solution is to be selected among multiple solutions.
2.4. Bat Algorithm
The bat algorithm proposed by Yang [11] has proven to be a better optimization method for solving certain problems, when compared to algorithms such as the genetic algorithm and particle swarm optimization. However, the original bat algorithm cannot solve binary problems. In order to be able to use the bat algorithm for solving the binary optimization problem of the optimal location and number of voltage dip measuring devices, it is necessary to use the binary version of the bat algorithm proposed in [25] by Mirjalili et al. In the binary bat algorithm, artificial bats explore and hunt prey in the binary space, searching by changing the position from “0” to “1”, which requires a change in the position and speed update of the standard bat algorithm. The change required can be applied by introducing a transfer function, which will “force” the particles to move in the binary space. According to [28], the best transfer function to solve this problem is the V-shaped transfer function given in Equation (10).
where is the velocity of the i-th particle at iteration t. The V-shaped transfer function is shown in Figure 2.

Figure 2.
V-shaped transfer function.
New rules for updating the position are given by Equation (11):
is the position of the i-th particle at iteration t.
3. Methodology for Solving the Proposed Optimization Model
Figure 3 represents a flowchart for determining the optimal location and number of measuring devices. Based on the data on the residual bus voltage due to short circuits simulated in DIgSILENT PowerFactory, a binary MRA matrix is formed according to expression (1). A unit vector b is also introduced, which ensures that each fault will be detected by at least one voltage dip measuring device, i.e., it ensures coverage of the entire system.

Figure 3.
Flowchart for determining the optimal location and the number of dip monitors.
In the next step, devices for measuring voltage dips are randomly placed on system busbars and the weighted coefficients of the exposed area obtained by expression (8) are added thereto.
This is followed by the initialization of the bat population, when their pulse emission rate and loudness are adjusted. After the above steps of the algorithm, system coverage is checked, i.e., it is checked whether the limits ensuring the coverage of each fault in the system simulated in the DIgSILENT program are met. If the coverage of the entire system is not achieved, the algorithm returns to the step when the voltage dip measuring device is placed randomly on system buses. If system coverage is achieved, the algorithm continues to search for an optimal solution, i.e., it tries to minimize the objective function and initialize the bat memory matrix, so that the previous best solutions can be compared with new solutions generated by random flight and by searching for binary space solutions achieved by expressions (13) and (14).
After initializing the bat memory matrix, the created random flight solutions are compared with the existing solutions in the bat memory. If the pulse rate at a new bat position is higher, the best solutions are selected from randomly generated ones and new solutions continue to be created by random flight. In the next step, the objective function of all bats is calculated. The objective functions are compared according to the loudness of the bat and the values of the target function themselves. When a bat detects prey, it decreases the loudness and increases the pulse rate.
If new solutions are better, they are accepted and the best solution is updated. Otherwise, the previous best solution is retained and the row matrix of bats is sorted. New solutions are created by adjusting the position, the pulse rate and velocity of the bat. In the next step, system coverage is checked; if the conditions are met, it is checked whether a certain maximum number of iterations has been reached. If the maximum number of iterations is not reached, the newly created solutions are compared with the solutions in the bat memory matrix where they are checked against the loudness and value of the objective function. If the maximum number of iterations is reached, the best solution is printed.
4. Verification and Testing of the Proposed Method by Using the IEEE 39 Buses Test System
The monitor reach area was created by simulating three-phase and single-phase short circuits on the IEEE 39 bus test system according to IEC 60909. The IEEE 39 bus transmission system in the DIgSILENT PowerFactory software package is a simplified model of the New England high voltage transmission system. In the IEEE 39 bus system, there are four voltage levels: 345 kV, 230 kV (bus 20), 138 kV (bus 12), and 16.5 kV (buses 30–38). The system consists of 10 generators, 12 double-ended transformers, 34 lines and 19 loads.
For the monitor reach area matrix used in this paper, only short circuits on buses were used as a search area for the binary bat algorithm, and the effect of line faults was added by the exposed area weighted coefficient described in Section 2.2 of this paper. The results of the proposed binary bat algorithm were tested using the GNU Linear Programming Kit (GLPK). GLPK is a set of routines written in the ANSI C programming language and organized in an invocable library format. It is intended for solving linear programming, mixed-integer programming and other related problems [29]. For GLPK, a short circuit was used on every 1% of line length and on system buses.
4.1. Optimal Location of Measuring Devices for Three-Phase Short Circuits
The weighted coefficient of the exposed area was calculated from the simulation results of three-phase short circuits on every 1% of line length; 3405 simulations of three-phase short circuits on lines and system buses were performed and results were used to form a monitor reach area for GLPK. The weighted ratio of the exposed area for the IEEE 39 bus test system is given in Table 1.

Table 1.
The weighted coefficient of the exposed area for the IEEE 39 bus test system.
Figure 4 shows the convergence curve for the optimal number and location of voltage dip devices for three-phase short circuits. Table 2 gives a comparison of the result obtained by the binary bat algorithm and GLPK. The optimal solution is achieved in 145 iterations with a value of 7. This value is composed of the optimal voltage dip monitor number (in this case, the number is 5) and of the exposed area coefficient sum (in this case, the sum is 2), Table 2. So, the binary bat algorithm gives the optimal location on busbars 2, 6, 27, 34 and 36. GLPK also gives an optimal number of 5 voltage dip monitors, but for buses 2, 8, 20, 27 and 36.

Figure 4.
Convergence curve for an optimal number and location of voltage dip devices for three-phase short circuits.
Table 2.
Comparison of the results obtained by the binary bat algorithm and GLPK.
According to [4], there is more than one optimal solution in the search space of the monitor reach area. When the optimal location of voltage dip monitors achieved by the binary bat algorithm was entered in GLPK, the result showed that the solution is correct.
4.2. Optimal Location of Measuring Devices for Single-Phase Short Circuits
The weighted coefficient of the exposed area was calculated from the simulation results of single-phase short circuits on every 1% of line length; 3369 simulations of single-phase short circuits on lines and system buses were performed and results were used to form a monitor reach area for GLPK. The IEEE 39 bus test system has 12 double-wound transformers connected in YNy connection. Namely, with a single-phase short circuit occurring at a high voltage level on a YNy transformer, a voltage dip will not occur at a low voltage level.
Additionally, if a short circuit specifically occurs at a low voltage level, it will not cause a voltage dip to occur at a high voltage level. Figure 5 shows DIgSILENT simulations of a single-phase short circuit on bus 19 connected to the primary side of the transformer Trf 19–20 and a single-phase short circuit on bus 20 connected to the secondary side of that transformer.
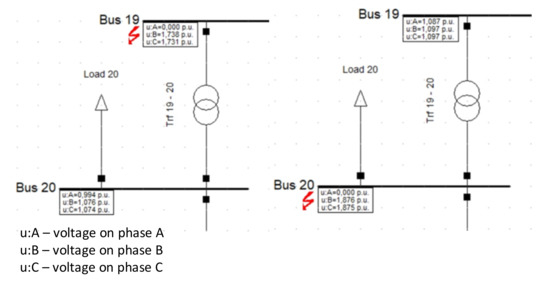
Figure 5.
A single-phase short circuit at buses 19 and 20, which are connected by transformer Trf 19–20 in YNy connection.
This fact will affect the optimal number and location of voltage dip measuring devices. All buses connected to the secondary side of transformers will require a voltage dip measuring device in order to achieve coverage of the entire IEEE 39 bus test system. Buses 12, 20 and 30 to 38 are connected to secondary sides of transformers in the IEEE 39 bus test system.
Figure 6 gives the convergence curve for the optimal solution of the optimization problem for determining the optimal number and location of voltage dip measuring devices. The optimal solution for the optimal location and number of voltage dip measuring devices is achieved in 162 iterations. The value is 12.83. This value is obtained by adding the number of buses (12) to the total weighted coefficient (0.83). The total weighted coefficient is 0.83 because the weighted coefficient of buses connected to the secondary side of transformers is equal to zero.

Figure 6.
Convergence curve for a single-phase short circuit.
Table 3 gives a comparison of solutions for the optimal location and number of voltage dip measuring devices for single-phase short circuits. It can be seen in the table that all buses connected on the secondary side of transformers are part of the optimal solution. There is a need for one more bus to cover the entire IEEE 39 bus system during single-phase short circuit events. Using the binary bat algorithm and GLPK, this bus is 25 and 39, respectively. The result obtained by the binary bat algorithm was entered in GLPK and it was proved that it is an optimal solution.
Table 3.
Comparison of solutions for the optimal location and number of voltage dip measuring devices for single-phase short circuits.
5. Conclusions
A new objective function for minimizing the number of voltage dip measuring devices is introduced in this paper. The bat algorithm is used for solving the proposed optimization problem, and the method takes into consideration both three-phase short circuits and single-phase-to-ground short circuits. The binary bat algorithm is used to minimize the number of measuring devices and determine its optimal location. The IEEE 39 bus test system is used to verify the proposed method. The developed optimization method for determining the number and position of PQ monitors is intended for transmission system operators (TSOs) when planning the installation of PQ monitors in the transmission system. It enables minimization of monitor installation costs because the result of the method is a minimal number of PQ monitors that can register every voltage dip in the network. The developed method is tested using the IEEE 39 test system.
Performance of the binary bat algorithm was tested by the mixed-integer linear programming (MILP) algorithm and the results show that the proposed method can determine the optimal number and location of the voltage dip measuring device. In this particular problem, there is no advantage of the bat method compared to the MILP method. However, in situations where the underlying problem may just be too difficult for MILP, or there may be some user-imposed restriction on the amount of time that can be allowed to the MILP algorithm to run, there can still be a need to have the best possible feasible solution. In such a situation, a heuristic method has a better chance to provide a “valid” solution compared to MILP. A further step in applying the bat algorithm to optimal PQ monitor placement would be to compare bat algorithm performance to other heuristic methods (such as PSO, GA, etc.), and also to test the bath method using different test systems.
Author Contributions
Conceptualization, M.Š. and Z.K.; Formal analysis, M.Š.; Funding acquisition, Z.K.; Investigation, M.Š., Z.K. and K.F.; Methodology, E.K.N., M.Š. and Z.K.; Project administration, Z.K.; Resources, Z.K. and K.F.; Software, M.Š. and E.K.N.; Supervision, Z.K., K.F. and E.K.N.; Validation, K.F. and E.K.N.; Visualization, M.Š. and Z.K.; Writing—Original draft, M.Š., Z.K. and K.F.; Writing—Review and editing, K.F., Z.K. and E.K.N. All authors have read and agreed to the published version of the manuscript.
Funding
This research is funded by the “Smart Grid and Power Quality” research project funded by J.J. Strossmayer University of Osijek, Faculty of Electrical Engineering, Computer Science and Information Technology Osijek.
Institutional Review Board Statement
Not applicable.
Informed Consent Statement
Not applicable.
Data Availability Statement
Data sharing not applicable.
Conflicts of Interest
The authors declare no conflict of interest.
References
- Minh Khoa, N.; Van Dai, L. Detection and Classification of Power Quality Disturbances in Power System Using Modified-Combination between the Stockwell Transform and Decision Tree Methods. Energies 2020, 13, 3623. [Google Scholar] [CrossRef]
- Ucar, F.; Cordova, J.; Alcin, O.F.; Dandil, B.; Ata, F.; Arghandeh, R. Bundle Extreme Learning Machine for Power Quality Analysis in Transmission Networks. Energies 2019, 12, 1449. [Google Scholar] [CrossRef]
- Sha, H.; Mei, F.; Zhang, C.; Pan, Y.; Zheng, J. Identification Method for Voltage Sags Based on K-means-Singular Value Decomposition and Least Squares Support Vector Machine. Energies 2019, 12, 1137. [Google Scholar] [CrossRef]
- Olguin, G.; Vuinovich, F.; Bollen, M.H.J. An optimal monitoring program for obtaining voltage sag system indexes. IEEE Trans. Power Syst. 2006, 21, 378–384. [Google Scholar] [CrossRef]
- Olguin, G.; Bollen, M.H.J. Optimal Dips Monitoring Program for Characterization of Transmission System. In Proceedings of the 2003 IEEE Power Engineering Society General Meeting, Conference Proceedings, Toronto, ON, Canada, 13–17 July 2003; Volume 4, pp. 2484–2490. [Google Scholar]
- Mazlumi, K.; Askarian Abyaneh, H.; Gerivani, Y.; Rahimi Pordanjani, I. A new optimal meter placement method for obtaining a transmission system indices. In Proceedings of the 2007 IEEE Lausanne POWERTECH, Proceedings, Lausanne, Switzerland, 1–5 July 2007; pp. 1165–1169. [Google Scholar]
- Haghbin, M.; Farjah, E. Optimal placement of monitors in transmission systems using fuzzy boundaries for voltage sag assessment. In Proceedings of the 2009 IEEE Bucharest PowerTech: Innovative Ideas Toward the Electrical Grid of the Future, Bucharest, Romania, 28 June–2 July 2009. [Google Scholar]
- Ibrahim, A.A.; Mohamed, A.; Shareef, H.; Ghoshal, S.P. Optimal placement of voltage sag monitors based on monitor reach area and sag severity index. In Proceedings of the 2010 IEEE Student Conference on Research and Development—Engineering: Innovation and Beyond, SCOReD 2010, Putrajaya, Malaysia, 13–14 December 2010; pp. 467–470. [Google Scholar]
- García-Martínez, S.; Espinosa-Juárez, E.; Hernández, A. Analysis of system operation state influence on the optimal location of voltage sag monitors by applying Tabu search. In Proceedings of the North American Power Symposium 2010, NAPS 2010, Arlington, TX, USA, 26–28 September 2010. [Google Scholar]
- Ismail, R.; Said, D.M.; Ahmad, N.; Abdulah, M.P.; Hassan, M.Y.; Idris, A.O. Optimization Method for Voltage Sag Monitor Placement in Power System | Ismail | International Journal of Electrical Engineering and Applied Sciences (IJEEAS). Int. J. Electr. Eng. Appl. Sci. 2018, 1, 71–79. [Google Scholar]
- Yang, X.S. A new metaheuristic Bat-inspired Algorithm. In Studies in Computational Intelligence; Springer: Berlin/Heidelberg, Germany, 2010; Volume 284, pp. 65–74. ISBN 9783642125379. [Google Scholar]
- Jayabarathi, T.; Raghunathan, T.; Gandomi, A.H. The bat algorithm, variants and some practical engineering applications: A review. In Studies in Computational Intelligence; Springer: Berlin/Heidelberg, Germany, 2018; Volume 744, pp. 313–330. [Google Scholar]
- Sravanthi, C.; Karthikaikannan, D. Optimal Reactive Power Dispatch Using Directional Bat Algorithm. In Advances in Intelligent Systems and Computing; Springer: Berlin/Heidelberg, Germany, 2019; Volume 846, pp. 311–320. [Google Scholar]
- Adarsh, B.R.; Raghunathan, T.; Jayabarathi, T.; Yang, X.S. Economic dispatch using chaotic bat algorithm. Energy 2016, 96, 666–675. [Google Scholar] [CrossRef]
- Shukla, A.; Singh, S.N. Pseudo-inspired CBA for ED of units with valve-point loading effects and multi-fuel options. IET Gener. Transm. Distrib. 2017, 11, 1039–1045. [Google Scholar] [CrossRef]
- Venkateswara Rao, B.; Nagesh Kumar, G.V. Optimal power flow by BAT search algorithm for generation reallocation with unified power flow controller. Int. J. Electr. Power Energy Syst. 2015, 68, 81–88. [Google Scholar] [CrossRef]
- Khooban, M.H.; Niknam, T. A new intelligent online fuzzy tuning approach for multi-area load frequency control: Self Adaptive Modified Bat Algorithm. Int. J. Electr. Power Energy Syst. 2015, 71, 254–261. [Google Scholar] [CrossRef]
- Ali, E.S. Optimization of Power System Stabilizers using BAT search algorithm. Int. J. Electr. Power Energy Syst. 2014, 61, 683–690. [Google Scholar] [CrossRef]
- Basetti, V.; Chandel, A.K. Optimal PMU placement for power system observability using Taguchi binary bat algorithm. Meas. J. Int. Meas. Confed. 2017, 95, 8–20. [Google Scholar] [CrossRef]
- Ravindra, M.; Rao, R.S. An upgraded binary bat algorithm approach for optimal allocation of PMUs in power system with complete observability. Int. J. Adv. Appl. Sci. 2017, 4, 33–39. [Google Scholar] [CrossRef]
- Yang, N.C.; Le, M.D. Optimal design of passive power filters based on multi-objective bat algorithm and pareto front. Appl. Soft Comput. J. 2015, 35, 257–266. [Google Scholar] [CrossRef]
- Bahmani-Firouzi, B.; Azizipanah-Abarghooee, R. Optimal sizing of battery energy storage for micro-grid operation management using a new improved bat algorithm. Int. J. Electr. Power Energy Syst. 2014, 56, 42–54. [Google Scholar] [CrossRef]
- Sudabattula, S.K.; Kowsalya, M. Optimal allocation of solar based distributed generators in distribution system using Bat algorithm. Perspect. Sci. 2016, 8, 270–272. [Google Scholar] [CrossRef]
- Kaced, K.; Larbes, C.; Ramzan, N.; Bounabi, M.; Dahmane, Z. Elabadine Bat algorithm based maximum power point tracking for photovoltaic system under partial shading conditions. Sol. Energy 2017, 158, 490–503. [Google Scholar] [CrossRef]
- Mirjalili, S.; Mirjalili, S.M.; Yang, X.S. Binary bat algorithm. Neural Comput. Appl. 2014, 25, 663–681. [Google Scholar] [CrossRef]
- Klaić, Z. Stohastička Procjena Naponskih Propada Uslijed Kratkih Spojeva u Elektroenergetskom Sustavu. Ph.D. Thesis, Faculty of Electrical Engineering, Computer Science and Information Technology Osijek, Osijek, Croatia, 2011. [Google Scholar]
- Olguin, G. Voltage Dip (Sag) Estimation in Power Systems based on Stochastic Assessment and Optimal Monitoring, Chalmers Tekniska Högskola; Chalmers University of Technology: Gothenburg, Sweden, 2005. [Google Scholar]
- Mirjalili, S.; Lewis, A. S-shaped versus V-shaped transfer functions for binary Particle Swarm Optimization. Swarm Evol. Comput. 2013, 9, 1–14. [Google Scholar] [CrossRef]
- Kozak, J. Theoretical framework. In Studies in Computational Intelligence; Springer: Berlin/Heidelberg, Germany, 2019; Volume 781, pp. 1–25. [Google Scholar]
Publisher’s Note: MDPI stays neutral with regard to jurisdictional claims in published maps and institutional affiliations. |
© 2021 by the authors. Licensee MDPI, Basel, Switzerland. This article is an open access article distributed under the terms and conditions of the Creative Commons Attribution (CC BY) license (http://creativecommons.org/licenses/by/4.0/).