A Data Analytics-Based Energy Information System (EIS) Tool to Perform Meter-Level Anomaly Detection and Diagnosis in Buildings
Abstract
1. Introduction
- Identification of typical load patterns in whole-building energy consumption time series.
- Detection of anomalous load patterns when typical ones are violated over time.
- Diagnosis of the detected anomalies by means of inference analysis performed on the main sub-loads.
Related Work and Contribution of the Paper
- In order to further enhance the pattern recognition process enabled by the aSAX-based process introduced in [17], different features of the energy consumption time series were encoded in symbols in addition to the mean value evaluated in each time window for data reduction purposes. In particular, the encoding of trend features of the time series was performed, allowing an improved characterization of energy consumption behavior and making it possible to reduce the information loss that is always related to the application of temporal abstraction processes such as aSAX. In addition, both the number of time windows and alphabet size for the encoding of the time series in symbols were tuned during the analysis through a fully automatic process.
- The identification of the normal energy consumption pattern is evaluated for specific time periods during the day (i.e., aSAX time windows) by means of classification models capable of estimating the most probable symbol encoded through the aSAX-based process. In particular, globally optimal evolutionary trees were used to accomplish this task. The use of evolutionary trees introduce a twofold advantage in the classification task: (i) the results obtained from their application are fully interpretable as they can be translated in “if-then” decision rules, (ii) the achievable accuracy in high-dimensional problems can be significantly higher than the performance of standard decision trees (e.g., locally optimal classification trees [37]).
- The anomaly diagnosis is performed at the sub-load level by implementing an unsupervised data analytics technique based on an ARM algorithm. The diagnostic process is capable of automatically updating an anomaly library in the form of “if-then” association rules extracted from historical data. This opportunity allows the developed ADD tool to evolve during building operation, significantly increasing its generalizability.
- The whole methodology was conceived for being applied in a real testbed paying attention to its generalizability and scalability to other buildings. In this perspective, the developed ADD process is capable of self-tuning its hyper-parameters ensuring a robust performance in online implementations. As a reference, the algorithms for both detection and diagnosis of the energy anomalies can be easily retrained periodically or considering an event-based approach (e.g., the occurrence of a not pre-identified anomaly).
2. Description of the Data Analysis Methods
2.1. Adaptive Symbolic Aggregate Approximation (aSAX)
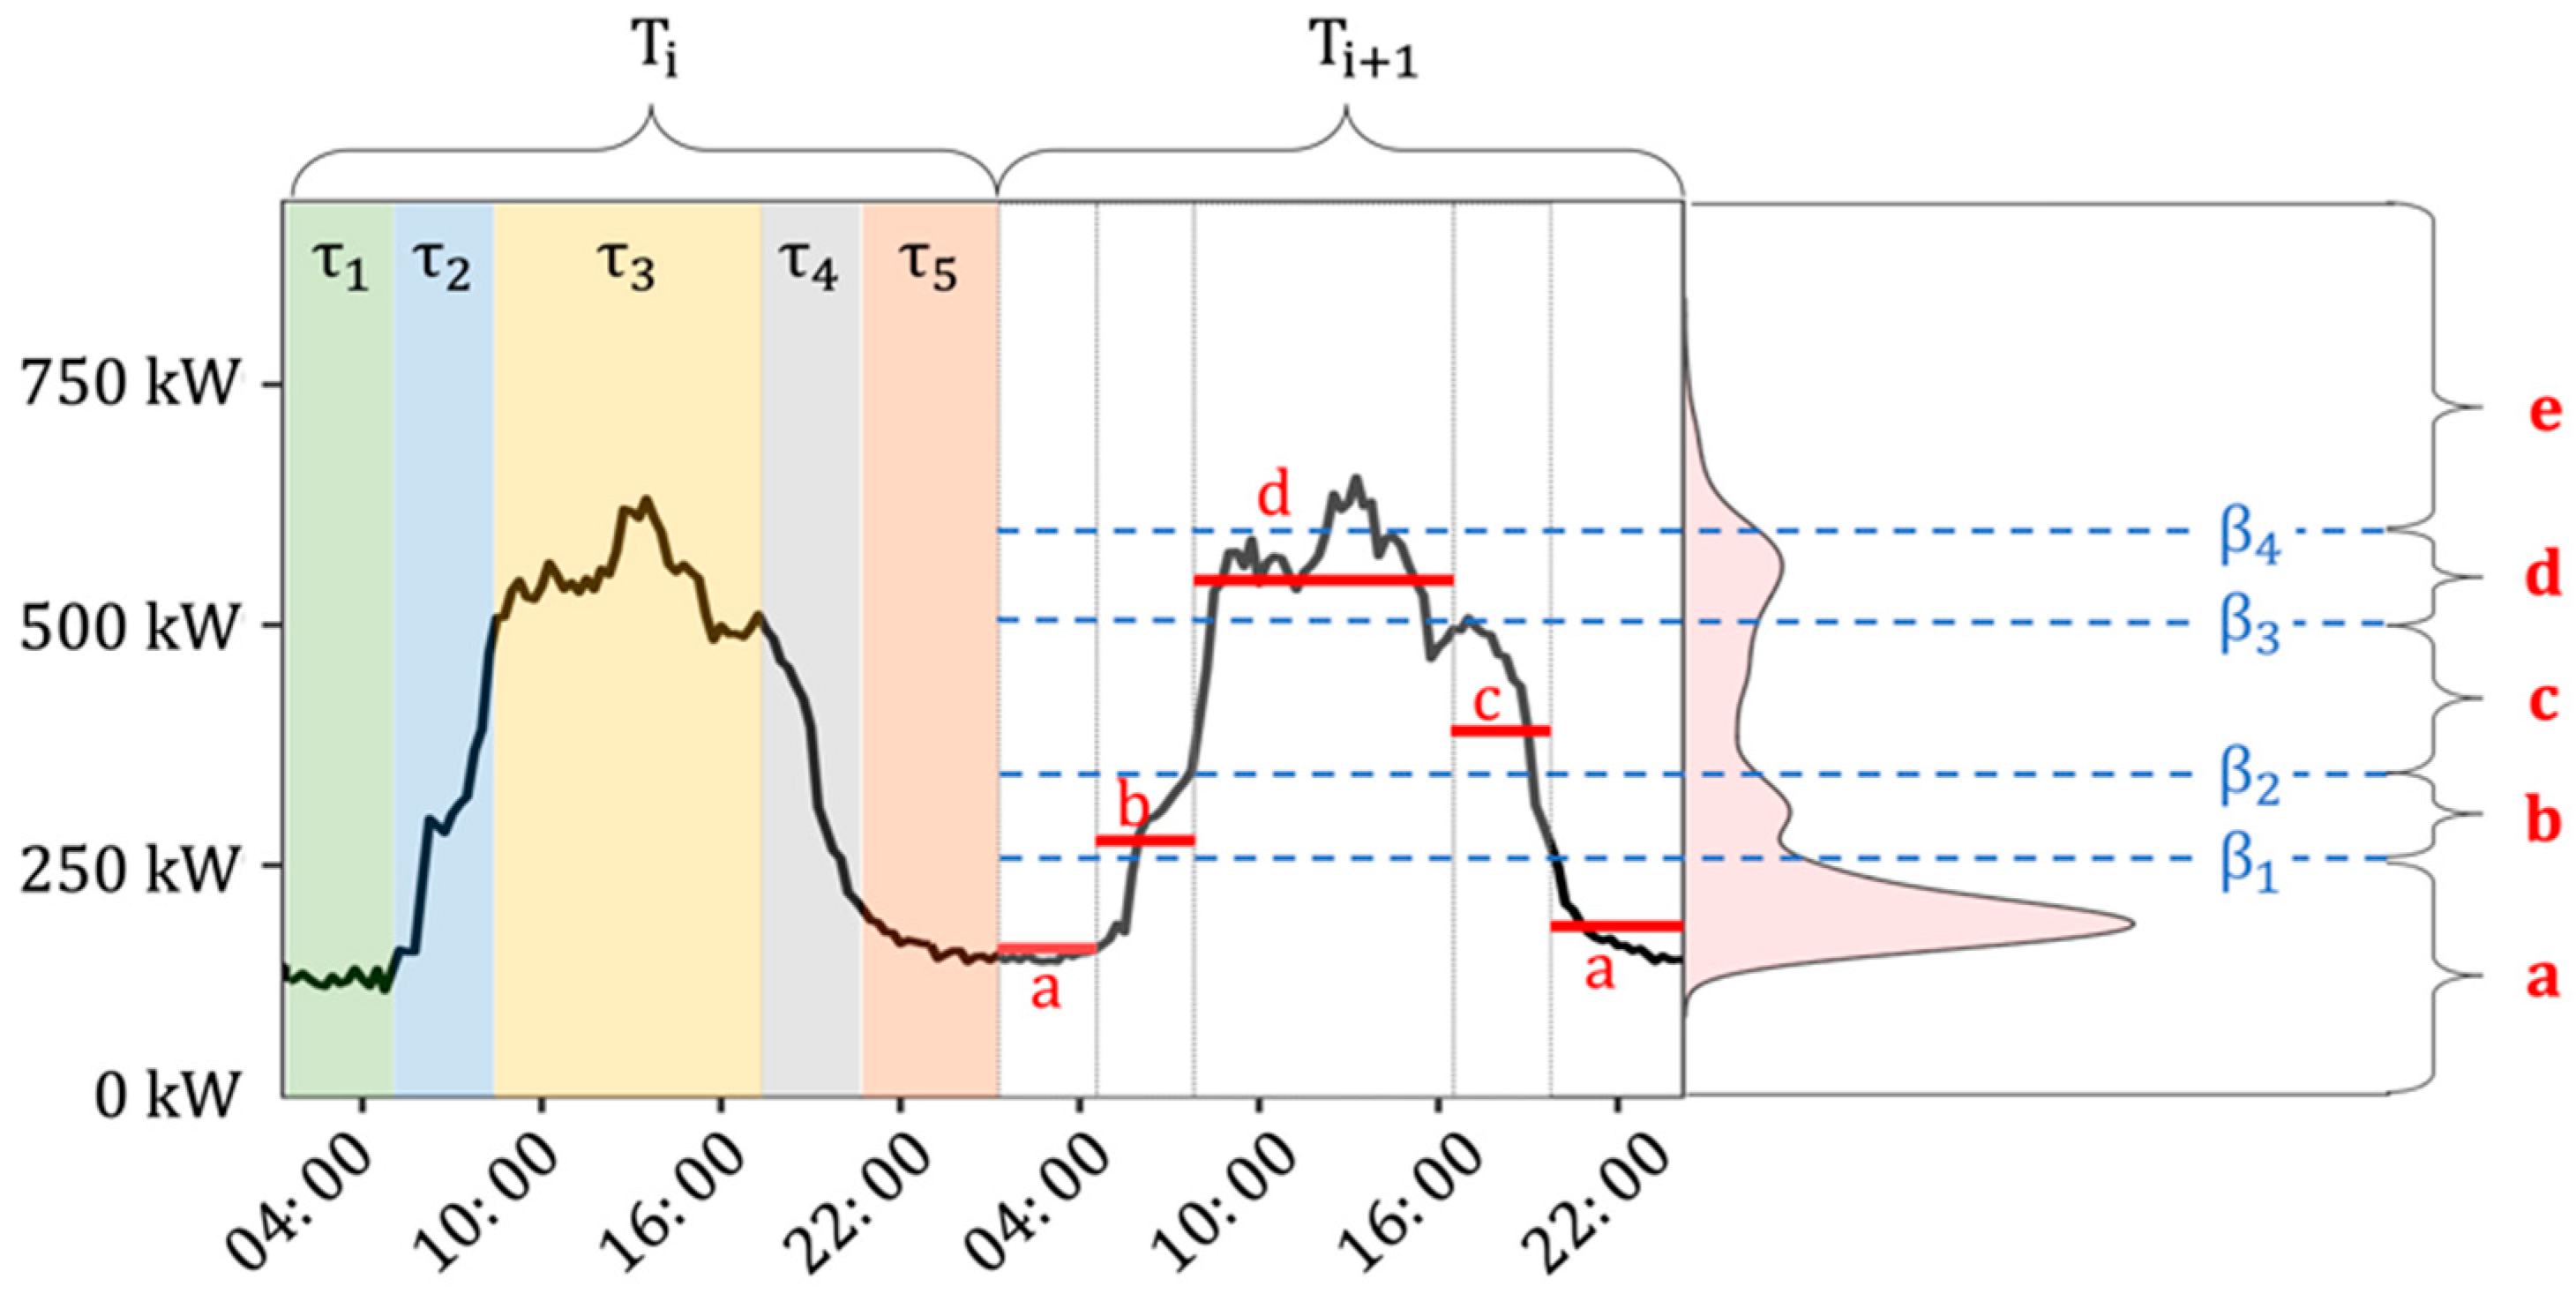
- Chunking: The original time series (y(t) = {y1, … yn}) of length n is divided into N non-overlapping sub-sequences (T = {T1, … TN}) chosen for the specific context. In the case of energy consumption time series, the selection of the length of the sub-sequences is influenced by the periodicity of the energy pattern observed, and for building applications, it is usually set to 24 h. Each sub-sequence is further divided into W segments called time windows (τ = {τ1, … τW}). The parameter W is word size. During this process, it is possible to choose time windows with equal or different length, based on user preference [17,39];
- Feature extraction: In this step, an aggregated numerical feature is calculated starting from the sub-sequence of the original time series that falls in the generic time window τi, and this value is considered as representative of all the data points included in that window. Aggregated features can extract some important characteristics of the time series while losing some other information. The analyst chooses which feature is the most significant and whether one or more features are needed for the purpose of the study. The most used and known approach is called piecewise aggregate approximation (PAA), which performs a constant approximation of the original time series y(t) by replacing the values that fall into the same time window τ with their mean [40]. Many other statistical features can be extracted (mean, variance, kurtosis, skewness) not only from the time domain but even from other domains such as the frequency one [41]. A feature representing important characteristics of time series is, for example, the trend angle [42]. This feature is particularly effective in describing the time series trend, and it was employed in this study. In detail, given a time series y(t) = {y1, … yn} of length n in a given time window τ = {t1, … tn}, defined ∆q(t1) and ∆q(tn) the first order distance between the initial and final point with the time series mean, can be defined a trend triangle as shown as in Figure 1. The trend angle feature θ, green in Figure 1, is defined with the following equation:

- Encoding: this step consists of setting an alphabet size α and assigning an alphabetic character to each time window, according to where the extracted numerical feature lies within a set of breakpoints (β = {β1, … βα-1}) identified according to the shape of the feature distribution. The aSAX algorithm [38] finds the optimal positions of breakpoints through an iterative process by minimizing the distance among all the data points included between two consecutive breakpoints and their centroid (calculated average center). Eventually, the symbol can be assigned for each window (τ), creating a word of length W for the given sub-sequence (Ti). The original numerical time series y(t) is then transformed into an alphabetic string (y(α)) of length W∗N.
2.2. Recursive Partitioning and Globally Optimal Evolutionary Tree
2.3. Association Rules Mining (ARM)
3. Case Study
4. Methodological Framework
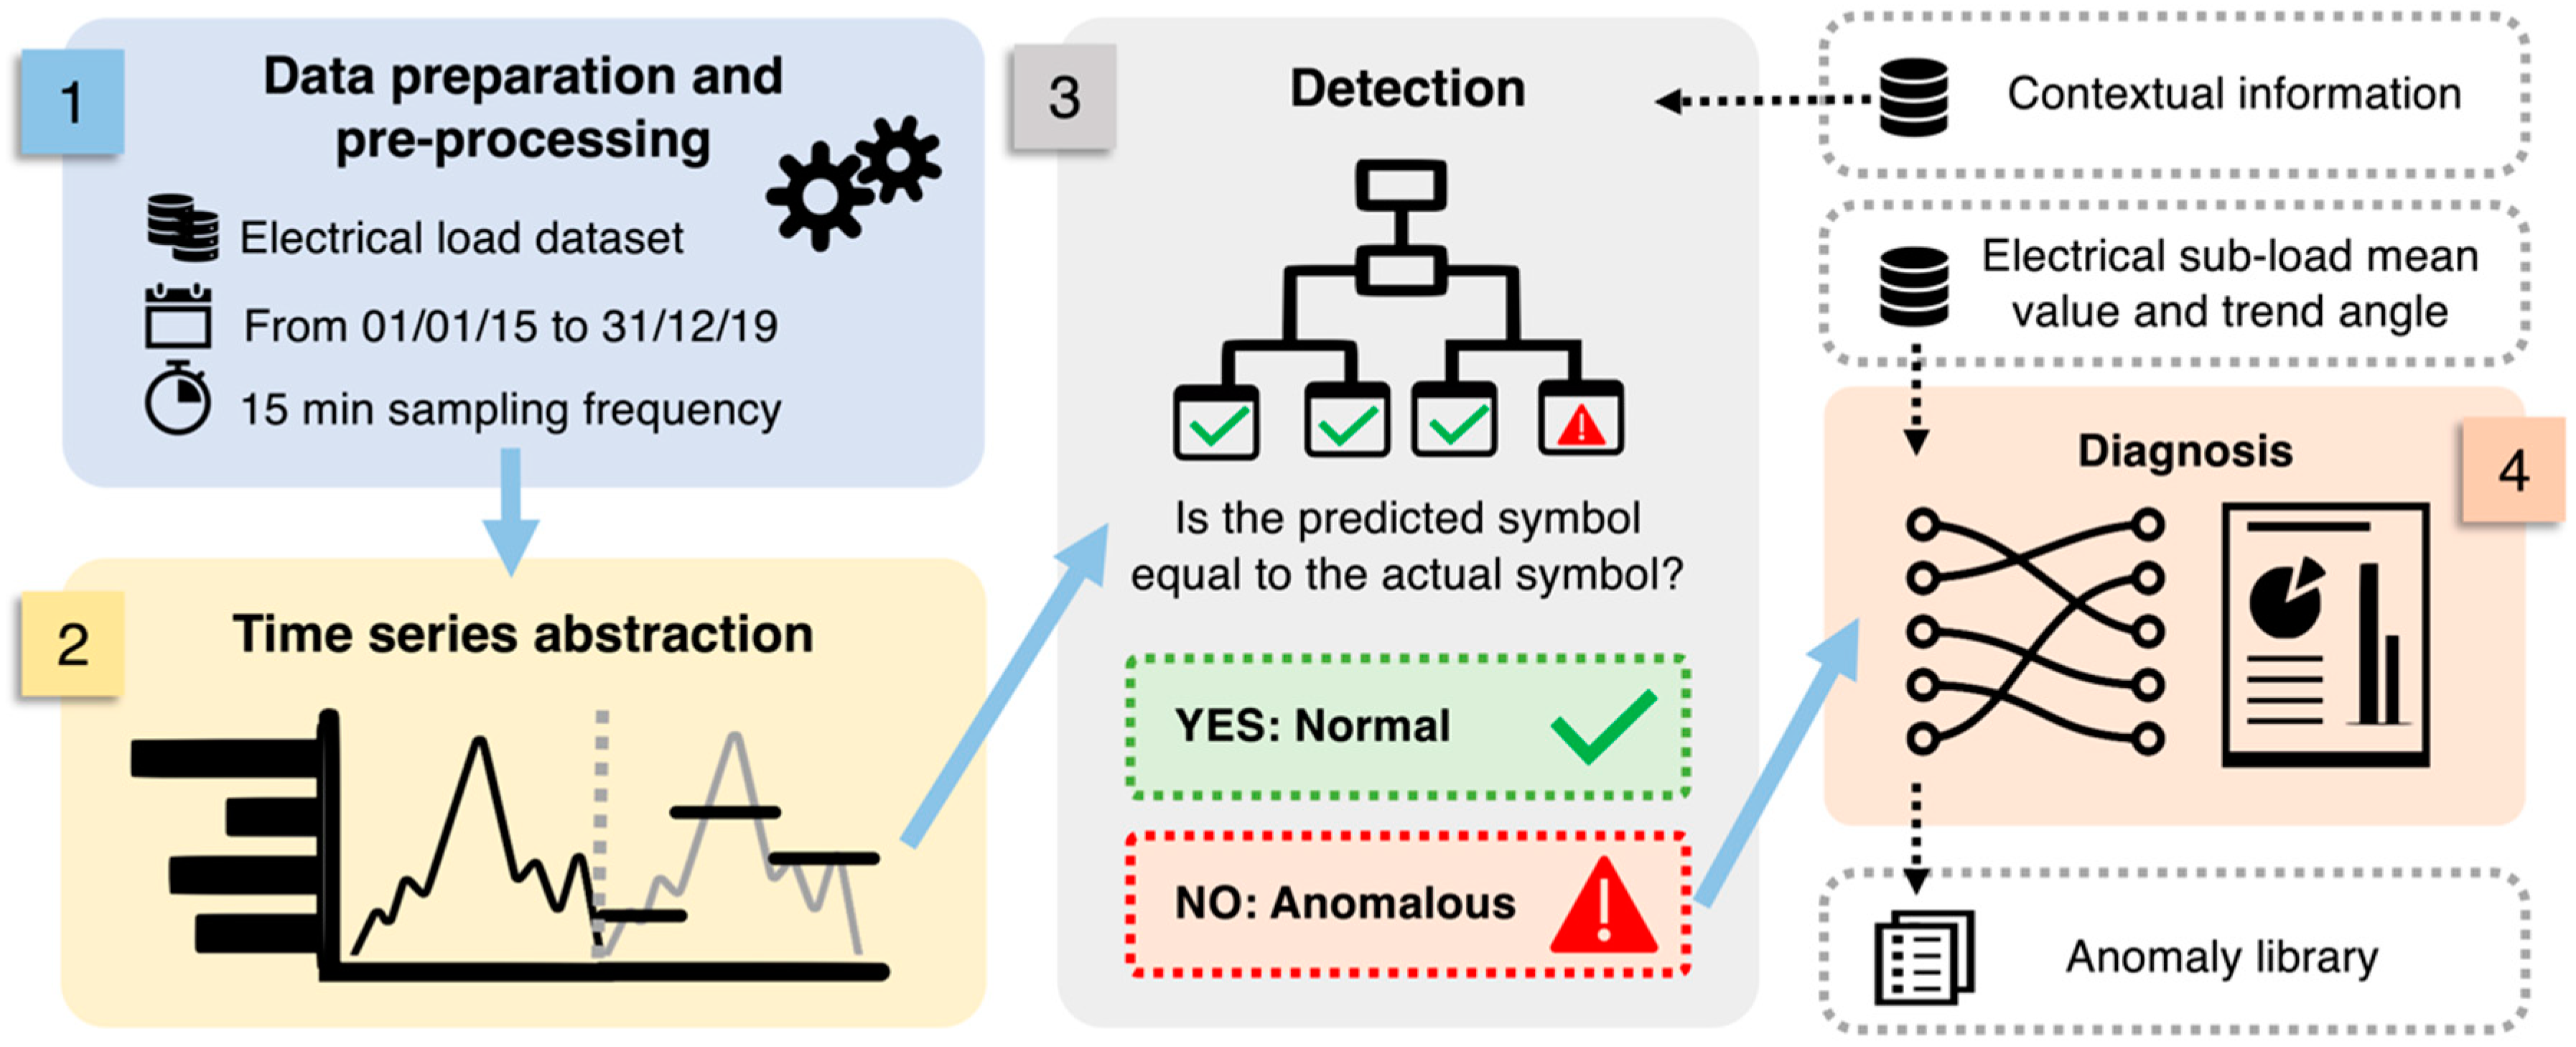
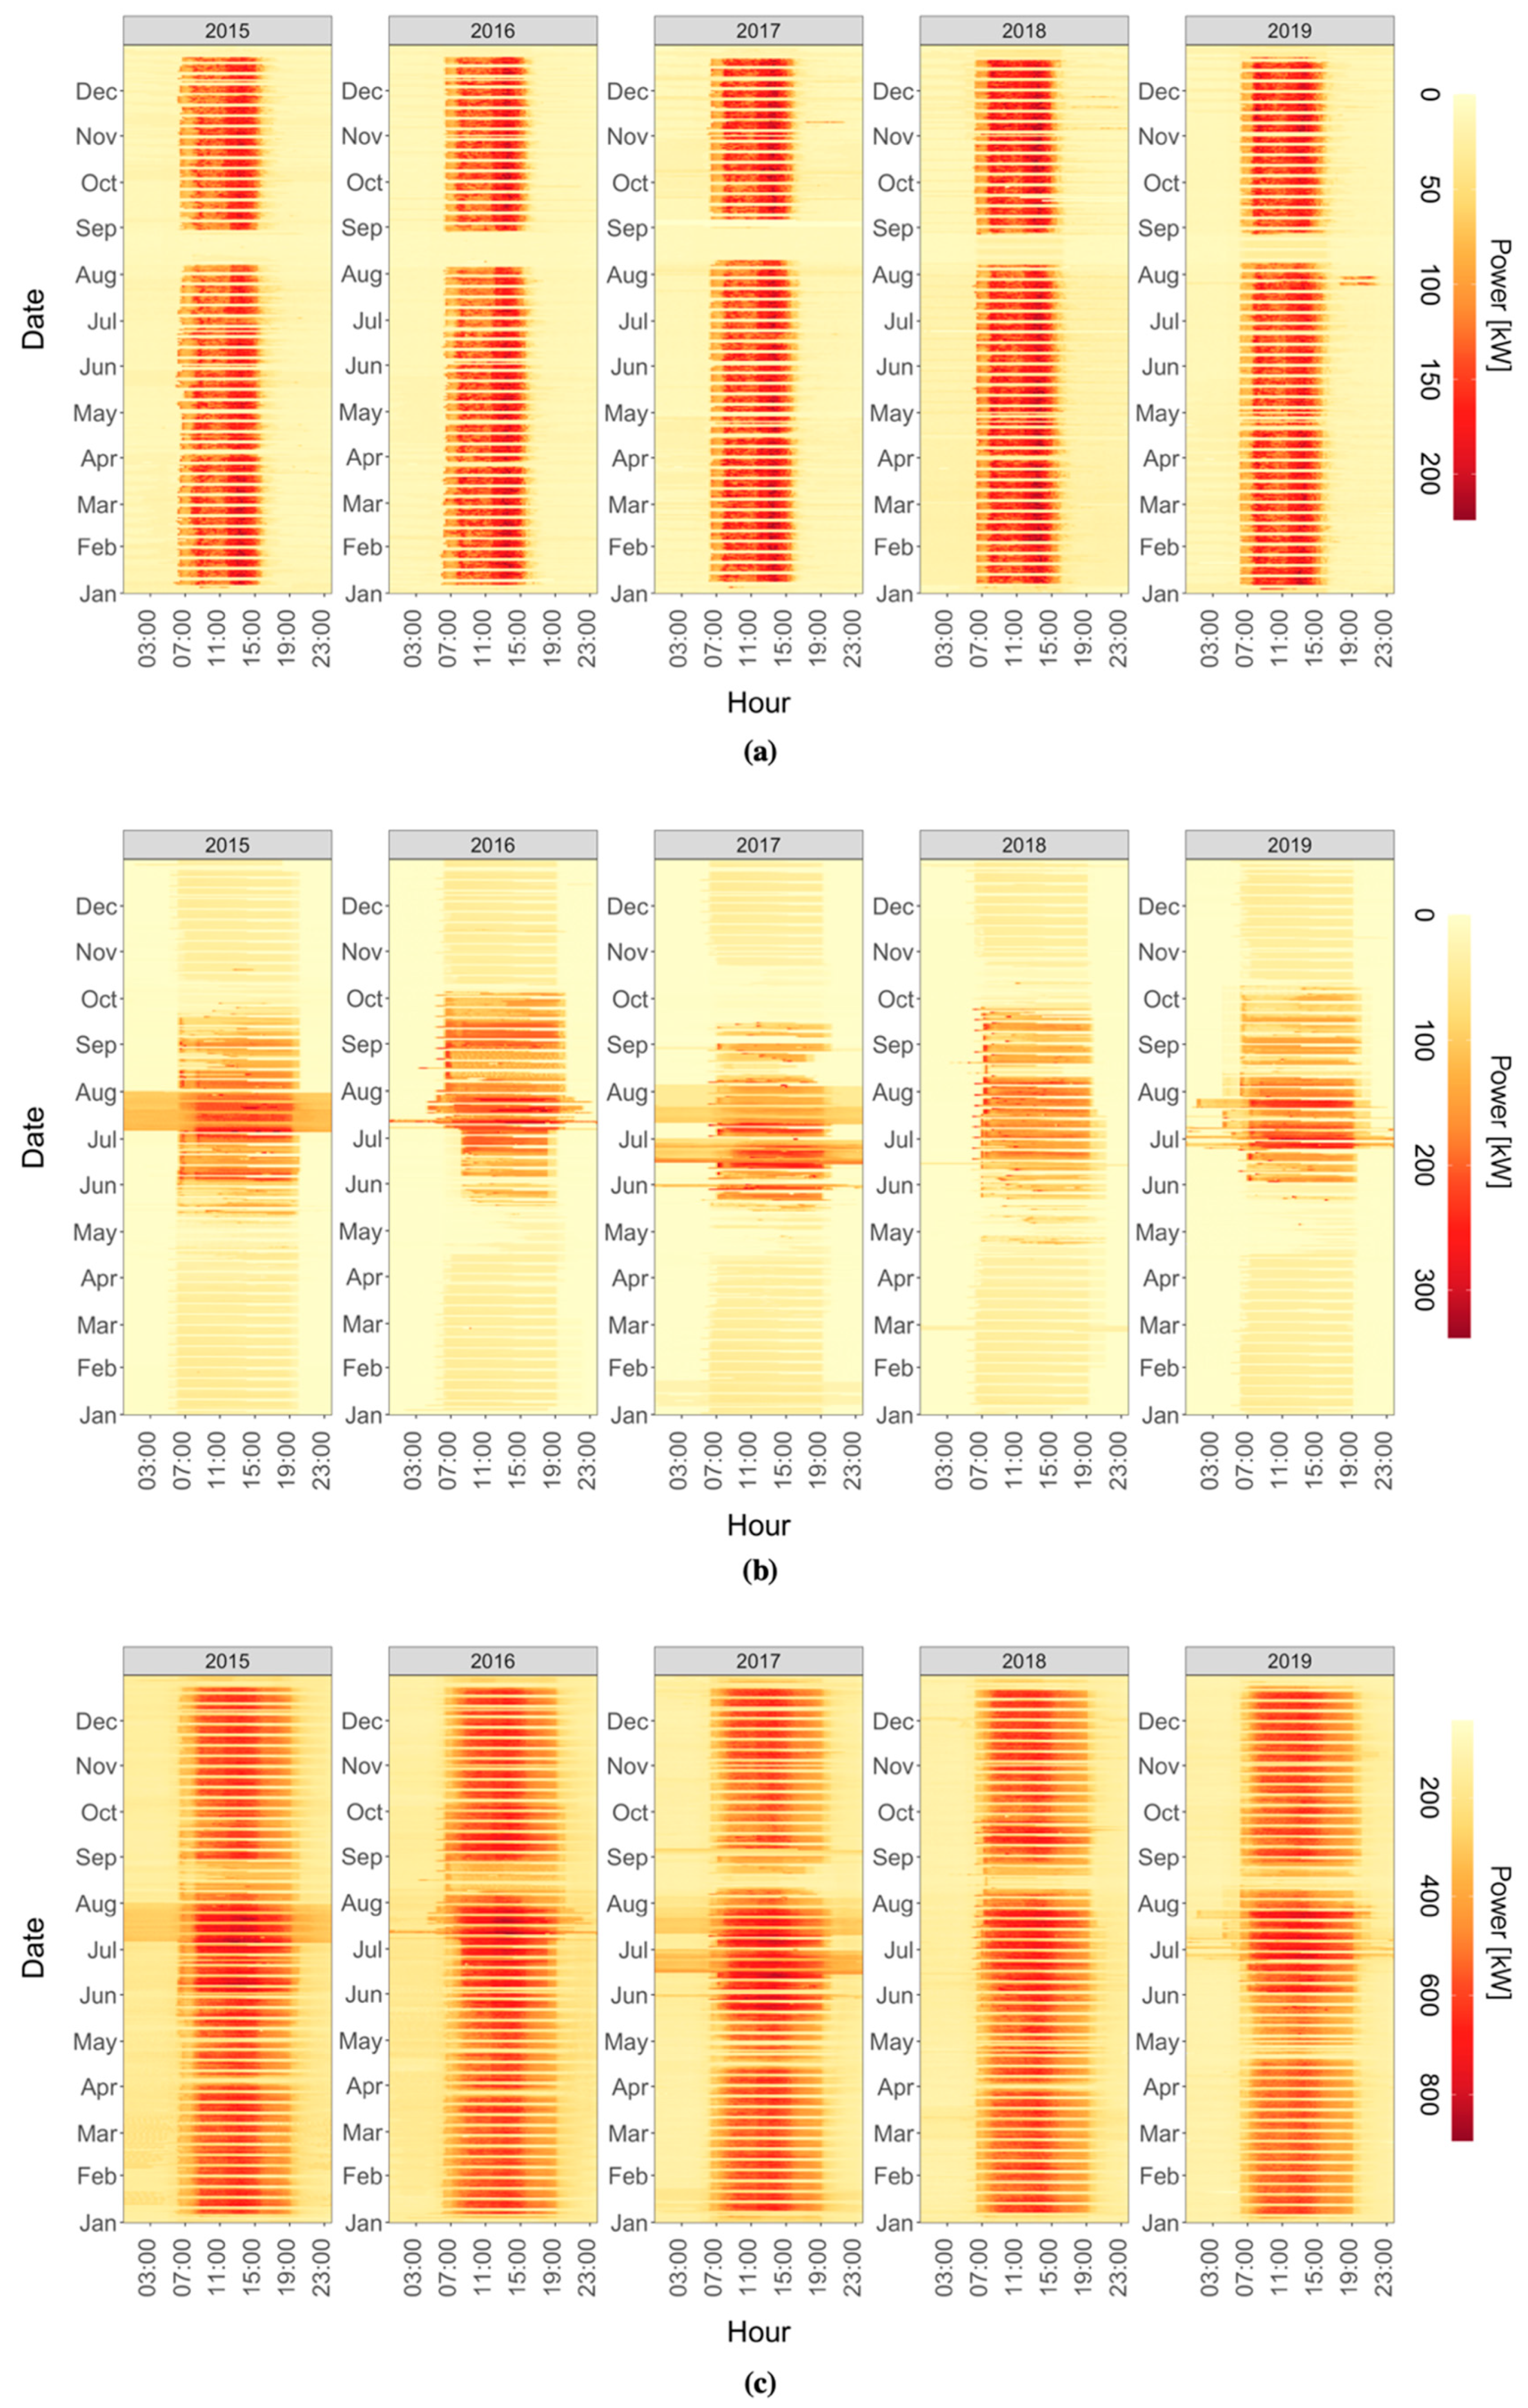
- Pre-processing: The first step consists of pre-processing data that was aimed at removing punctual anomalies and inconsistencies from the datasets. The dataset used in this study included electrical load data (collected from substation C) from 1 January 2015 to 31 December 2019 with a 15 min sampling frequency. Negative measurements were removed a priori. Nearly-zero values of electrical load related to continuously operating systems (refrigerators, emergency lighting) were considered inconsistent and removed. Statistical outliers (e.g., data affected by transmission problems) were also identified and removed by means of boxplot analysis. Then all statistical inconsistencies and missing values are replaced through a linear interpolation;
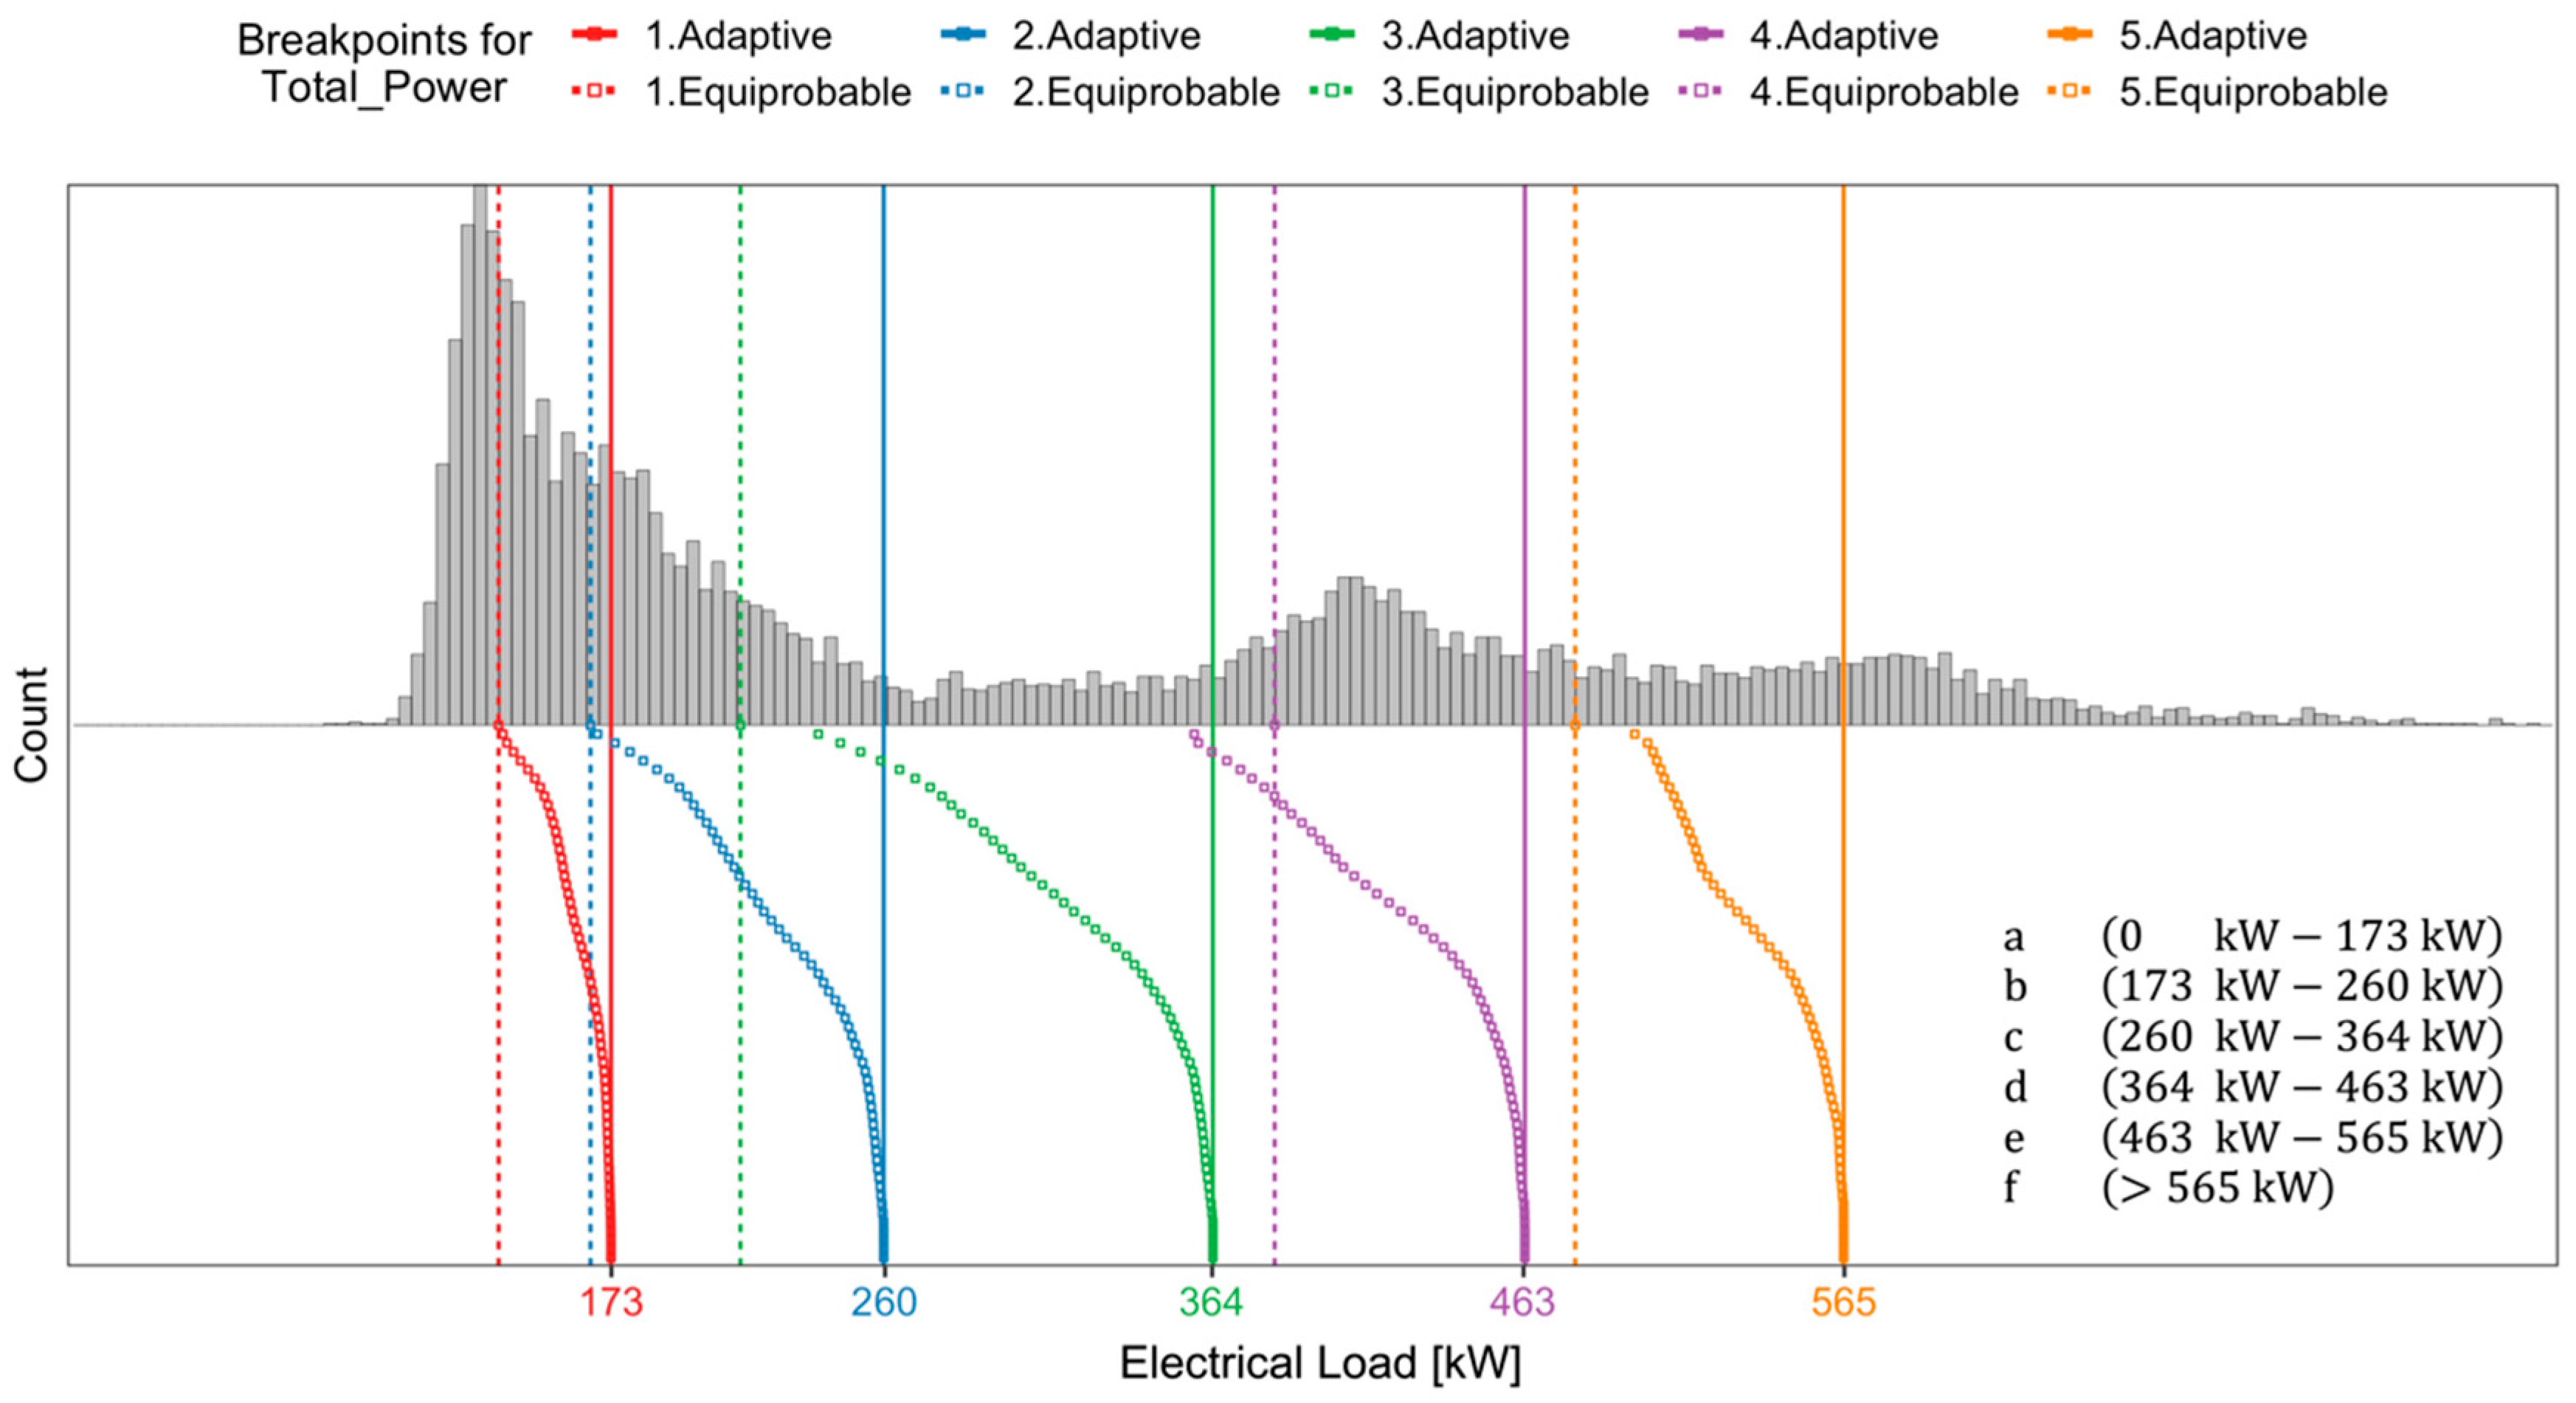
- Temporal abstraction of the time series: In the second step of the analysis, the temporal abstraction of the electrical load time series was performed according to the procedure introduced in [17]. Temporal abstraction consists of the reduction and transformation of the time series in a sequence of alphabetic symbols. In particular, a recursive partitioning regression tree (RT) was used to identify sub-daily time windows with an unequal length for dimensionality reduction, considering the total electrical load from 2015 to 2019 as a numerical target and the hours of the day as a predictive attribute, as performed in [17]. Once time windows were evaluated, the PAA approximation is performed. The breakpoint identification was carried out through the aSAX method procedure by choosing the appropriate alphabet size through a k-means clustering process. The identification of the optimal number of clusters (i.e., alphabet size) was implemented through the R package “NbClust” [46];
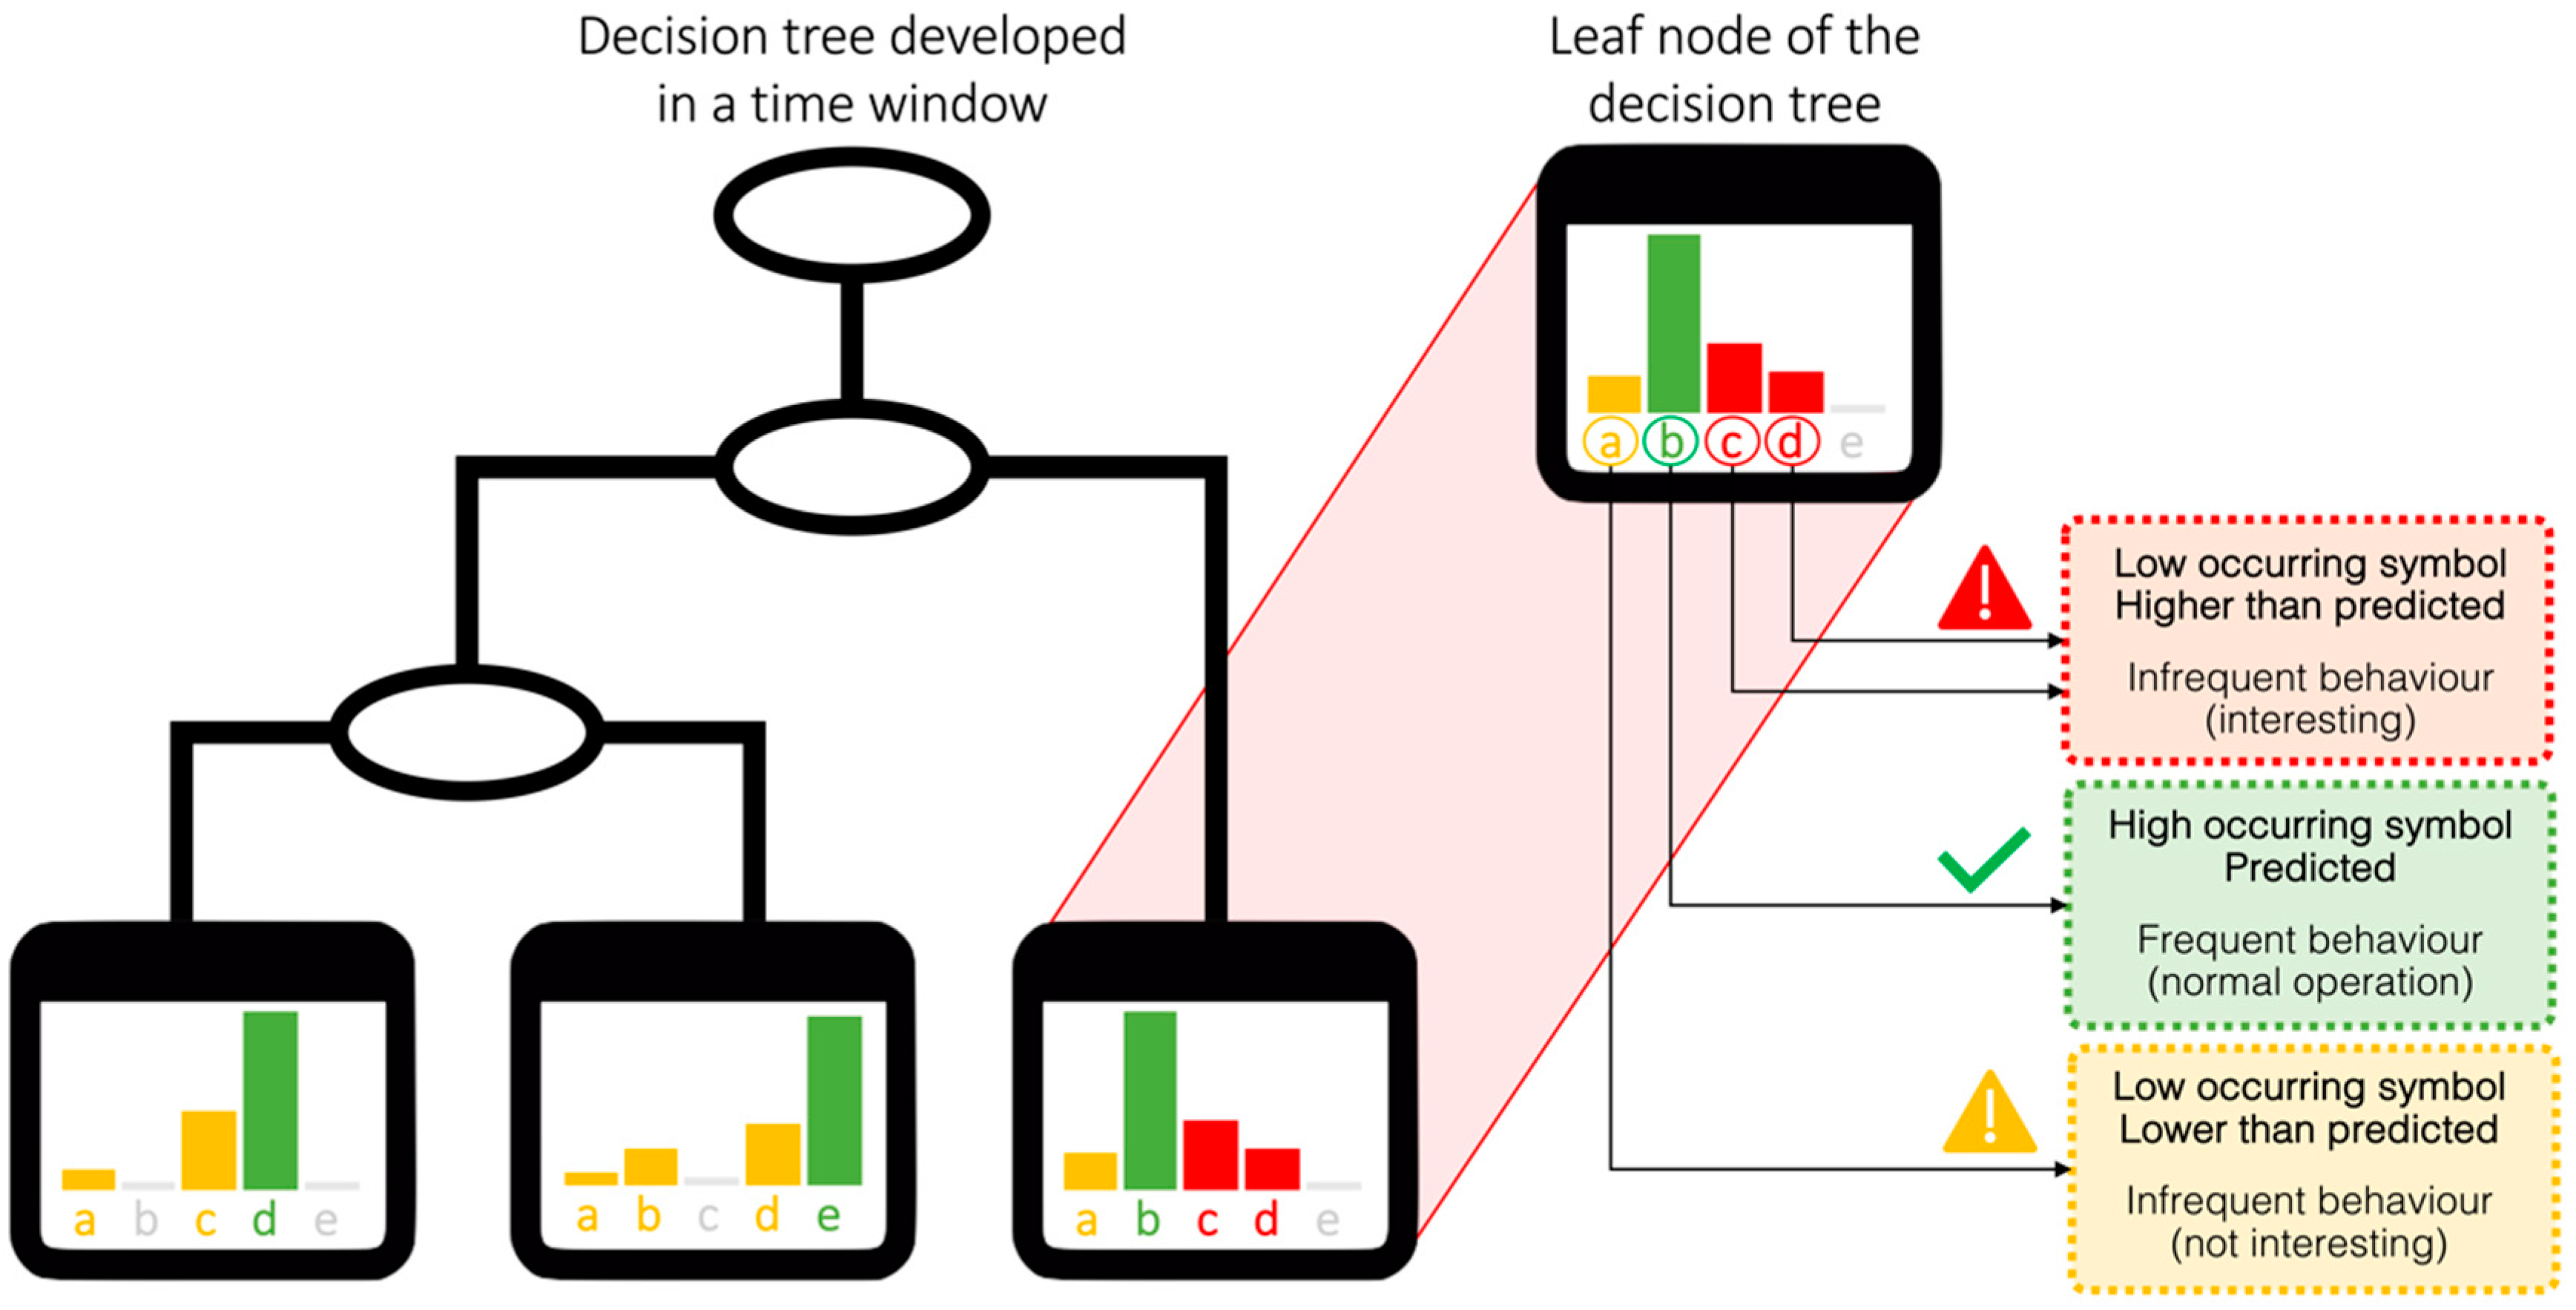
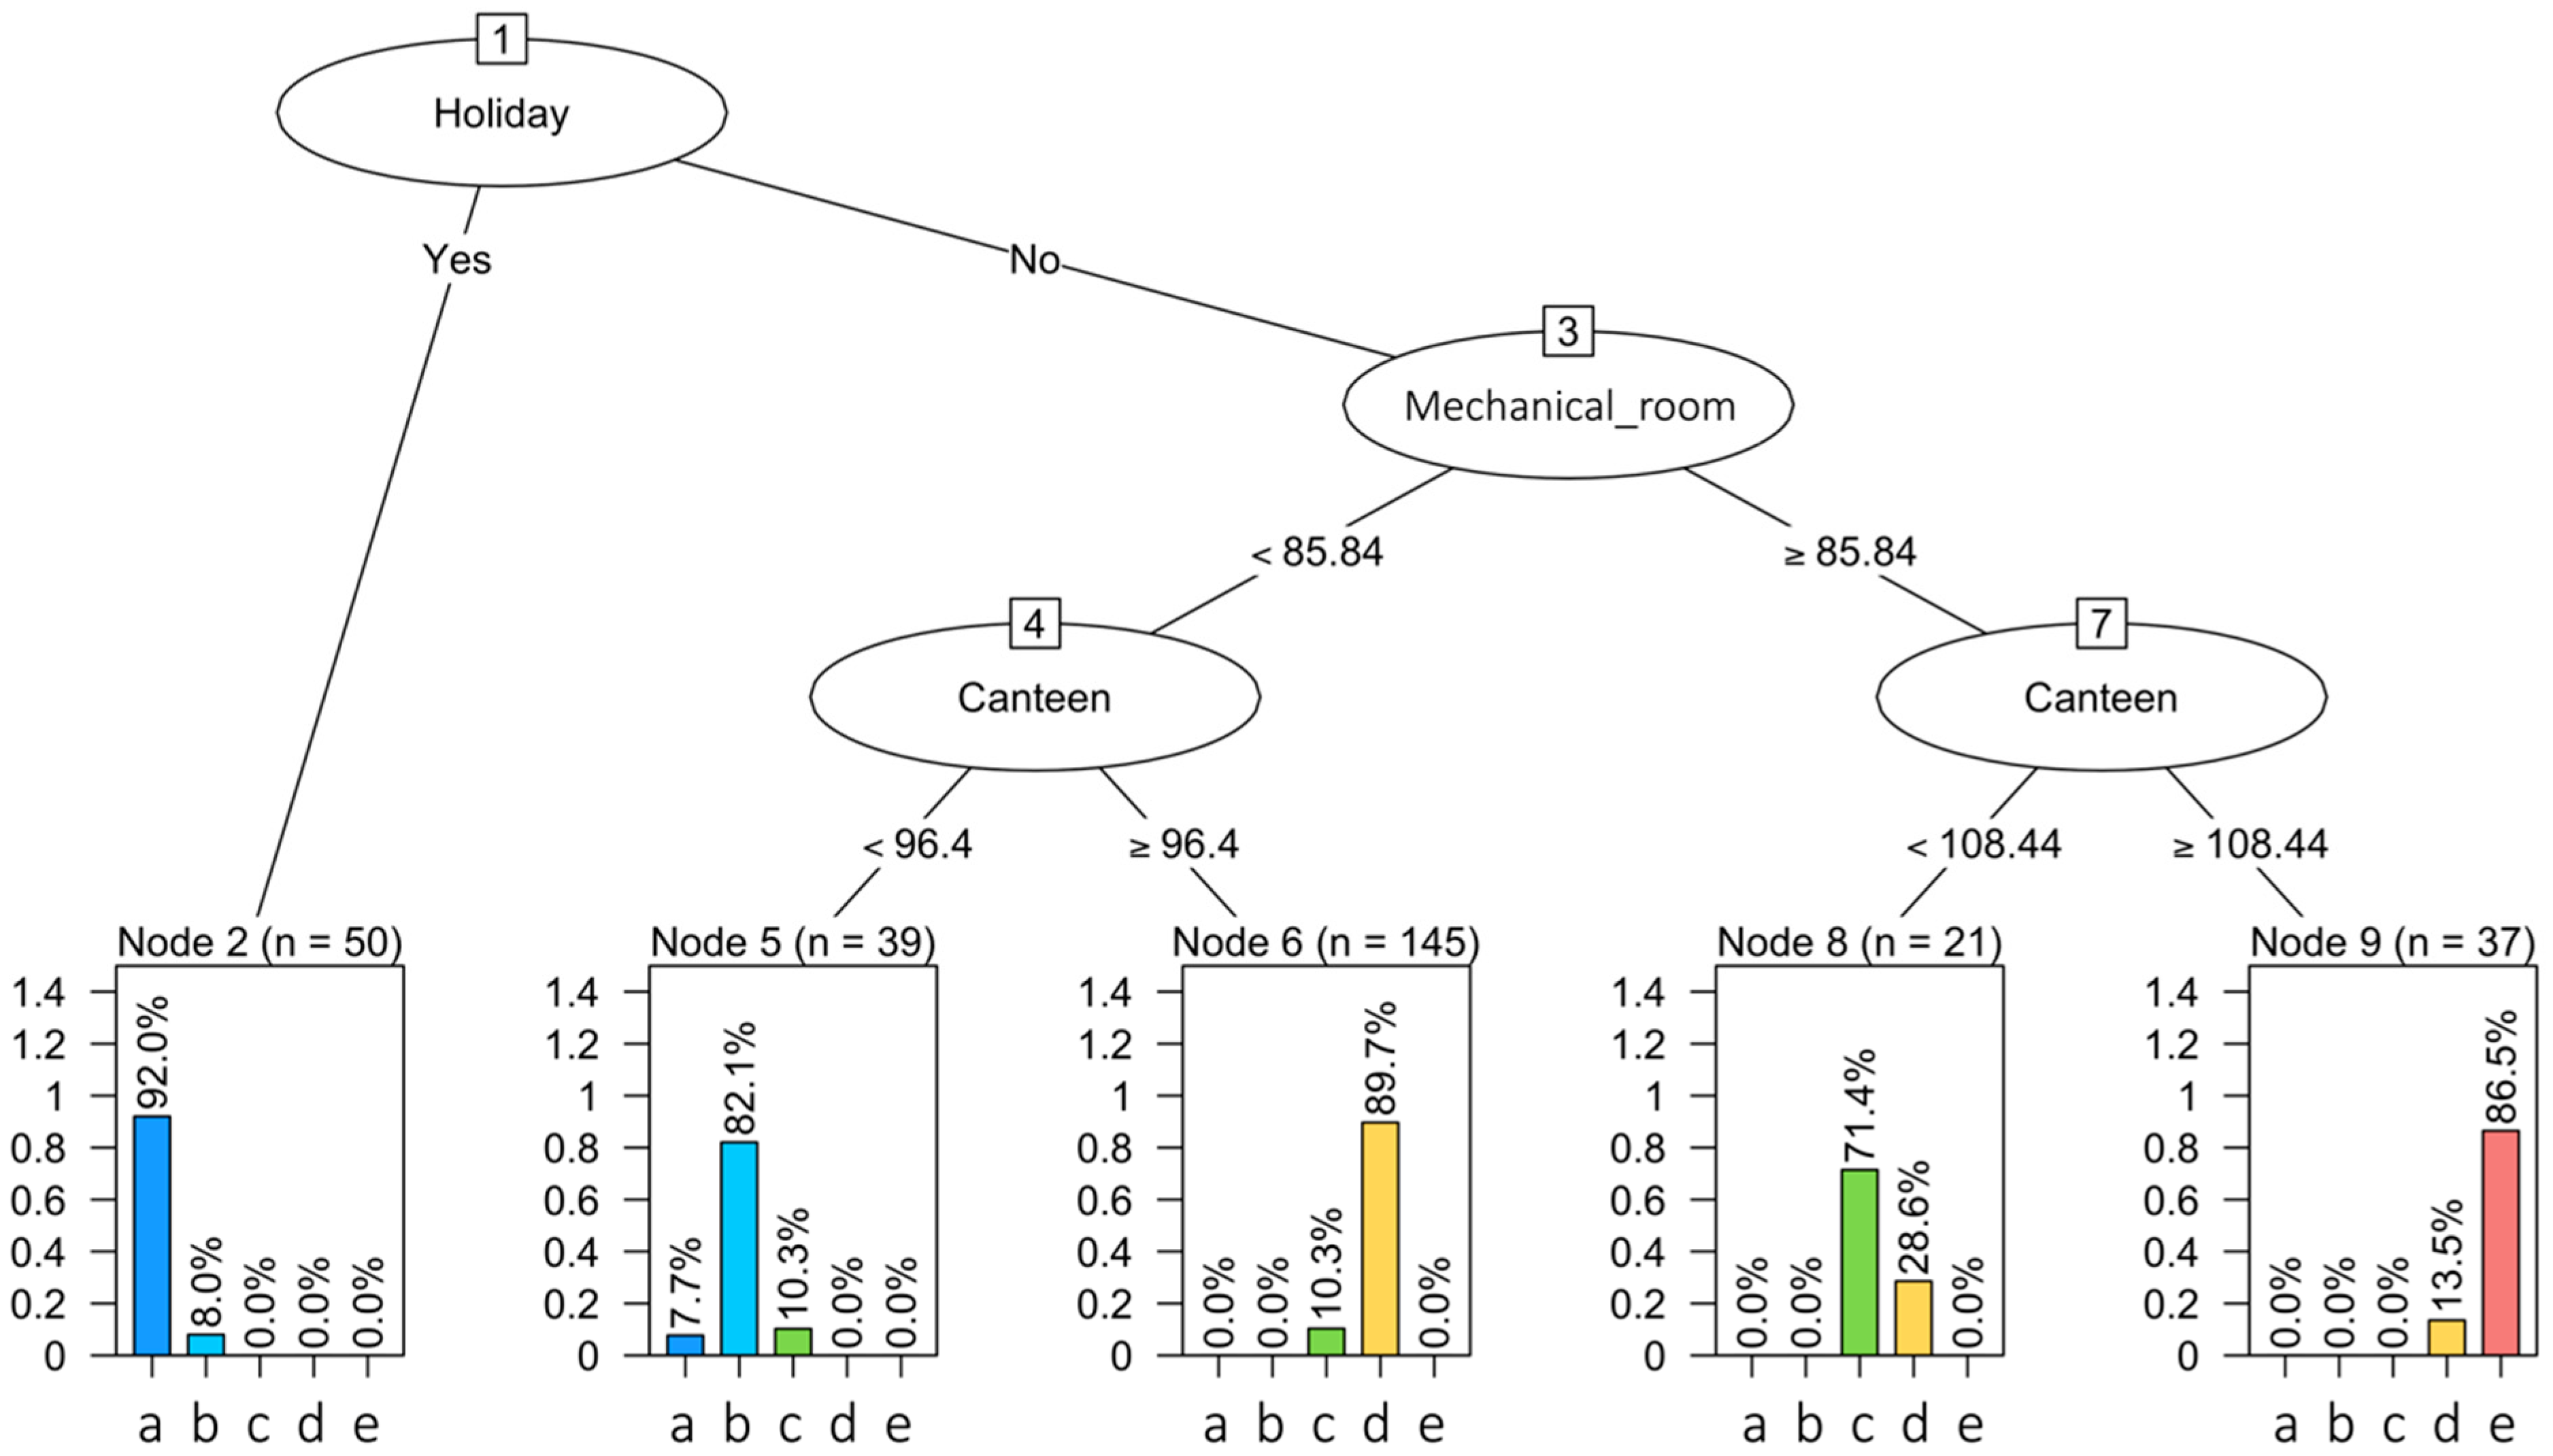
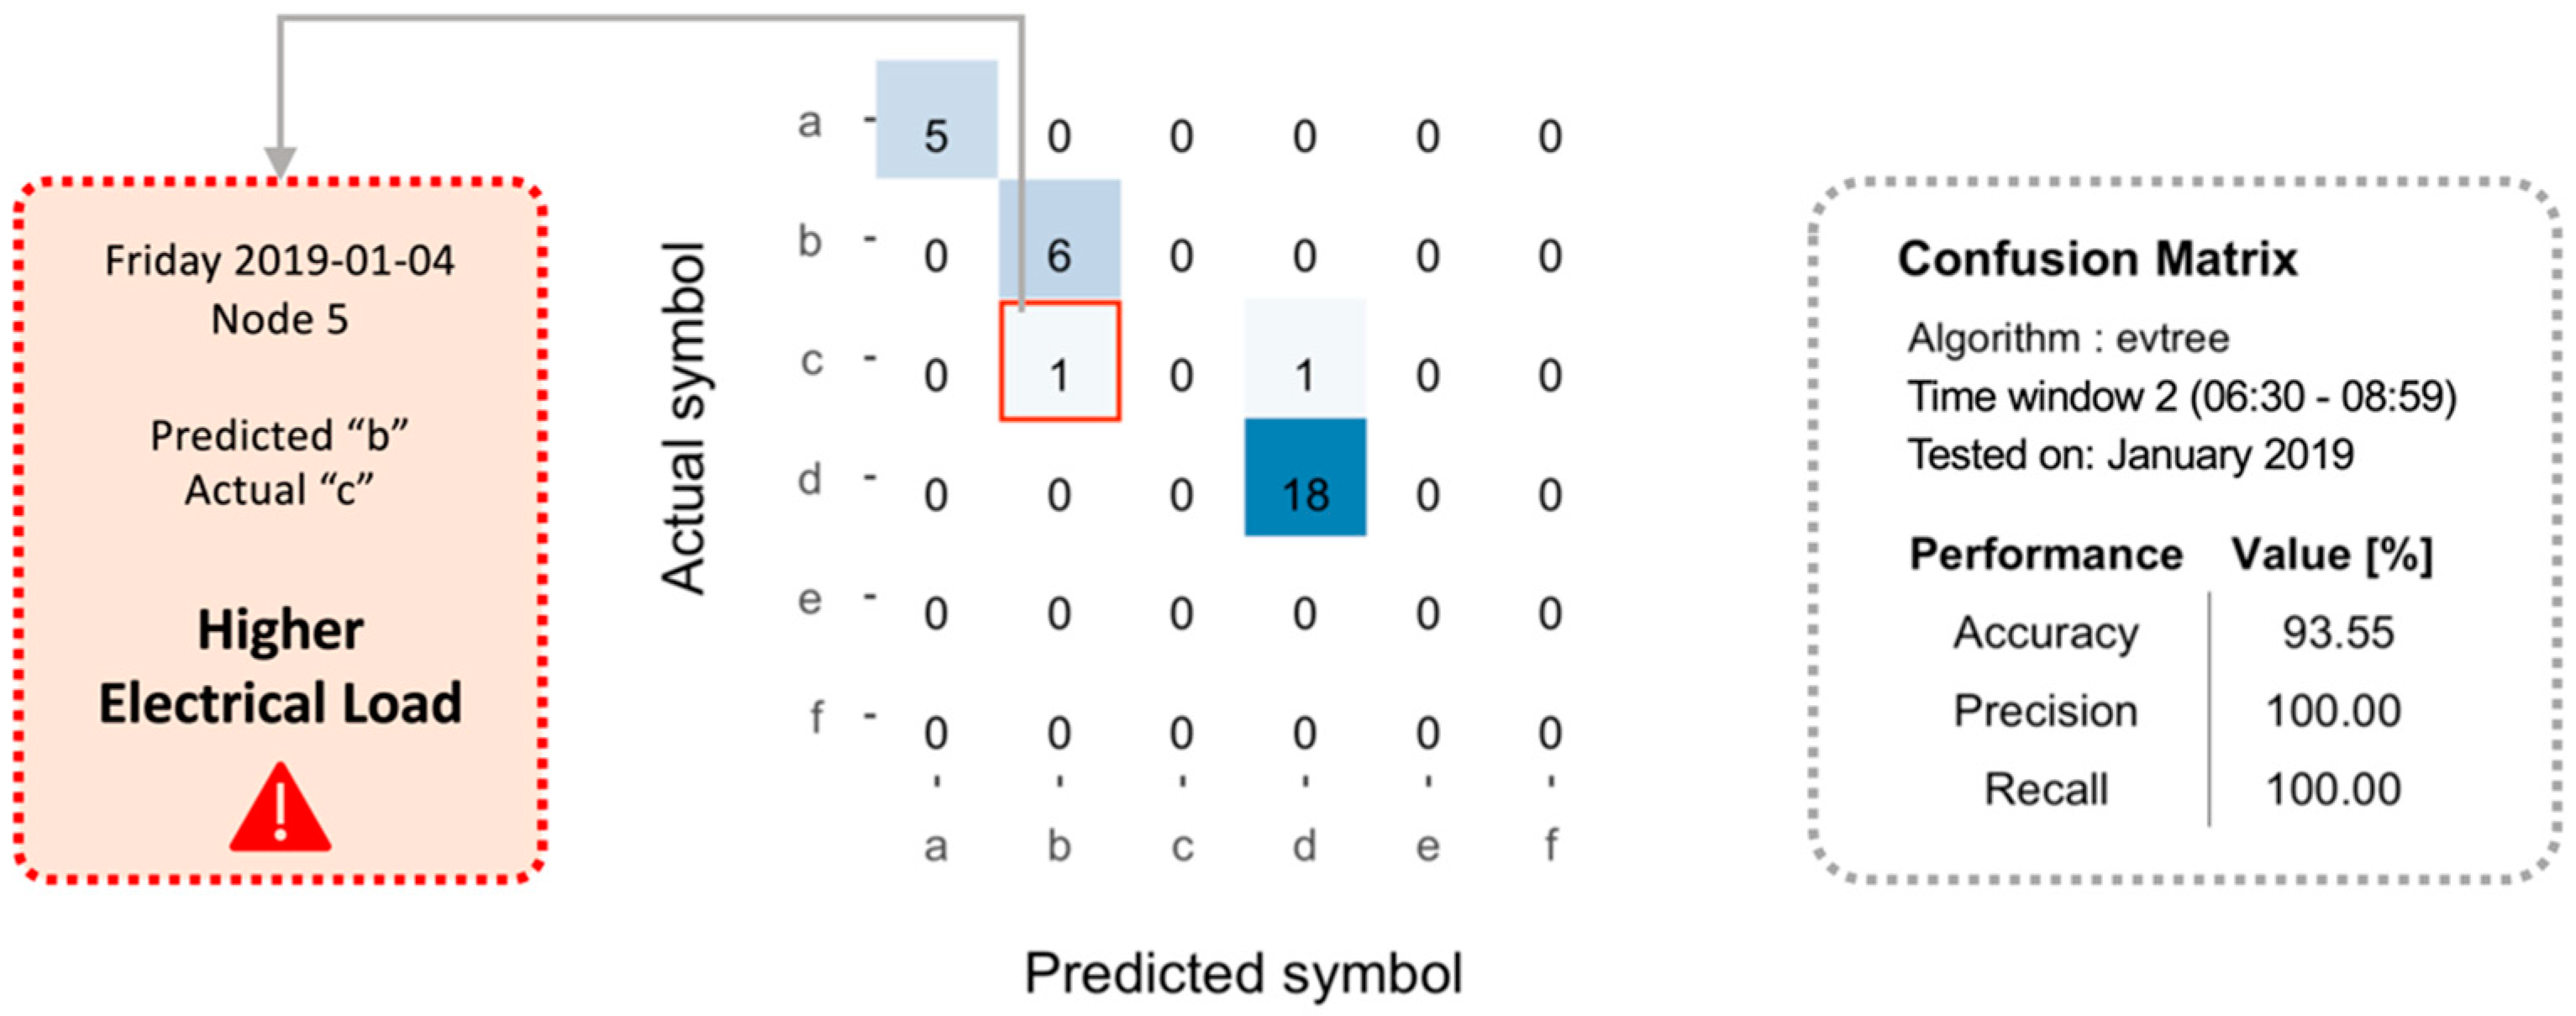
- Anomaly detection at total electrical load level: Anomaly detection was performed on the encoded total electrical load time series of substation C. In each sub-daily time window, the total electrical load symbol obtained through aSAX was predicted through a globally optimal evolutionary tree [37], using as explanatory attributes contextual information such as calendar variables (day type and holiday) and energy variables (electrical demand of sub-loads). The model was developed through a test-train-validation process and was able to predict the expected symbol in each time widow with high accuracy. However, when the model failed to correctly predict the symbol in a time window, the occurrence of a potential anomaly was assumed. Referring to Figure 5, the predicted symbol is the one with the higher occurrence in a given leaf node (green bar). All other symbols were infrequent and then potentially anomalous (yellow and red bars). Given the interest in detecting higher electrical load than normal, only the tree leaves nodes that showed infrequent symbols corresponding to a high electrical load (red bars in Figure 5) were considered and investigated in the following diagnostic phase;
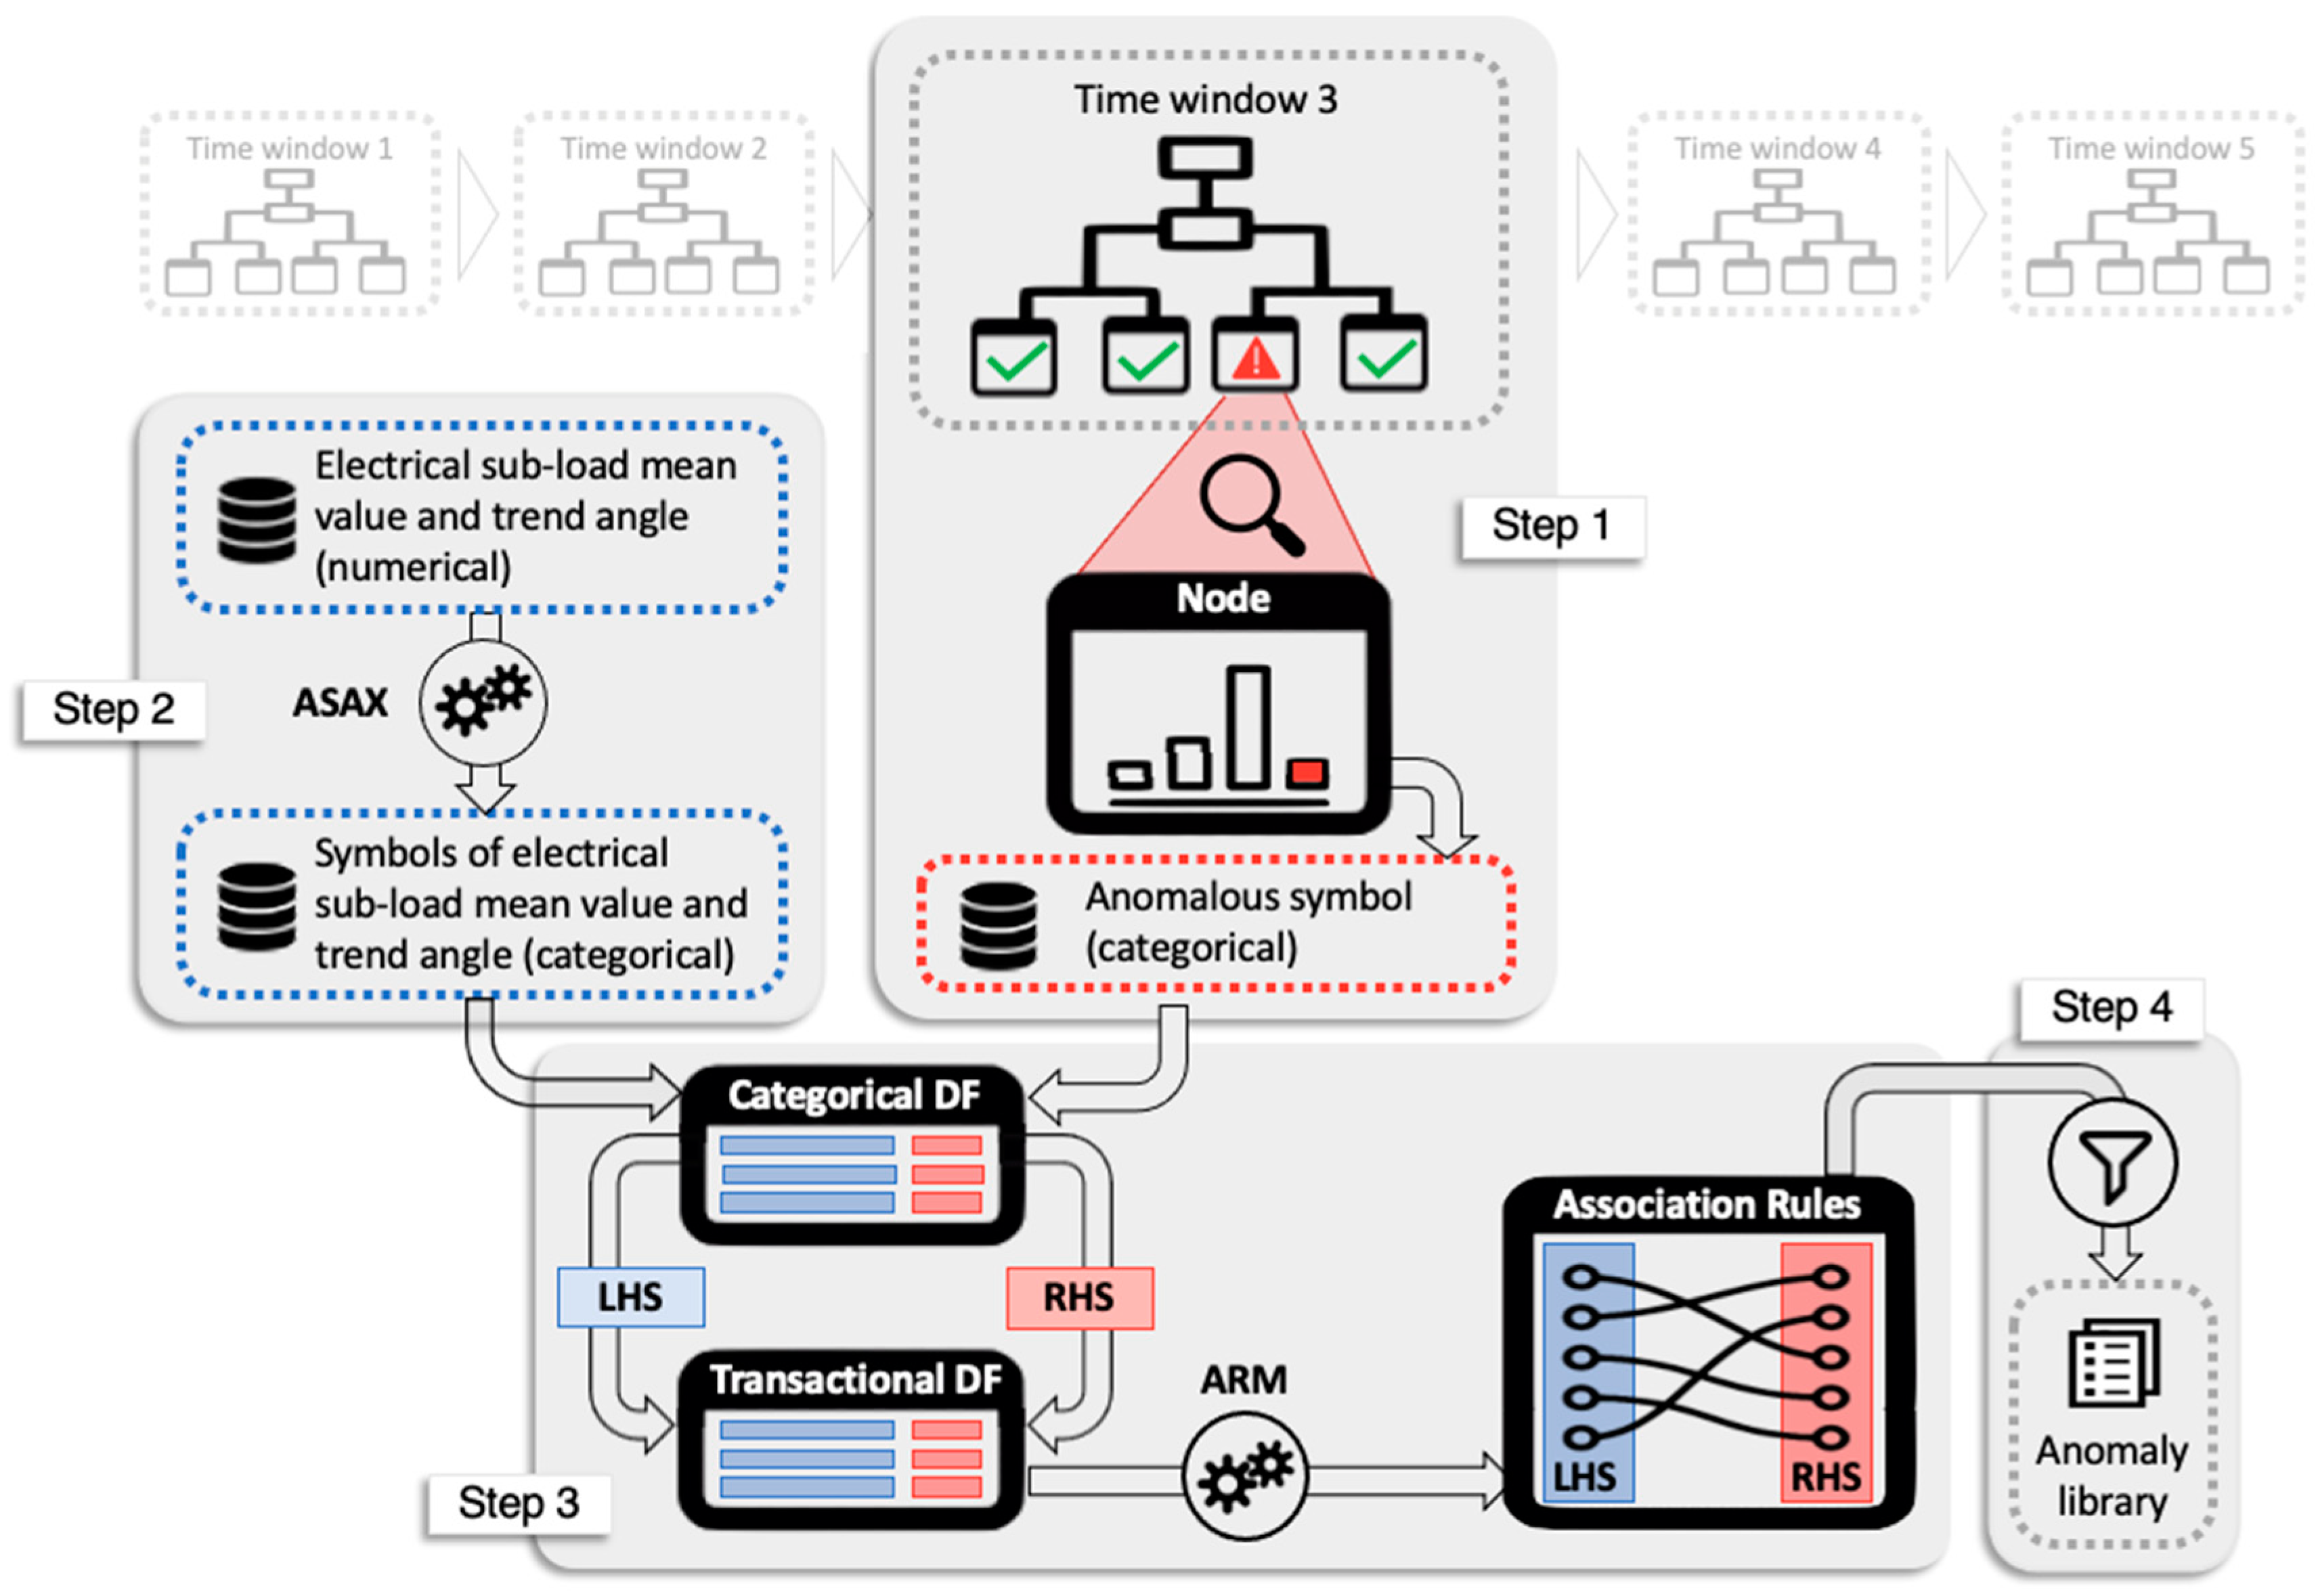
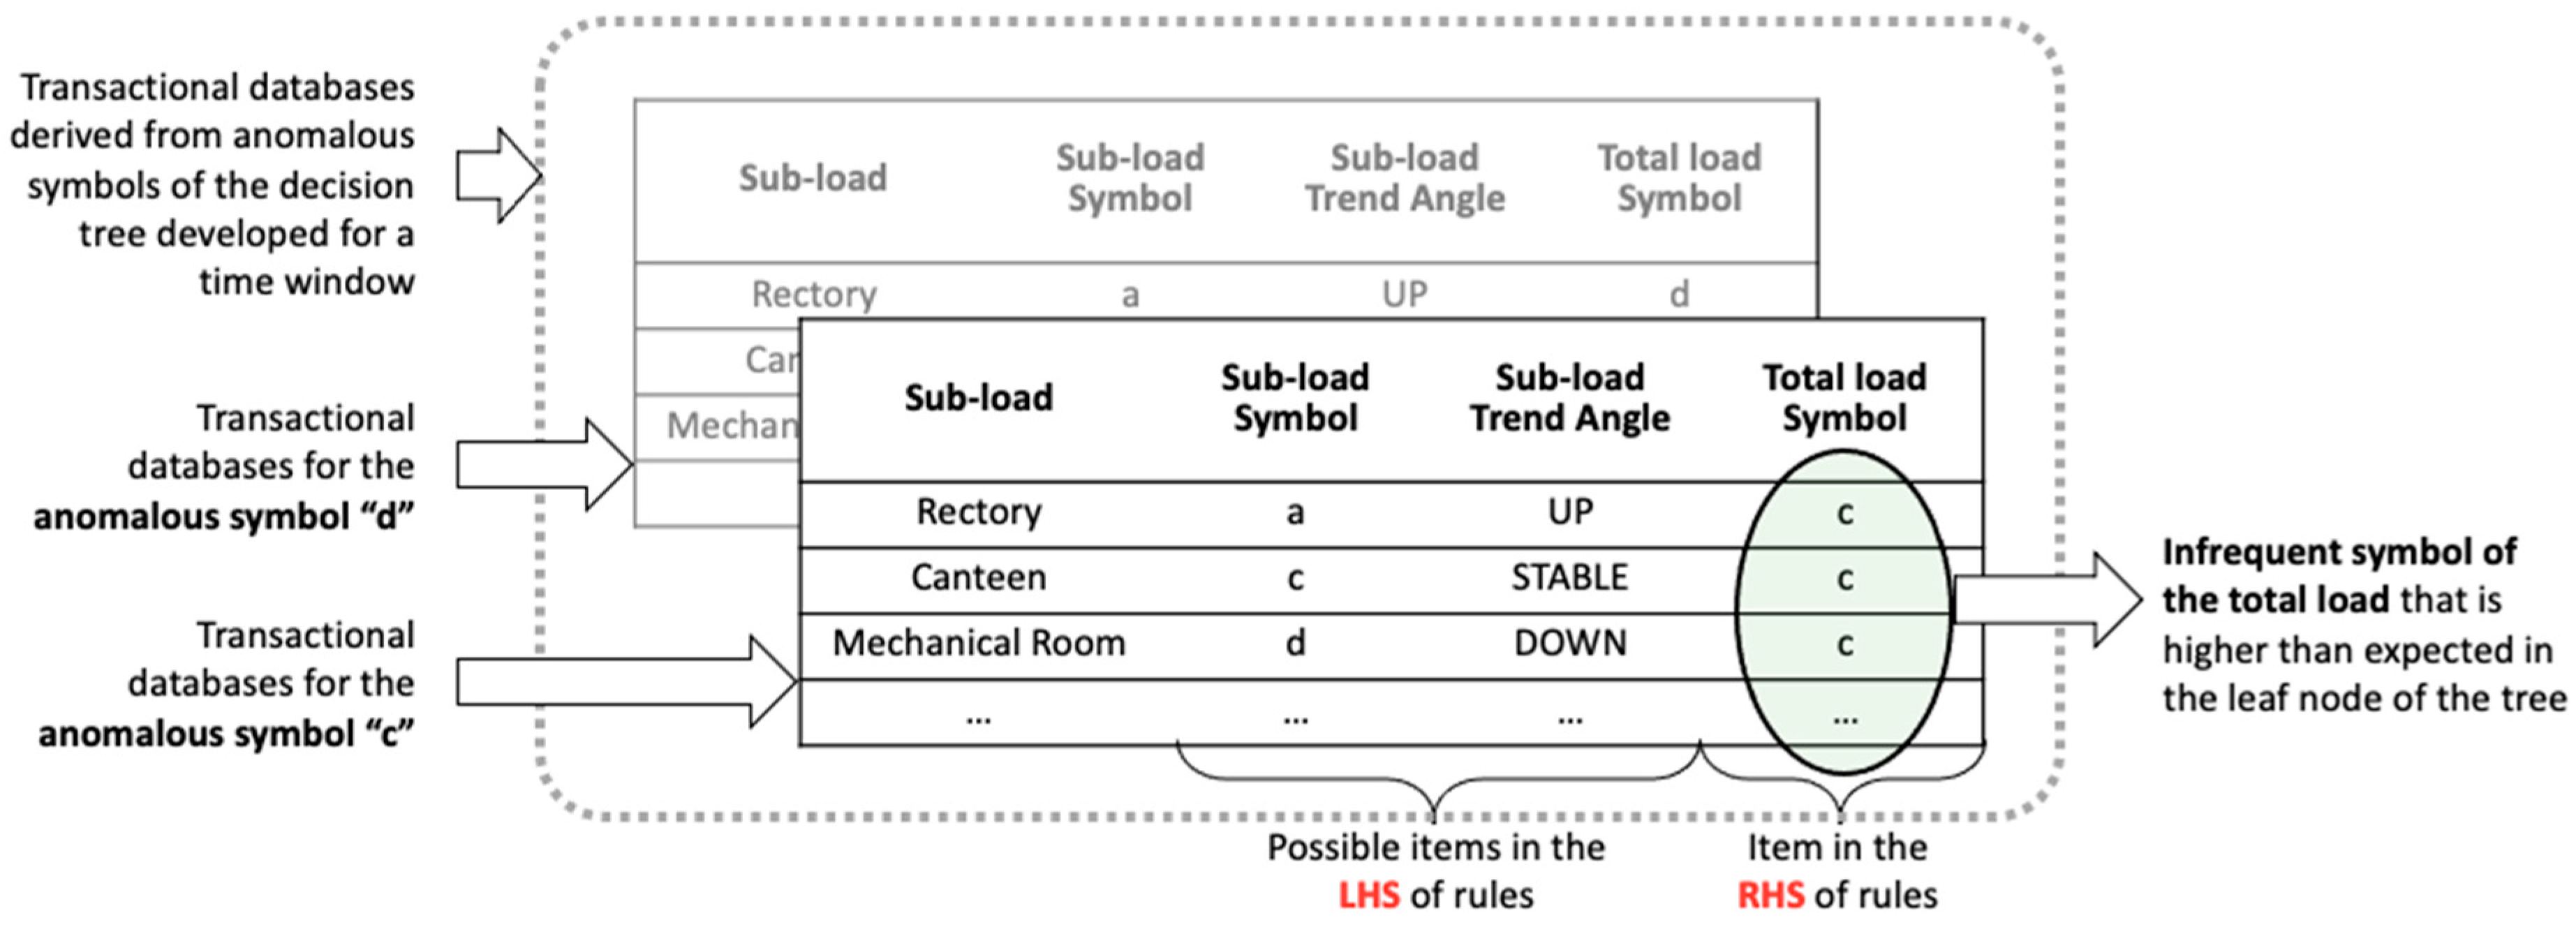
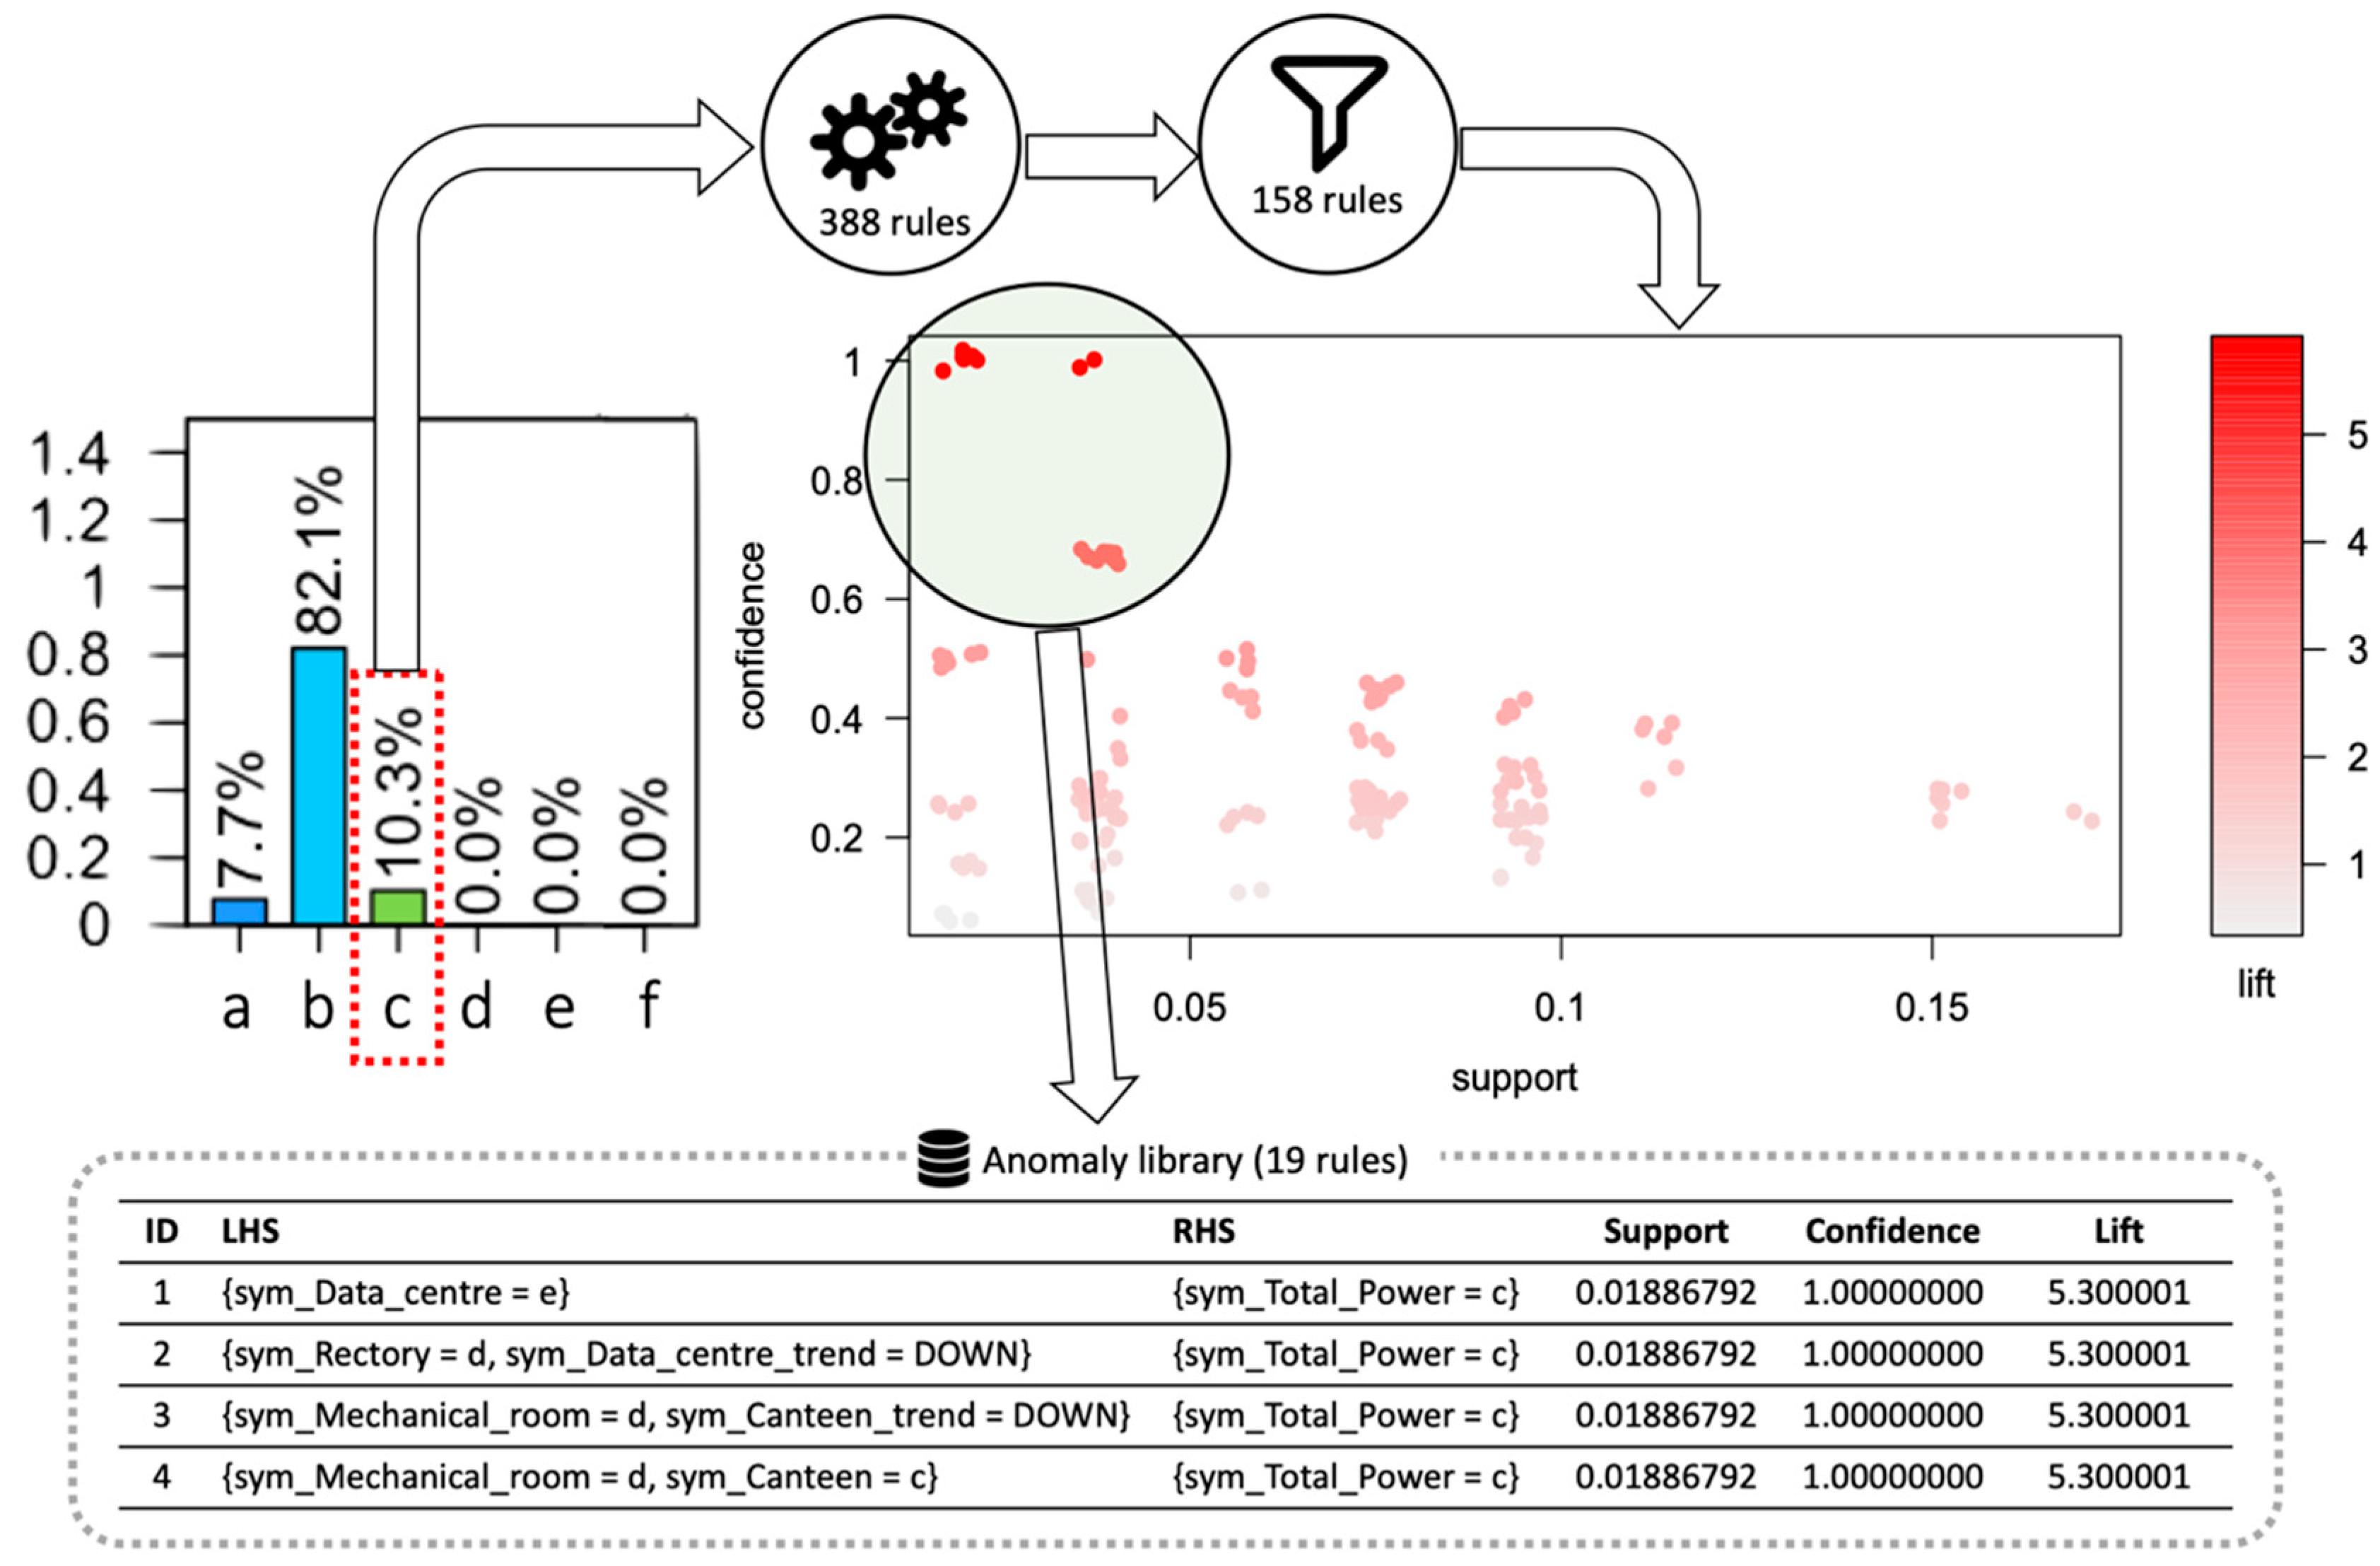
- Diagnosis at sub-load level: Once the classification models were developed, a post-mining phase was performed. The post-mining phase was aimed at searching historical relationships between misclassified total electrical load symbols and specific trends of sub-loads occurred in same time window. The process is described in Figure 6. The anomalous symbols identified in the training phase of the models were extracted and stored in a categorical data frame (Step-1 in Figure 6). From time series of sub-loads, the mean value and the trend angle were extracted. They were categorised through the aSAX process and then added to the categorical data frame (Step-2 in Figure 6). This data frame was then transformed into a transactional database on which ARM was applied (Step-3 in Figure 6). The LHS is composed of the additional categorical variables related to sub-loads, while RHS contains only the total electrical load anomalous symbol. ARM automatically extracts a set of rules which connects the historical infrequent behaviour of the total electrical load with the sub-load conditions. This process was implemented through the R package “arules” [47]. Resulting rules were then sorted and filtered setting appropriate interest measures parameters such as support, confidence and lift (Step-4 in Figure 6). Filtered rules were then stored within an anomaly library where they were ranked to show which sub-load condition (for example high electrical load or significantly uptrend) was responsible for the anomalous total electrical load behaviour. The tool gives a critical insight of the historical energy behaviour and, when implemented in real time load analysis, can provide useful feedback on which energy management actions are needed.
5. Results
5.1. Pre-Processing
5.2. Time Series Abstraction
5.3. Anomaly Detection at Total Electrical Load Level
- Day type: input ordinal categorical variable representative of each day of the week with values from 1 (Monday) to 7 (Sunday);
- Holiday: input binary categorical variable YES/NO capable of distinguishing working from non-working days;
- Total Power pre: mean total electrical load (in kW) calculated in the previous time window to the one considered for the classification (numerical input variable);
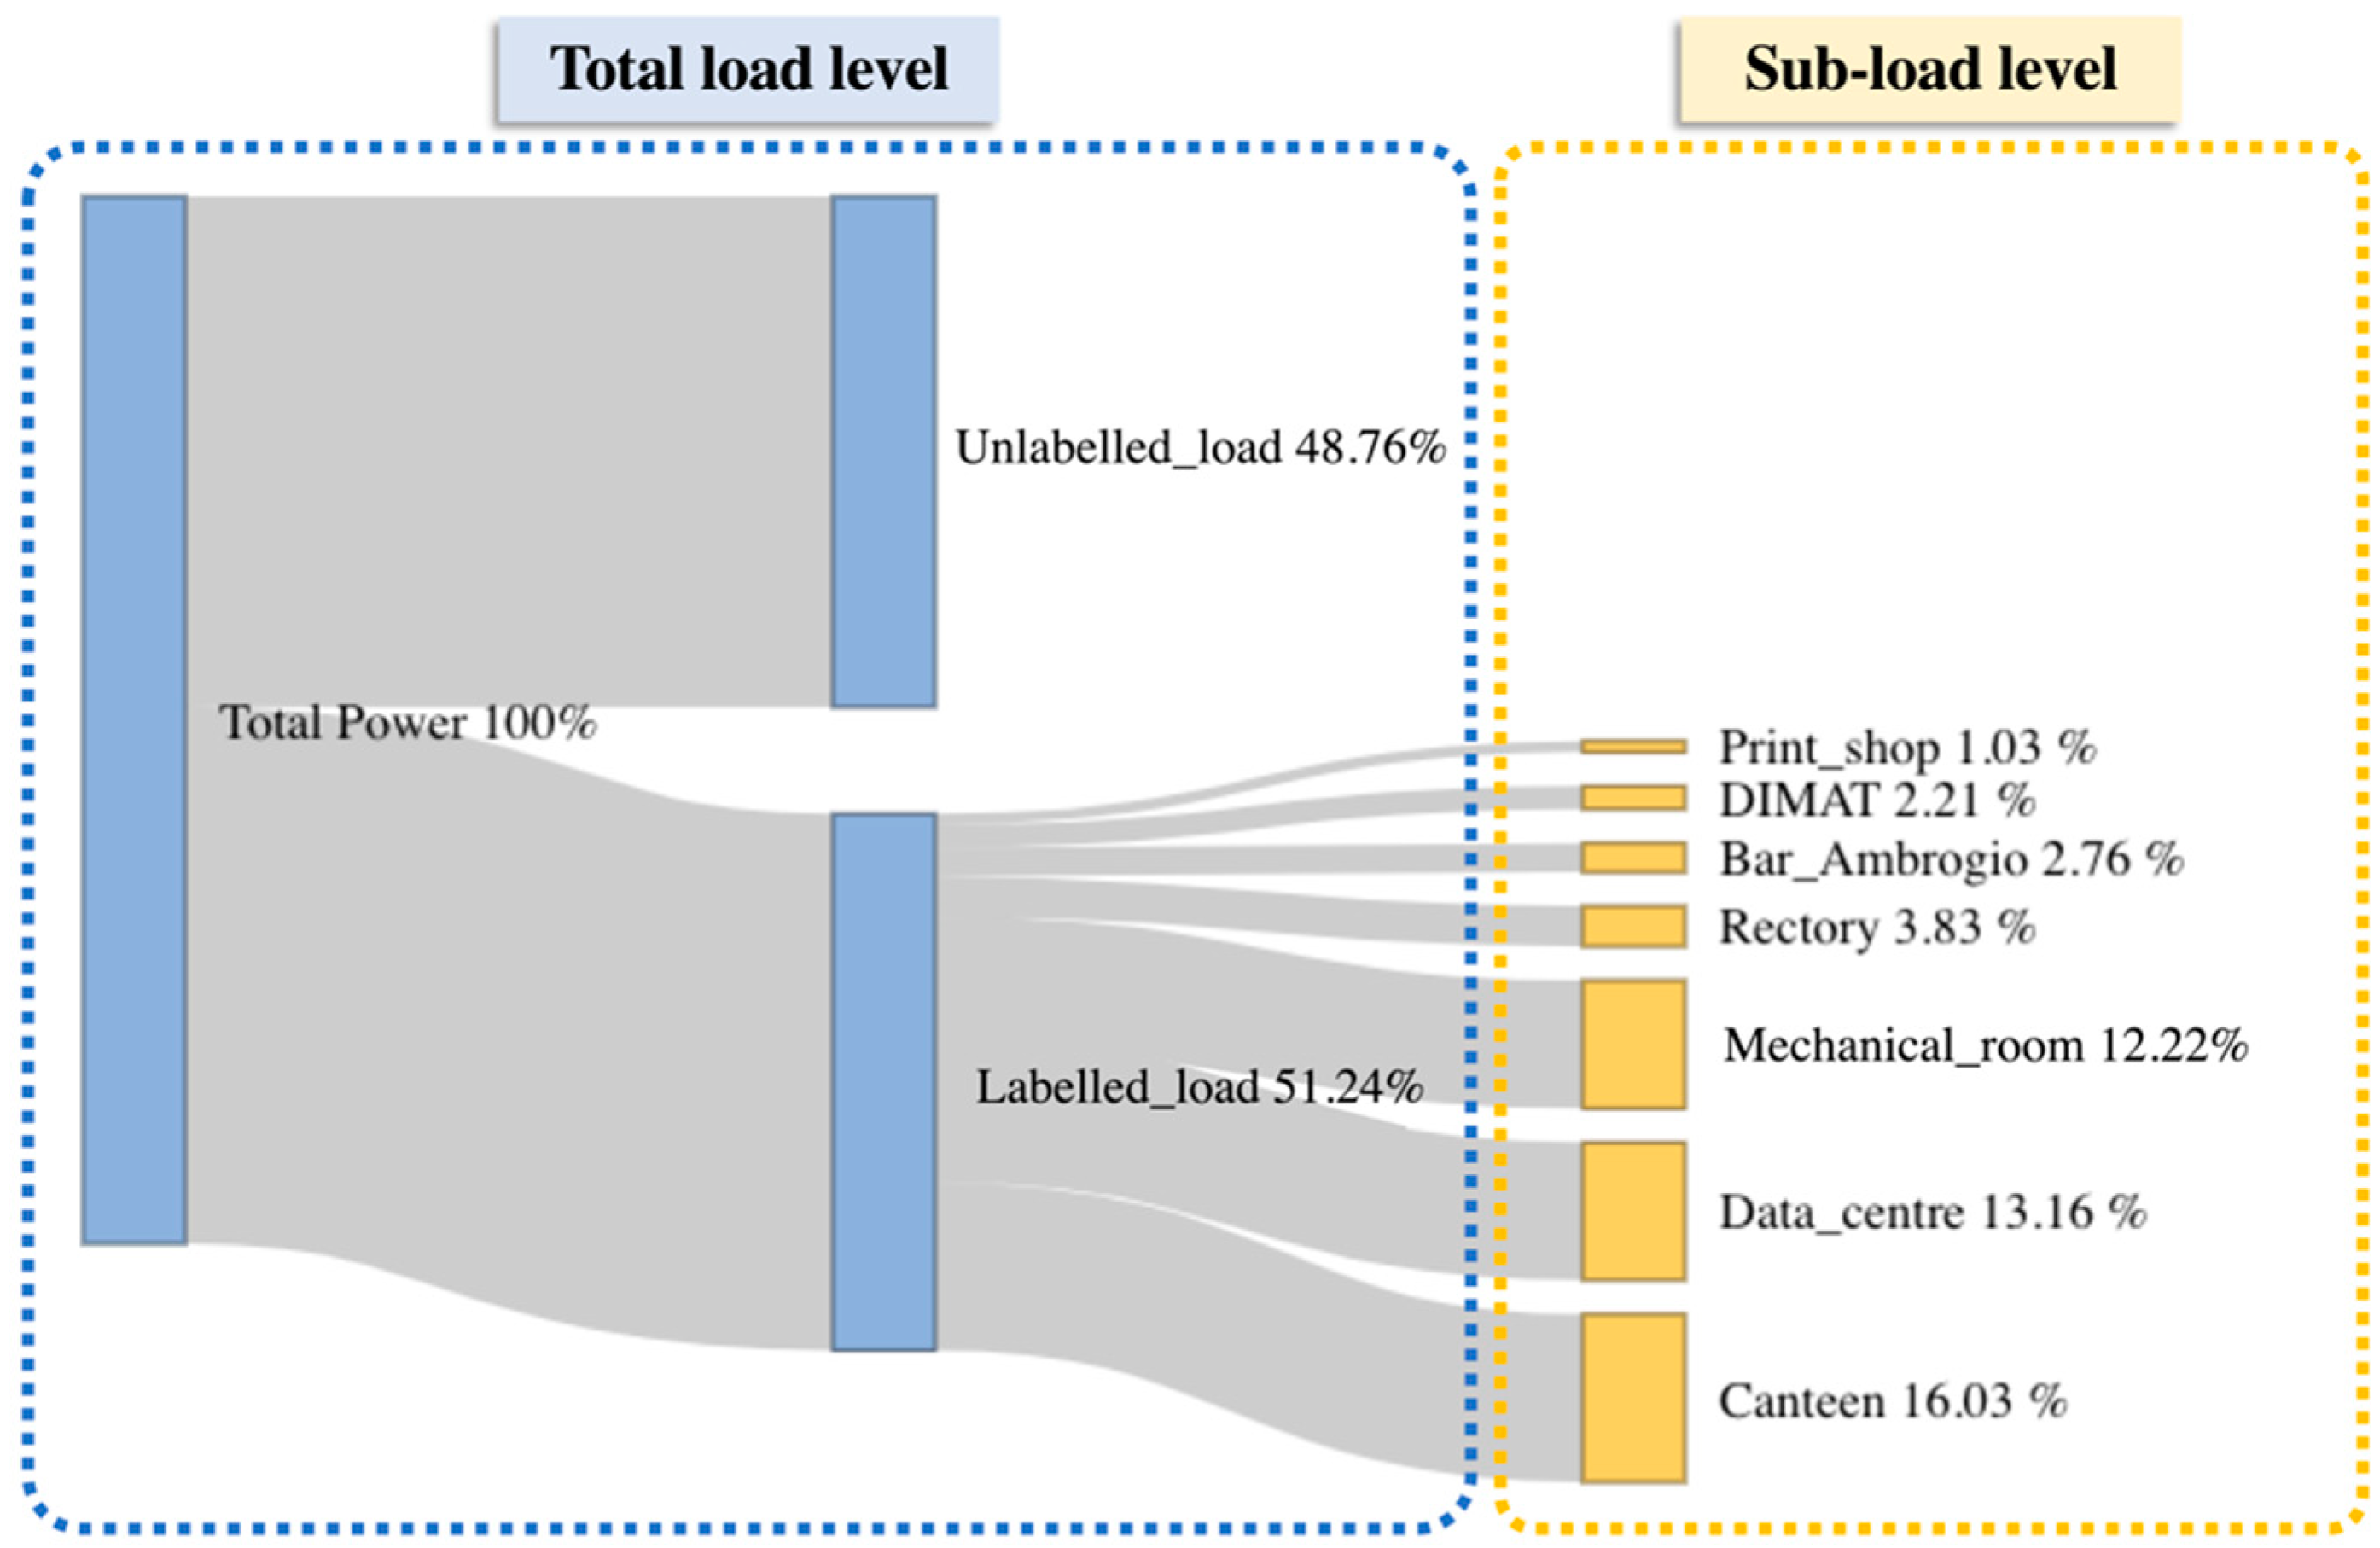
- Canteen: mean electrical load (in kW) of the canteen calculated in the time window considered for the classification (numerical input variable);
- Mechanical room: mean electrical load (in kW) of the mechanical room calculated in the time window considered for the classification (numerical input variable);
- Symbol: target categorical variable representative of the encoded symbol of the total electrical load in a time window.
5.4. Diagnosis at Sub-Load Level
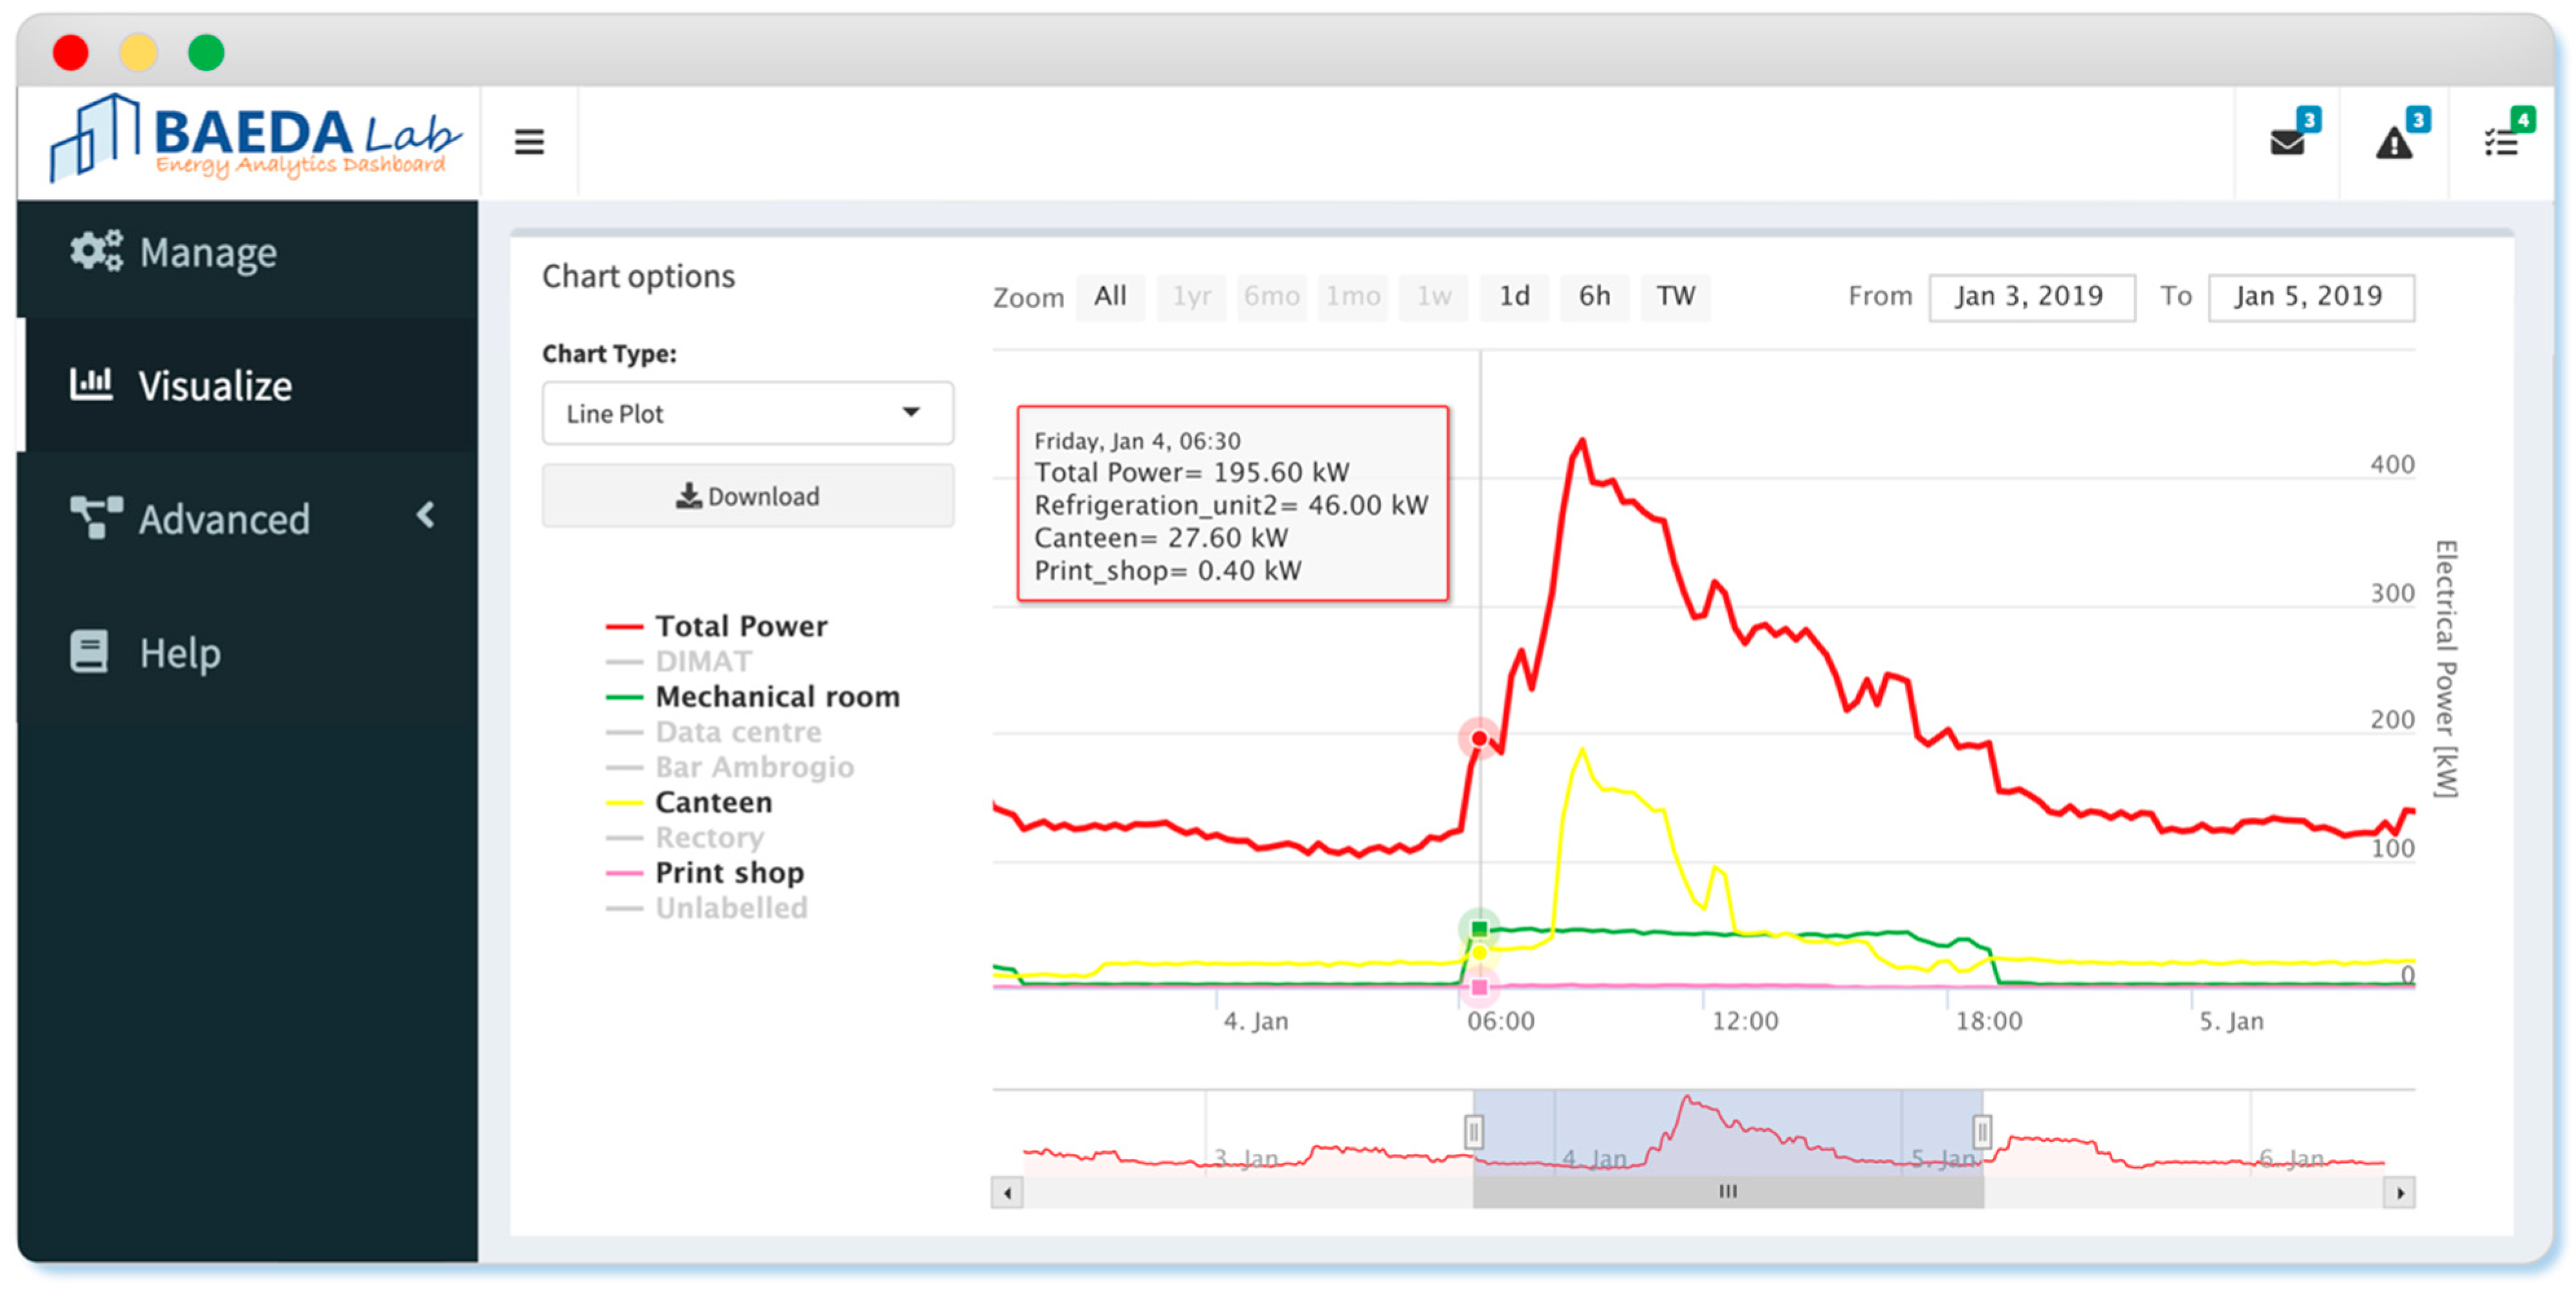
5.5. Deployment of the ADD Tool
- The actual symbol was the same as the predicted one. This means that given the boundaries conditions, the total electrical load of that time window is behaving as expected, then no further diagnosis is requested;
- The actual symbol was different from the predicted symbol and indicated a lower electrical load than expected. This means that even though the total electrical load of that time window is not behaving as expected, no further diagnosis is required. This is due to the focus of the methodology for which an anomaly is related only to higher consumption than expected;
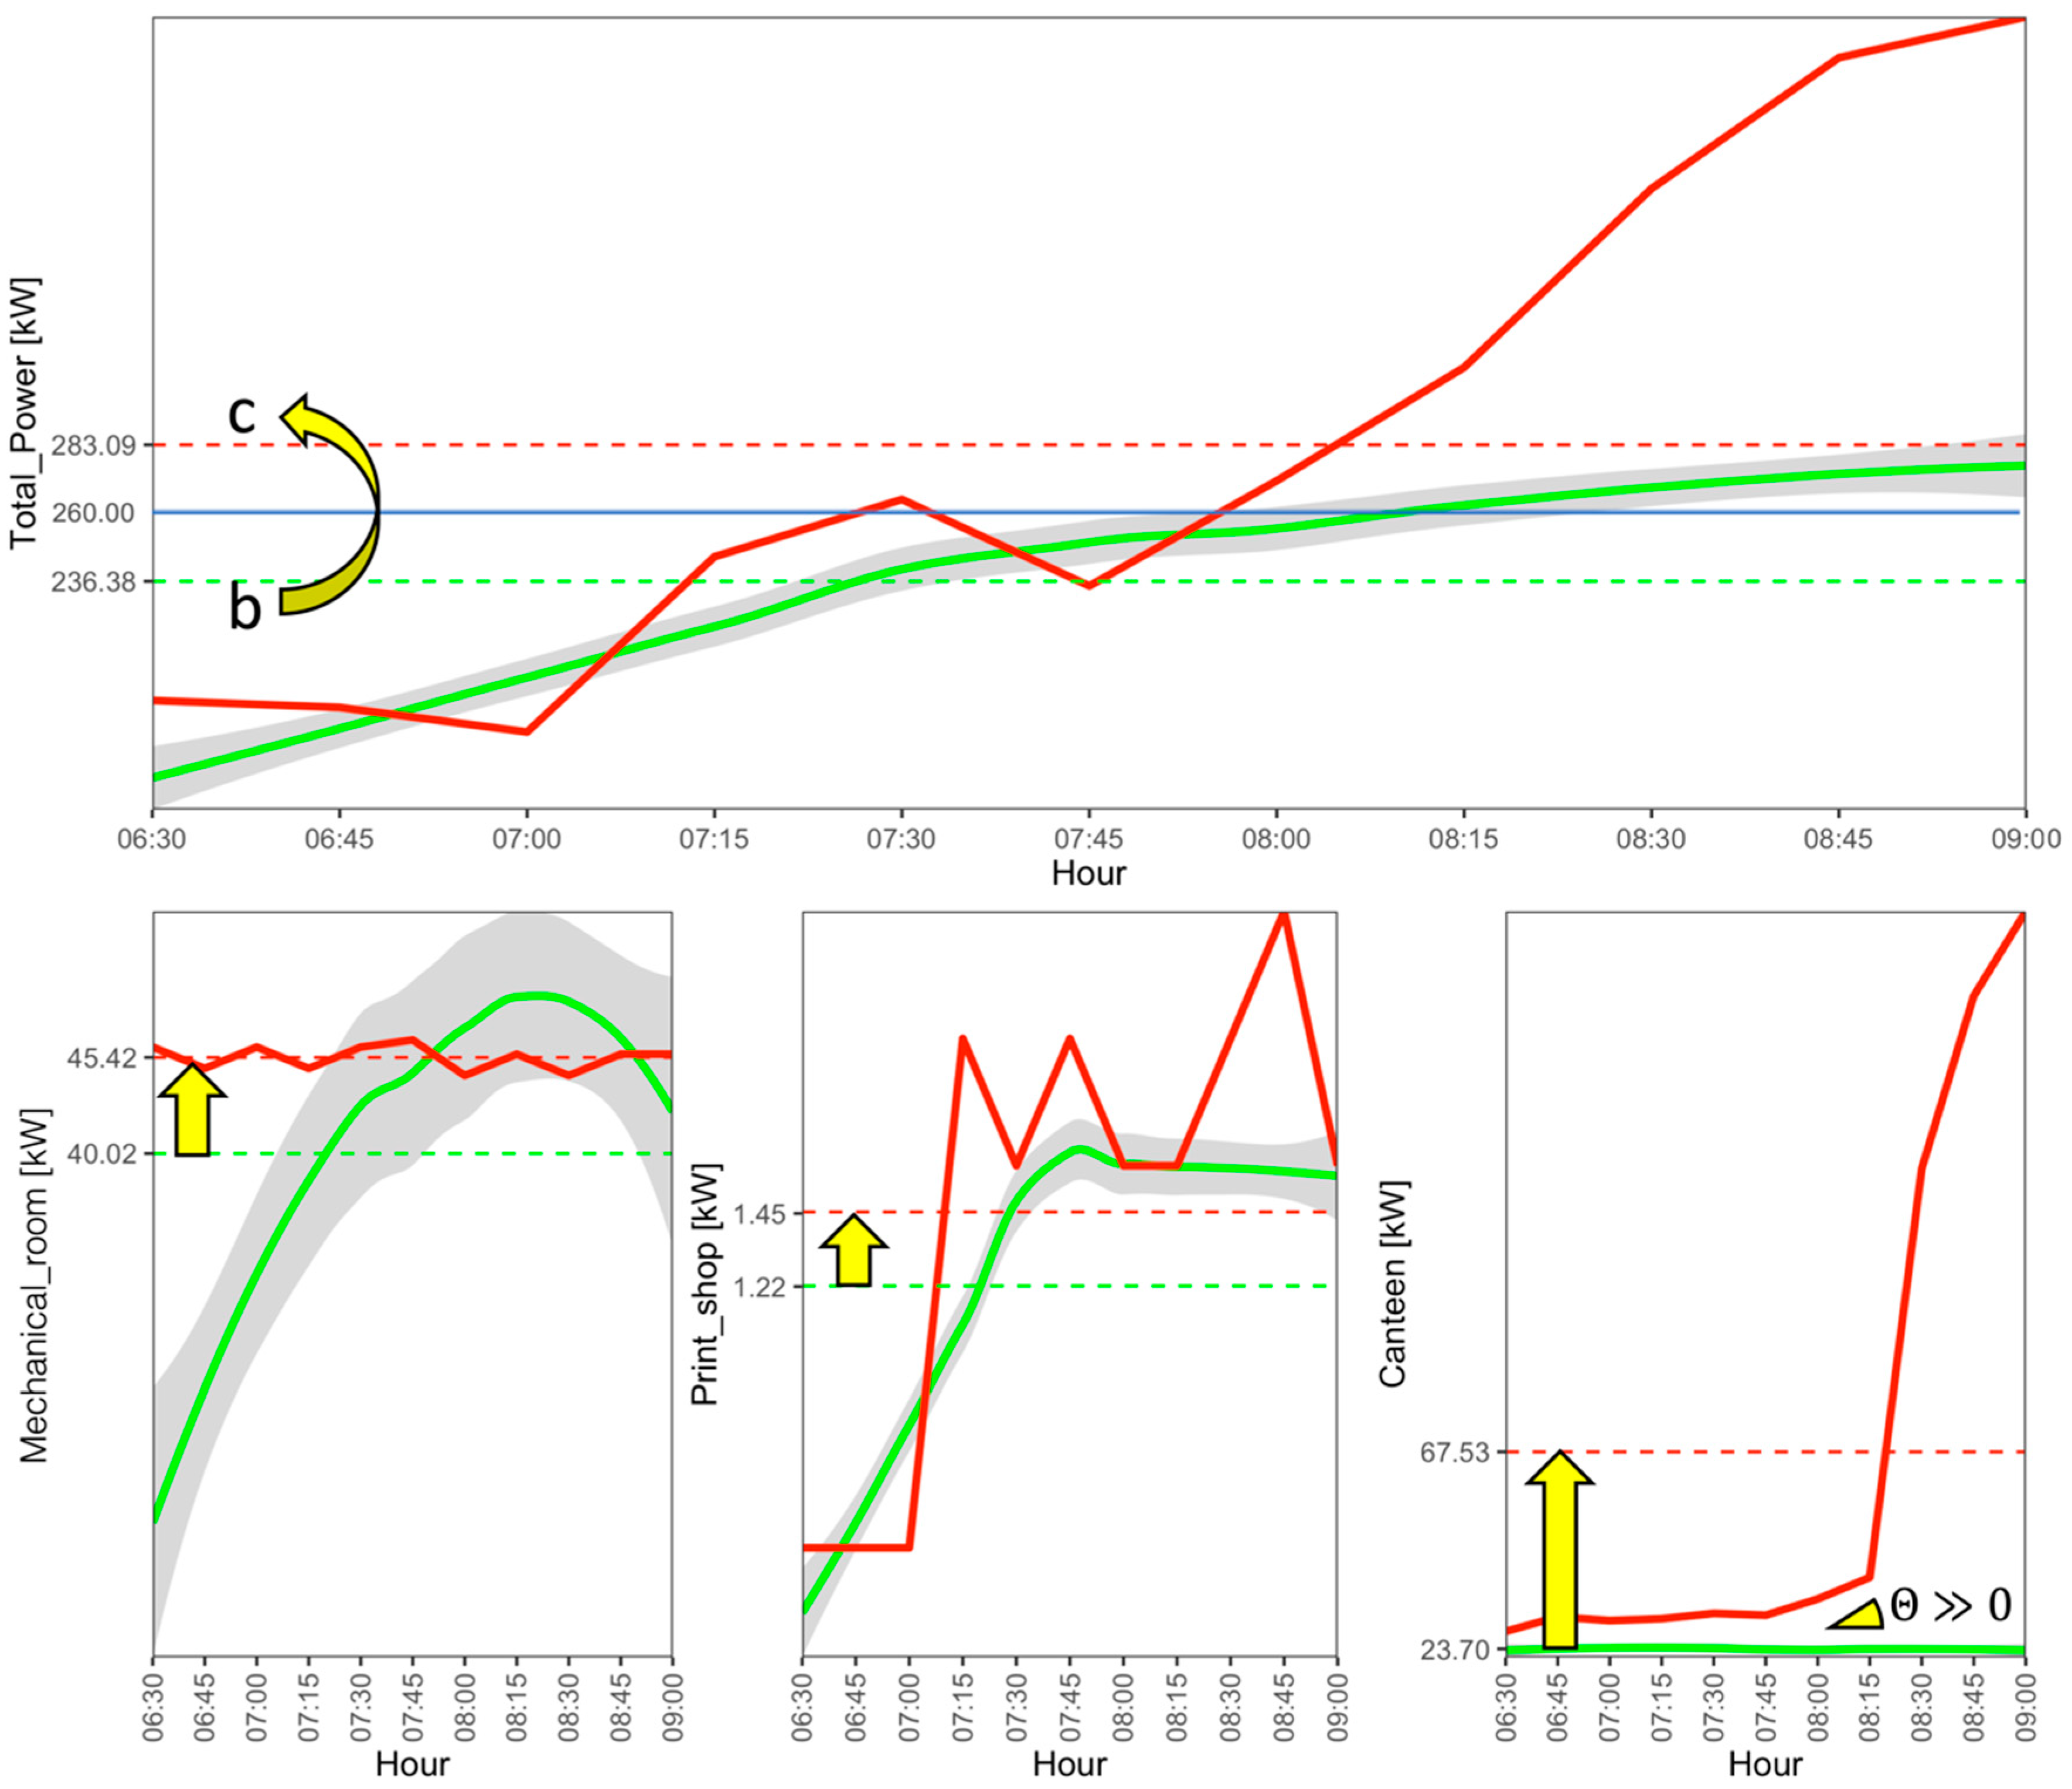
- The actual symbol was different from the predicted symbol and indicated a higher electrical load than expected. This means that given the boundaries conditions, the total electrical load of that time window is higher than expected, and then a further investigation is needed.
- Printshop electrical load symbol “c”.
- Mechanical room electrical load symbol “c”.
- Canteen electrical load symbol “c”.
- Canteen trend angle symbol “UP”.
6. Discussion of the Results
7. Conclusions and Future Work
Author Contributions
Funding
Institutional Review Board Statement
Informed Consent Statement
Data Availability Statement
Acknowledgments
Conflicts of Interest
References
- IEA. Buildings A Source of Enormous Untapped Efficiency Potential. Available online: https://www.iea.org/topics/buildings (accessed on 7 September 2020).
- Fan, C.; Yan, D.; Xiao, F.; Li, A.; An, J.; Kang, X. Advanced data analytics for enhancing building performances: From data-driven to big data-driven approaches. Build. Simul. 2020. [Google Scholar] [CrossRef]
- Capozzoli, A.; Mechri, H.E.; Corrado, V. Impacts of architectural design choices on building energy performance applications of uncertainty and sensitivity techniques. In Proceedings of the IBPSA 2009 International Building Performance Simulation Association, Glasgow, Scotland, 27–30 July 2009; pp. 1000–1007. [Google Scholar]
- Capozzoli, A.; Cerquitelli, T.; Piscitelli, M.S. Enhancing Energy Efficiency in Buildings Through Innovative Data Analytics Technologies. In Pervasive Computing; Elsevier: Amsterdam, The Netherlands, 2016; ISBN 9780128037027. [Google Scholar]
- Miller, C.; Meggers, F. The Building Data Genome Project: An open, public data set from non-residential building electrical meters. Energy Proc. 2017, 122, 439–444. [Google Scholar] [CrossRef]
- Miller, C.; Kathirgamanathan, A.; Picchetti, B.; Arjunan, P.; Park, J.Y.; Nagy, Z.; Raftery, P.; Hobson, B.W.; Shi, Z.; Meggers, F. The Building Data Genome Project 2, energy meter data from the ASHRAE Great Energy Predictor III competition. Sci. Data 2020, 7, 1–13. [Google Scholar] [CrossRef] [PubMed]
- Attanasio, A.; Piscitelli, M.S.; Chiusano, S.; Capozzoli, A.; Cerquitelli, T. Towards an automated, fast and interpretable estimation model of heating energy demand: A data-driven approach exploiting building energy certificates. Energies 2019, 12, 1273. [Google Scholar] [CrossRef]
- Manfren, M.; Nastasi, B.; Groppi, D.; Astiaso Garcia, D. Open data and energy analytics—An analysis of essential information for energy system planning, design and operation. Energy 2020, 213, 118803. [Google Scholar] [CrossRef]
- Kramer, H.; Lin, G.; Granderson, J.; Curtin, C.; Crowe, E. Synthesis of Year One Outcomes in the Smart Energy Analytics Campaign Building Technology and Urban Systems Division; Lawrence Berkeley National Laboratory: Berkeley, CA, USA, 2017. [Google Scholar]
- Zhang, C.; Zhao, Y.; Li, T.; Zhang, X. A post mining method for extracting value from massive amounts of building operation data. Energy Build. 2020, 223. [Google Scholar] [CrossRef]
- Fan, C.; Sun, Y.; Shan, K.; Xiao, F.; Wang, J. Discovering gradual patterns in building operations for improving building energy efficiency. Appl. Energy 2018, 224, 116–123. [Google Scholar] [CrossRef]
- Himeur, Y.; Ghanem, K.; Alsalemi, A.; Bensaali, F.; Amira, A. Anomaly detection of energy consumption in buildings: A review, current trends and new perspectives. arXiv 2020, arXiv:2010.04560. [Google Scholar]
- Esling, P.; Agon, C. Time-series data mining. ACM Comput. Surv. 2012, 45. [Google Scholar] [CrossRef]
- Chou, J.S.; Telaga, A.S. Real-time detection of anomalous power consumption. Renew. Sustain. Energy Rev. 2014, 33, 400–411. [Google Scholar] [CrossRef]
- Fan, C.; Xiao, F.; Zhao, Y.; Wang, J. Analytical investigation of autoencoder-based methods for unsupervised anomaly detection in building energy data. Appl. Energy 2018, 211, 1123–1135. [Google Scholar] [CrossRef]
- Pereira, J.; Silveira, M. Unsupervised Anomaly Detection in Energy Time Series Data Using Variational Recurrent Autoencoders with Attention. In Proceedings of the 17th IEEE International Conference on Machine Learning Applications ICMLA, Orlando, FL, USA, 17–20 December 2018; pp. 1275–1282. [Google Scholar] [CrossRef]
- Capozzoli, A.; Piscitelli, M.S.; Brandi, S.; Grassi, D.; Chicco, G. Automated load pattern learning and anomaly detection for enhancing energy management in smart buildings. Energy 2018, 157, 336–352. [Google Scholar] [CrossRef]
- Capozzoli, A.; Piscitelli, M.S.; Brandi, S. Mining typical load profiles in buildings to support energy management in the smart city context. Energy Proc. 2017, 134, 865–874. [Google Scholar] [CrossRef]
- Zhao, Y.; Zhang, C.; Zhang, Y.; Wang, Z.; Li, J. A review of data mining technologies in building energy systems: Load prediction, pattern identification, fault detection and diagnosis. Energy Built Environ. 2020, 1, 149–164. [Google Scholar] [CrossRef]
- Miller, C.; Nagy, Z.; Schlueter, A. Automated daily pattern filtering of measured building performance data. Autom. Constr. 2015, 49, 1–17. [Google Scholar] [CrossRef]
- Li, K.; Yang, R.J.; Robinson, D.; Ma, J.; Ma, Z. An agglomerative hierarchical clustering-based strategy using Shared Nearest Neighbours and multiple dissimilarity measures to identify typical daily electricity usage profiles of university library buildings. Energy 2019, 174, 735–748. [Google Scholar] [CrossRef]
- Piscitelli, M.S.; Mazzarelli, D.M.; Capozzoli, A. Enhancing operational performance of AHUs through an advanced fault detection and diagnosis process based on temporal association and decision rules. Energy Build. 2020, 226, 110369. [Google Scholar] [CrossRef]
- David, M.C.; Zareipour, H. Data association mining for identifying lighting energy waste patterns in educational institutes. Energy Build. 2013, 62, 210–216. [Google Scholar] [CrossRef]
- Rossi, B.; Chren, S.; Buhnova, B.; Pitner, T. Anomaly Detection in Smart Grid Data: An Experience Report. In Proceedings of the 2016 IEEE International Conference on Systems, Man, and Cybernetics (SMC), Budapest, Hungary, 9–12 October 2016; pp. 2313–2318. [Google Scholar]
- Xiao, F.; Fan, C. Data mining in building automation system for improving building operational performance. Energy Build. 2014, 75, 109–118. [Google Scholar] [CrossRef]
- Piscitelli, M.S.; Brandi, S.; Capozzoli, A.; Xiao, F. A data analytics-based tool for the detection and diagnosis of anomalous daily energy patterns in buildings. Build. Simul. 2020, 1–17. [Google Scholar] [CrossRef]
- Imayakumar, A.A.; Dubey, A.; Bose, A. Anomaly Detection for Primary Distribution System Measurements using Principal Component Analysis. In Proceedings of the 2020 IEEE Texas Power and Energy Conference (TPEC), College Station, TX, USA, 6–7 February 2020; pp. 1–6. [Google Scholar]
- Zhang, L.; Wan, L.; Xiao, Y.; Li, S.; Zhu, C. Anomaly Detection method of Smart Meters data based on GMM-LDA clustering feature Learning and PSO Support Vector Machine. In Proceedings of the 2019 IEEE Sustainable Power and Energy Conference (iSPEC), Beijing, China, 20–24 November 2019; pp. 2407–2412. [Google Scholar]
- Khoshrou, A.; Pauwels, E.J. Data-driven pattern identification and outlier detection in time series. Adv. Intell. Syst. Comput. 2019, 858, 471–484. [Google Scholar] [CrossRef]
- Lin, J.; Keogh, E.; Wei, L.; Lonardi, S. Experiencing SAX: A Novel Symbolic Representation of Time Series. Data Min. Knowl. Discov. 2007, 15, 107–144. [Google Scholar]
- Fan, C.; Xiao, F.; Madsen, H.; Wang, D. Temporal knowledge discovery in big BAS data for building energy management. Energy Build. 2015, 109, 75–89. [Google Scholar] [CrossRef]
- Yan, R.; Ma, Z.; Zhao, Y.; Kokogiannakis, G. A decision tree based data-driven diagnostic strategy for air handling units. Energy Build. 2016, 133, 37–45. [Google Scholar] [CrossRef]
- Liu, J.; Shi, D.; Li, G.; Xie, Y.; Li, K.; Liu, B.; Ru, Z. Data-driven and association rule mining-based fault diagnosis and action mechanism analysis for building chillers. Energy Build. 2020, 216, 109957. [Google Scholar] [CrossRef]
- Tightiz, L.; Nasab, M.A.; Yang, H.; Addeh, A. An intelligent system based on optimized ANFIS and association rules for power transformer fault diagnosis. ISA Trans. 2020, 103, 63–74. [Google Scholar] [CrossRef] [PubMed]
- Huang, R.; Liu, J.; Chen, H.; Li, Z.; Liu, J.; Li, G.; Guo, Y.; Wang, J. An effective fault diagnosis method for centrifugal chillers using associative classification. Appl. Therm. Eng. 2018, 136, 633–642. [Google Scholar] [CrossRef]
- Zhang, T.; Lu, J.; Zhang, G.; Ding, Q. Fault diagnosis of transformer using association rule mining and knowledge base. In Proceedings of the 2010 10th International Conference on Intelligent Systems Design and Applications, Cairo, Egypt, 29 November–1 December 2010; pp. 737–742. [Google Scholar]
- Grubinger, T.; Zeileis, A.; Pfeiffer, K.P. Evtree: Evolutionary learning of globally optimal classification and regression trees in R. J. Stat. Softw. 2014, 61, 1–29. [Google Scholar] [CrossRef]
- Pham, N.D.; Le, Q.L.; Dang, T.K. HOT aSAX: A Novel Adaptive Symbolic Representation for Time Series Discords Discovery. In Lecture Notes in Computer Science; (including subseries Lecture Notes in Artificial Intelligence and Lecture Notes in Bioinformatics); Springer: Berlin, Germany, 2010; Volume 5990, pp. 113–121. ISBN 3642121446. [Google Scholar]
- Keogh, E.; Chakrabarti, K.; Pazzani, M.; Mehrotra, S. Locally adaptive dimensionality reduction for indexing large time series databases. In Proceedings of the 2001 ACM SIGMOD International Conference on Management of Data, Santa Barbara, CA, USA, 21–24 May 2001; pp. 151–162. [Google Scholar]
- Keogh, E.; Chakrabarti, K.; Pazzani, M.; Mehrotra, S. Dimensionality Reduction for Fast Similarity Search in Large Time Series Databases. Knowl. Inf. Syst. 2001, 3, 263–286. [Google Scholar] [CrossRef]
- Zhang, Y.; Duan, L.; Duan, M. A new feature extraction approach using improved symbolic aggregate approximation for machinery intelligent diagnosis. Meas. J. Int. Meas. Confed. 2019, 133, 468–478. [Google Scholar] [CrossRef]
- Yu, Y.; Zhu, Y.; Wan, D.; Liu, H.; Zhao, Q. A novel symbolic aggregate approximation for time series. Adv. Intell. Syst. Comput. 2019, 935, 805–822. [Google Scholar] [CrossRef]
- Tan, P.-N.; Steinbach, M.; Karpatne, A.; Kumar, V. Cluster Analysis: Basic Concepts, and Algorithms. In Introduction to Data Mining; Pearson: London, UK, 2019; p. 526. [Google Scholar]
- Piscitelli, M.S.; Brandi, S.; Capozzoli, A. Recognition and classification of typical load profiles in buildings with non-intrusive learning approach. Appl. Energy 2019, 255, 113727. [Google Scholar] [CrossRef]
- Aggarwal, C.C. Data Data Mining: The Textbook; Springer: Berlin, Germany, 2012. [Google Scholar]
- Charrad, M.; Ghazzali, N.; Boiteau, V.; Niknafs, A. NbClust: An R Package for Determining the. J. Stat. Softw. 2014, 61, 1–36. [Google Scholar] [CrossRef]
- Michael, H.; Buchta, C.; Gruen, B.; Hornik, K.; Johnson, I.; Borgelt, C. Package ‘ arules ’: Mining Association Rules and Frequent Itemsets Description; R Foundation for Statistical Computing: Vienna, Austria, 2020; pp. 1–109. [Google Scholar]
- R Core Team. R: A Language and Environment for Statistical Computing; R Foundation for Statistical Computing: Vienna, Austria, 2017. [Google Scholar]
- Atkinson, E.J.; Therneau, T.M. An Introduction to Recursive Partitioning Using the RPART Routines. Mayo Clin. Sect. Biostat. Tech. Rep. 2000, 61, 33. [Google Scholar]
- Hahsler, M.; Chelluboina, S. Visualizing Association Rules: Introduction to the R-extension Package arulesViz. In R Project Module; R Foundation for Statistical Computing: Vienna, Austria, 2011; pp. 1–24. [Google Scholar]
- Chang, W.; Cheng, J.; Allaire, J.; Xie, Y.; McPherson, J. Package ‘ shiny ’: Web Application Framework for R; R Foundation for Statistical Computing: Vienna, Austria, 2020; p. 238. [Google Scholar]
- Chang, W.; Ribeiro, B.B. Package “ShinyDashboard”: Create Dashboards with “Shiny”. J. Stat. Softw. 2018, 14, 1–27. [Google Scholar]


| ID | Time Window | Duration |
|---|---|---|
| 1 | 00:00–06:29 | 6 h 30 min |
| 2 | 06:30–08:59 | 2 h 30 min |
| 3 | 09:00–15:44 | 6 h 45 min |
| 4 | 15:45–19:14 | 3 h 30 min |
| 5 | 19:15–23:59 | 4 h 45 min |
| Time Window | Node | Decision Rule | Symbol | Accuracy |
|---|---|---|---|---|
| 00:00–06:29 | 1 | - | ⇒ a | 97.3% |
| 06:30–08:59 | 2 | IF Holiday = Yes | ⇒ a | 92.0% |
| 5 | IF Holiday = No AND Mechanical room < 85.84 kW AND Canteen < 96.4 kW | ⇒ b | 82.1% | |
| 6 | IF Holiday = No AND Mechanical room < 85.84 kW AND Canteen ≥ 96.4 kW | ⇒ d | 89.7% | |
| 8 | IF Holiday = No AND Mechanical room ≥ 85.84 kW AND Canteen < 108.4 kW | ⇒ c | 71.4% | |
| 9 | IF Holiday = No AND Mechanical room ≥ 85.84 kW AND Canteen ≥ 108.4 kW | ⇒ e | 86.5% | |
| 09:00–15:44 | 3 | IF Canteen < 54.4 kW AND Holiday = Yes | ⇒ a | 96.0% |
| 5 | IF Canteen < 54.4 kW AND Holiday = No AND Total Power pre < 257.1 kW | ⇒ b | 76.5% | |
| 6 | IF Canteen < 54.4 kW AND Holiday = No AND Total Power pre ≥ 257.1 kW | ⇒ c | 85.0% | |
| 8 | IF Canteen ≥ 54.4 kW AND Canteen < 143.5 kW | ⇒ e | 73.9% | |
| 10 | IF Canteen ≥ 143.5 kW AND Mechanical room < 38 kW | ⇒ e | 86.0% | |
| 11 | IF Canteen ≥ 143.5 kW AND Mechanical room ≥ 38 kW | ⇒ f | 81.1% | |
| 15:45–19:14 | 2 | IF Total Power pre < 388.8 kW | ⇒ a | 87.4% |
| 4 | IF Total Power pre ≥ 388.8 kW AND Total Power pre < 614 kW | ⇒ d | 86.5% | |
| 5 | IF Total Power pre ≥ 388.8 kW AND Total Power pre ≥ 614 kW | ⇒ d | 85.4% | |
| 19:15–23:59 | 2 | IF Holiday = Yes | ⇒ a | 96.0% |
| 4 | IF Holiday = No AND Day Type = {6,7} | ⇒ a | 97.2% | |
| 6 | IF Holiday = No AND Day Type = {1,2,3,4,5} AND Canteen < 16.5 kW | ⇒ a | 85.5% | |
| 7 | IF Holiday = No AND Day Type = {1,2,3,4,5} AND Canteen ≥ 16.5 kW | ⇒ b | 87.6% |
| Time Window | Training (80% 2018) | Test (20% 2018) | Validation (Jan. 2019) |
|---|---|---|---|
| 00:00–06:29 | 97.30% | 96.89% | 100% |
| 06:30–08:59 | 87.33% | 82.19% | 93.55% |
| 09:00–15:44 | 83.56% | 79.45% | 58.06% |
| 15:45–19:14 | 86.64% | 86.30% | 96.77% |
| 19:15–24:00 | 89.72% | 86.30% | 96.77% |
| Mean | 88.91% | 86.22% | 89.03% |
Publisher’s Note: MDPI stays neutral with regard to jurisdictional claims in published maps and institutional affiliations. |
© 2021 by the authors. Licensee MDPI, Basel, Switzerland. This article is an open access article distributed under the terms and conditions of the Creative Commons Attribution (CC BY) license (http://creativecommons.org/licenses/by/4.0/).
Share and Cite
Chiosa, R.; Piscitelli, M.S.; Capozzoli, A. A Data Analytics-Based Energy Information System (EIS) Tool to Perform Meter-Level Anomaly Detection and Diagnosis in Buildings. Energies 2021, 14, 237. https://doi.org/10.3390/en14010237
Chiosa R, Piscitelli MS, Capozzoli A. A Data Analytics-Based Energy Information System (EIS) Tool to Perform Meter-Level Anomaly Detection and Diagnosis in Buildings. Energies. 2021; 14(1):237. https://doi.org/10.3390/en14010237
Chicago/Turabian StyleChiosa, Roberto, Marco Savino Piscitelli, and Alfonso Capozzoli. 2021. "A Data Analytics-Based Energy Information System (EIS) Tool to Perform Meter-Level Anomaly Detection and Diagnosis in Buildings" Energies 14, no. 1: 237. https://doi.org/10.3390/en14010237
APA StyleChiosa, R., Piscitelli, M. S., & Capozzoli, A. (2021). A Data Analytics-Based Energy Information System (EIS) Tool to Perform Meter-Level Anomaly Detection and Diagnosis in Buildings. Energies, 14(1), 237. https://doi.org/10.3390/en14010237


