Abstract
The percentage of heat pumps used in thermal power plants (TPPs) in the fuel and energy balance is extremely low in in most countries. One of the reasons for this is the lack of a systematic approach to selecting and justifying the circuit solutions and equipment capacity. This article aims to develop a new method of calculating the maximum capacity of heat pumps. The method proposed in the article has elements of marginal analysis. It takes into account the limitation of heat pump capacity by break-even operation at electric power market (compensation of fuel expenses, connected with electric power production). In this case, the heat pump’s maximum allowable capacity depends on the electric capacity of TPP, electricity consumption for own needs, specific consumption of conditional fuel for electricity production, a ratio of prices for energy resources, and a conversion factor of heat pump. For TPP based on combined cycle gas turbine (CCGT) CCGT-450 with prices at the Russian energy resources markets at the level of 2019, when operating with the maximum heat load, the allowable heat pump capacity will be about 50 MW, and when operating with the minimum heat load—about 200 MW.
1. Introduction
Global environmental problems and the continuous increase in energy consumption worldwide require technologies that integrate renewable and secondary energy resources into the energy balance [1]. Active research work on the analysis and justification of low-potential heat (LPH) applications in existing heating systems by using heat pumps (HP) has been conducted all over the world.
Some authors consider the potential and features of HP as a distributed energy technology for specific technological and economic conditions (for example in Italy [2] and Great Britain [3]). Several studies are devoted to the analysis of environmental and market aspects of HP integration in heat supply systems of different countries (for example in China [4], Italy [5], and Poland [6]). The article [5] evaluates, among other things, the optimal share of HP in the Italian heat market.
Researchers in articles look at various options of HP application in systems of district heating based on the conditions of energy markets in Denmark [7], Sweden [8], Norway [9], and China [10]. There is also significant research done on heat pump technology applications aimed at improving the sustainability of energy supply in Spain [11], China [12], Norway [9], and Germany [13].
Some authors have analyzed the possibility of using HP in complex with separate power plants (hot water boilers [14], steam power plants [15], etc.). Heat pump technologies have a long history of research in Russia. Various schemes were analyzed [16], as well as artificial [17] and natural [18] sources of LPH for HP. The prospects for the use of HPs in centralized [19] and decentralized [20] heat supply systems were evaluated. The possibility of joint operation of heat pump units (HPUs) with TPP [21] and nuclear power plant [22] was analyzed.
Nevertheless, heat pump units (HPUs) have failed to find significant practical applications on TPP in many countries, partly due to cheap energy resources in these countries and partly due to “conservative” heat power methods.
A significant obstacle to the large-scale use of heat pump technologies is the lack of a clear understanding of the energy segment where they could be applied [23]. Traditionally, heat pumps are considered to be a decentralized energy production technology, while centralized heat supply and combined generation of electric and thermal energy are the basis of power industry several countries [24]. On the other hand, heat power plants produce a significant amount of low-potential heat, primarily in the cooling systems of steam turbine (ST) condensers; that can be used in HPUs [25]. The use of HP in the technological scheme of TPP will allow to use the considerable amount of waste heat, to increase the supply of thermal energy to the external consumer and also to reduce the loss of high-potential heat, decrease fuel and water consumption and, as a result, increase the marginal income of the TPP [26].
Long-term successful experience with large HPU application at a thermal power plant in Stockholm [27] provides a prospect for the use of large HPUs at Russian thermal power plants as well. However, as studies show [28], even the existing mode of HPU application at the Ropsten combined heat and power station (CHP) in Stockholm can be optimized based on changes in electricity and heat prices.
Selection and justification of HP capacity is one of the most challenging tasks in analyzing its potential use in a thermal power plant scheme. A scientific literature analysis made it evident that despite considerable development in heat pump technologies application, there are considerable gaps in justifying the level of HPUs capacity in terms of operation at the electric power market. At present, a unified HP capacity selection approach lacks. For example, in [29] a determination of the maximum capacity of a HPU (absorption HPU, applied for recycling of waste heat from a steam-turbine unit) according to thermal load in the heating system is offered, which indicates it will depend on the temperature of the external air. Another article [30] considers the possibility of including HPU as a part of the combined-cycle unit, but the level of allowable capacity of HPU is limited only by the technological operating mode of the combined-cycle unit, neglecting the market influence.
The aim of this study is to create a new comprehensive method for determining the maximum capacity of an HPU on TPP based on the sale prices of electricity in different market sectors, heat tariffs and fuel prices, capacity and equipment efficiency level and the limitations of the potential of a low-potential heat source.
To achieve the goal, it is necessary to solve the following tasks:
- (1)
- To determine the method for calculation the maximum capacity of an HPU on TPP;
- (2)
- To test the method on a real object;
- (3)
- To analyze the main factors’ influence on the choice of capacity of HPU within TPP under the work conditions of the wholesale electricity and capacity market.
The decentralized heat supply concept assumes the use of equipment with low capacity characteristics (such equipment is mainly used in the Russian market). Simultaneously, the use of low-power HPUs on thermal power plants’ technological scheme is meaningless due to its insignificant effect in terms of utilization of LPH and reduced water consumption by thermal power plants [31]. For example, in the technological scheme of a TPP based on combined cycle gas turbine CCGT-450 units with heat capacity of heat pump up to 10 MW with conversion coefficient of 3–5, LPH is utilized in the amount of 2–3 MW. The total amount of waste heat on CCGT-450 of about 100–400 MW, and the reduction of water consumption with heat pump up to 10 MW application will not exceed 573–687 t/h [26].
The use of high-capacity HP, in its turn, provides considerably more opportunities for TPP resource-saving. However, the high capital expenditures for large HPUs will require more detailed technical and economic analysis and consideration of all potential risks. In general, the capacity of HP is limited by the potential amount of LPH produced at the TPP and the connected heat load of the low-potential heat consumer (LPHC).
Thus, with the annual electricity production of 5973 million kWh and heat supply of 1414 thousand MWh, the annual losses of low-potential heat in the cooling system of the condensers of CCGT-450 based thermal power plants will amount to 3016 thousand MWh [26].
The thermal load of LPHC is based on the direction of its application. Heat energy from HPU can be used in the thermal production processes of TPP and provide heating and ventilation and hot water supply to facilities on the territory of TPP and for external consumers heating.
According to Russian generating companies’ statistics, the average heat consumption for own needs of the TPP does not exceed 10 MW. Therefore, the thermal utility needs of the TPP do not require the installation of powerful HPUs [32]. Large HPUs with a 30–50 MW capacity can be used only for the heat supply of external consumers.
However, we should consider that as the thermal load of the HPU increases, the HP compressor drive’s power consumption will increase proportionally, as well as the total power consumption for the HPU’s own needs. This, in turn, will lead to a decrease in useful supply to the wholesale electricity and capacity market (WECM) and increase the cost of products, thus reducing the competitiveness of TPPs.
2. Method
Relation of HPU thermal power (Qhp) and electric power consumption for the HPU compressor drive (Whp) could be presented the expression (1):
where is HP conversion efficiency.
The HP energy conversion coefficient (ECC) value is determined by the temperatures of the LPH source and consumer and the thermal physical properties of the HPU working body. Traditionally, heating HPU works with the coefficient of = 3–5. With ECC less than 3, the installation is considered inefficient.
With the increase in the capacity of HP will increase the capacity consumed by the drive unit. The maximum capacity of HP can be determined based on the permissible level of the total electricity consumption for own needs of the TPP when operating in the competitive electricity market.
Simplified conditions of break-even operation of TPP at WECM can be formulated as equality of income from electric power sale at the market and variable (fuel) component of costs (2):
where Ce/e is WECM electricity cost (EUR/MWh), WWECM is volume of electricity supply from TPP (MWh), Be/e is equivalent fuel consumption for power generation (ton of equivalent fuel/hour) and Pef is the equivalent fuel price (EUR/ton of equivalent fuel).
For HPU operating as part of the thermal scheme of TPP, the maximum power consumption per hour of HP () can be defined by the following Equation (3):
where is hourly power generation volume of TPP (MWh), is the hourly power consumption for the TPP’s own needs in a mode without HP (MWh), is the hourly power consumption for TPP needs (MWh) and is the minimum supply level at WECM, which ensures break-even electricity production (MWh).
Taking into account the Equations (1)–(3), the allowable hourly consumption of electricity on HPU, which determines its maximum power, will have the form (4):
where is maximum heat pump capacity, MW.
Regardless of the type of natural fuel, the price of equivalent fuel can be determined from the following ratio (5):
where: is the cost of the consumed natural fuel (EUR), is price of natural fuel, EUR/kcm3 (EUR/t), is the natural fuel consumption measured by metering devices (thousand m3 (t)) and is the equivalent fuel consumption (tons of equivalent fuel).
Natural and equivalent fuel expenses are connected with each other by the following ratio (6):
where: is actual heat of natural fuel combustion, kJ/m3 (kJ/kg).
Then the Equation (5) for determining the price of equivalent fuel takes the form:
The hourly electricity consumption for its own needs is often estimated as a percentage of the hourly output of a TPP (). Hourly consumption of equivalent fuel for electricity production in general may be expressed through specific consumption of equivalent fuel for electricity production from tires () the following way (8):
Thus, the maximum allowable capacity of HPU installed in the technological scheme of TPP, taking into account the allowable reduction of supply to the electricity market, will be as follows (9):
The hourly consumption of electric power for the utility needs of a TPP does not depend on the type and capacity of power unit, type of fuel, composition of main and auxiliary equipment as well as operation mode. It is mainly determined by the volume of power consumption of auxiliary and non-industrial subdivisions, necessary for maintenance of main production, but not directly related to it. To a greater extent, power consumption for utility needs is determined by climate conditions and season and can be set at a fixed value. Taking into account the fact that electricity consumption for utility needs is less than 1% of the production volume, the value can be neglected.
Accordingly, the equation for the maximum allowable power of the HPU is the following (10):
At the same time, the thermal capacity of HPU is limited by the volume of LPH generated at the TPP. (11):
where is maximum capacity of low-potential heat source on TPP, MW.
If the technical water of the steam turbine condenser cooling system is used as a low-potential heat source (LPHS) at a thermal power plant, then the maximum power of the LPHS corresponds to the load of the ST condenser and is determined by the following Equation (12):
where is the steam consumption to the condenser (kg/s), is the condensate enthalpy at the outlet of the condenser (kJ/kg) and is the steam enthalpy at the condenser inlet (kJ/kg).
Thus, the limitation of the maximum thermal power of HPP by the amount of HDPE produced can be formulated as follows:
When calculating by Equation (10), it may be necessary to recalculate the values of energy prices. So the final price for natural gas must consider the actual volumetric heat of combustion according to the Equation (14):
where: is the approved wholesale gas price (EUR/m3), is the actual volume heat of gas combustion (kJ/m3) and is the calculated volume heat of gas combustion (kJ/m3).
Certain energy facilities use several types of natural fuel. Therefore the average annual price of equivalent fuel for a particular TPP can be determined by the Equation (15):
where: is the cost of j-kind of natural fuel consumed by TPP for the year (EUR), is the price of the j-th kind of natural fuel consumed by TPP for a year (EUR/1000 m3, EUR/t), is the meter consumption of the j-th kind of natural fuel consumed by the TPP for the year (1000 m3 (t)) and is the annual equivalent fuel consumption of TPP (e.f.t.).
Energy companies may operate in different segments of the wholesale electricity market. The average annual electricity price for a particular TPP can be determined by the following Equation (16):
where: is the annual income from electric power supply to the Wholesale Electricity Market (WEM) (EUR), is the annual electricity supply at the WEM (MWh), is actual electricity price by regulated contracts (RC) (EUR/MWh), is the annual electricity supply within RC (MWh), is the actual electricity price by free bilateral contracts (FBC) (EUR/MWh), is the annual electricity supply under FBC (MWh), is the actual electricity price per day-ahead market (DAM) (EUR/MWh), is the annual power supply to DAM (MWh), is the actual electricity price at the balancing market (BM) (EUR/MWh) and is the annual supply of electricity to the BM (MWh).
3. Results
3.1. Proof of the Method
As a practical example of the proposed method, we present the results of HPU maximum capacity calculation for a TPP based on a CCGT-450 (double-unit) operating in the Russian electricity market.
Figure 1 shows the scheme of HPU installed at TPP based on CCGT-450T. Cooling water after the steam turbine condenser is redistributed between the HPU evaporator and the cooling system (pond, cooling tower, cooling pond) and then is drained into a single stream that flows back to the steam turbine condenser. The condenser of HP is supplied with heating-system water from the consumer, heated, and directed to hot water boilers or network water heaters fed by extraction steam from the ST.
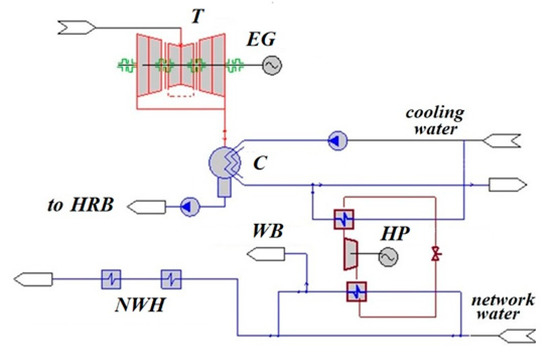
Figure 1.
Simplified scheme of CCGT-450 with a heat pump: T—steam turbine, C—condenser, EG—electric generator, HRB—heat recovery boiler, WB—water boiler, NWH—network water heater, HP—heat pump.
Table 1 shows an example of summary results of maximum capacity calculation of a heat pump installed at CCGT-450-based TPP during operation as a part of a unit in heating mode at maximum electric and thermal load.

Table 1.
Summary results of calculation of maximum heat pump capacity. Source: prepared by the authors based on the results of personal calculations.
The following assumptions are made to calculate the maximum capacity of a heat pump installed at a CCGT-450-based TPP from the point of view of operation at the Wholesale Electric Power and Capacity Market (WEPCM):
- −
- The electric capacity of the CCGT-450 based TPP varies within the control range in semi-block operation mode from 140 to 225 MW, in block operation mode from 290 to 450 MW.
- −
- The thermal capacity varies from 133 to 339 MW during heating operation mode.
- −
- The electricity consumption for the TPP’s own needs in the mode without HPU varies from 1.6 to 3.0%.
- −
- The coefficient of performance (COP) of HPU—3 (corresponds to this scheme) [31].
- −
- The specific standard fuel consumption for electric generation in the condensation mode varies from 248 to 280 e.f.gr./kWh, and in the heating mode from 170 to 210 e.f.gr./kWh.
- −
- The weighted average electricity price on the Wholesale Electric Power and Capacity Market (WEPCM) varies from 4 to 18 EUR/MWh.
- −
- The average price of coal equivalent varies from 20 to 65 EUR/t.e.f.
- −
- The Euro exchange rate is determined according to the data of the MOEX for 28.10.2020 and equals to 92.86 RUB/EUR.
The following assumptions are made to determine the maximum amount of LPH removed from the steam turbine condenser cooling system:
- −
- The gas turbine unit (GTU) capacity varies within the adjustment range limits from 100 to 150 MW.
- −
- The temperature of GTU exhaust gases varies within the range from 514 to 539 °C.
- −
- The GTU exhaust gas flow rate varies from 444 to 532 kg/s.
- −
- The steam rate of the high- and low-pressure loops for the steam turbine varies from 59.75 to 75.25 kg/s.
- −
- The condenser pressure is 7 kPa.
3.2. Factors’ Influence on Maximum Heat Pump Capacity
The maximum allowable HPU capacity in a TPP depends on the electric capacity of the generating equipment, the volume of capacity consumed at the TPP, specific consumption of equivalent fuel for electric energy production, the ratio of prices for fuel and electric energy, as well as the HP conversion factor. It is necessary to determine the influence of these factors on the choice of HPU capacity at TPPs. The operating conditions of Russian thermal power plants were chosen as an example for the analysis.
TPP power generation and supply depend on the type and capacity of the plant and external conditions (climatic and market conditions). For a condensing power plant, market conditions prevail, and for a cogeneration plant, a combination of climatic and market conditions is of primary importance.
Electricity production is characterized by territorial, daily and seasonal unevenness. The adjustment range of generating equipment is formed to ensure its operation according to specified technological mode to ensure the balance of demand and consumption in the energy system for each TPP.
The lower limit of the adjustment range of electrical power for condensing power plant (CPP) (technical minimum of generating equipment) is the minimum load value ensuring the power plant’s safe operation during a long period of time. The lower limit of the adjusting range of electric capacity for CHP (technological minimum of generating equipment is the minimum value of the electric load at which the production of thermal energy in a given volume is provided during a long period of time) [33].
The upper limit of the regulating range for electric power (available power) is defined as the maximum technically possible power of TPP, taking into account the limits and permissible excess over individual units’ installed power. The limitations mean the value of forced under-utilization of installed capacity due to the influence of factors that affect only the given power plant. Some design defects, wear and tear or unsatisfactory technical condition of the equipment, etc., can be referred to as technical factors forming restrictions. The factors not related to the technical condition of the installation can include:
- −
- Changes in the thermal loads of the consumer,
- −
- The increase in water temperature at the inlet to the condenser,
- −
- Environmental restrictions,
- −
- Scheduled repairs of network facilities,
- −
- Restrictions on power output or the need to work in the mode of synchronous compensator,
- −
- Termination of heat and steam supply from a certain month to the consumer, etc. [33].
Thus, during the day, the electrical capacity of TPP varies within the control range to maintain the required amount of electricity production in the power system. Figure 2 shows the hourly production of electricity CCGT-450 (double-block) in the annual section. Figure 3 shows an example of a daily change in the electrical load of the CCGT-450 within the adjustment range.
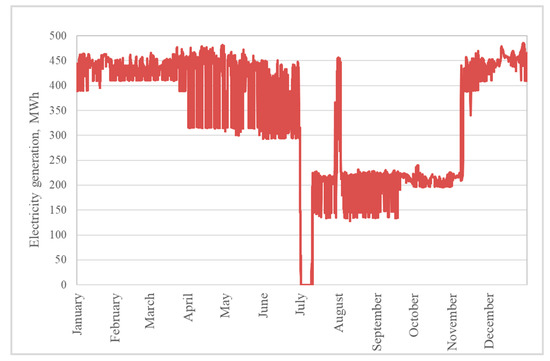
Figure 2.
Dynamics of hourly power output of CCGT-450 power unit in the annual section.
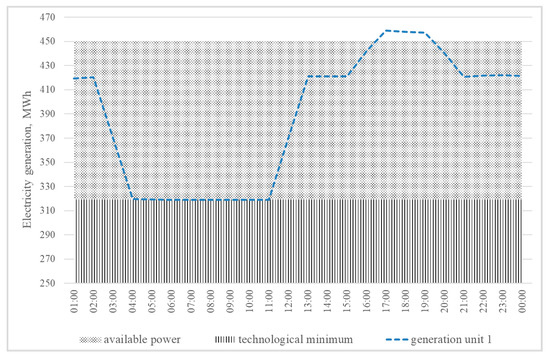
Figure 3.
Dynamics of hourly power generation volumes of the CCGT-450 power unit in the daily section.
Figure 2 shows that depending on the power system demand, the electric capacity of the generating equipment of the unit was decreasing by more than 34%, and half of the unit was put into cold reserve (GTU, while heat recovery boiler (HRB)) and the unit was completely shut down.
Unlike steam turbine unit (STU) STU-based TPPs, the outdoor temperature has a significant effect on CCGT-based TPPs. Thus, during the summer period, as the outdoor air temperature rises, the available GTU capacity decreases, the flow rate and parameters of gases leaving the GTU are reduced, as well as the steam parameters from the CHP and ST capacity. At the same time, the available power of TPP decreases. At a CHP in the autumn-winter period, the technological minimum of equipment increases due to the consumer’s need for heat supply. Both processes reduce the plant’s adjustment range and smoothen the change in TPP power in the annual section.
Also, the cost-effectiveness of CCGT, provided by a high level of efficiency in terms of power generation, makes it extremely productive in terms of market operation and allows it to work mostly on an electric schedule.
Double CCGT units are capable of operating in single GTU and ST modes. In this case, the plant’s available capacity is reduced by at least 50%, and the technical minimum on operation in condensing mode reaches 32% of the installed capacity.
The hourly consumption of electricity for own needs of TPP in the mode without HP, is determined by the type and capacity of the plant, type of fuel, the composition of the main and auxiliary equipment, and mode of operation. Its maximum value (in percentage of the installed capacity) can be [34]: for pulverized coal CHP from 8 to 14%, for oil-gas CHP from 5 to 7%, for pulverized coal CPP from 6 to 8%, for oil-gas CPP from 3 to 5%.
Figure 4 shows the correlation between the shares of electric power consumption for the CCGT-450 unit (if there is no booster compressor) as a percentage of electric power of the unit.
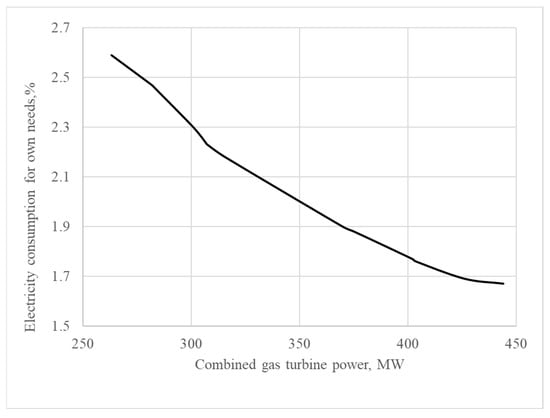
Figure 4.
Power consumption for own needs of the CCGT-450 unit %.
The equivalent fuel specific consumption (EFSC) for power generation depends on the type of power unit, type of fuel, composition of main and auxiliary equipment and operation mode, as well as on the method of fuel cost allocation between electric and thermal energy adopted in the energy company. The application of highly efficient technologies to update existing and design new power facilities and improve energy efficiency reduces EFSC.
For CPP EFSC is determined by the thermodynamic cycle of the plant. It is about 350 e.f.gr/kWh for GTU (efficiency about 35%), about 300 e.f.gr/kWh for STU (efficiency about 40%) and 248–250 e.f.gr/kWh for CCGT (efficiency about 50%) respectively.
When TPP operates in the heating mode, the EFSC is significantly dependent on the chosen method of fuel consumption separation between electric and thermal energy [35]. On average, for TPP based on STU, depending on the approved method, the difference can reach 60 e.f.gr/kWh [36]. Calculations have shown that for TPP based on CCGT-450, the difference in EFSC can reach 20 e.f.gr/kWh depending on the approved technique.
Table 2 [37] shows specific fuel consumption for electric and thermal power supply (calculated by proportional fuel separation method) by the main groups of thermal power equipment of TPP in Russia.
Table 2.
Specific fuel consumption for electric and thermal power supply by TPP. (Source: Thermal Power Engineering and District Heating of Russia in 2014–2018 (information and analytical report).
In compliance with the graph of the EFSC dependence on the electrical power of the CCGT-450 (when operating in condensation mode) shown in Figure 5, when changing the electrical power of the unit from maximum to technical minimum, EFSC increases on average by 35 e.f.gr/kWh.
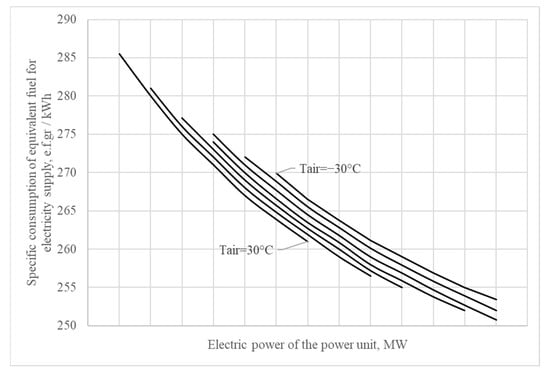
Figure 5.
Equivalent fuel consumption for power generation of CCGT-450 power unit (condensation mode).
Figure 6 shows the dependence of the EFSC of the power unit CCGT-450 in the heating mode of operation on the electrical power and heat supply from 100 to 300 MW. As it can be seen, EFSC decreases practically by 20% with the increase of heat supply from the power unit. First of all, it is connected with the corresponding decrease of discharge heat consumption in the steam turbine condenser at the regulating diaphragm’s closure.
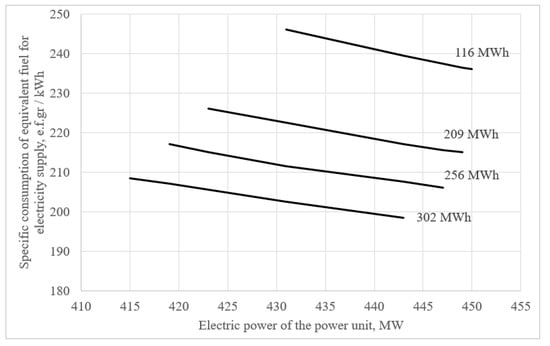
Figure 6.
Specific consumption of equivalent fuel for power generation of power unit CCGT-450 (heat production mode).
The price of conditional fuel consumed by TPP is determined by natural fuel price and its caloric value. Purchase and sale of natural fuel can be performed in two different price formation approaches: based on prices determined by the state or free prices.
Gas accounts for the major share in the total volume of organic fuel consumed by TPP of Unified Energy System (UES) of Russia (about 70%). At the same time, there is a significant territorial unevenness in the structure of fuel use (in the UES of Siberia and the East up to 85% of the fuel balance is coal, and the share of natural gas, in contrast to other regions, does not reach 40%). The dynamics of change and structure of fuel demand in the region are determined by the general level of power consumption and the share of power plants of different types in its coverage.
Over 250 gas production companies operate in the Russian gas market. Some of them are part of Gazprom Group (16 companies) or oil companies (97 companies) or operate independently (140 companies). Gazprom’s share in the domestic market supplies is over 50 percent. In accordance with the current Russian legislation, wholesale prices for gas produced by Gazprom and its affiliates are subject to state regulation. These prices are differentiated by consumer categories (population and industrial consumers) and price zones, taking into account consumers’ distance from gas production locations [38].
Wholesale prices for natural gas produced by Gazprom and its affiliates and sold to Russian industrial consumers in 2019, approved by Federal Antimonopoly Service (FAS) Order N 581/13–19 May 2019 (Figure 7), ranged from 27 to 52 EUR per 1000 cubic meters. The highest price value refers to the North Caucasus Economic District, as well as Central (Bryansk Region) and Central Chernozemny (Belgorod Region). The lowest gas price is typical for the West-Siberian Economic Region (Yamalo-Nenets Autonomous District). Wholesale gas prices may vary significantly within a single economic region (Zapadno-Sibirsky up to 45%, Severny up to 19%, and Volzhsky up to 15%). The average wholesale price for natural gas varies by economic region from 43 to 52 EUR per 1000 cubic meters.
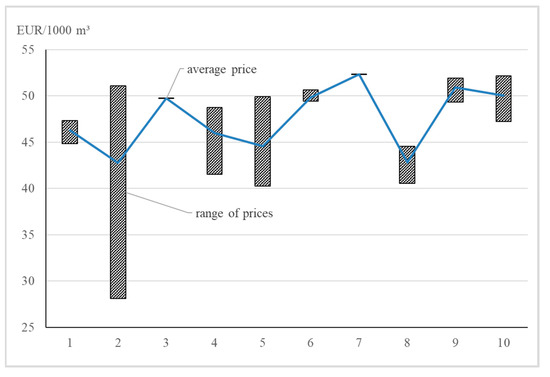
Figure 7.
Forecast values of regulated natural gas prices by economic regions in 2019, EUR/1000 m3: 1—Volgo-Vyatsky Region, 2—West Siberian Region, 3—Kaliningrad Oblast, 4—Volga Region, 5—Northern Region, 6—North-Western Region, 7—North Caucasian Region, 8—Urals Region, 9—Central Chernozem Region, 10—Central Region. Source: prepared by the authors according to FAS Order N 581/19 dated 13 May 2019.
Wholesale gas prices approved by FAS Order N 581/13–19 May 2019 are set at the outlet of the gas pipeline system for the volumetric unit of gas (1000 cubic meters) with the calculated combustion volume heat 33,080 kJ/m3. In case of deviation of actual volume heat of combustion of supplied natural gas from the calculated one, correction is made according to the Equation (14).
The final price for natural gas depends on the cost of gas transportation to consumers. The further the consumer, the higher is the network tariff and the final price.
The Russian coal industry is concentrated in four main basins: Kuznetsky (Kuzbass produces over 80% of the country’s coal), Kansko-Achinsky, Donetsk, and Pechorsky. This industry is one of the most competitive. The largest companies in the segment are private [39]. Coal prices vary significantly depending on the caloric value, availability of impurities, and supply base for each individual producer [40]. Other things being equal, the higher the carbon content and the less impurities in coal, the more expensive it is. Figure 8 shows the dynamics of domestic prices for the main types of coal in the Russian energy sector in 2014–2018 [37]. In 2018, the highest price for coal in the Central Federal District was 43 EUR/t.e.f. The lowest price corresponded to the Siberian Federal District and was 20 EUR/t.e.f. This price range was determined by the distance from production places (Kuzbass, Donbas, Vorkuta) to consumers.
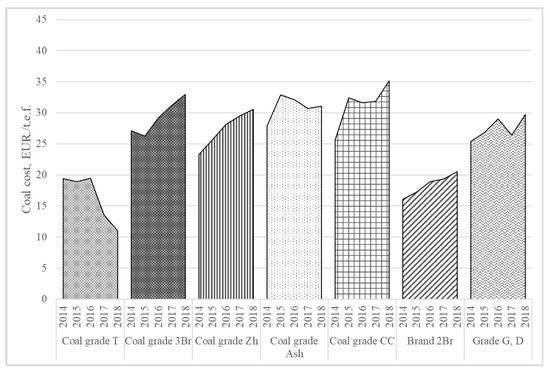
Figure 8.
Range of prices for thermal coal in Russian Federation. Source: prepared by the authors according to Thermal Power Engineering and District Heating of Russia in 2014–2018 (information and analytical report).
The electricity price depends on the features of industry market formation in the country. Thus, in the Russian Federation (RF) the cost of electricity varies depending on the wholesale or retail market segment, category (supplier/consumer) and RF region. Russia’s territory is conditionally divided into several zones, where wholesale and retail electricity is sold in accordance with different approaches to price formation. Figure 9 and Figure 10 show the Unified Energy System of Russia’s geography and the geography of the Russian electricity market, respectively.
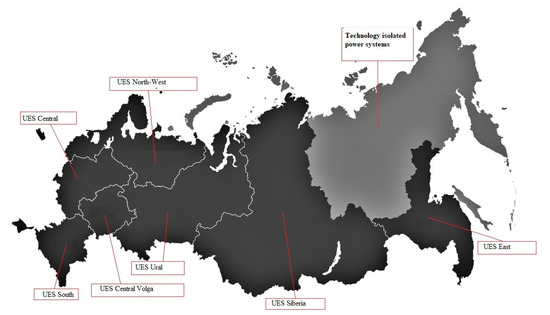
Figure 9.
Geography of the Unified Energy System of Russia. Source: prepared by the authors according to System operator of unified energy system of Russia.
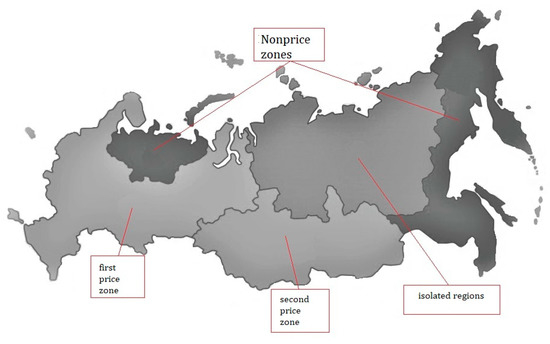
Figure 10.
Geography of the Russian wholesale electricity market. Source: prepared by the authors according to ATS JSC (Administrator of the Trade System of the Wholesale Electricity Market).
In non-price zones and isolated power systems, due to technical reasons, it is not possible to organize competitive pricing, so electricity sales are carried out at regulated prices (tariffs). Within the price zones, the wholesale sale of electric energy is organized in the following ways: at regulated prices (regulated contracts) and at competitive prices (day-ahead market, balancing market, and free bilateral contracts). The bulk (about 71.5%) of the electricity produced is sold at the DAM at prices formed under the influence of balancing supply and demand [41].
Final prices for electric power in some regions of Russia differ significantly due to the different efficiency of power plants serving different regions of the country and insufficient capacity of power transmission lines. TPP operating on natural gas and nuclear power plants prevail in the first price zone. Hydropower plants and coal TPP prevail in the second zone. The difference between the generation types results in a significant difference in production cost and prices on DAM. Thus, the DAM price for the period (2011–2016) was 11.87 EUR/MWh in the first price zone and 8.18 EUR/MWh in the second price zone. The weighted average wholesale electricity prices on RC for 2014–2016 were 6.89 EUR/MWh in the first price zone and 2.83 EUR/MWh in the second price zone. The average price on BM for the period (2011–2016) was 11.25 EUR/MWh in the first price zone and 7.36 EUR/MWh in the second price zone.
According to the Administrator of the Trade System of the Wholesale Electricity Market (ATS JSC), the average hourly volume of electricity production at UES Russia in 2019. (Figure 11), varied within the range of 8.7 to 34.1 thousand MWh [42]. The average electricity price on the market, in annual terms, varied from 4.54 to 16.39 EUR/MWh. The highest price value was formed in the UES of the South during the winter period. The minimum electricity price was typical for the autumn period in the UES of Siberia. Electricity price changed significantly in the annual section within one power system. When the average hourly volume of electricity production within one energy system changed by 18–29%, the price changed within the limits of 14–58%. The largest price dispersion was in the UES of Siberia. The smallest price dispersion was typical for the UES.
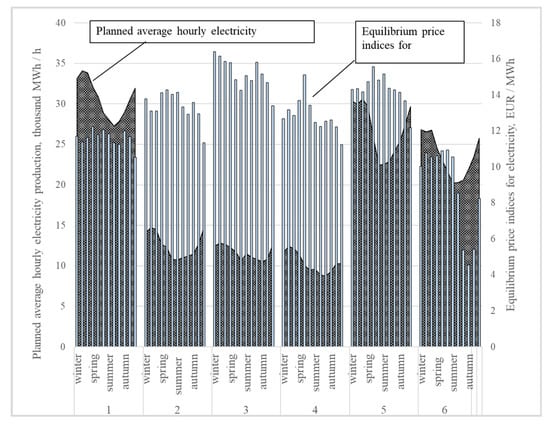
Figure 11.
Production volumes and DAM price indexes for UES: 1—UES of Ural, 2—UES of Middle Volga, 3—UES of South, 4—UES of North-West, 5—UES of Center, 6—UES of Siberia. Source: prepared by the authors according to ATS JSC.
Pricing at retail electricity markets in price zones depends on the tariff group of the consumer and the region (population and similar groups of consumers purchase electricity at regulated prices, and other consumers at non-regulated prices).
Forecast values of average weighted non-regulated prices at the Russian Federation’s retail electricity markets, depending on the zone of activity of energy sales companies, in 2019. (Figure 12), ranged from 3.23 to 18.32 EUR/MWh [42]. The highest prices were registered in the North Caucasus economic region and the Povolzhye economic region (Republic of Kalmykia). The lowest electricity price was typical of the East Siberian economic region (the Republic of Tyva). Non-regulated electricity prices varied considerably within one economic region (up to 50–70%). The East Siberian, North Caucasus, and Northern economic regions were the regions with the highest price spread. At the same time, non-regulated electricity prices could change by more than 8% within one RF subject (in particular, in Stavropol Krai, from 16.62 to 18.07 EUR/MWh, in Moscow Oblast, from 12.98 to 14.13 EUR/MWh, and in the Republic of Karelia, the price changed by almost 30%—from 5.92 to 8.42 EUR/MWh). The average non-regulated price for Russia’s main energy sales companies ranged from 10.07 to 13.21 EUR/MWh, except for East Siberian economic region. In the Far Eastern and Kaliningrad economic region, due to the impossibility of organizing competitive pricing, electricity is sold at tariffs.
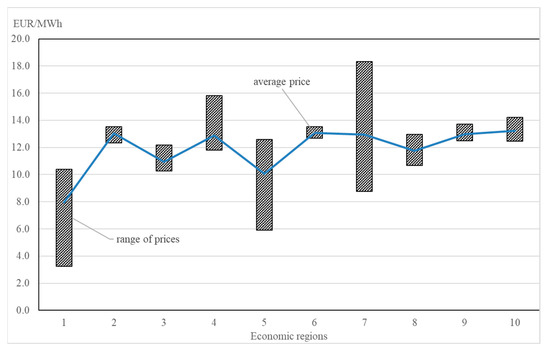
Figure 12.
Forecast values of weighted average non-regulated electricity prices by economic regions in 2019, EUR/MWh: 1—East Siberian region, 2—Volga-Vyatka region, 3—West Siberian region, 4—Povolzhye region, 5—Northern region, 6—Northwestern region, 7—North Caucasus region, 8—Urals region, 9—C Central-Chernozemic region, 10—Central region. Source: prepared by the authors according to ATS JSC.
Thus, the maximum HPU capacity is determined to the properties and modes of operation of the main energy equipment, territorial, climatic, meteorological, and market conditions, and varied significantly even for energy facilities of one region. Therefore, it should be calculated individually for each TPP.
The calculation of HP capacity should be carried out in the whole range of regulation of generating equipment taking into account the most typical daily and annual schedule of work.
The TPPs’ consumption of electric power and fuel are characteristics of the regime. They are closely connected with thermal and electric TPP capacity. In its turn, the cost of fuel and electricity can be attributed to external characteristics determined primarily by current market conditions.
Figure 13 shows the range of change in the heat pump capacity, which provides break-even operation of the TPP based on CCGT-450 in the electricity market, when operating in condensing mode and changing the electrical load from rated to a minimum.
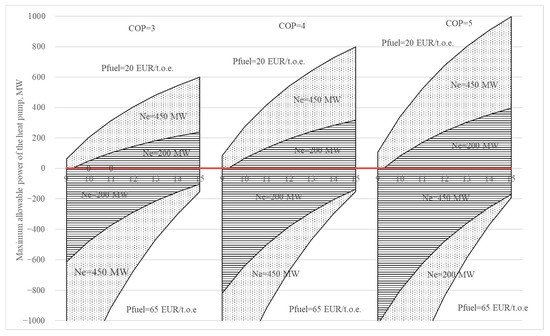
Figure 13.
Maximum capacity of heat pump installed at TPP based on CCGT-450.
As can be seen, when the energy conversion factor decreases from 5 to 3 for the full load mode, the maximum allowable HPU capacity decreases by 40%. The analysis has revealed that the energy price ratio significantly influences the HPU capacity choice. Thus, when the electricity price decreases below 4 EUR/MWh or the fuel equivalent price rises above 70 EUR/t.e.f., the maximum capacity of a heat pump based on break-even sale of electricity on the market is less than 0.
Figure 14 shows in more detail the dependence of maximum HPU capacity on energy prices for the CCGT-450 when changing the electrical load from maximum to technical minimum in unit and semi-block mode (condensing mode). HPU COP is adopted at level 3.
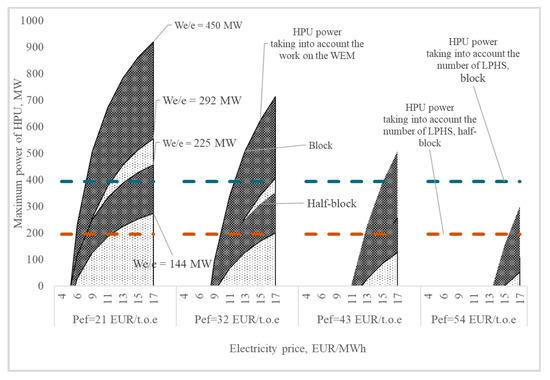
Figure 14.
Maximum capacity of heat pump installed at TPP based on CCGT-450 (condensation mode).
Figure 14 shows that each value of the fuel price corresponds to a certain (quite narrow) range of electricity prices. If we reach it, using HPU on TPP becomes inefficient, from the point of view of the energy company’s functioning in the electricity market. HP installation should be additionally justified by technical and economic calculations, taking into account thermal energy sale. The maximum amount of LPH generated at TPP, marked with red and blue dotted line in Figure 14, which in turn depends on the capacity and operating mode of the generating equipment, is an additional power limitation of HPU.
Figure 15, Figure 16, Figure 17 and Figure 18 show the relation of the maximum HPU capacity to the energy prices when the CCGT-450 operates in the heating mode. HPU COP is accepted at level 3.
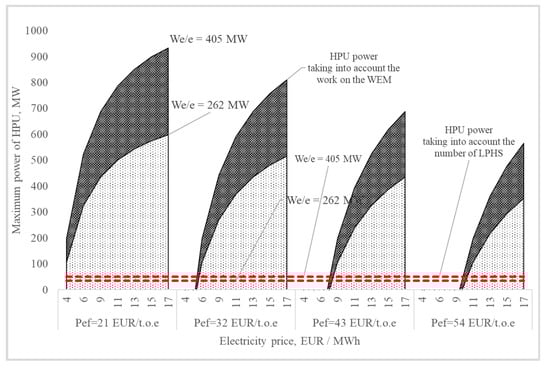
Figure 15.
Maximum capacity of a heat pump installed at TPP based on CCGT-450 (heating mode, Toa = +15 °C, maximum heat transfer to the extraction system).
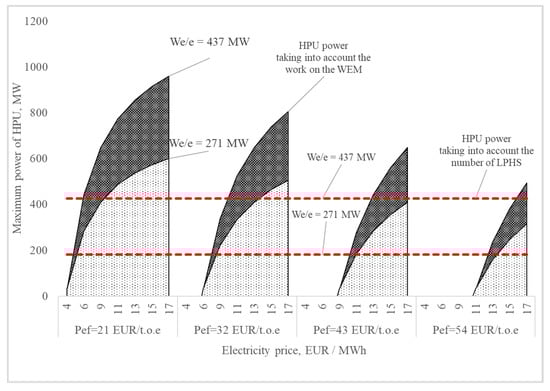
Figure 16.
Maximum capacity of a heat pump installed at TPP based on CCGT-450 (heating mode, Toa = +15 °C, minimum heat transfer to the extraction system).
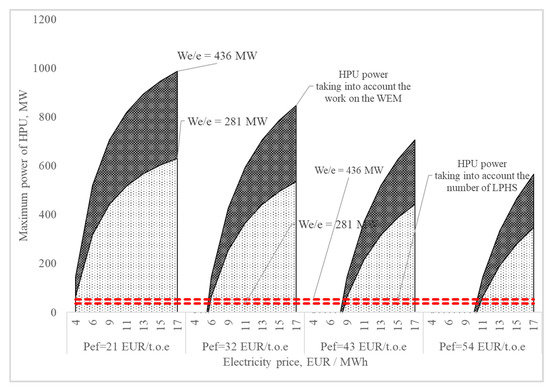
Figure 17.
Maximum capacity of a heat pump installed at TPP based on CCGT-450 (heating mode, Toa = −2 °C, maximum heat transfer to the extraction system).
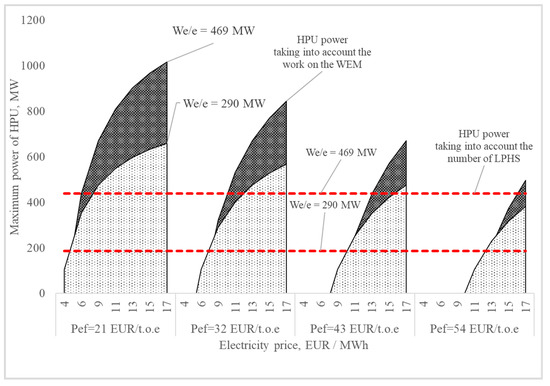
Figure 18.
Maximum capacity of a heat pump installed at TPP based on CCGT-450 (heating mode, Toa = −2 °C, minimum heat transfer to the extraction system).
With an increase in heat output, the permissible level of electricity prices decreases (at which point the use of HPUs at thermal power plants becomes rational). It occurs due to a significant reduction in the specific consumption of equivalent fuel for electricity production compared to the condensing mode of operation. At the same time, the amount of discharged LPH formed in the condenser’s cooling system (Figure 14 and Figure 16), which in turn limits the maximum capacity of HPU. In mode with a fully closed diaphragm, this limit reaches 25 MW. Thus, it is impossible to achieve high HPU capacity in winter modes with maximum heat release by using only the steam turbine condensing unit as cooling water.
4. Discussion
Currently, there is no unified approach to the selection and justification of the HPU capacity to be used at a TPP. Thermal efficiency parameters such as a fuel heat utilization factor, cycle thermal efficiency, specific standard fuel consumption for electricity and heat generation can be used for selection and justification of the TPP type and scheme solution. However, they are not applicable for HPU capacity selection. We can justify TPP capacity by calculating investment project efficiency indicators comparing project implementation cash inflows and outflows. However, most often the choice of capacity of the equipment depends on political or subjective reasons, such as expected prices for energy carriers, equipment, construction and installation works, as well as traditions and prior experience of similar plants operation.
The approach we described in the article allows selecting and justifying the capacity of HPUs using basic elements of marginal analysis (ratio of production (sales) volumes, cost and profit, and justification based on its management decisions). This method allows us to preselect high potential facilities for heat pumping technologies application and determine the boundary market and technological conditions that help to justify the investment project of installing HPU at the technological scheme of the TPP. This method can be used to analyze existing objects and to design new ones.
Since the regularities we used are of fundamental physical and economic nature, they can be applied not only in Russia but also in other countries. The results obtained for CCGT-450 are determined by the actual ratio of energy resource prices and are not related to their formation mechanisms. TPP level of capacity and energy efficiency are also considered, while the type of main power equipment and TPP design are not significant factors.
The proposed method’s application to specific projects requires a number of clarifications, primarily related to restrictions on the power plants operating modes. Seasonal and operational fluctuations of LPHS loads at the TPP and the impact of LPHS on the main and auxiliary equipment efficiency at the TPP should be taken into account as the main limitations. For example, in the case of thermal turbine condenser cooling water used as a LPHS, the HPU number depends on the heating draw-offs load. Therefore, the use of high capacity HPU for winter conditions is not always possible. Since this approach’s application involves factors specific to the operation of certain facilities, the authors plan to carry out several studies related to the regime restrictions analysis for standard TPP equipment.
5. Conclusions
- (1)
- A new comprehensive method for determining the maximum capacity of an HPU in the technological scheme of thermal power plants was obtained. The method is based on limiting the capacity of a heat pump under the condition of break-even operation on the electricity market (compensation of fuel expenses related to electricity production, income from supplies to the electricity market).
- (2)
- The maximal capacity of HPU limited by the condition of break-even operation of TPP on the electricity market depends on the capacity of generating equipment, the volume of power used for own needs of TPP, specific consumption of conditional fuel for electricity production, the ratio of prices for fuel and electricity, as well as the HPU COP.
- (3)
- The method was tested for the operating conditions of a real Russian TPP with CCGT-450. The use of the method makes it possible to determine the limitations of the maximum power of the HPU for various operating conditions of the CCGT-450. For TPP based on CCGT-450 with prices in the Russian energy markets at the level of 2019:
- −
- where operating at maximum heat load, the allowable capacity of the HP will be about 50 MW;
- −
- where operating with a minimum heat load, the allowable capacity of the HP will be about 200 MW
- (4)
- An analysis of the main factors that influence the choice of capacity of HPU within TPP in the conditions of work in the Russian’s wholesale electricity and capacity market was carried out. In case of a decrease in electricity price below 4 Euro/MWh or increase in the price of equivalent fuel above 70 Euro/t.e.f. maximum capacity of a heat pump, considering break-even sale of electricity at the electricity market, is less than 0. Therefore rational use of a heat pump should be additionally supported by technical-economic calculations considering the sale of heat energy.
Author Contributions
Conceptualization, M.T.; Methodology, M.T. and D.T.; Validation, M.T., I.A., S.S. and D.T.; Formal Analysis, M.T., I.A., V.S., S.S. and D.T.; Investigation, M.T. and I.A.; Resources, M.T., I.A., V.S., S.S. and D.T.; Data curation, M.T. and I.A.; Writing—original draft preparation, M.T., I.A. and D.T.; Writing—review and editing, M.T., I.A. and D.T.; Supervision, M.T., I.A. and V.S.; Project administration, M.T. and I.A.; Funding acquisition, I.A. and V.S. All authors have read and agreed to the published version of the manuscript
Funding
The paper was prepared at Higher School of Nuclear and Heat Power Engineering at Peter the Great St. Petersburg Polytechnic University and were financed by this university.
Institutional Review Board Statement
Not applicable.
Informed Consent Statement
Not applicable.
Data Availability Statement
Data sharing not applicable.
Conflicts of Interest
The authors declare no conflict of interest.
Abbreviations
| BM | Balancing market |
| CCGT | Combined cycle gas turbine |
| CHP | Combined heat and power station |
| COP | Coefficient of performance |
| CPP | Condensing power plant |
| DAM | Day-ahead market |
| ECC | Energy conversion coefficient heat pumps |
| EFSC | Equivalent fuel specific consumption |
| FBC | Free bilateral contracts |
| GTU | Gas turbine unit |
| HP | Heat pump |
| HPU | Heat pump unit |
| HRB | Heat recovery boiler |
| LPH | Low-potential heat |
| LPHC | Low-potential heat consumer |
| LPHS | Low-potential heat source heat pump unit |
| RC | Regulated contracts |
| RF | Russian Federation |
| ST | Steam turbine |
| TPP | Thermal power plant |
| UES | Unified Energy System |
| WECM | Wholesale Electricity and Capacity Market |
| WEM | Wholesale Electricity Market |
| WEPCM | Wholesale Electric Power and Capacity Market |
| Annual equivalent fuel consumption | |
| Be/e | Equivalent fuel consumption for power generation |
| Specific consumption of equivalent fuel for electricity production | |
| Equivalent fuel consumption | |
| Cost of j-kind of natural fuel consumed by thermal power plant for the year | |
| Cost of consumed natural fuel | |
| Ce/e | Wholesale Electricity and Capacity Market electricity cost. |
| meter consumption of j-kind of natural fuel consumed by thermal power plant for the year | |
| Natural fuel consumption by metering devices | |
| Steam consumption to the condenser | |
| Condensate enthalpy at the outlet of the condenser | |
| Steam enthalpy at condenser inlet | |
| Annual income from electric power supply to Wholesale Electricity Market | |
| Actual electricity price at balancing market | |
| Actual electricity price per day-ahead market | |
| Price of j-kind of natural fuel consumed by thermal power plant for a year | |
| Price of natural fuel | |
| Actual electricity price by regulated contracts | |
| Actual electricity price by free bilateral contracts | |
| Pef | Equivalent fuel price |
| Actual heat of natural fuel combustion | |
| Qhp | Relation heat pump unit thermal power |
| Maximum heat pump capacity | |
| Maximum capacity of low-potential heat source on thermal power plant | |
| Annual supply of electricity to balancing market | |
| Annual power supply to day-ahead market | |
| Annual electricity supply under free bilateral contracts | |
| Percentage of the hourly output of a thermal power plant | |
| Annual electricity supply within regulated contracts | |
| Annual electricity supply at Wholesale Electricity Market | |
| Hourly power generation volume of thermal power plant | |
| Whp | Heat pump unit compressor drive |
| Maximum power consumption per hour of heat pump | |
| Minimum supply level at the Wholesale Electricity and Capacity Market, which ensures break-even electricity production | |
| Hourly power consumption for own needs of thermal power plant in mode without heat pump | |
| Hourly power consumption for thermal power plant needs | |
| WWECM | Volume of electricity supply from thermal power plant |
| Heat pump conversion efficiency |
References
- Ministry of Energy of the Russian Federation. Energy Strategy of the Russian Federation for the Period Till 2035. Available online: https://minenergo.gov.ru/node/1026 (accessed on 22 July 2020).
- Magnani, S.; Danti, P.; Pezzola, L. Analysis of the coupling between CHP and EHP in an office building applied to the Italian energy market. Energy Procedia 2016, 101, 558–565. [Google Scholar] [CrossRef]
- Liang, Y.; Al-Tameemi, M.; Yu, Z. Investigation of a gas-fuelled water heater based on combined power and heat pump cycles. Appl. Energy 2018, 212, 1476–1488. [Google Scholar] [CrossRef]
- Wang, J.; Zhong, H.; Tan, C.; Chen, X.; Rajagopal, R.; Xia, Q.; Kang, C. Economic benefits of integrating solar-powered heat pumps into a CHP system. IEEE Trans. Sustain. Energy 2018, 9, 1702–1712. [Google Scholar] [CrossRef]
- Alla, S.A.; Bianco, V.; Marchitto, A.; Scarpa, F.; Tagliafico, L.A. Impact of the Utilization of Heat Pumps for Buildings Heating in the Italian Power Market. In Proceedings of the 15th International Conference on the European Energy Market, Lodz, Poland, 27–29 June 2018. [Google Scholar] [CrossRef]
- Sewastianik, S.; Gajewski, A. Energetic and Ecologic Heat Pumps Evaluation in Poland. Energies 2020, 13, 4980. [Google Scholar] [CrossRef]
- Østergaardan, P.A.; Andersenab, A.N. Booster heat pumps and central heat pumps in district heating. Appl. Energy 2016, 184, 1374–1388. [Google Scholar] [CrossRef]
- Romanchenko, D.; Odenberger, M.; Göransson, L.; Johnsson, F. Impact of electricity price fluctuations on the operation of district heating systems: A case study of district heating in Göteborg, Sweden. Appl. Energy 2017, 204, 16–30. [Google Scholar] [CrossRef]
- Trømborg, E.; Havskjold, M.; Bolkesjø, T.F.; Kirkerud, J.G.; Tveten, Å.G. Flexible use of Electricity in Heat-only District Heating Plants. Int. J. Sustain. Energy Plan. Manag. 2017, 12, 29–46. [Google Scholar] [CrossRef]
- Sun, F.; Xie, Y.; Svendsen, S.; Fu, L. New low-temperature central heating system integrated with industrial exhausted heat using distributed electric compression heat pumps for higher energy efficiency. Energies 2020, 13, 6582. [Google Scholar] [CrossRef]
- Sánchez-Canales, V.; Payá, J.; Corberán, J.M.; Hassan, A.H. Dynamic modelling and techno-economic assessment of a compressed heat energy storage system: Application in a 26-MW wind farm in Spain. Energies 2020, 13, 4739. [Google Scholar] [CrossRef]
- Chen, Y.; Zhang, Y.; Wang, J.; Lu, Z. Operation for integrated electricity-heat system with improved heat pump and storage model to enhance local energy utilization. Energies 2020, 13, 6729. [Google Scholar] [CrossRef]
- Scharrer, D.; Eppinger, B.; Schmitt, P.; Zenk, J.; Bazan, P.; Karl, J.; Will, S.; Pruckner, M.; German, R. Life cycle assessment of a reversible heat pump-organic Rankine cycle-heat storage system with geothermal heat supply. Energies 2020, 13, 3253. [Google Scholar] [CrossRef]
- Goričanec, D.; Ivanovski, I.; Krope, J.; Urbancl, D. The Exploitation of Low-Temperature Hot Water Boiler Sources with High-Temperature Heat Pump Integration. Energies 2020, 13, 6311. [Google Scholar] [CrossRef]
- Zhang, L.; Zhang, Y.; Zhou, L.; E, Z.; Wang, K.; Wang, Z.; Li, G.; Li, B. Research of waste heat energy efficiency for absorption heat pump recycling thermal power plant circulating water. IOP Conf. Ser. Earth Environ. Sci. 2018, 121, 4. [Google Scholar] [CrossRef]
- Borovkov, V.M.; Al Alavin, A. Heat pump with two-stage condenser. Promyshlennaya Energ. 2007, 8, 40–43. [Google Scholar]
- Kalnin, I.M.; Protsenko, V.P.; Pustovalov, S.B. Centralized heating system based on heat pumps. Kholodilnaya Tekhnika 2011, 1, 20–22. [Google Scholar]
- Alkhasov, A.B.; Alkhasova, D.A. Comprehensive Utilization of Low-Potential Geothermal Waters of Southern Russia for Heat and Water Supply and Solution of Environmental Problems. Therm. Eng. 2019, 66, 361–366. [Google Scholar] [CrossRef]
- Andryushchenko, A.I. Comparative efficiency of heat pumps application for district heating. Promyshlennaya Energ. 1997, 6, 2–4. [Google Scholar]
- Morozov, Y.P.; Chalaev, D.M.; Velichko, V.V. Decentralized heating with geothermal heat pumps. Altern. Energy Ecol. (Isjaee) 2017, 4–6, 70–79. [Google Scholar] [CrossRef]
- Shpilrayn, E.E. The possibility of using of heat pump on TPP. Therm. Eng. 2003, 7, 54–56. [Google Scholar]
- Protsenko, V.P.; Pustovalov, S.B. Atomic heat pump heating as a new direction of energy development. Energosberezhenie I Vodopod. 2010, 1, 25–29. [Google Scholar]
- Butuzov, V.; Amerkhanov, R.; Grigorash, O. Geothermal Power Supply Systems around the World and in Russia: State of the Art and Future Prospects. Therm. Eng. 2018, 65, 282–286. [Google Scholar] [CrossRef]
- Makarov, A.; Veselov, F.; Makarova, A.; Novikova, T.; Pankrushina, T. Strategic prospects of the electric power industry of Russia. Therm. Eng. 2017, 11, 817–828. [Google Scholar] [CrossRef]
- Borovkov, V.; Al Alavin, A. Exergic analysis of TPP operation with a heat pump. Energy Probl. 2006, 7–8, 12–21. [Google Scholar]
- Treshcheva, M.; Treshchev, D.; Anikina, I.; Skulkin, S. The potential for reducing TPP water consumption through the use of heat pumps. E3s Web Conf. 2019, 11001. [Google Scholar] [CrossRef]
- Averfalk, H.; Ingvarsson, P.; Persson, U.; Gong, M.; Werner, S. Large heat pumps in Swedish district heating systems. Renew. Sustain. Energy Rev. 2017, 79, 1275–1284. [Google Scholar] [CrossRef]
- Levihn, F. CHP and heat pumps to balance renewable power production: Lessons from the district heating network in Stockholm. Energy 2017, 137, 670–678. [Google Scholar] [CrossRef]
- Wang, J.; Liu, W.; Liu, G.; Sun, W.; Li, G.; Qiu, B. Theoretical Design and Analysis of the Waste Heat Recovery System of Turbine Exhaust Steam Using an Absorption Heat Pump for Heating Supply. Energies 2020, 13, 6256. [Google Scholar] [CrossRef]
- Vannoni, A.; Giugno, A.; Sorce, A. Integration of a flue gas condensing heat pump within a combined cycle: Thermodynamic, environmental and market assessment. Appl. Therm. Eng. 2020, 116276. [Google Scholar] [CrossRef]
- Anikina, I.; Sergeyev, V.; Amosov, N.; Luchko, M. Use of heat pumps in turbogenerator hydrogen cooling systems at thermal power plant. Inter. Int. J. Hydrog. Energy 2017, 42, 636–642. [Google Scholar] [CrossRef]
- Ministry of Energy of the Russian Federation. Heat Power and Centralized Heat Supply in Russia in 2014. Available online: https://minenergo.gov.ru/sites/default/files/texts/1161/attachment.ashx-86.pdf (accessed on 27 November 2020).
- System Operator of Unified Energy System of the Russian Federation. Annex 4 to Technical Requirements for Generating Equipment of WEM Participants. Methodical Instructions for Determination and Coordination of Limits of Installed Electric Capacity of Thermal and Nuclear Power Plants. Available online: https://www.so-ups.ru/fileadmin/files/company/reports/disclosure/2020/ups_rep2019.pdf (accessed on 27 November 2020).
- Karapetyan, I.; Faibisovich, D.; Shapiro, I. Manual for the Electrical Network Design; NTs ENAS: Moscow, Russia, 2012. (In Russian) [Google Scholar]
- Lisin, E.; Stepanova, T.; Zhovtiak, P. Investigation of the effect of cost allocation methods on the competitiveness of CHP plants in energy markets. St. Petersburg State Polytech. Univ. J. Econ. 2016, 6, 148–158. [Google Scholar] [CrossRef][Green Version]
- Semenov, B.; Larin, E. Fuel Efficiency of Energy Sources in Heat Supply Systems. Therm. Eng. 2018, 65, 668–676. [Google Scholar] [CrossRef]
- Ministry of Energy of the Russian Federation. Thermal Power Engineering and District Heating of Russia in 2014–2018 (Information and Analytical Report). Available online: https://minenergo.gov.ru/node/17737 (accessed on 27 November 2020).
- Energy Center of Moscow School of Management SKOLKOVO. Main Elements and Possible Scenarios for Deregulation of Gas. Prices in Russia and Gas. Market. Reform. Available online: https://energy.skolkovo.ru/downloads/documents/SEneC/Research/SKOLKOVO_EneC_RU_research_01022019.pdf (accessed on 27 November 2020).
- Tarazanov, I. Russia’s coal industry performance for January-December, 2018. Ugol Russ. Coal J. 2019, 3, 64–79. [Google Scholar] [CrossRef]
- Tarazanov, I.; Gubanov, D. Russia’s coal industry performance for January-December, 2020. Ugol Russ. Coal J. 2020, 3, 54–69. [Google Scholar] [CrossRef]
- Bakhteeva, N.; Galimzyanov, L.; Shatskikh, Z. Competitive wholesale market of the electric power and power: State and new calls. Power Eng. Res. Equip. Technol. 2016, 5–6, 70–78. [Google Scholar] [CrossRef]
- Administrator of the Trade System of the Wholesale Electricity Market. Available online: https://www.atsenergo.ru/ (accessed on 27 November 2020).
Publisher’s Note: MDPI stays neutral with regard to jurisdictional claims in published maps and institutional affiliations. |
© 2021 by the authors. Licensee MDPI, Basel, Switzerland. This article is an open access article distributed under the terms and conditions of the Creative Commons Attribution (CC BY) license (http://creativecommons.org/licenses/by/4.0/).