1. Introduction
In the last few years water extraction from air, based on a compression reverse cycle, is becoming a solution for different world areas where traditional water sources are scarce, or too polluted to be safely employed [
1]. The market of such a solution is growing and several air to water generator (AWG) systems, all claiming the best effectiveness, can be found on the market [
2]. The principle of water extraction from air is common to all the techniques, reverse cycle based or not and it consists in forcing the condensation process of the air vapour content [
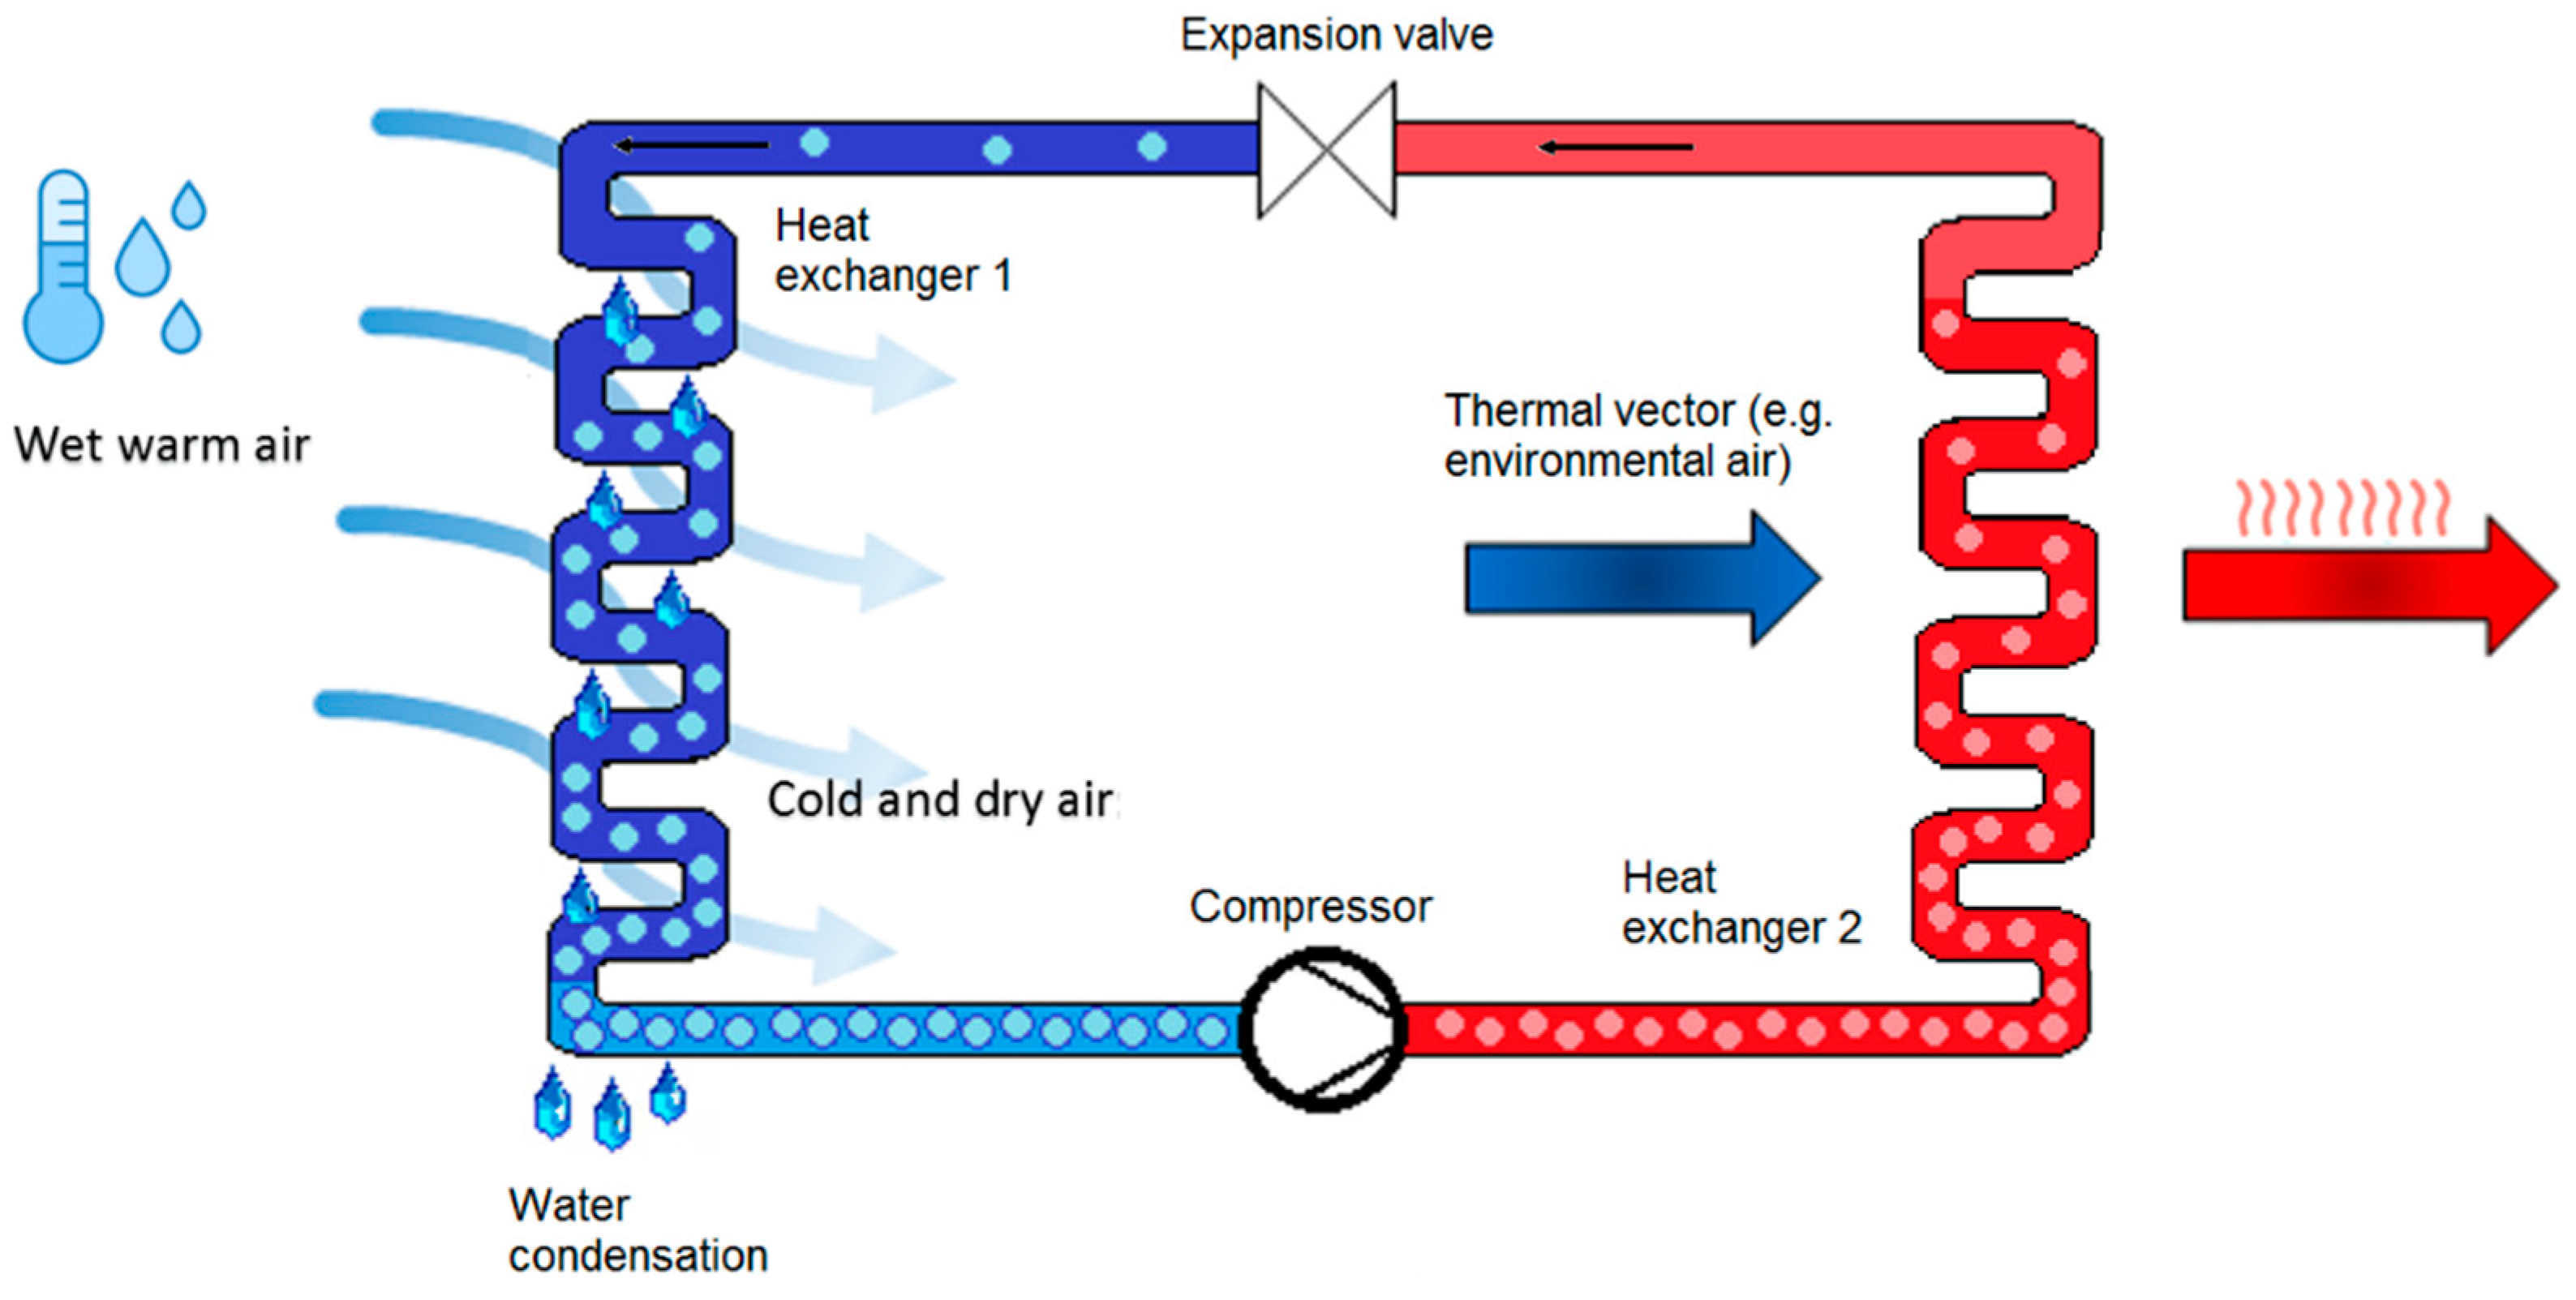
3]. In particular, AWGs, based on compression reverse cycle, force such a condensation by cooling air under its dew point. A representative scheme of the thermodynamic cycle is reported in
Figure 1.
The scheme shows that the environmental airflow (wet warm air, in the left side) is blown into heat exchanger 1, where it yields heat to the refrigerant, with a consequent partial condensation of its vapour content. Then, the condensate is collected and delivered to a treatment unit or simply to a storage unit. Then, the refrigerant passes through heat exchanger 2 where the subtracted heat is yielded to external environmental air or to another thermal vector. It should be noted that a whole AWG machine, beside such apparatus, may contain also other parts, such as fans, pumps, electronic components and so on, but their configuration strongly varies based on the particular design choices.
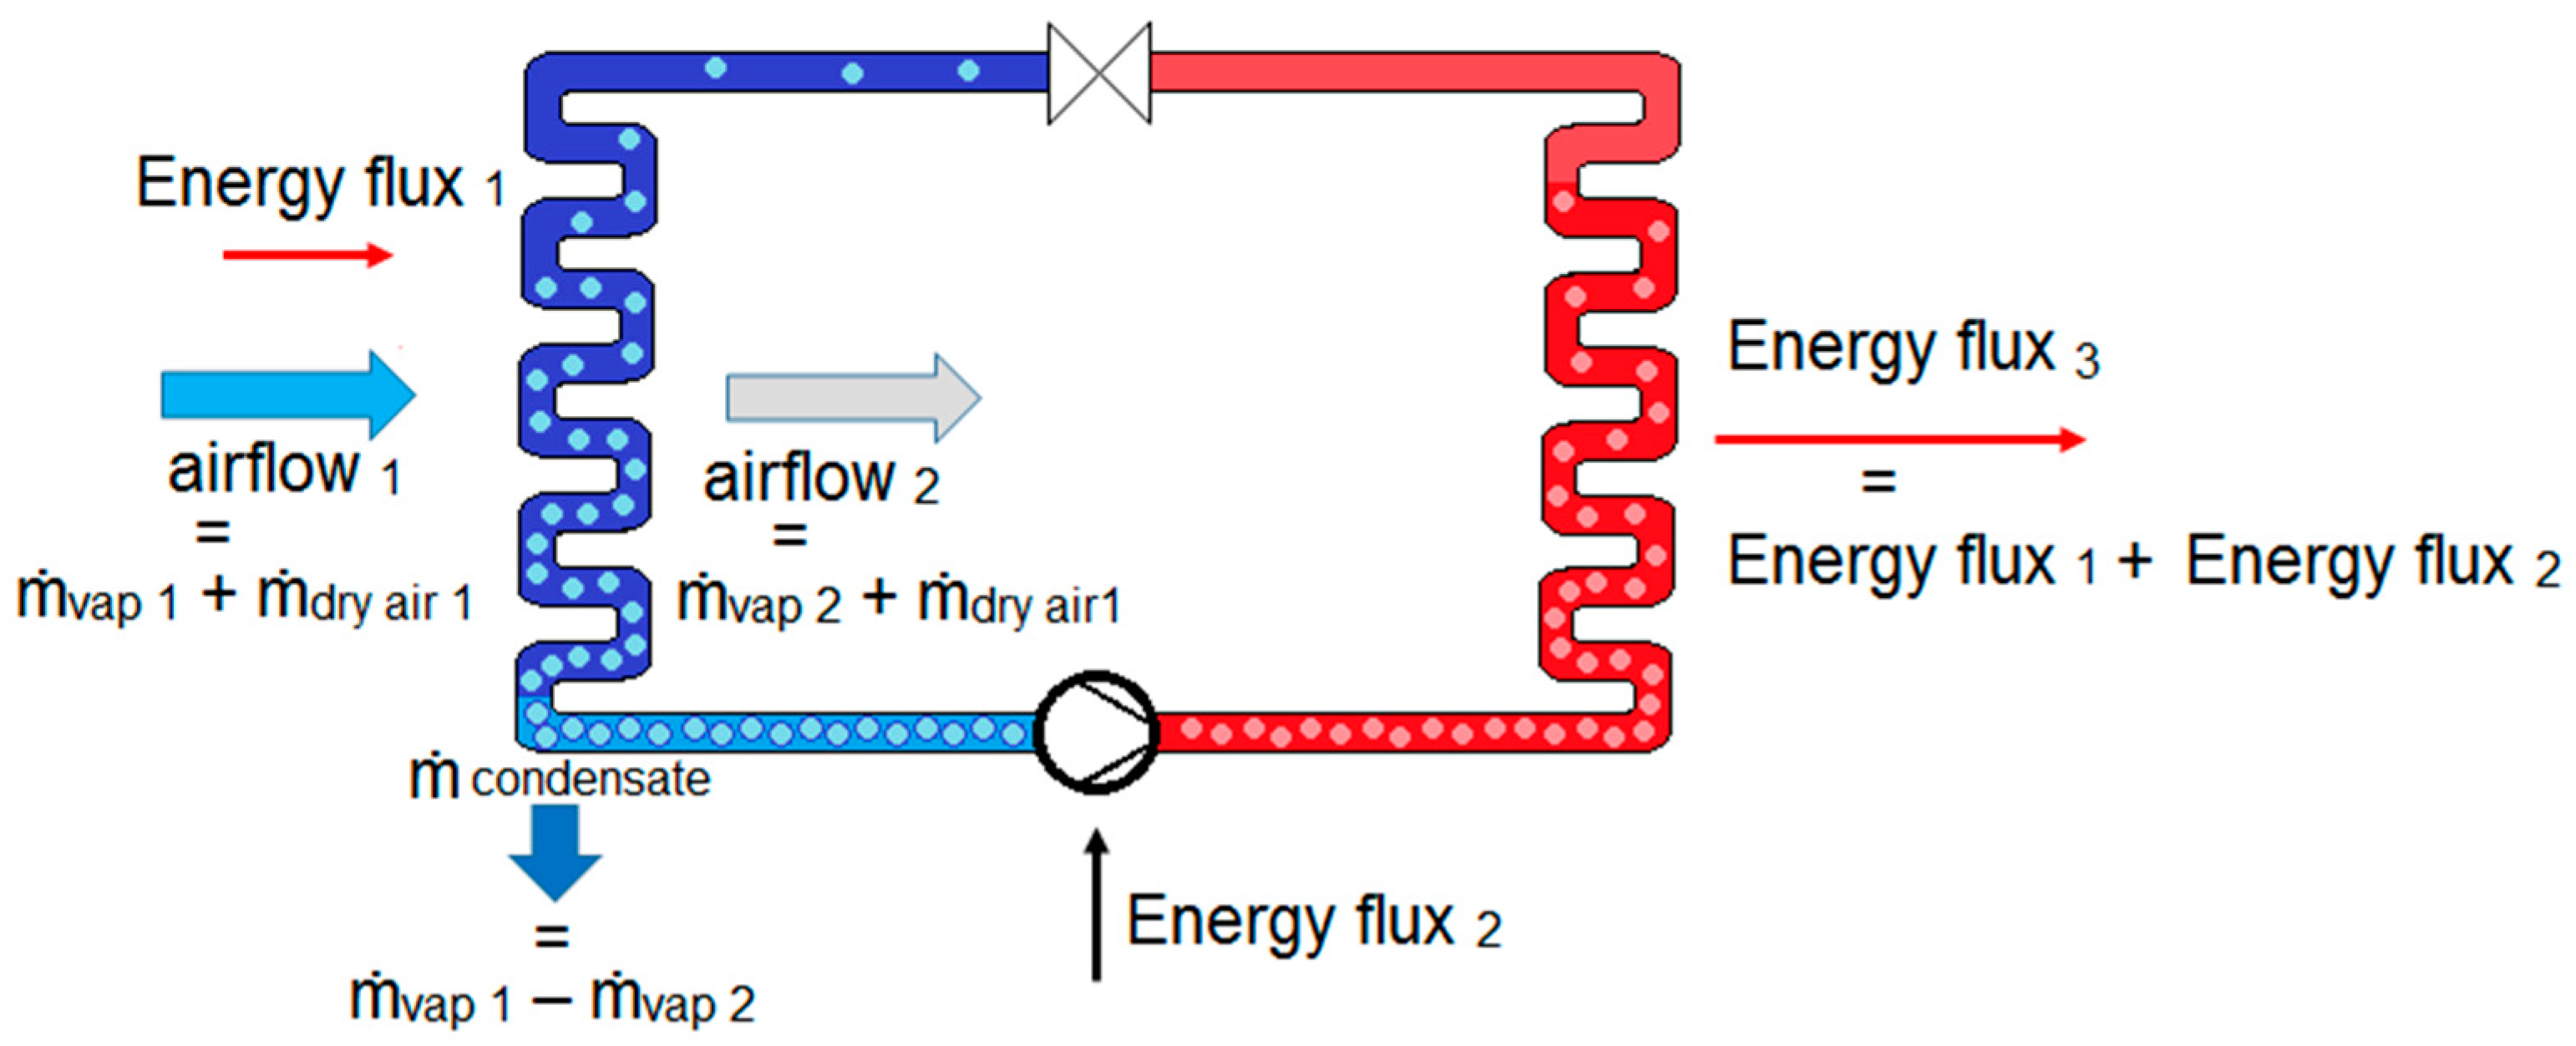
The mass and energy fluxes, related to the thermodynamic process are summarised in
Figure 2.
On the basis of the above scheme, it is possible to write two balance equations, which represent mass and energy conservation:
where:
= vapour mass flow [kg/s]
= dry air mass flow [kg/s]
= condensed water flow [kg/s]
Energy flux1 = thermal power exchanged in the heat exchanger 1 [W]
Energy flux2 = power required by the compressor [W]
Energy flux3 = thermal power exchanged in the heat exchanger 2 [W].
The power required by the compressor varies depending upon working conditions, such as evaporation and condensation isobaric curves, thermodynamic airflow conditions and mass flow entity, as discussed in [
4]. In particular it will increase when the gap between condensation and evaporation curves increases and also when the required heat flow at the first heat exchange increases.
The physical process of water extraction from air is intrinsically exothermic, as it requires the phase change from vapour to liquid. Even if the process is carried out by means of adsorbents, as Metal Organic Frameworks (MOFs) or others, it always requires more energy than a traditional system of water supplying, because of phase change [
5]. For this reason, the energy efficiency is one of the most important parameters that must be considered in order to make the best choice among different AWG products on the market.
A standard efficiency performance parameter for this kind of machine is not currently available in the literature or in technical practice. The scope of the current work is to propose an indicator to standardise the AWG efficiency evaluation and cover the gap.
In particular, this study proposes an efficiency evaluation tool based on the concept of the useful effect of the process, which is, in this case, only the liquid water obtained from air. The purpose of such an approach is to build an indicator conceptually and physically similar to the other two most known indicators for the evaluation of reverse cycle efficiency, the Energy Efficiency Ratio (EER) and the Coefficient of Performance (COP). Such an approach permits not only providing an easy and intuitive evaluation tool for AWGs but also a compatible factor that will be combined, in a next study currently under development, to formulate a global index. Such an index is intended for the energy efficiency evaluation of integrated systems, which are machines that can provide not only water but also can be a heating and cooling source, thus producing more than one useful effect at the same time [
6].
Until now, on the basis of the authors’ bibliographic and technical knowledge, the only parameter, related to energy efficiency that can be found is the value of the Specific Energy Consumption (SEC, [
1]), which is normally declared as the specific electricity consumption. In manufacturer technical sheets, it is normally expressed in kWh per L of extracted water; in the literature, it is usually expressed in kWh/L, for example in [
7] and in [
8], more rarely in kJ per L, as in [
9]. The authors in [
7] underline the lack of standard conditions for AWGs performance evaluation, as will be further discussed in
Section 3. In [
8] the authors highlight the absence of a standard AWGs efficiency evaluation method and propose a test procedure for commercial small sized AWGs. The procedure represents a first effort to define AWGs performances, with the support of a climatic chamber. Such a chamber was used to treat and control the air delivered to the inlet section, while the AWG machine was placed in a room whose temperature and relative humidity were not controlled.
The specific energy consumption expressed in kWh (or kJ) per L gives immediately the indication of the required energy to obtain one L of condensed water; thus, it has the advantage of being intuitive and practical. Anyway, there are at least three main issues related to such an approach that should be taken into account, which are summarised in the following points:
On the basis of the literature analysis, it seems that an indicator formulation, that is based on a physical similitude with an Energy Efficiency Ratio (EER) and Coefficient of Performance (COP) and approach can avoid the above-mentioned issues and allow the following targets:
An easier result comprehension because of the similitude with diffused indicators.
A possible aggregation with the said EER and COP, to formulate a global dimensionless index for integrated machines evaluation.
The thermodynamic formulation of EER and COP defines the energy performance of a theoretical reverse cycle. In technical practice, their standard formulations are the most used indicators for performance comparison among refrigeration systems and heat pumps and their use is widely diffused in the literature and in practice not only for a whole cycle evaluation but also for more detailed performance comparisons of particular components.
In the next paragraph, the EER and COP approaches are briefly described, and this section reports some evidence of their widespread use in the field of reverse cycle system evaluation.
For example, COP was used to detect:
A slightly lower performance coefficient of different refrigerant mixtures, than other refrigerants actually in use [
10] in vapour-compression systems.
The possible use of ionic liquid-low Global Warming Potential (GWP) refrigerants R32/R152a combinations, which are suitable for air conditioning applications [
11].
COP was also used to measure the effects of some parameters variation in compression/absorption cycles [
12] or to compare a double effect H2O–LiCl vapour absorption refrigeration system with H2O–LiBr systems [
13].
EER largely represents the energy efficiency of air conditioners and was used, for example, to compare constant and variable speed air-conditioners during cooling periods in different climatic conditions [
14] or highlight energy performances of different solar cooling systems [
15].
It is interesting to observe that the theoretical formulation of EER (called improperly COP) was employed, among other parameters, to design and provide a first evaluation of an experimental kit of water extraction from air in [
16]. In this case, the parameter was employed basically to evaluate the compressor behaviour. Such a parameter is necessary to evaluate the cooling performance of a reverse cycle. Of course, EER alone is not suitable to describe an AWG machine efficiency, because it is clear that any kind of AWG performance evaluation must take into account the main wanted useful effect: the extracted water.
In the following paragraphs, the indicator formulation for AWGs evaluation will be provided along with a conversion equation to translate the existing consumption parameters in the new tool. Moreover, calculation parameters will be discussed, in order to define the most useful common conditions for a standard evaluation of the indicator.
2. WET (Water Energy Transformation) Indicator
The proposed indicator, named WET (Water Energy Transformation), is the ratio between the condensation energy (
Qc = latent heat of condensation per unit mass [kJ/kg]), which is required to condense a mass of water
m [kg], and the energy
E [kJ], which is required by the whole machine in order to provide the stated environmental air thermodynamic conditions.
Usually,
E is an electrical energy because the most diffused AWGs are powered by electrical motors [
2]. However the formulation is general and represents a ratio between energies, independently from the machine working principles. When there is a comparison among systems that are powered by means of different energy sources, it is mandatory that such consumption should be expressed in homogenous terms. A possible solution is to convert energy consumption in terms of primary energy by means of primary energy conversion factors.
Such a proposed formulation translates into energy the specific useful effect of an AWG system, which is the water production by means of condensation. The indicator, in such a way, has the same approach of COP and EER: it is a ratio between two energies and in particular, it is the ratio between the wanted useful effect, divided by the effort to obtain it, and as well as the aforementioned indicators, its value increases when the energy efficiency of the machine increases.
This approach is similar to the one proposed in [
17] where Moisture Harvesting Index (MHI) index is designed in order to give a tool to characterise climatic areas from the water harvesting from an air point of view. The MHI permits determining how a climate is suitable for water extraction from air from an energetic point of view.
The authors of [
18] investigate a cogeneration plant, and the product between latent heat and water mass is used in an extended index, which is proposed to evaluate performances for a combined desalination system that produces electricity and fresh water. Additionally in this context, the proposal highlights the need for a parameter that allows a comparison of the system efficiency.
Equation (3) outlines the latent heat for condensation, which can be expressed by a formula depending upon the temperature
t [°C]; in a range compatible with water extraction technology, it can be expressed as [
19]:
The value of
Qc in the WET indicator in Equation (3), in first approximation, can be set as a constant whose value is 2460 kJ/kg. It is the rounded average calculated with Equation (4), taking into account the dew point values in
Table 1 corresponding to the most representative AWGs working points, as it will be discussed in the next paragraph and in
Appendix A.
Moreover, in
Appendix A the reference to dew points is explained and a method to carry out a more accurate calculation of
Qc is indicated when the air cooling process of the AWG machine under evaluation is fully known.
The WET denominator takes into account the energy consumption of all the steps involved directly or indirectly in the water extraction process, with the same approach of EER and COP, but it does not take into account the intended final use of the produced water and thus the energy consumption related to any possible post treatment. Regarding such a subject, it must be cleared that AWG energy consumption depends upon two main aspects of the process: the actual water extraction from air and the water treatment. Normally, this second process requires less than the twentieth part of the first one but the more articulated and complex the water treatment, the higher its energy consumption will be.
It can be said that the energy consumption due to water treatment is related only to the achievement of water quality and it is not strictly involved in the process of extraction from air.
Therefore, such a ratio of energy consumption cannot be incorporated in an indicator, whose specific scope is to translate the water extraction from air into an energy ratio between such a useful effect and its energy cost.
Moreover, the extracted water is not always intended for drinking purposes; thus quality requirements can strongly vary from one application to another, even if the same thermodynamic core is used.
For example, if the produced water is used for cleaning, little or null efforts are needed in “post production”. The water treatment must be evaluated with a dedicated and more complex procedure, which is expressively studied to duly take into account the achieved water quality (the authors are currently analysing a particular evaluation tool expressly intended for such a purpose).
From the above considerations, it is clear that the only energy costs to be considered in WET calculation are those related to water production but what those costs are must be well stated.
As it is well known, EER and COP represent, respectively, the ratio between the cooling and heating capacity (the useful effects) and the work/energy required to produce them.
This last term was subdued to an evolution in the last decades taking into account not only the compressor work but also the energy consumption due to all the other elements composing the apparatus, which permit achieving the desired useful effect: e.g., fans, electronic components and so on.
In order to maintain the same approach of EER and COP expressions, the WET denominator is represented by the whole energy cost of each item involved in the water extraction from air, in liquid phase, before any sanification/filtration system.
For example, in the case of a reverse cycle-based machine, the energy cost will take into account the evaporation air fans, water pumps, condensation fans, compressors, and all the other electrical devices involved in the process, as i.e., temperature and pressure probes, electric valves, Programmable Logic Controllers (PLC) and so on.
In the case of SEC declared by the manufacturer, if such a consumption is electrical (expressed in kWh/L) and takes into account all items involved in the water extraction process as described above (except those related to water treatments, for the reasons just explained), conversion can be carried out with Equation (5) reported below:
where SEC is the specific electrical energy required by the whole system [kWh/L],
ρ (assumed 1 kg/L or 1000 kg/m
3) is the water density in liquid phase and 3600 are the seconds per hour and thus, it converts the energy unit from kWh to kJ.
In addition to the mathematical formulation, in order to obtain meaningful results that permit comparison among different AWGs, for the proposed indicator, it is necessary to state unified calculation common rules. Therefore, in the next paragraphs, the authors propose a unified set of environmental parameters to be used in the WET calculation, as it happens for EER and COP evaluation.
3. WET Calculation. Proposal of Unified Parameter Sets: Normalised Conditions
AWG machines’ behaviour, in terms of energy consumption and water production, is strongly related to thermodynamic environmental conditions, as deeply discussed in [
4,
17]. Therefore, the WET, as well as the specific consumption parameter, requires a set of standard conditions to carry out their calculations, as it happens for EER and COP [
20].
It is a common experience, during an AWG system data sheet analysis to find a working range that is expressed by means of the minimum environmental temperature and its related humidity, as well as the maximum environmental temperature and its related humidity and it is also common to find reference to “nominal conditions”. Usually, these are always given in terms of a dry bulb temperature and a related relative humidity (RH): referring to them, consumption and water production are declared. As no standard exists, each manufacturer changes limits and nominal conditions [
2], also from model to model. In this way it is impossible to carry out a comparison between two machines in order to understand which of them is the most energy effective.
In order to allow a comparison among different solutions, it is advisable to establish a set of standard couples of temperature and humidity, which can be the basis of a nominal reference WET value.
The normalisation of declared water production and specific energy consumption has already been underlined in [
7], where there is a first proposal for a standardisation of the nominal conditions referred to the domestic dehumidifier standard conditions (temperature = 26.7 °C and RH = 60%) [
21]. Such a solution is not so advisable because a domestic dehumidifier is meant to maintain a certain RH level and often treats indoor air, while medium and large-sized AWG systems (with a production range that goes from hundreds to thousands of litres a day) are meant for operating in the external environment and treat external air. Moreover, even for small AWGs, for indoor installation, the most advanced ones treat external air; in fact, they have an external unit that comprises the compressor and the air inlet section. The reason that outdoor air is preferred as a water source is that the indoor one is more critical in terms of biological hazard, as it is more polluted in terms of viruses and bacteria due to the human presence in comparison to the outdoor one. It is also important to underline that liquid water can be an eligible breeding ground for biological pollution; thus, when water coming from condensation is collected, it is important to avoid a source such as indoor air, which can be potentially very hazardous.
In any case, the said conditions, as stated for dehumidifiers, refer to a technology devoted to treating and minimising the relative humidity of the indoor environment. On the opposite, AWG systems are focused on water production maximisation and, if they are not integrated systems, they normally do not interfere with indoor conditions. Even if integrated systems are under examination, the reasoning does not change, as water extraction is always performed from outdoor air; thus, such a process is not related to indoor conditions.
Moreover, the water condensation from the air concept was initially applied in humid and hot climates (Group A, [
22]), and a lot of existing machines have been designed focusing on that hypothesis.
Thus, a standard calculation dedicated to such a technology must also take into account the history of the AWG tech itself and cannot propose values related to other technologies that are intended for very different targets.
In [
8], seven different conditions are assumed to depict some representative climatic conditions, but most of them are not very suitable for the tested technology, as declared in the Results discussion.
In order to avoid the same issue and to provide something more adherent to the existing design praxis, the authors studied the ranges and design conditions of more than one hundred machine models (the list can be found in [
2]) for external and internal use, which are characterised by different sizes and propose four couples of conditions.
Two of them are extreme conditions, in order to depict an AWG machine behaviour at the average limits of operation. The other two are nominal conditions, one representative of the most diffused declared ones, the other representative of more temperate weather zones.
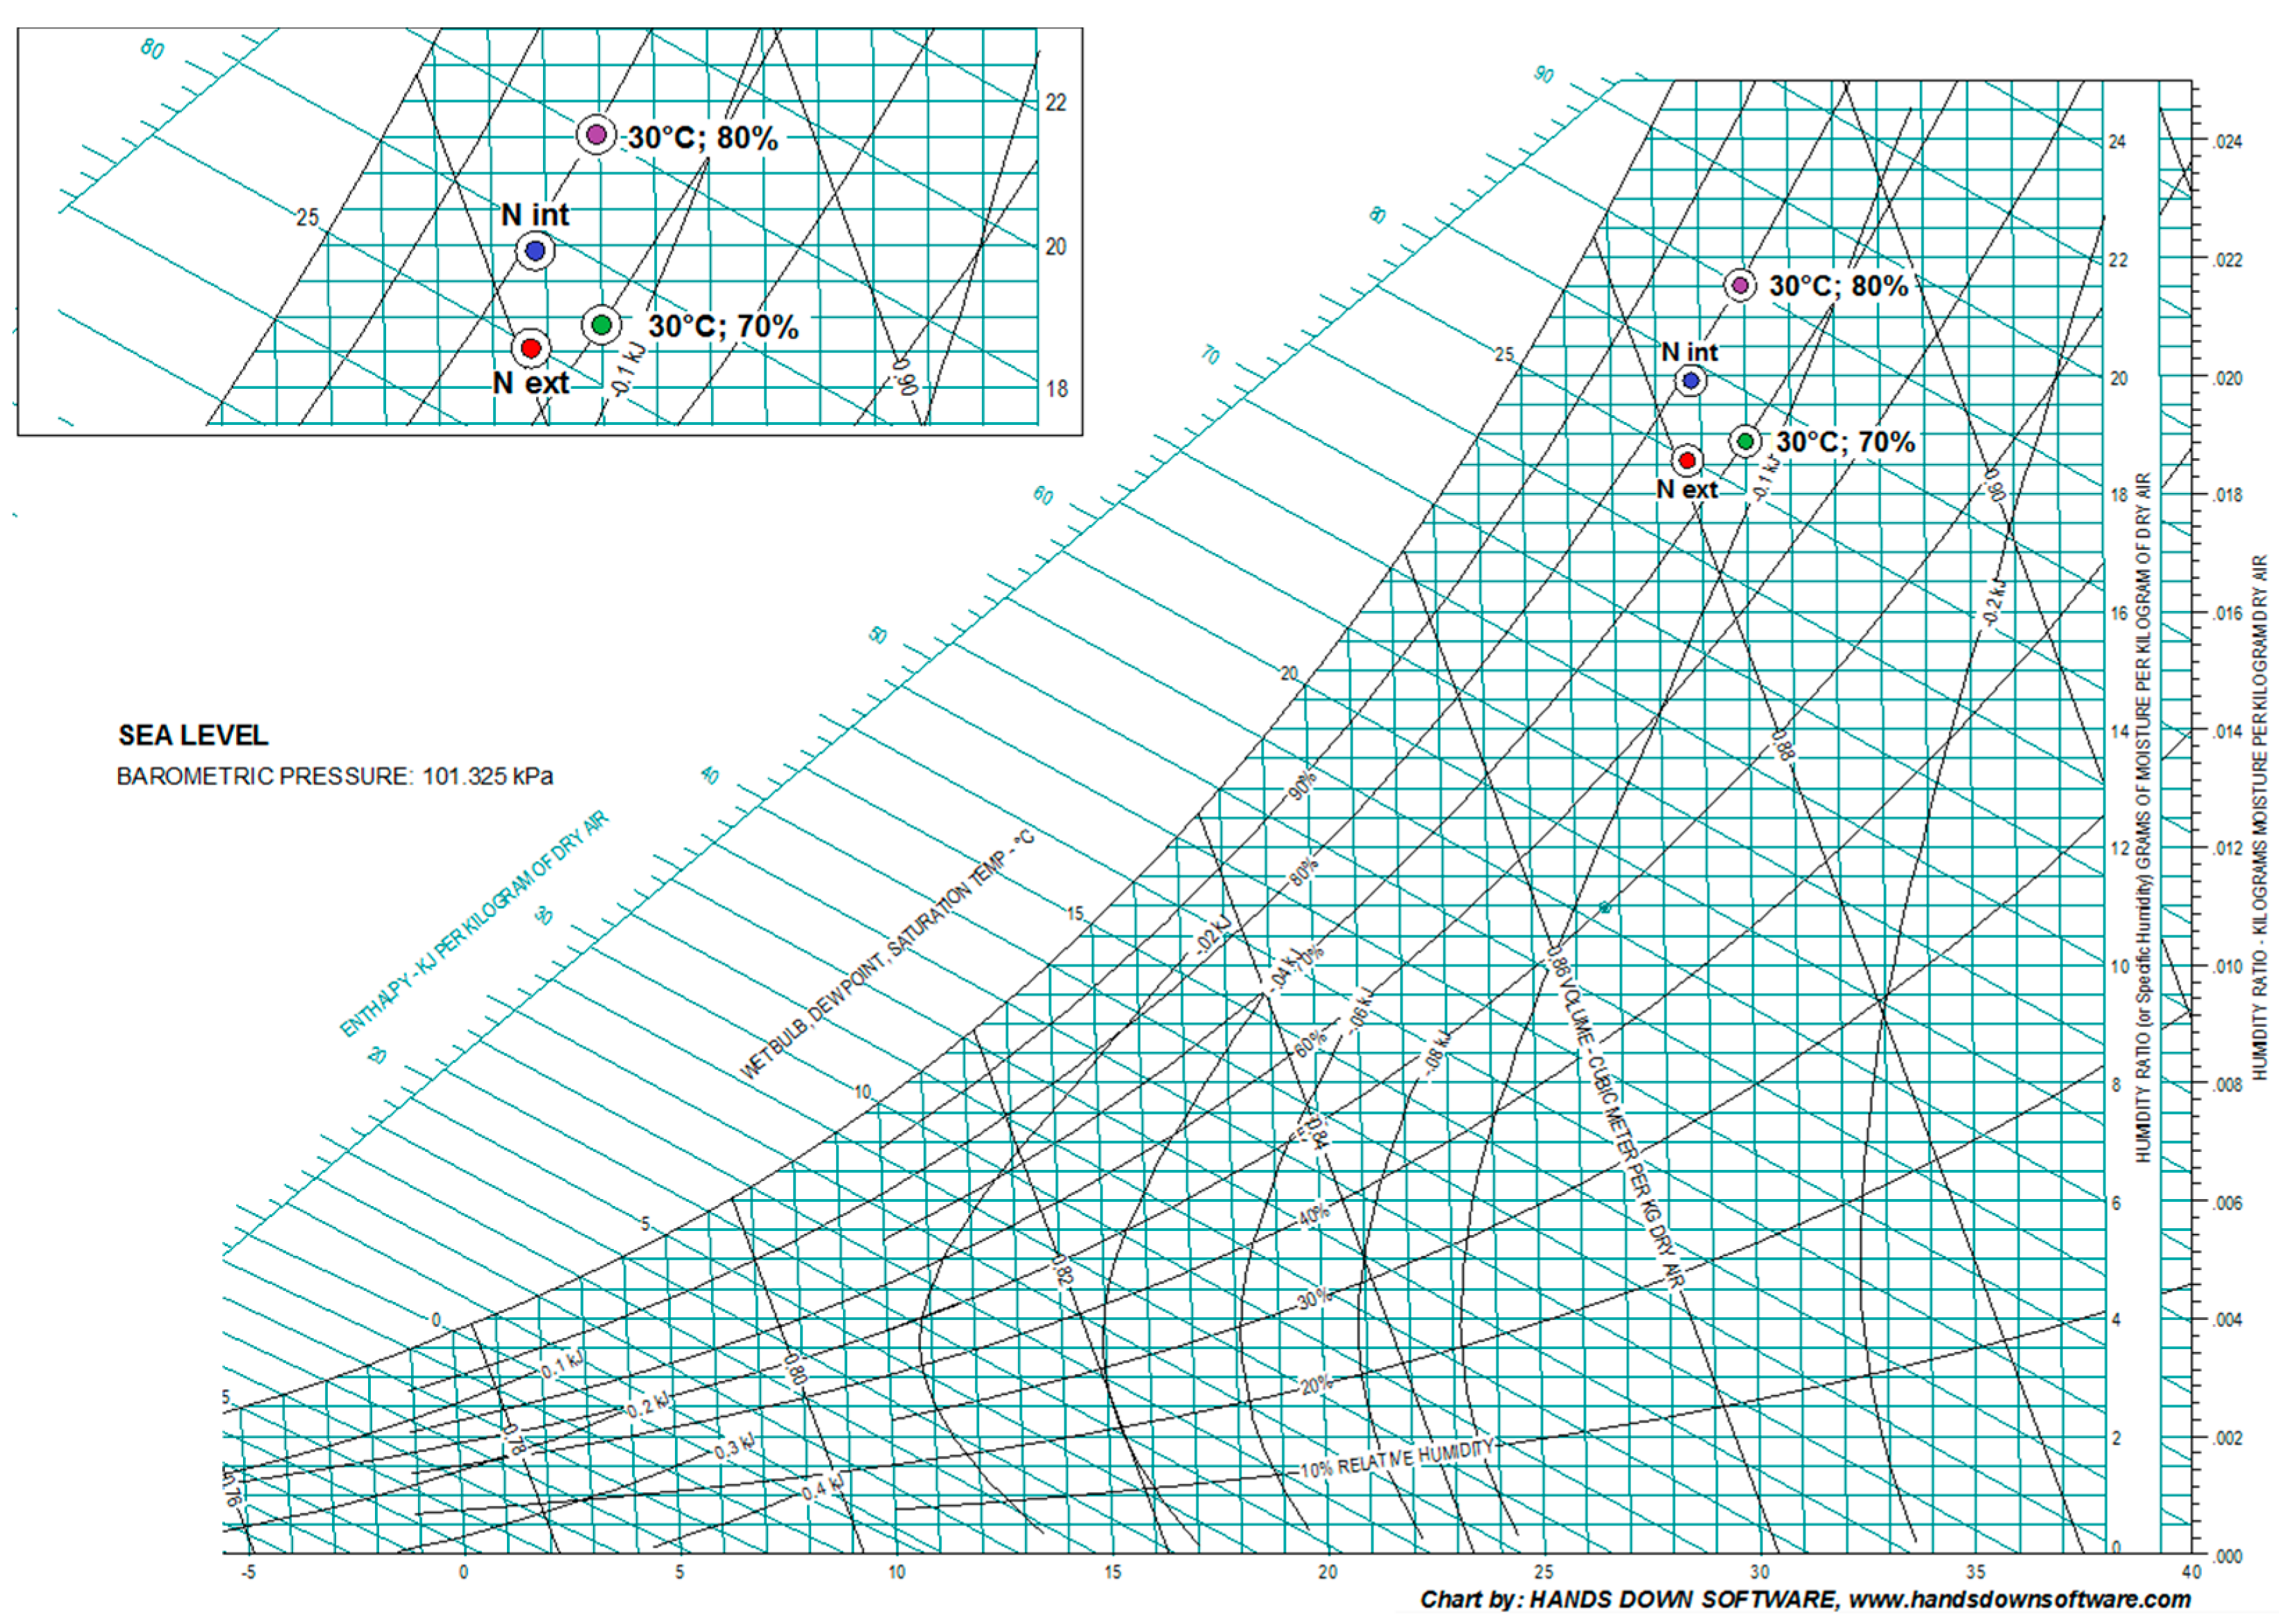
Analysing the AWGs data sheet it is possible to observe that, when declared, nominal conditions are expressed by a dry bulb temperature and relative humidity values, which are usually rounded to ten. The most diffused, for both types of AWG machines (internal and external), are two couples:
30 °C, 70% RH (specific enthalpy = 78.1 kJ/kg, specific humidity = 18.8 g/kg)
30 °C, 80% RH (specific enthalpy = 85.2 kJ/kg, specific humidity = 21.5 g/kg)
In order to choose one representative couple, the authors analysed the average values of declared nominal temperatures and nominal relative humidities and found the following:
28.7 °C and 74.2% RH for external machines (specific enthalpy = 76 kJ/kg, specific humidity = 18.5 g/kg)
28.8 °C and 79% RH for internal machines, specific enthalpy = 79.5 kJ/kg, specific humidity = 19.8 g/kg
It is important to underline that all the working parameters are given taking into account the atmospheric pressure of 101,325 Pa.
The above four conditions are reported in
Figure 3.
Analysing average values, it is possible to find a first piece of interesting information: nominal conditions for internal and external machines are almost the same. Such a result can be justified, in part, from the observation mentioned above: some models of internal machines take air (from which water is extracted) from the external environment. Another explanation is that, generally, the concept of an AWG system for internal use comes from a miniaturisation of the first idea of an AWG machine studied for outdoor environment; thus, the design parameters are almost the same.
Another important statement comes from the comparison of the four points reported in
Figure 3: the best candidate to be representative of the most diffused AWGs nominal conditions is the point at 30 °C and 70% RH. In effect, its specific enthalpy differs at a maximum 2.1 kJ/kg from the averages and its specific humidity differs from them only 1 g/kg, while the point at 30 °C and 80% RH presents more marked differences.
The above nominal conditions are representative of humid and hot climates. In order to give indications of machine behaviour in more temperate zones (Group C, [
22]), a further set of temperature and RH could be also added, e.g., 25 °C and 50%, which is the mild condition chosen by [
8].
The last two points to be defined are the extreme conditions. In this case, declared data were analysed and averages were calculated as well. The results are reported in
Table 2.
Analysing the above table it is possible to determine that extreme conditions differ considerably for internal and external machines. Such a result was expected because the working range for a miniaturised AWG internal machine cannot be as wide as the working range of a bigger system, which, for example, has enough space to house special reinforced equipment, as enlarged heat coils are expressively studied for very dry conditions.
In this case, the authors propose two couples of standard extreme conditions: one intended for external machines and the other intended for the internal ones. In addition, in this case, found average values were rounded, in compliance to technical practice. In
Table 3, a comparison between average extreme conditions and the author’s proposal is shown.
The whole proposed condition set suggested for the WET indicator calculation is summarised in
Table 4 for machines intended for external and internal use. Such a condition set enables a customer to understand how the machine behaves, respectively, in good, average, and extreme conditions.
In the technical standard EN 14825:2018 [
23], which is related to heat pumps and air conditioning systems, the Seasonal Energy Efficiency Ratio (SEER) and the Seasonal Coefficient of Performance (SCOP) are defined. Those indicators combine, respectively, all the EERs and COPs determined for each temperature of a certain climate, exceeding in defect or in excess a particular threshold (16 °C), in order to take into account all the cooling/heating energy required during the heating and the cooling seasons and the related energy consumption. Such an evaluation is based on the hypothesis that a heat pump or an air conditioner, works only during a certain period of the year and only during those hours when the outside temperature is below or above, the said threshold. Therefore, it is meaningful to add a seasonal parameter for energy consumption in the energy evaluation. Instead, AWG machines are normally intended to work in order to maximise water production, thus 24 h a day, independently from the specific season. Thus, for such machines, it is more meaningful to evaluate an average monthly WET, considering water production and energy consumption for the entire year in a particular climate.
In other words, it is advisable to represent a curve or a histogram showing the estimation of machine monthly energy efficiency, based on standard climate data or on historical data collection of the required place intended for AWG system installation.
To support this proposal, in the next paragraph, a WET indicator has been calculated for an existing AWG machine. Such a machine has the particularity to be an evolution of the common technology of water extraction from air because it is an integrated machine that is able to provide not only water but also thermal energy contributions given by a flux of dry and fresh air and low temperature heat that is suitable for domestic water heating. The choice of an integrated machine can support the further development, which is represented by a global index theorisation that is currently under research.
4. Case Study
In this section, the authors propose some examples of WET application. In the first part, a comparison between the specific energy consumption and WET values is shown, while in the second part it is presented a comparison between the WET calculated on a monthly basis and the WET is calculated taking into account the normalised conditions.
4.1. WET and Specific Electrical Energy Consumption Comparison
In this section, the authors show a comparison between two AWG machines using both the most diffused parameter, the specific energy consumption (kWh/L), and the WET.
The two machines are both for external use, and they belong to the same production class, medium–large [
2].
The manufacturers declare the following data in
Table 5.
On the basis of the declared values of the specific energy consumption parameter, machine one seems far better than machine two, as the specific consumption of machine 1 is more than one-third less than the other.
Making a more in-depth analysis, it was possible to find out the energy absorption of the major items for both the systems, as shown in
Table 6.
On the basis of the total power absorption and of the produced water, considering a density of 1 kg/L, it was possible to determine the WET values on the basis of (3):
The analysis carried out by means of WET gives a very different result in comparison to the first evaluation: at the condition 25 °C and 50% of RH the two machines, from the energetic point of view, are practically the same. This second result is obviously the correct one, as, analysing consumptions and productions, it can be easily found that the second machine provides 41% less water consuming exactly 41% less energy; thus, the machines’ behaviours are the same, in the same weather conditions.
Moreover, applying the same method in order to define WET for the other three points discussed in
Section 3, even more interesting results were found which are shown in
Table 7.
As the higher the WET, the better the machine performance, the table above shows that the efficiency of machine 2 is on average better than that of machine 1. Just in the hottest conditions, machine 1 presents a better energetic behaviour. Such a result allows a decision maker to determine what can be the most suitable solution for an intended application.
The case shown above is a typical example of the fact that the specific energy consumption has never been formalised, so its meaning is not clear and comparison among different machines cannot be fair. Another similar example can be found in [
8], where some results of a small sized AWG machine performance in different environmental conditions are reported. In this case it is not declared whether the water treatment unit consumption is included or not. From the test apparatus picture, it seems that it was considered for all the tested machines. As already discussed in
Section 2, such a consumption cannot be included into the efficiency evaluation because it can bring paradoxical results. As an example, the case of two identical machines can be reported, where just one of them is equipped with a water treatment unit. If the comparison is carried out using the specific energy consumption, the more complete machine will be penalised, while the energetic behaviour related to water extraction from air is the same.
4.2. WET Extended Calculation Example
In order to provide cases of WET calculation for different climates and for an entire year, the authors virtually transported the real outdoor AWG machine, whose design is described in [
6], into three different countries by means of the simulation software described in [
6]. Such a machine was built on the basis of a reverse cycle, and besides condensed water, it permits employing condensation heat in domestic water heating by means of a plate heat exchanger and the fresh and dry air flux coming from the water extraction process, by means of an ad hoc canalisation, which can be directly connected with an existing Air Treatment Unit (ATU) or to a building ventilation duct, adding a fan and, if necessary, air filtrations. The integrated machine can work in different ways by means of simple Programmable Logic Controller (PLC) settings. This system can provide all three useful effects or only one or two of them. The wanted useful effects can be water production and/or heating energy and/or cooling energy.
This physical based software, developed by the authors themselves, takes into account all the major elements of such an integrated machine. The software can be configured in order to reproduce the wanted configuration of the machine, from a simple AWG system, which provides only water, to a fully integrated system, which permits employing all the useful effects of the cycle. The software (called “simulator” in the following) requires as input data atmospheric pressure, dry bulb temperature, and RH, and it provides a real-time simulation, integrating numerically energy and mass equations, as described in [
6]. Therefore, it is able to simulate not only the steady state behaviour but also the transients. It is possible to give data inputs arranged in series, in order to describe an entire year or to give a simple couple of values, in order to understand machine behaviour for a particular state of the processed air. It is also possible to set a series of limits that describe the working boundaries range. In [
6], the authors also describe how the model and its related software were validated on the basis of 20 days of measurements carried out on the real outdoor integrated AWG machine object of the current analysis.
The simulator outputs all functioning parameters, in particular: water production, electrical energy absorption of each involved item, the whole energy consumption, heating energy (coming from condensation), and the dry-fresh airflow and its temperature and humidity.
For the current study, the outdoor machine and thus the software simulation were set to produce only water.
In the analysed configuration, the main machine parts, whose similar scheme, even if for a bigger model, can be also found in [
4], are as follows:
Air treatment unit (ATU), where there are placed, beside air filters, the heat recovery system and the evaporator coil for direct coolant evaporation, equipped by air fans.
Compressor of 100 kW of nominal cooling capacity.
Condenser, equipped by air fans.
The water treatment unit, as discussed above, is excluded.
Simulation software, as well as the real machine, can manage evaporator fans speed in order to maximise water production or minimise energy consumption or to achieve the best ratio between production and consumption. In the current work, the last configuration was chosen. Due to the very good compliance between software and real machine behaviour shown in [
6], a simulator was used to carry out some calculation in order to carry out some WET evaluations.
In
Table 8, the compiled Performance Summary shows the WET values in the various normalised conditions referring to atmospheric pressure (101,325 Pa).
Analysing the table above, it is possible to infer that the machine was designed, from the energetic point of view, to be most effective in hot and humid climates (WET highest value). However, when weather conditions are less favourable, the machine assumes an energetic behaviour that differs at a maximum of about 12% from the average value of 1.6. Such an information depicts an almost constant efficiency behaviour of the system in a large working range.
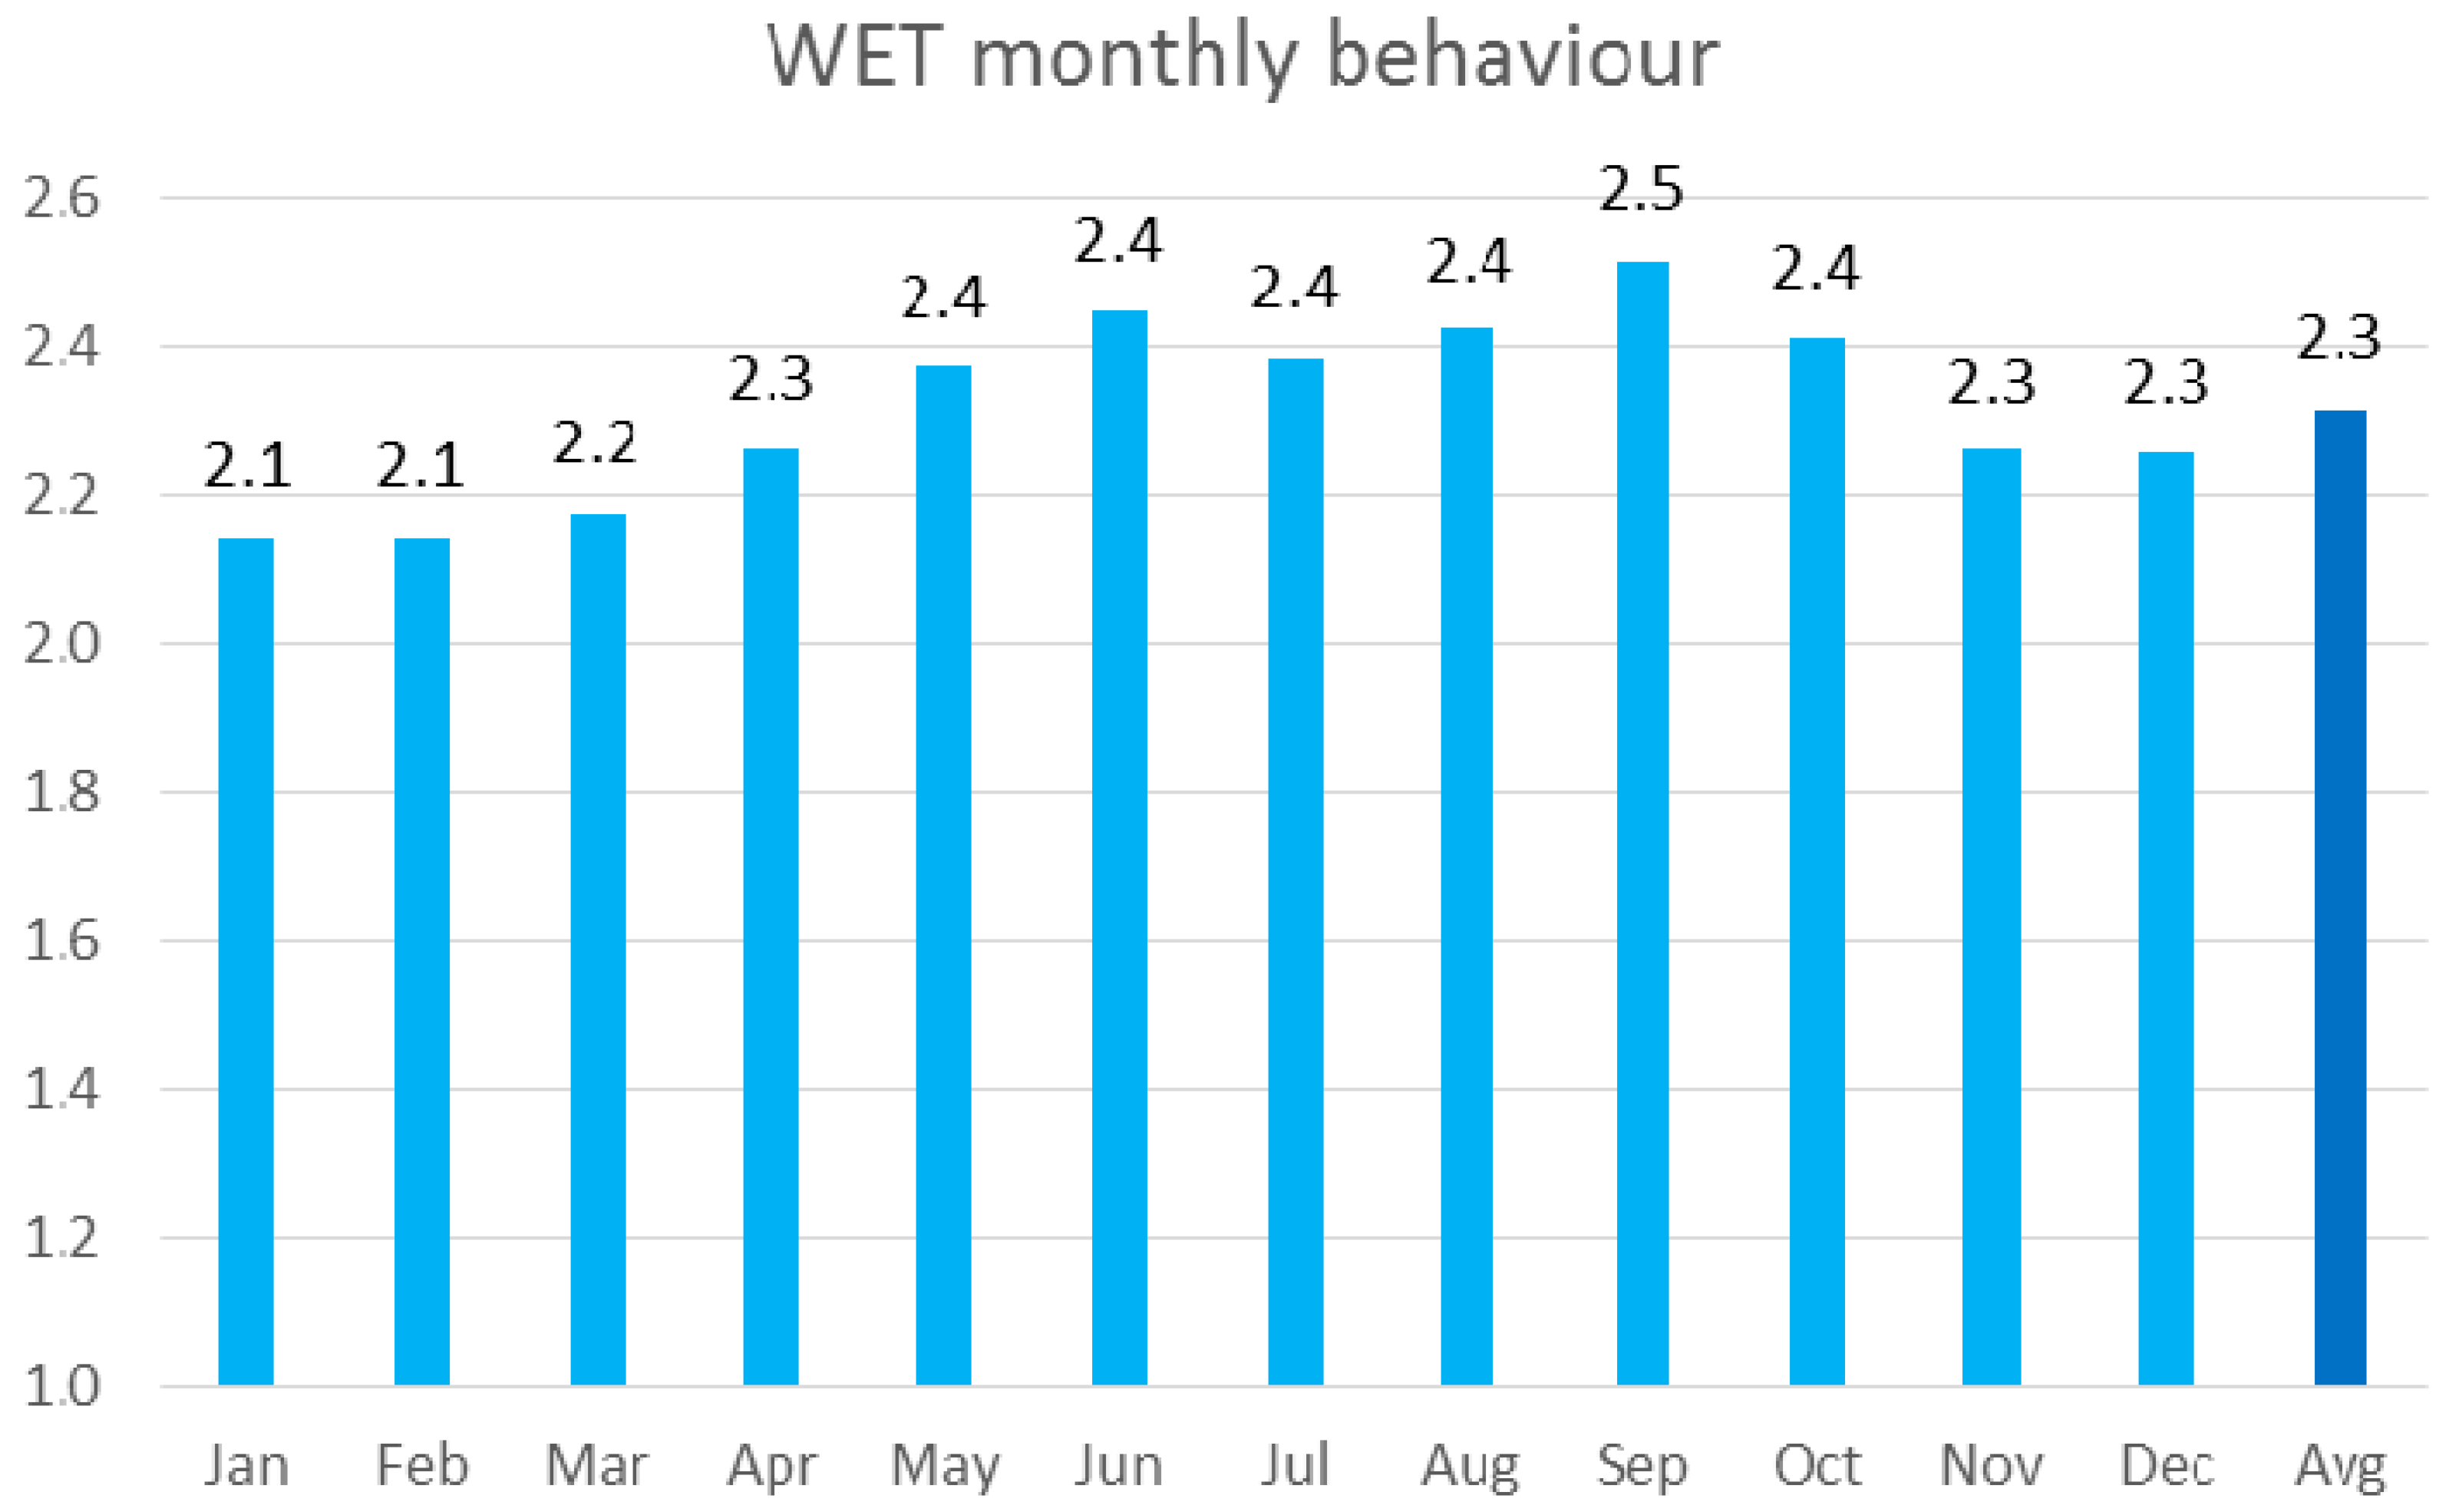
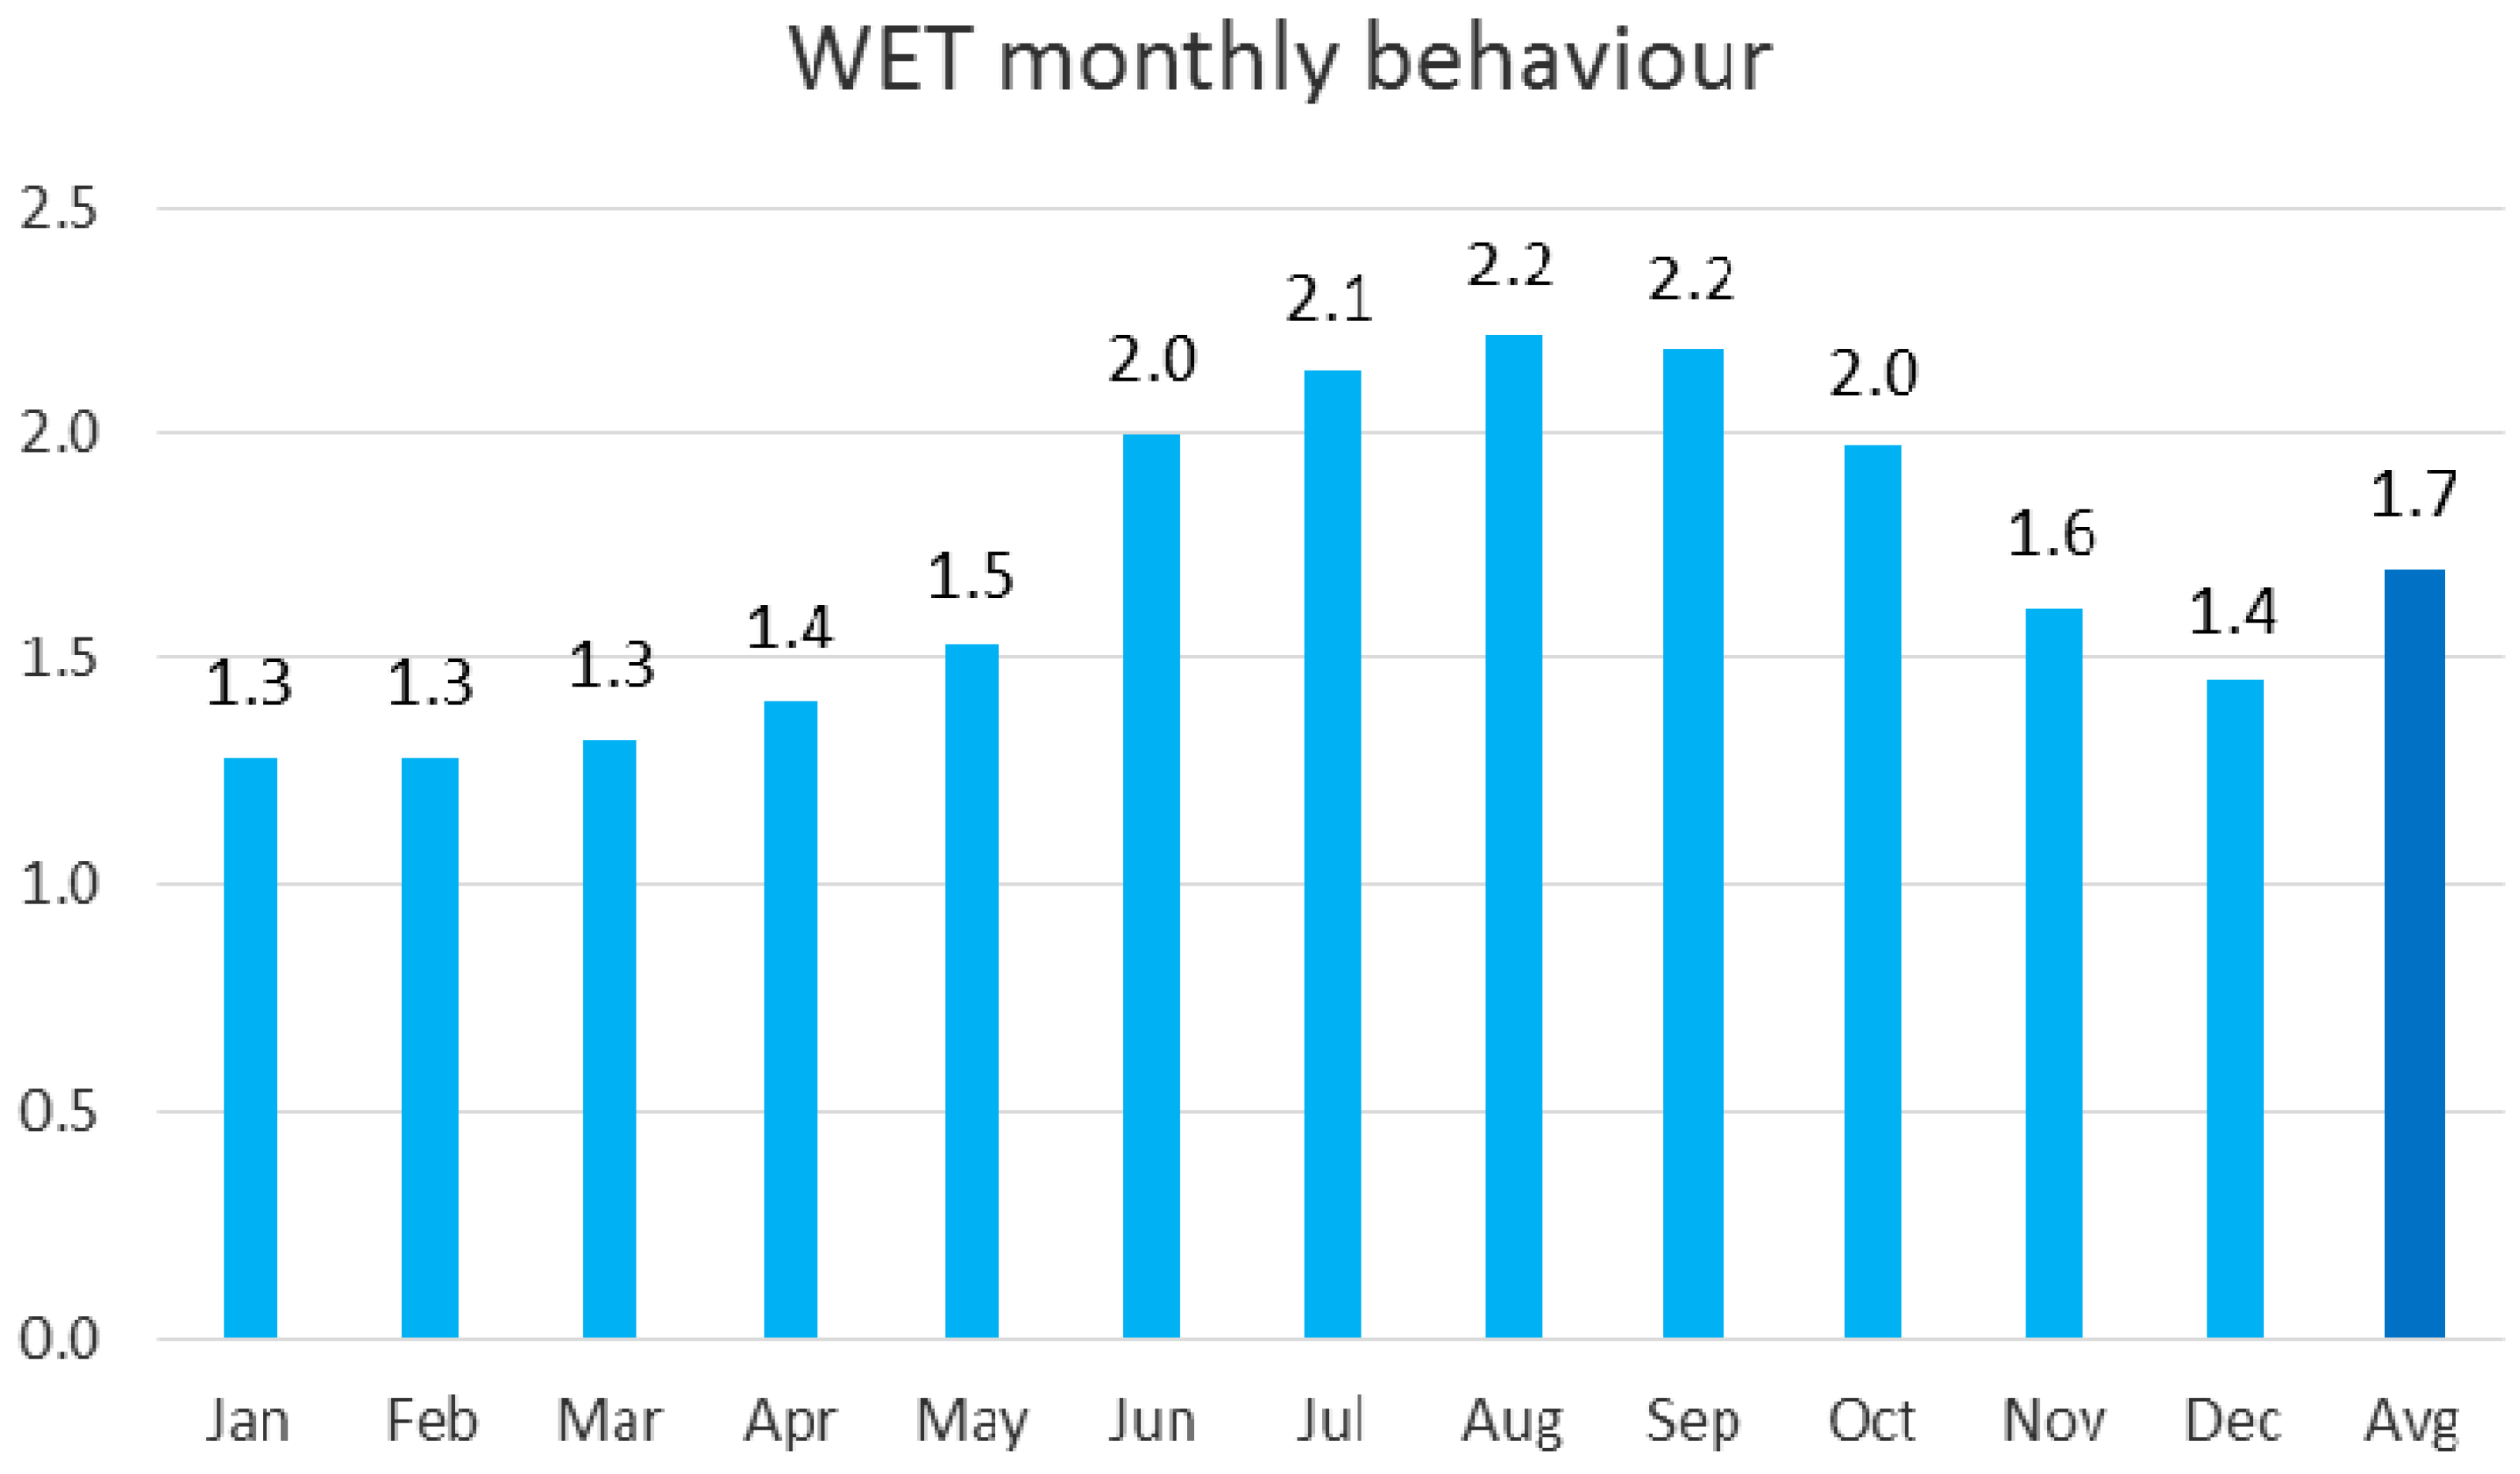
As indicated in the previous paragraph, a more detailed analysis of the WET indicator can be performed by means of the monthly values calculated for a specific climate. For example, considering the climate of the site where experimental application of an integrated system [
6] was carried out (Villahermosa, Mexico); the results of the simulated machine are represented in
Figure 4.
By analysing the WET monthly values, it can be observed that its average value corresponds to the proposed Nominal conditions n.1 in
Table 4. It is an expected result, as Villahermosa has a hot and humid climate (
Table 9, statistic average of the last 5 years weather data, coming from Carlos Rovirosa Perez International Airport). By means of WET monthly values, it is possible to state that the machine efficiency is almost constant during all the year, as the maximum variation of the indicator, from the average, is equal to 10%. In this case, the Performance Summary gives information enough to understand machine behaviour.
In the
Figure 5, the WET was calculated for the Abu Dhabi (United Arab Emirates) climate.
The indicator average value is 1.7, nearer to Nominal conditions 2 performance than to Nominal conditions 1. This is because the said city has a drier and hotter climate in comparison to Villahermosa, as it can be ascertained looking at
Table 10, which reports the statistic average of the last 5 years of weather data coming from Al Bateen Executive Airport of Abu Dhabi.
The WET monthly values are almost all comprised into the Performance Summary range; thus, also in this case, such a piece of information could be enough to understand the machine behaviour.
However, the histogram permits determining that the period from June to October is the most effective one for water production with the analysed machine.
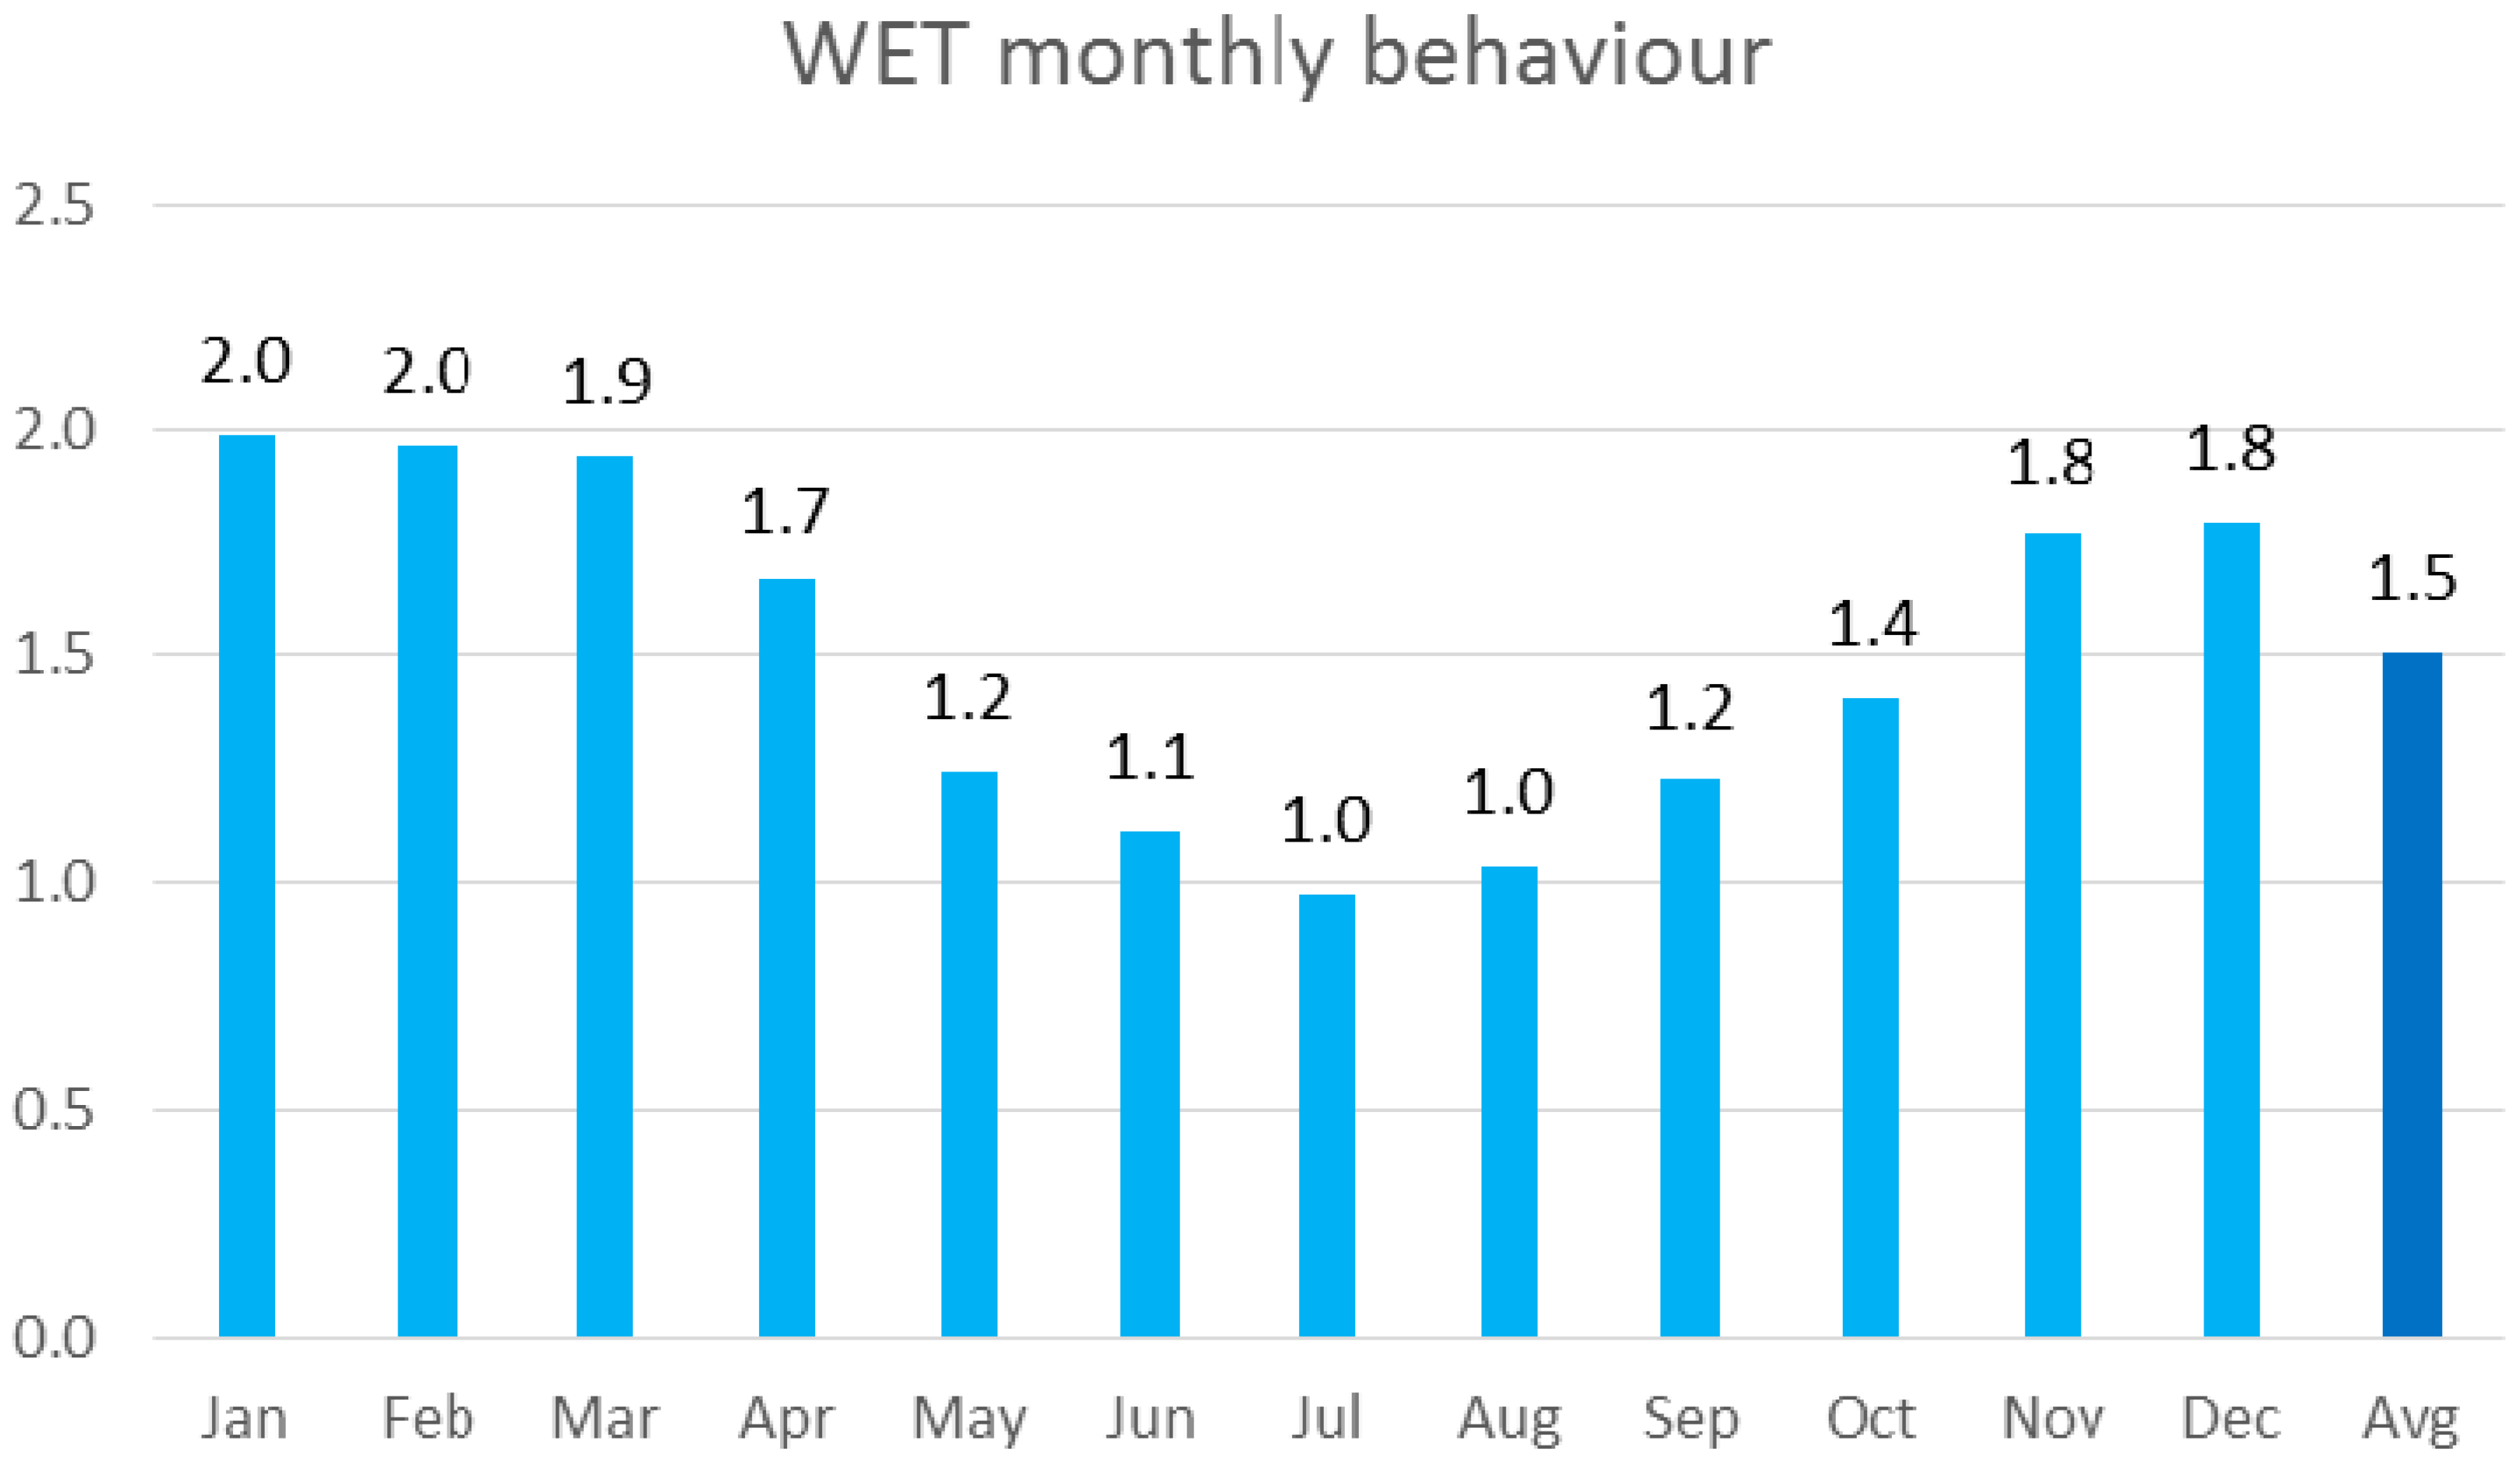
A further calculation of monthly WET was carried out for the machine behaviour in Brisbane’s (Australia) climate, as shown in
Figure 6.
In this case, the average WET value is equal to the one calculated for Nominal conditions 2, this is because Brisbane’s climate is colder, as it can be seen in
Table 11, which reports the statistic average of the last 5 years of weather data coming from Brisbane Airport.
In this last climate, the WET indicator has a higher excursion. Its lower values differ up to 100% from the highest ones and are not represented in the Performance Summary. In this case, the monthly analysis can give a better description of the actual machine performance.
5. Discussions and Further Developments
In the case study, the strong dependence of the AWGs machine energetic performance upon thermodynamic environmental air conditions is confirmed. The authors found that WET can give more in depth information, about an AWG energetic efficiency, in comparison to the most diffused specific energy consumption. This is because WET, on the contrary of what happens for specific energy consumption, defines which terms must be taken into account in energy evaluation and also requires the declaration of thermodynamic air conditions.
Moreover, due to its definition, it is possible to extend its applicability to AWGs based on different technologies (not only reverse cycle) and/or powered by various energetic sources, not only electrical, by means of conversion factors. As already highlighted, the WET indicator increases with the efficiency of the machine because it is a useful effect indicator. For this reason, it is more intuitive for those designers who are already accustomed to COP and EER, as conceptually, WET is in compliance with those indicators.
The authors found in the analysed cases that the WET calculation in the proposed reference conditions can give a more complete idea of the machine behaviour and provide a better evaluation tool than a simple value related to energetic consumption in design conditions. However, when weather conditions have a marked variation during the year, a deeper analysis may be carried out using the monthly WET. In the Brisbane example, a machine with that kind of curve may be more suitable in case of power supply characterised by the same seasonal behaviour, such as photovoltaic, in comparison to a system with the same values in reference conditions but showing a more flat monthly curve.
The Performance Summary can be also integrated with water production at the same conditions. In such a way, a rough description of the AWG machine behaviour can be obtained and a smart choice of its size can be carried out.
The WET expression has been developed in order to obtain an indicator similar and compatible to EER and COP. Such a structure gives the basis for a global index formulation, whose target will be to provide an energy efficiency evaluation index for AWG integrated systems. The term “integrated system”, in the field of AWGs, as said before, identifies those machines, based on a reverse cycle, designed not only to extract water but also to employ the other useful effects of the said cycle [
6]. Such a term can be also expanded to all those systems that are already employed to provide, at the same time, more than one of the useful effects of a reverse cycle; for example, air conditioning with heat recovery that, beside its primary targets, can provide also, as a secondary effect, heating energy for domestic water. The current design approach is useful both for smart cities and buildings, as it is oriented towards the maximum integration to minimise the equipment number and maximise cost and energy effectiveness.
Nowadays, there is not a parameter that can immediately give by means of a single number the higher effectiveness of an integrated machine in comparison to a traditional one, and in particular, no evaluation tool for integrated AWG systems exists. Although indicators are very useful for evaluating a single effect, taken by themselves, they are not enough for a global effectiveness analysis. The global index formulation, which is currently under development, is a mathematical combination of performance indicators that make up the WET, which valorises the integration aspect of a system.
Another aspect that will be deepened further is the water quality. Water coming from air is not pollution free [
24,
25].
The water treatment unit is one of the most important parts of an AWG system. Even if its energy consumption cannot be included in an energy efficiency indicator for the reasons explained before, its effectiveness in terms of pollution removal (quantity and quality) should be evaluated, as it is a critical parameter in an AWG system judgment. In order to provide a dedicated indicator, several parameters should be taken into account. One of them is surely the energy efficiency of the treatment, but others that are still important should include the following: water safeness as a function of its intended final use, water quality in terms of taste, water residual pollution, waste water production related to the process, the suitability of all the involved materials that are intended to be in contact with water, weakness points, and so on. Nowadays, the only means of judging among different machines is to analyse in depth each water treatment unit and water certificates (when available), trying to identify whether there is a contamination hazard for the produced water or not. Such an analysis requires a high knowledge of the problem, and a simplified judgment method based on some score targets would be advisable for a first qualification of different AWG machines.
6. Conclusions
In the current study, an energy efficiency indicator for AWG machines has been proposed. Such a parameter, which is a novelty both in the literature and in technical practice, is indicated as WET (Water Energy Transformation), has been formulated with the same approach of EER and COP, and has been designed in order to be applied for AWG machines comparison. Moreover, its concept was developed expressly to overcome issues that affect the only existing evaluation parameter, a sort of specific energy consumption (SEC). Such a parameter is used in technical praxis but has never been formalized, and it is affected by a lack of any standardisation for its calculation and inhomogeneity in measurement units.
On the basis of research among more than one hundred existing AWG machines, the proposal of a set of unified nominal and extreme conditions is presented for WET calculation to obtain comparable results. The indicator was applied to an existing outdoor AWG machine, and results were arranged in a Performance Summary. Moreover monthly WET results for two different climates, were presented.
Finally, WET formulation, expressly designed to be compatible with COP and EER, is the first part a wider research aimed to propose a global index studied for integrated machine energy efficiency evaluation, that combines all the energy efficiency indicators involved in such a type of machine.


