Article

Design of a Wireless Charging System for Online Battery Spectroscopy

1
Department of Industrial Engineering, University of Florence, 50139 Florence, Italy
2
Department of Information Engineering, University of Florence, 50139 Florence, Italy
3
Department of Energy, Systems, Territory and Constructions Engineering, University of Pisa, 56122 Pisa, Italy
*
Author to whom correspondence should be addressed.
Energies 2021, 14(1), 218; https://doi.org/10.3390/en14010218
Submission received: 13 November 2020 / Revised: 24 December 2020 / Accepted: 28 December 2020 / Published: 4 January 2021
(This article belongs to the Special Issue Lithium Batteries for Vehicular Applications)

Abstract

:
This paper presents the design procedure of an electric circuit that can perform the battery state diagnosis and, simultaneously, provide its charging. A fast and embedded impedance measurement method is also proposed; this is based on a broadband current signal excitation on the battery during the constant current charging phase. The proposed solution performs the electrochemical impedance spectroscopy (EIS), which is known to provide useful information about battery chemical–physical property changes due to aging or failure events. To demonstrate the functionalities of the proposed method, the spectroscopy is implemented in the control in the wireless charging system. An EIS charging test is simulated on an equivalent circuit model, which emulates the battery impedance properties in a specified frequency band. Circuit parameters are evaluated by experimental data. According to the obtained results, the proposed method allows us to reach an accurate estimation of the battery state and represents a promising solution for an embedded diagnostic of battery health thanks to its simplicity and speed.

1. Introduction

The evolution of electric vehicles (EVs) leads to the large-scale production of automotive batteries. Batteries represent the main cause of pollution for electric vehicles. For this reason, several studies have been proposed to increase their environmental sustainability. These studies have two aims:
  • Increase the battery’s average life;
  • Introduce innovative solutions increasing the EV autonomy and reducing the battery number on board.
Several efforts have been performed by industries to develop battery technologies guaranteeing an increasing number of charging/discharging cycles. Nowadays, Li-Ion batteries are representing the most used and promising technology; thanks to their high energy density and increased power per mass, they allow for reduced weights and dimensions at competitive prices [1,2,3]. According to [1], the limit of $100/kWh will be reached by 2025–2030 for several Li-Ion batteries. Hence, due to high energy and power densities and acceptable costs, Li-Ion batteries are favored as an energy storage system for several applications. On the other hand, lithium batteries are very sensitive to temperature and working conditions, i.e., overcharging or deep discharging. For this reason, the employment of the Battery Management System (BMS) plays a key role to extend the battery life by managing each cell to avoid the operation outside the safe conditions. Recent BMS architectures monitor the battery voltage, current, and surface temperature to evaluate some performance indicators. The most important are as follows:
  • State of Charge (SOC): the battery level of charge relative to its capacity. The units of SOC are percentage points (0% = empty; 100% = full).
  • State of Life (SOL): the battery performance degradation over time, due to the normal charging–discharging operating conditions, by observing a modification in battery capacity or internal resistance.
  • State of Health (SOH): the battery performance degradation after failure or unexpected events, i.e., the exceeding of peak current, overcharge, etc.
Monitoring battery SOH is the key factor to ensure safety and prolong the lifetime of the battery. The development of improved methods for SOH diagnosis and their implementation in real-time systems is still one of the main research topics in the automotive battery field. Generally, different approaches for SOH estimation are proposed in the literature, such as model-based estimators [4,5,6,7] or data-driven methods [8,9,10]. Despite these methods showing a good SOH accuracy, model-based estimators require high computational efforts, and data-driven methods require an immense amount of data history. Moreover, these methods present a limited physical meaning. To overcome these limitations, electrochemical impedance spectroscopy (EIS) methods have been investigated. They provide detailed information about the battery chemical–physical changes due to aging or unexpected events. Recent studies have demonstrated that some aging phenomena, such as internal resistance increment or the increment of charge transfer and solid electrolyte interphase resistance can be easily correlated with SOH through EIS tests [11,12,13,14]. Nevertheless, these experimental results were obtained by using expensive facilities and long-time test procedures. Rapid and real-time EIS methods have been proposed in the last years: [15,16,17,18,19,20,21,22,23,24,25,26] propose the identification of battery impedance in a defined frequency band through broadband current signal excitation. Periodic broadband signals exhibit a lower crest factor [27]. In this way, accurate impedance measurement can be acquired with low energy consumptions. One of the most popular broadband signals used in EIS is the multi-sine signal. This signal consists of a sum of several simultaneously generated sinusoids at frequencies corresponding to the desired discrete set of frequency measured, with random phases. Well-designed multi-sine excitation signals, as proposed in [15,16], offer accurate impedance measurements in a specified frequency band and various advantages in the detection of non-linear behavior [17]. Pseudo-random sequence (PRS) signals are attractive alternatives, due to their low complexity, short measurement times, and good accuracy. The PRSs are periodical and switch between two or three logic levels, so simple hardware is required for their implementation. A new PRS signal based on a ternary sequence has been defined in [18]. Details about the two-logic PRS, the so-called pseudo-random binary sequences (PRBS), are provided in [19]. The EIS measurement accuracy comparing PRBS with other broadband signals has been evaluated in [20]. PRBS has been used for tracking EIS in a large time horizon in [21]. PRBS has been implemented and generated by a motor controller in [22], and it has been embedded in a battery charging system in [23]. Despite the multi-sine signal being able to provide more accurate EIS measurements, the PRBS is implemented with simpler hardware, as demonstrated in [25].
Dynamic wireless charging represents one of the most promising solutions able to reduce the number of batteries required to guarantee sufficient autonomy. This paper proposes a system that is able to wirelessly charge the electric vehicle and simultaneously carry out the spectroscopy of the batteries suitable to fulfill both the above-mentioned aims.
The paper’s main contribution is the implementation of an EIS test for battery impedance monitoring, characterized by the PRBS excitation technique on-board a wireless charging system for electric and hybrid vehicles.
The paper is structured as follows. Section 2 describes the wireless charging system infrastructure, focusing the attention on the secondary side circuit, which is fundamental to guarantee a reliable and accurate battery impedance identification. Section 3 describes the proposed EIS technique, including requirements, indicators, and excitation signal characteristics. Section 4 describes the design of a closed-loop control system in the secondary circuit to perform an EIS test and simultaneously charge the battery. The simulation results of the proposed method are discussed in Section 5. The obtained results are discussed in the Section 6.

2. Wireless Power Transfer Architecture

The circuit topology of the proposed wireless charging system is shown in Figure 1a.
The system is supplied by a DC voltage V i . The inverter circuit at the primary stage generates a square waveform v s at a frequency f 0 with amplitude V i . The voltage waveform is delivered to the primary side resonant tank, which is made up of a resonant capacitor C1 and the primary inductor L1. The First Harmonic Analysis (FHA) is used; thus, only the first harmonic of the square voltage v s is considered, while high-order harmonics are neglected. This assumption is acceptable because the resonant tank quality factor is assumed to sufficiently high, e.g., Q > 5. Hence, the resonant tank on the primary side is assumed to be supplied with a sinusoidal voltage v 1 , which represents the first harmonic of the voltage v s . The Root Mean Square (RMS) value of the first harmonic voltage is V1. As a result, a sinusoidal current with an RMS value I 2 is induced on the secondary side. This current is regulated through a Full Active Rectifier (FAR), producing a current I rect , which is then filtered through an inductive-capacitive filter configuration (CLC) to supply the battery with a constant current I 0 . An output impedance Zo is used to model the EV’s battery.
The design criteria of the proposed circuit are derived by the investigation of a circuit with a Series-Series (SS) compensation. As shown in Figure 1b, the primary inverter is reduced to a sinusoidal voltage source V 1 while the FAR is approximated by a load resistance R L . By analyzing the circuit with the Kirchhoff’s voltage laws (KVL), a matrix formulation is extracted as follows
[ V 1 0 ] = [ R 1 + j ( ω L 1 1 ω C 1 ) j ω M j ω M R L + R 2 + j ( ω L 2 1 ω C 2 ) ] [ I 1 I 2 ]
where I 1 and I 2 are the RMS primary and secondary currents, respectively.
The expressions of the currents on the primary and secondary side are derived as follows by the inversion of Equation (1)
I 1 = R L + R 2 + j ( ω L 1 1 ω C 1 ) [ R 1 + j ( ω L 1 1 ω C 1 ) ] [ R L + R 2 + j ( ω L 2 1 ω C 2 ) ] + ω 2 M 2 V 1
I 2 = j ω M [ R 1 + j ( ω L 1 1 ω C 1 ) ] [ R L + R 2 + j ( ω L 2 1 ω C 2 ) ] + ω 2 M 2 V 1 .
To operate in resonance at a particular angular frequency ω 0 , the capacitances C 1 and C 2 are tuned according to:
C 1 = 1 ω 0 2 L 1 ,   C 2 = 1 ω 0 2 L 2 .
Thus, the efficiency and the output power of a system operated at the resonance, e.g., ω = ω 0 , are:
η = R L R L + R 2 + R 1 ω 2 M 2 ( R 2 + R L ) 2
P o = R L | I 2 | 2 = R L ( V 1 ω M R 1 ( R 2 + R L ) + ω 2 M 2 )
respectively. When the system operates in resonance and the parasitic resistance are neglected, the SS compensation acts as a current source, the current on the secondary side is independent from the load, and Equation (3) reduces to
I 2 V 1 ω M .
The previous equations have been used to design the system according to the SAE J2954 standard, which requires the switching frequency to be in the 81.39–90 kHz range. Therefore, an operating frequency f = 85 kHz has been chosen. The proposed system fulfills the Standard requirements for the WPT1 class and has a nominal output power Po = 3.7 kW. Starting from the values of the self-inductance L1 and L2, which are derived by the primary and secondary side coil design, the resonant capacitance C1 and C2 have been calculated using Equation (4). The system data are summarized in Table 1.

Design of the Filter Rectifier

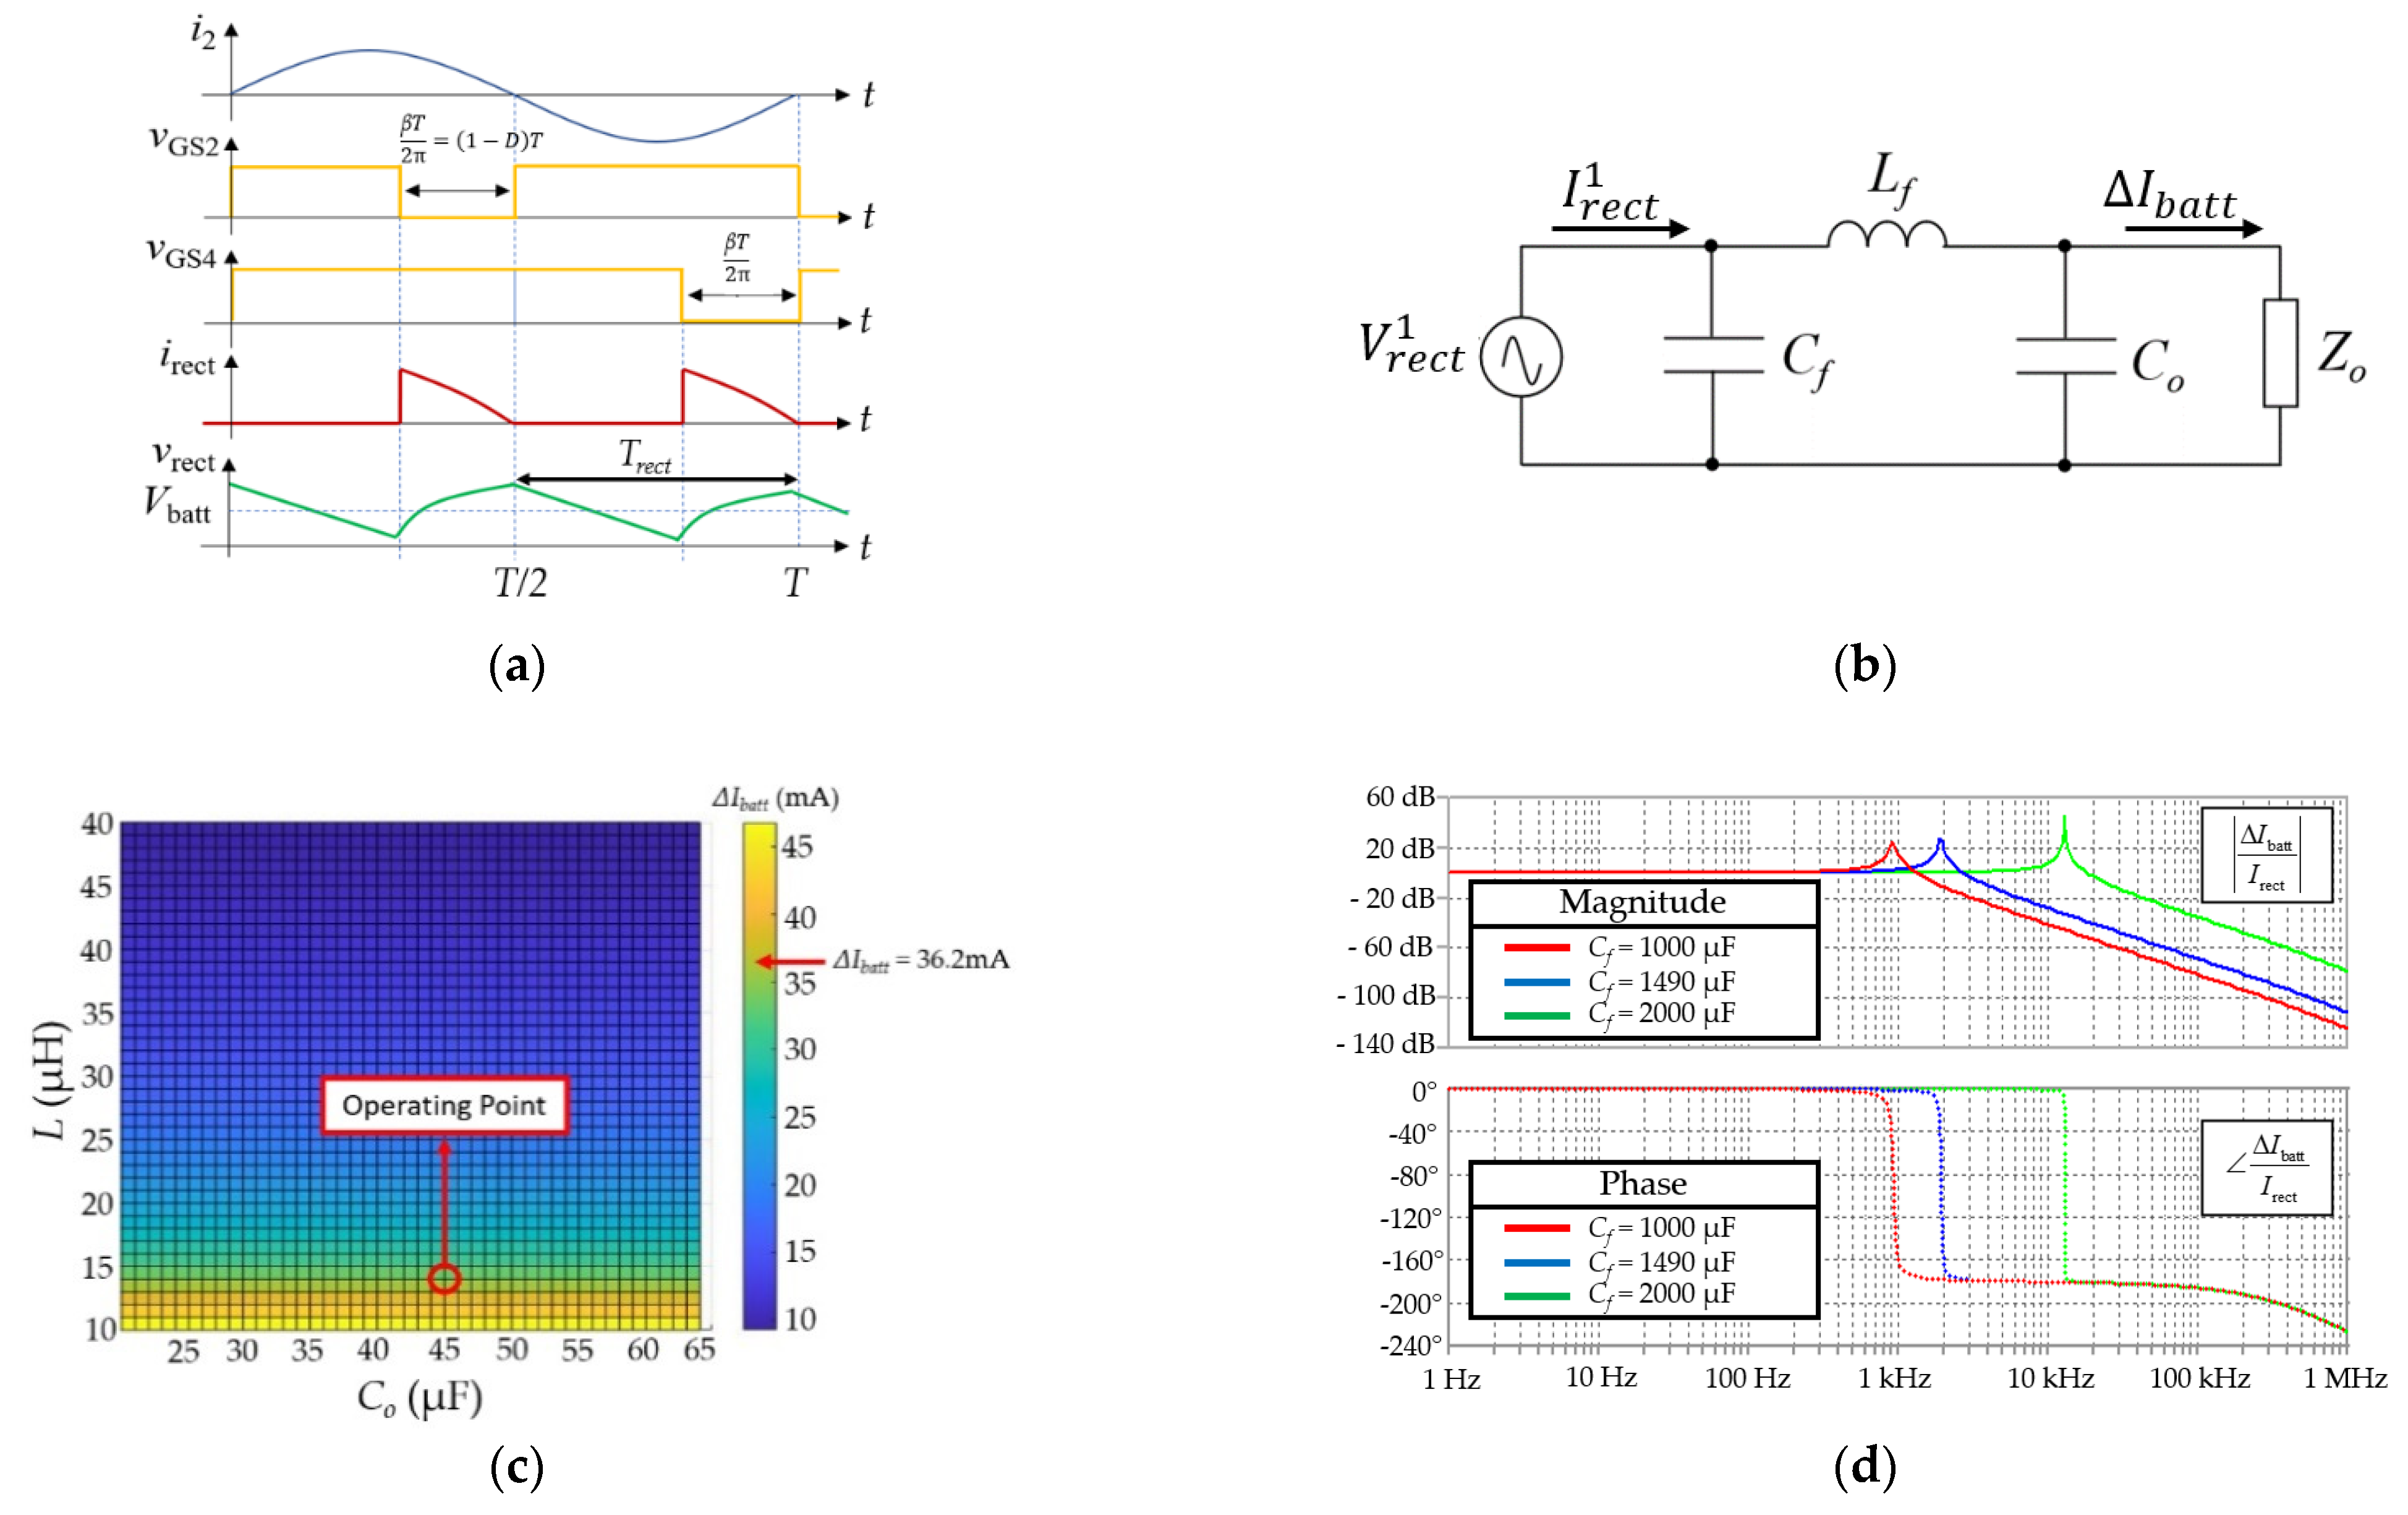
The current induced on the secondary coil i 2 is sinusoidal with the zero average value, as shown in Figure 2a. Using an appropriate control strategy, the MOSFETs can be switched to generate a current with an average value I rect ≠ 0. Then, this current must be filtered to supply the battery with a DC current Io. Thus, the aims of the filter are to:
  • Reduce the ripple of the output current Io;
  • Ensure a specific bandwidth BW to the output current io to properly perform the spectroscopy to the battery. The PRBS signals have a harmonic contribution that can reach up to some kHz. Therefore, a certain band must be guaranteed.
As shown in Figure 2a, the average current I rect is regulated, changing the control angle β to the gate-to-source MOSFETs driving signals v GS , 2 and v GS , 4 (the control signals v GS , 1 and v GS , 3 are 180° phase-shifted to avoid short circuits). Then, filtering irect through the π filter, the DC current delivered to the battery is:
I o = 2 I 2 π [ 1 cos ( 2 π β ) ] .
As shown in Figure 2a, the output voltage v rect has a period T rect = T / 2 . Studying its Fast Fourier Transform (FFT), it can be seen that the main frequency components are the DC component, which is equal to the battery voltage, and its first harmonic, at f rect = 2 f . The filter shown in Figure 2b must be designed to limit the battery current ripple i 0 . The voltage source V r e c t 1 represents the first harmonic of voltage v rect , it is a sinusoidal and has a frequency f rect . The output current represents the battery current ripple, which can be calculated according to [26]:
Δ I batt = V 1 ( Z C 0 Z L Z C 0 + Z batt ( Z L + Z C 0 ) ) .
The π filter transfer function of the circuit in Figure 2b is:
Δ I batt I rect = 1 1 + s Z 0 ( C 0 + C f ) + s 2 L f C f + s 3 L C f C 0 Z 0 .
In π filters, the major capacitance filtering action is accomplished by the input capacitor Cf. The residual AC ripple is filtered by the output capacitor Co.
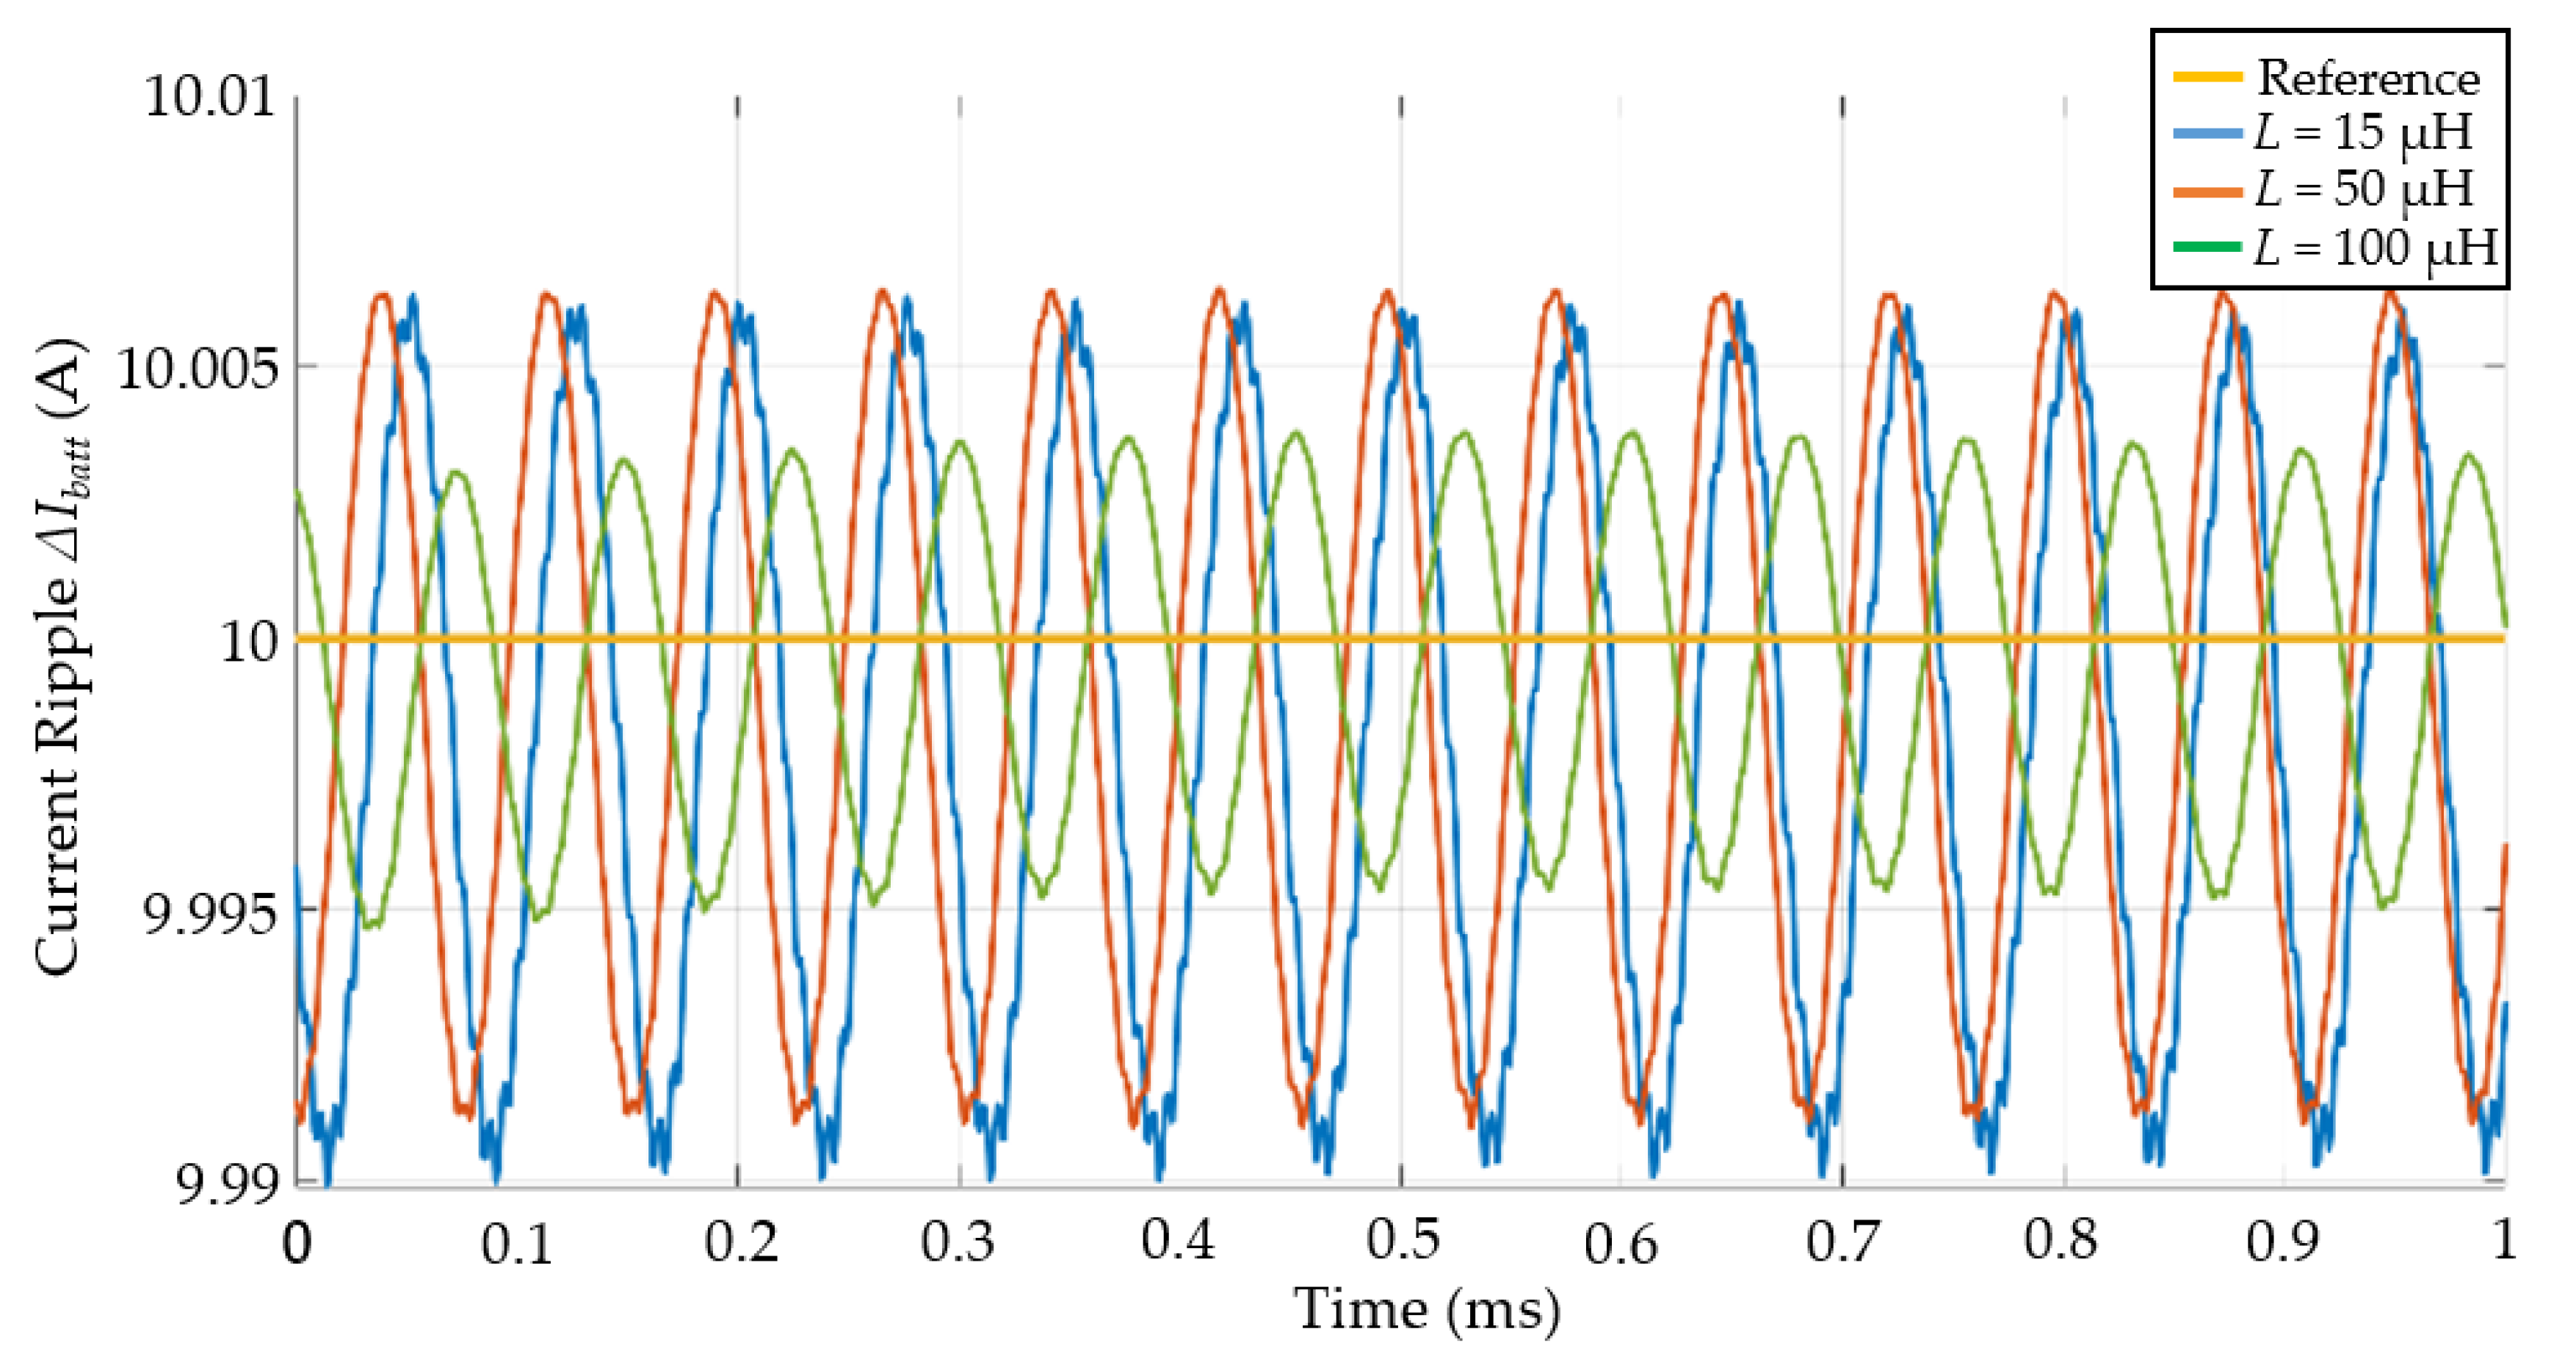
Being the current ripple mainly reduced from the inductance Lf, an output capacitance Co = 45 µF and an inductance Lf = 15 µH are chosen as a good compromise between the current ripple (ΔIbatt = 36.2 mA) and inductor size. The effect of capacitance Cf on the current transfer function is analyzed in Figure 2d. To perform the spectroscopy, it is necessary to inject a current signal with a frequency up to 500 Hz; therefore, a passband BW = 1 kHz has been chosen. In Figure 2d, the transfer function, shown in Equation (10), is computed by using LTspice for three different values of Cf. To guarantee a bandwidth BW = 1kHz, a capacitor Cf = 1490 µF has been chosen.

3. Electrochemical Impedance Spectroscopy

3.1. Theory

The EIS test may be considered as a form of nonparametric system identification. This technique lets us identify dynamic models of the system without an “a priori model” definition. The battery impedance Z o in the frequency domain is estimated by exciting the battery with charging/discharging current signals I o and measuring the voltage response V o as follows:
Z o ( j ω ) = V o ( j ω ) I o ( j ω ) .
To analyze the battery impedance, the device under test must be considered as linear and time-invariant. To avoid a non-linear response, the amplitude of the excitation signal must not be too large. On the other hand, too small amplitudes lead to a small value of the Signal to Noise Ratio (SNR). Hence, the input excitation signal must be properly selected.
The time-invariant property is assumed because the battery response to an input excitation does not change with time. The main causes for variation in time of the battery are the temperature variations [28], SOC [29], current excitations (in terms of amplitude and sign [30]), and, finally, aging [31]. Hence, to ensure accurate impedance measurements, the influence factors, such as temperature, must not change during the EIS test.
If the Linear Time-Invariant (LTI) assumptions are validated, the battery impedance Zo is derived from its impulse z o [ n ] response by using the Discrete Fourier Transform (DFT) in the discrete-time horizon [ 0 , N 1 ] :
Z o ( k ) = n = 0 N 1 z o [ n ] e j 2 π k n
where variable k [ 1 / 2 , 1 / 2 ] denotes the normalized frequency. In this work, the LTI system is considered as a stable Bounded-Input to Bounded-Output (BIBO), and the input signal is periodic deterministic or generated by a stationary stochastic process [32]. If the last assumptions are validated, the impedance of the battery is estimated by:
Z o ( k ) = Φ v i ( k ) Φ i i ( k )
where Φ i i ( k ) is the input current Power Spectral Density (PSD) at a frequency k, and Φ v i ( k ) is the cross-PSD between the voltage and current. Equation (13) gives the frequency-domain input-to-output relationship for the LTI system and is the foundation of the nonparametric identification of the systems. In the case of the battery system, input-to-output corresponds to the current–voltage observed on the battery; hence, the transfer function, shown in Equation (13), corresponds to the impedance. By considering the normalization factor a and the complex conjugation *, the two overcited PSDs are calculated referring to the DFT employed to battery current I o ( k ) and voltage V o ( k ) DFTs:
Φ i i ( k ) = a I o ( k ) I o ( k ) Φ v v ( k ) = a V o ( k ) V o ( k )   . Φ v i ( k ) = a V o ( k ) I o ( k )

3.2. Excitation Input Signal: Pseudo-Random Binary Sequence

Broadband signals are usually used in the EIS test [19,20] to achieve a short measurement time. In particular, the Pseudo-Random Binary Sequence (PRBS) signal requires simpler hardware than multi-sine or other broadband signals. The time-discrete equation of the PRBS signal is:
u t = rem ( a 1 u t 1 + + a m u t m , 2 )
where rem ( x ,   2 ) is the modulo-2 addition on x , and a i is the i-gain factor that takes integer values {0,1}, for i = 1 , , m . Thus, the PRBS output u t is a square signal. As shown in [27], the PRBS returns a periodic signal with a maximum length M = 2 m 1 , using an appropriate combination of gain factors [ a 1 , a 2 , , a m ]. In the frequency domain, the PRBS has similar properties to those of a white noise signal. This is a clear advantage, since it is possible to excite the system over a wide frequency band, accelerating the testing procedures. The spectrum of the PRBS signal with amplitude U is [27]:
Φ u u ( ω ) = U 2 π M k = 1 M 1 δ ( ω 2 π k M ) , 0 ω < 2 π
where δ is the Dirac delta function. Equation (16) shows that increasing the number of m-gain factors, the number of the excited M = 2 m 1 harmonics in the frequency band [ ω , ω ] is also increased. Therefore, PRBS results in a flatter PSD when the number of gain factors increases. In this work, a PRBS with period M = 1023 ,   m = 10 and a clock frequency f c = 500 Hz is used. In [33], it is demonstrated that the PRBS presents an almost flat spectrum over the frequency band [ f c / m , f c ]: in the case of m = 10 , it is over one frequency decade. Nevertheless, in real applications, it is possible to decrease PSD in the harmonics near the maximum frequency. The guideline to properly select the bandwidth given in [33], where a B W ~ 0.45 f c is recommended.

3.3. Nonparametric Identification Algorithm

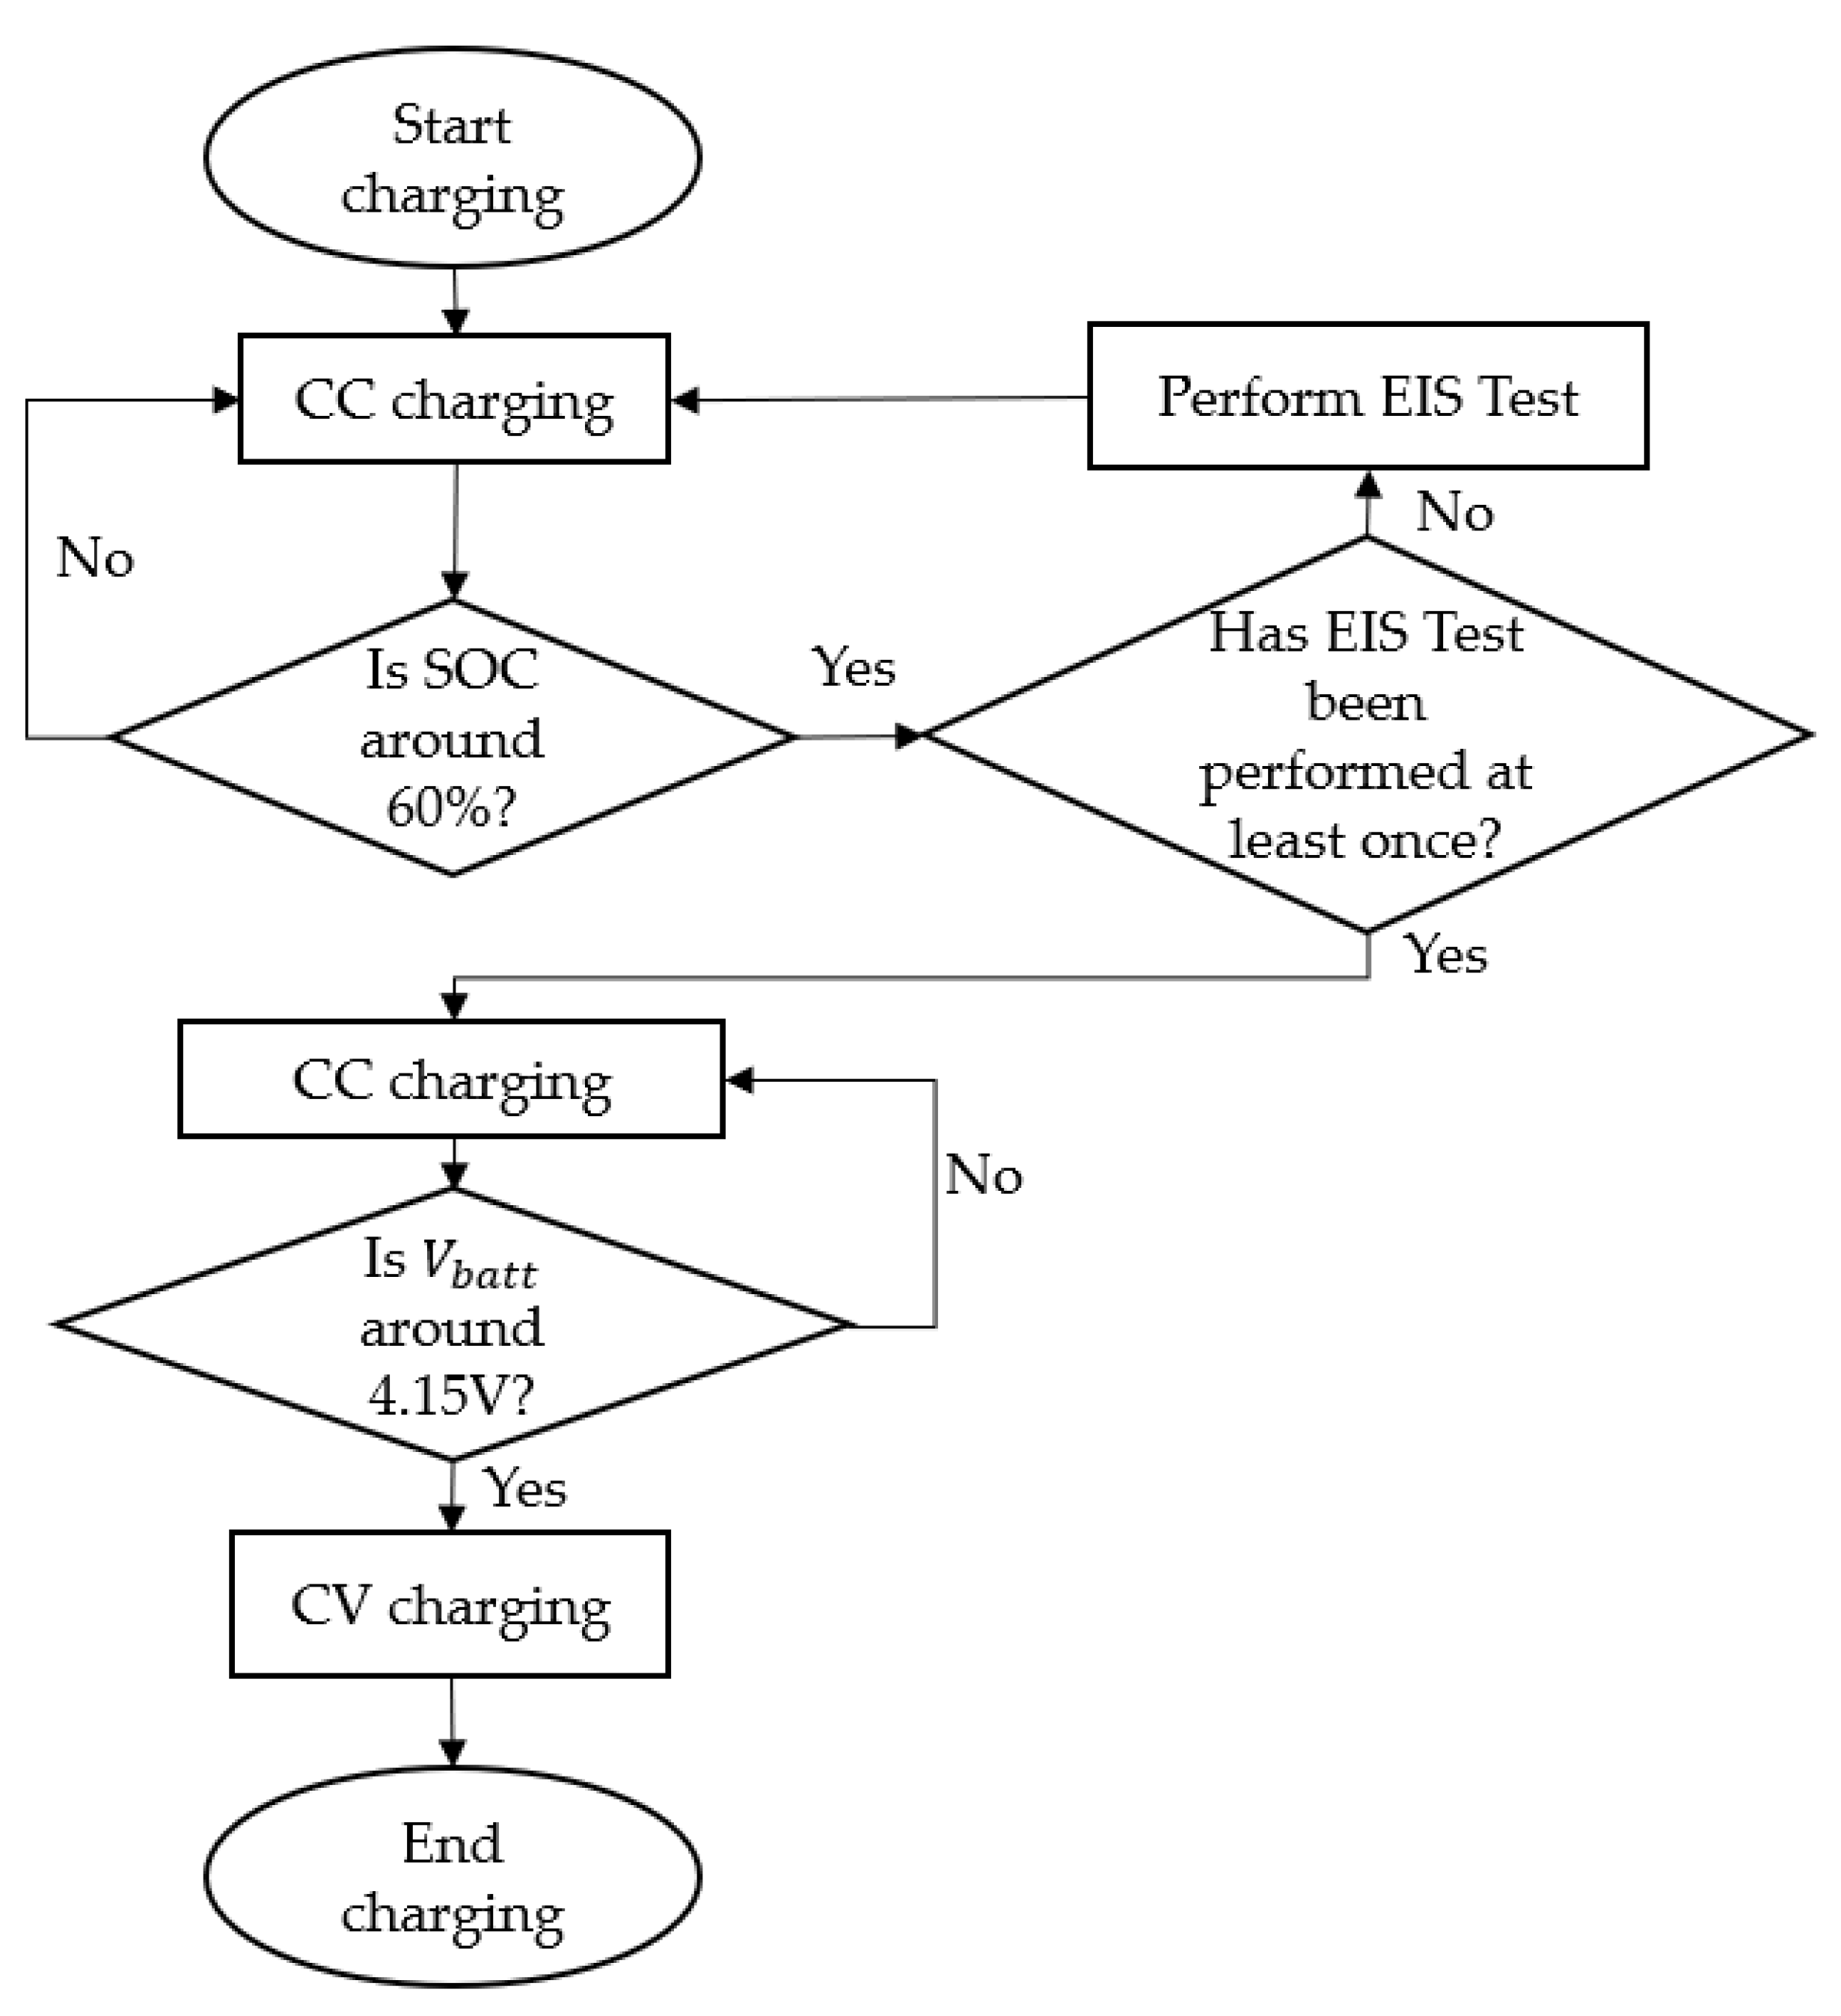
The proposed algorithm to perform battery identification is described in Figure 3 and Figure 4. The battery under test absorbs the continuous current I 0 provided by the wireless charging system shown in Figure 1. Then, the EIS test is performed in the time interval [ t start , t end ], using a PRBS current with two different charging levels [ I 0 I PRBS , I 0 ] and with a clock frequency f c . The time interval of the test depends on the chosen clock frequency, and it is recommended to repeat the PRBS signal for at least 20 periods. Considering the PRBS signal with M = 1023 samples and a clock frequency f c = 500 Hz, the time test duration chosen for the EIS test is 60 s. During the test, the battery voltage and current are measured with a sampling frequency f s = 20 kHz. When the test is completed, the voltage and the current measurements are split into L w frames. Then, windowed-DFTs Φ i i , w , p , Φ v i , w , p , Φ v v , w , p are applied for each current and voltage measurement frame p , according to Equation (12). The PSD and Cross Power Spectral Density (CPSD) are calculated according to Equation (14).
Finally, the mean PSD and CPSD are calculated according to:
Φ i i ( k ) = a L w p = 1 L w Φ i i , w , p ( k ) Φ v v ( k ) = a L w p = 1 L w Φ v v , w , p ( k )   . Φ v i ( k ) = a L w p = 1 L w Φ v i , w , p ( k )
Hence, impedance is estimated according to (13). To evaluate the accuracy of the impedance measurements, the ordinary coherence γ v i 2 is calculated as follows:
γ v i 2 ( k ) = | Φ v i ( k ) | 2 Φ i i ( k ) Φ v v ( k ) .
The ordinary coherence is defined in the interval [0,1]. Ordinary coherence analyzes the relation between input/output of a dynamic system: if the input-output (I/O) relationship is linear, the ordinary coherence γ v i 2 = 1 . If the relation is completely non-linear, γ v i 2 = 0 . Finally, a coherence result is greater than zero but less than one if the system has a partially linear I/O relation or if the acquired measurements are noisy. Indeed, the output noise PSD Φ m m is related to coherence in [33] and evaluated according to:
Φ m m ( k ) = ( 1 γ v i 2 ( k ) ) Φ v v ( k ) .
Equation (19) can be interpreted as follows: when γ v i 2 1 , the system is considered as LTI. Moreover, output noise is negligible with respect to the original output signal. Φ m m increases its value when the ordinary coherence decreases; hence, the output noise affects the original output signal. In this case, the system under test cannot be considered as LTI.

4. Electrochemical Impedance Spectroscopy Test and Simultaneous Wireless Charging

4.1. Modeling of the Secondary Side Transfer Function

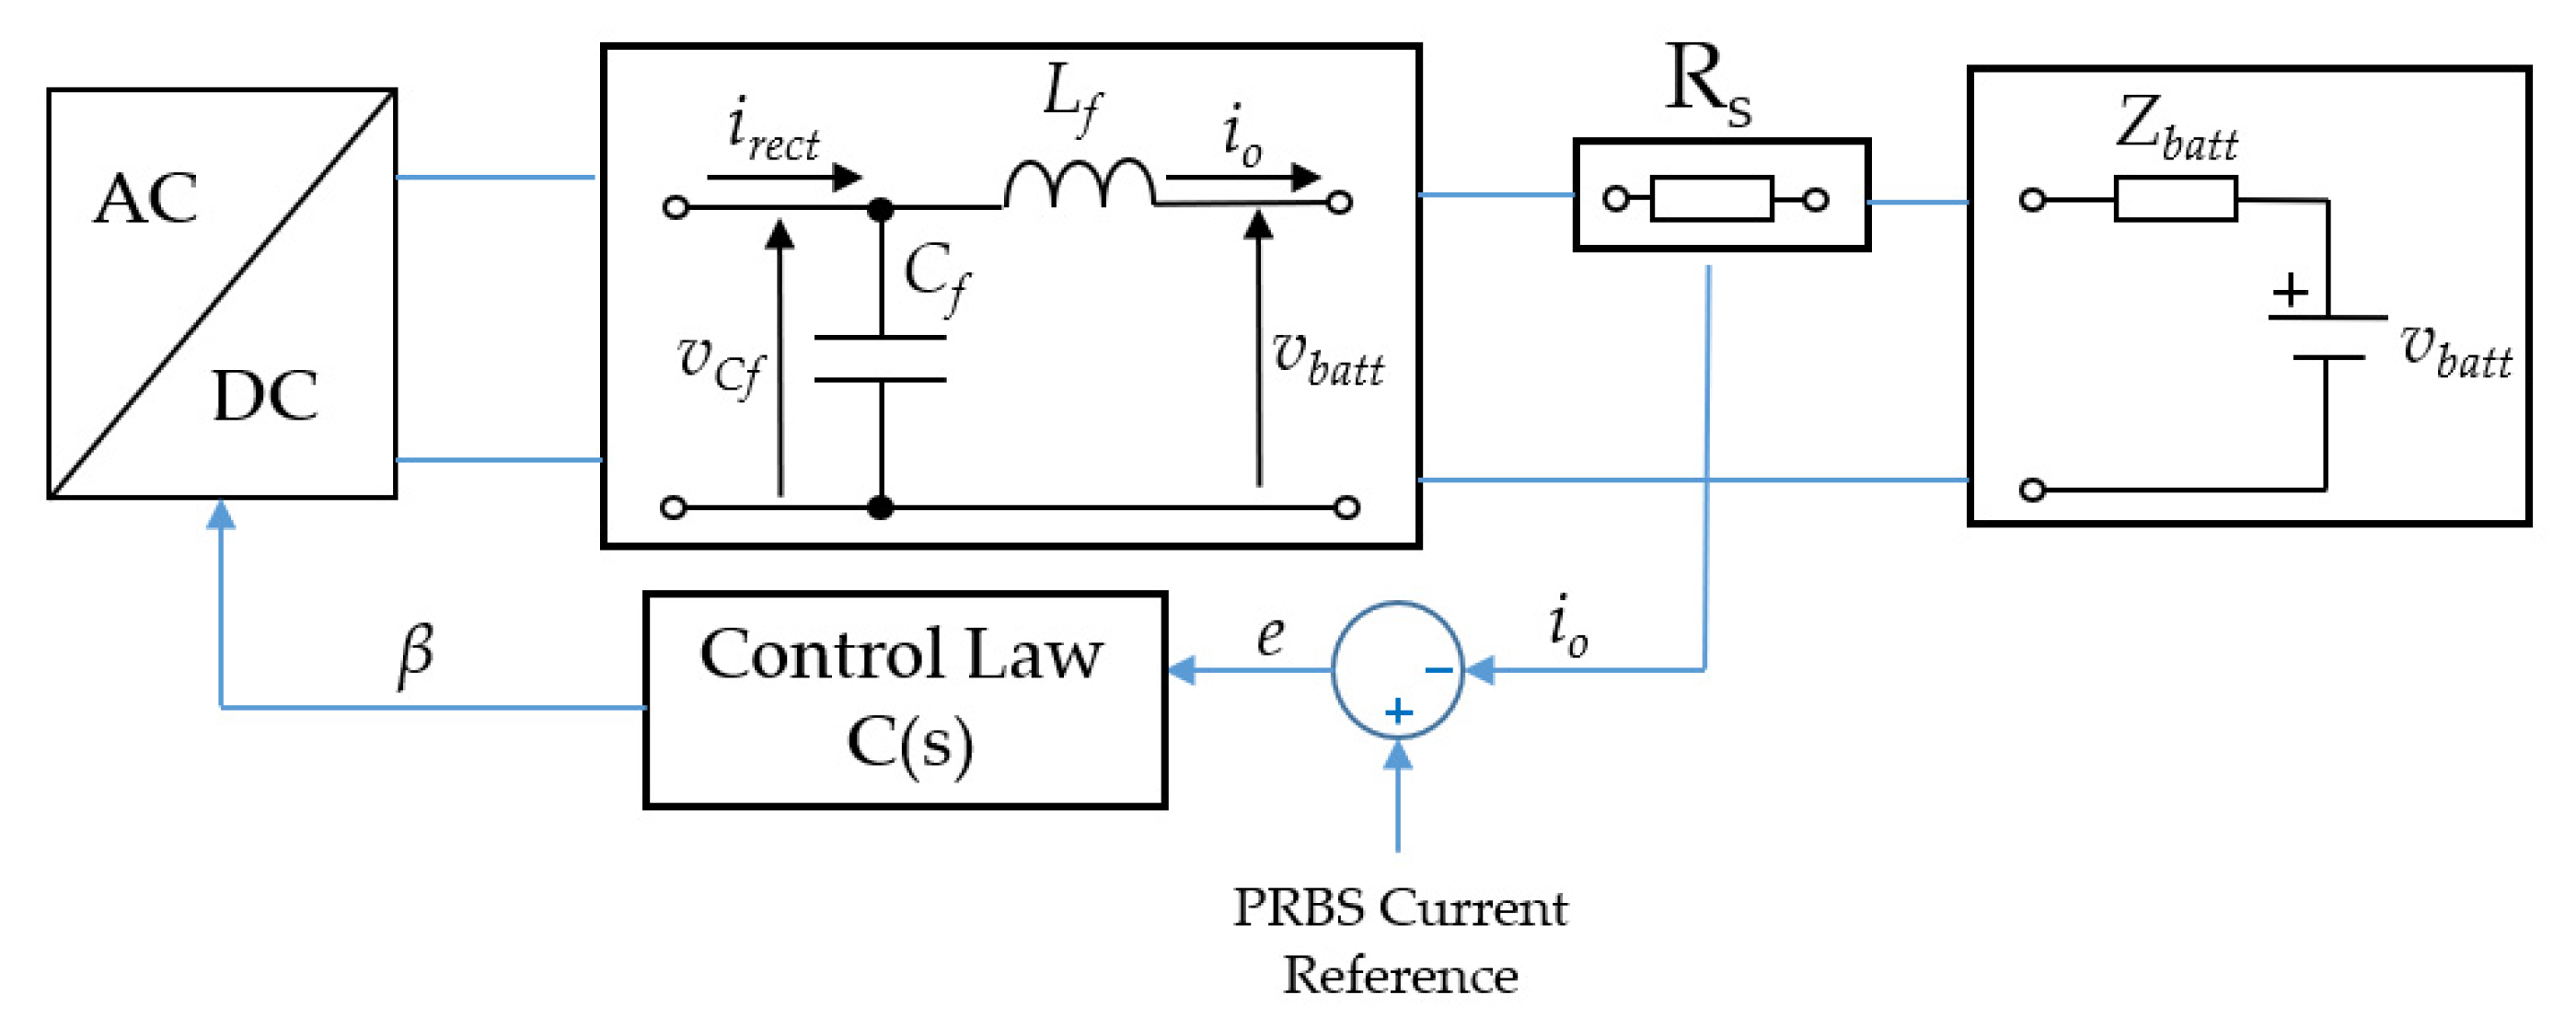
The scheme of the secondary side control strategy adopted in this work is shown in Figure 5.
The designed control system drives the four MOSFETs of the FAR to produce the desired output charging current Io. The CLC filter is placed between the active rectifier and the charging battery. The capacitor Co, shown in Figure 2a and placed in parallel with the battery, is neglected in this analysis. To design the control system represented in Figure 5, a mathematical model of the secondary circuit is needed. The Kirchhoff’s equations of the CLC filter are:
{ L f d i 0 d t = v c f i 0 R s v batt C f d v c f d t = i rect i o
where the variable i 0 denotes the output current of the active rectifier, as measured by the shunt resistor R S . As shown in Figure 2a, the output current i0 is equal to the secondary current i2 during the interval [ T 2 β T 2 π , T 2 ] , while it is zero during the interval [ 0 , T 2 β T 2 π ] . Defining D = 1 β 2 π , the time-averaged state-space equation of the filter can be written as:
{ L f d I 0 d t = v c f I 0 R s v batt C f d v c f d t = 2 T 0 ( 1 D ) T I rect ( τ ) d τ I 0 .
Managing the previous equations, one gets:
L f d I 0 d t = [ 0 T / 2 1 C f [ 2 T [ 0 T ( I rect ( τ ) d τ ) 0 D T ( I rect ( τ ) d τ ) ] I 0 ] d t ] I 0 R s v batt .
Introducing a small perturbation on the duty cycle ( Δ D ) , it is possible to determine the resulting perturbation of the charging current to the battery Δ I 0 . Hence, by separating the DC components to the small perturbations, the model can be linearized as follows:
L f d Δ I 0 d t = [ 0 T / 2 1 C f [ 2 Δ D I rect , peak Δ I 0 ] d t ] Δ I 0 R s .
The variable I rect , peak denotes the fastest response of the secondary circuit, that is, small variations of the duty cycle cause large perturbations of the active rectifier’s output current. Applying the Laplace transform to Equation (23), the transfer function from duty cycle D -to-charging current I 0 becomes:
G ( s ) = I 0 ( s ) D ( s ) = 2 I rect , peak s 2 L f C f + s R s C f + 1 .

4.2. Control Loop Design

The general closed-loop control system proposed in this work is depicted in Figure 5. The control transfer function C ( s ) is determined by using the direct synthesis method for controller design [34]. In this work, a second-order closed-loop transfer function desired W ( s ) is selected as:
W ( s ) = ω n 2 s 2 + s ( 2 ξ ω n ) + ω n 2
where ξ and ω n denote the damping factor and the natural angular frequency, respectively.
The specifications to design W ( s ) are the following:
  • The closed-loop system is asymptotically stable.
  • The steady-state error to a step input is zero.
  • The overshoot must be S S max .
The bandwidth is ω b . The overshoot and the bandwidth are given by the following relations:
S = e ( π ξ / ( 1 ξ 2 ) ) ω b = ω n 1 2 ξ 2 + 2 + 4 ξ 4 4 ξ 2   .
Once ξ and ω n are assigned, W ( s ) is defined, and, by using Equation (24) C ( s ) is
C ( s ) = 1 G ( s ) W ( s ) 1 W ( s ) = ω n 2 2 I rect , peak s 2 ( L f C f ) + s ( R s C f ) + 1 s ( s + 2 ξ ω n ) .
To implement the control algorithm in a digital controller, the time-continuous transfer function, shown in Equation (27), is transformed in time-discrete, in the Zeta-domain ( z ), by using the bilinear transform:
[ C ( s ) ] s = 2 T c ( z 1 ) ( z + 1 ) = C ( z ) = a 0 , z + a 1 , z z 1 + a 2 z 2 1 + b 1 , z z 1 + b 2 z 2
a 0 , z = ω n 2 2 K 0 4 L f C f + 2 R s C f T c + T c 2 2 ( 1 + ξ ω n T c ) a 1 , z = ω n 2 2 K 0 T c 2 4 L f C f 1 + ξ ω n T c a 2 , z = ω n 2 2 K 0 4 L f C f 2 R s C f T c + T c 2 2 ( 1 + ξ ω n T c ) b 1 , z = 2 1 + ξ ω n T c b 2 , z = 1 ξ ω n T c 1 + ξ ω n T c
where T c is the sampling time of the digital controller. In this paper, the digital controller works at a fc = 5 kHz sampling frequency. The digital controller designed satisfies the specifications imposed for the closed-loop system: it minimizes the comparison error e k between the reference and measured current by driving the MOSFETs with the appropriate duty cycle D k . By applying the Zeta anti‑transform, the time-discrete control law is obtained as
D k = a 0 z e k + a 1 z e k 1 + a 2 z e k 2 b 1 z D k 1 b 2 z D k 2 .
The parameters of the simulation control loop and secondary circuit are shown in Table 2.

4.3. Battery Modeling

The electrochemical properties of the battery can be analyzed by exploiting the impedance measurements of the battery, which are usually described by Nyquist diagrams. From experimental impedance data, it is possible to identify an equivalent circuit model. Randles circuit models [35] are usually used to reproduce similar impedance curves. Randles circuit’s configurations are made up of resistances, inductances, and capacitances. Indeed, for an accurate and meaningful reproduction of simulated EIS data, ideal capacitances are replaced by the so-called Constant Phase Elements (CPEs). A circuit composed of a CPE, in parallel with a resistance, has the property to describe semi-ellipses arcs in the Nyquist diagram. A semi-elliptic curve in the Nyquist diagram represents the frequency response of a typical double-layer imperfect capacitance in electrochemical systems [36]. Nevertheless, the simulation of the voltage behavior of CPE shows very high computational efforts, as proven in [37]. Hence, in this work, the R-CPE circuit is replaced by an N-RC group, as shown in Figure 6. Circuit parameters are identified by EIS results, which have been obtained in [38]. The battery cell under test was a Li-Ion Nickel Manganese Cobalt (NMC) Cathode pouch cell type, with a nominal capacity of 20 Ah and a nominal voltage of 3.65 V [39].
The scheme of the laboratory EIS test setup is depicted in Figure 7: as mentioned, the testing procedure consists of exciting the battery in current with the discharging PRBS signal at a clock frequency 500 Hz and current levels (0,6) A.
The low-cost programmable PRBS generator, discussed in [25], is used as an excitation input. Battery voltage and current are measured and acquired by using the DSpace MicroLabBox with a 20 kHz measurement sampling frequency. EIS test is performed on the NMC cells at different states of health (SOHs). One of the most common SOH parameter assessments is the comparison of the actual capacity with the standard cycle ( C curr ) with respect to the initial capacity ( C new ):
S O H = 100 C curr C new .
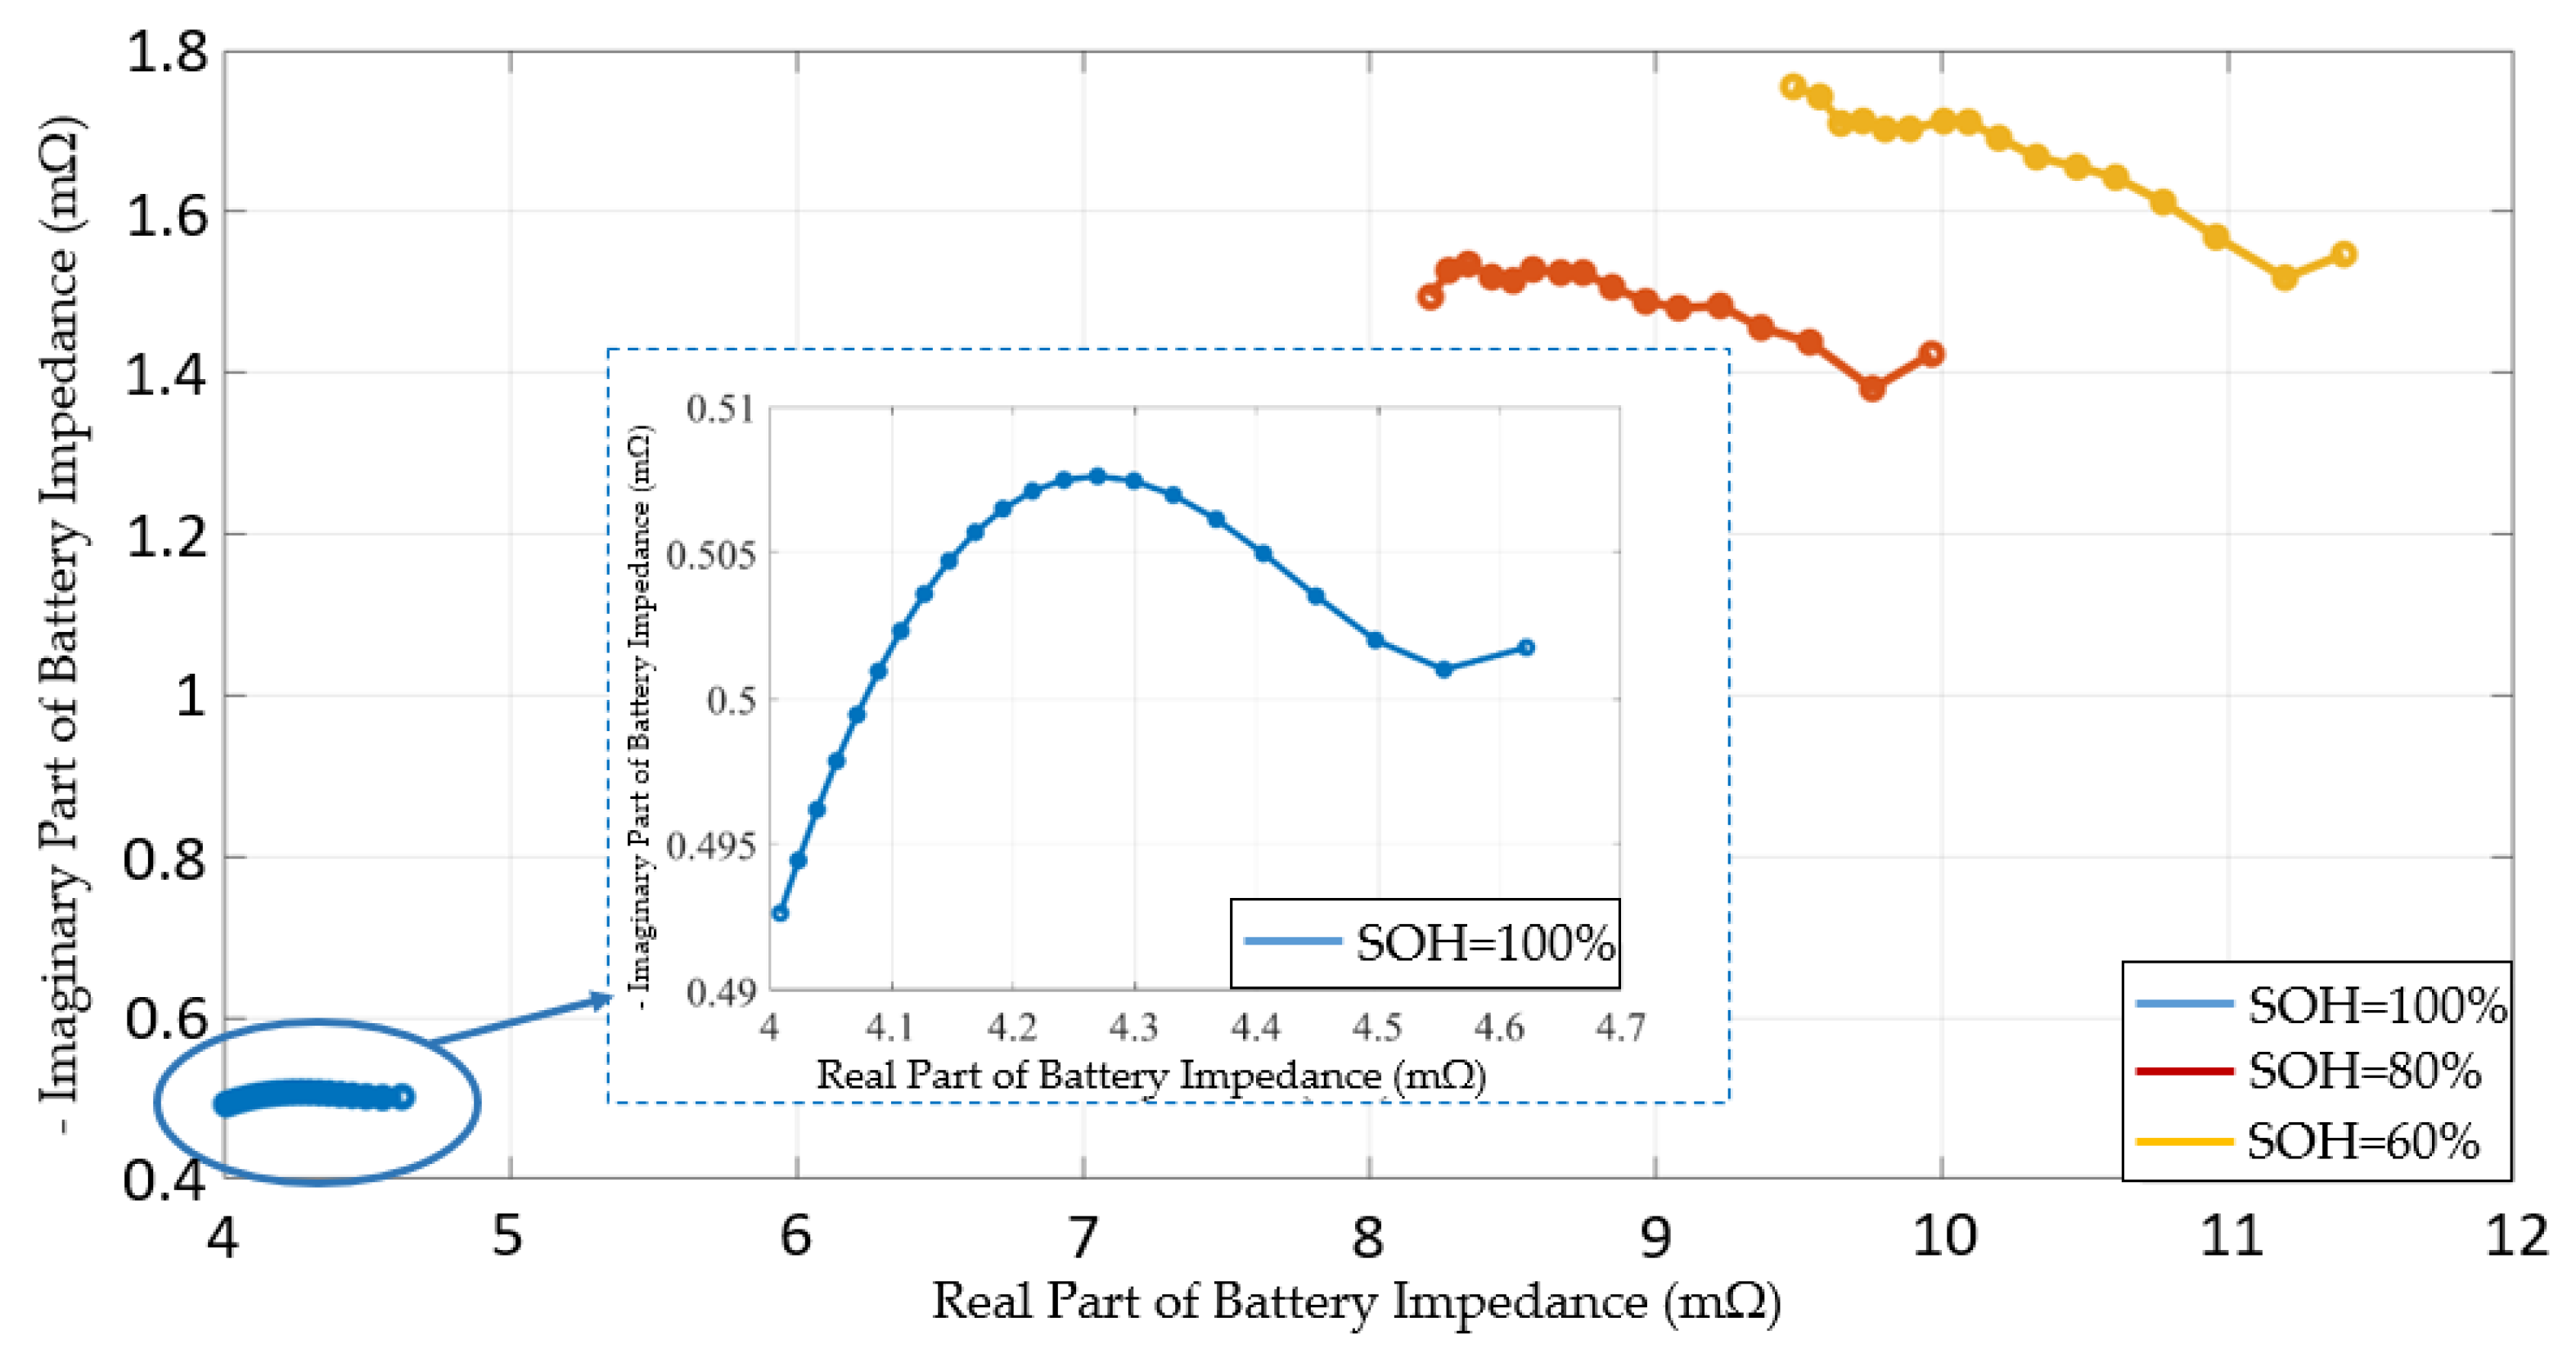
The results of the EIS test performed on an NMC cell at SOH 100%, 80%, and 60% and impedance measurements in the frequency band [50,300] Hz are given in Figure 8. The impedance data shift on the right in the Nyquist plot when the SOH decreases, meaning that the internal resistance increases with aging. Moreover, it is noticeable that impedance measurements are well separated at different SOHs. This confirms that EIS is a powerful method for a reliable diagnostic of battery SOH. In this work, we define the battery model at SOH = 60%. Model parameters are identified by fitting the experimental impedance measurements thanks to the use of the Levenberg–Marquardt algorithm and a variable number of N-RC groups.
The results given in Figure 9 show that N = 10 is an appropriate number because the simulated curve obtained for N = 10 fits the experimental data with no under- or over-fitting [40].

5. Simulation Results and Discussion

The wireless charging system and battery impedance model, described in the previous sections, have been simulated using PLECS software [41].
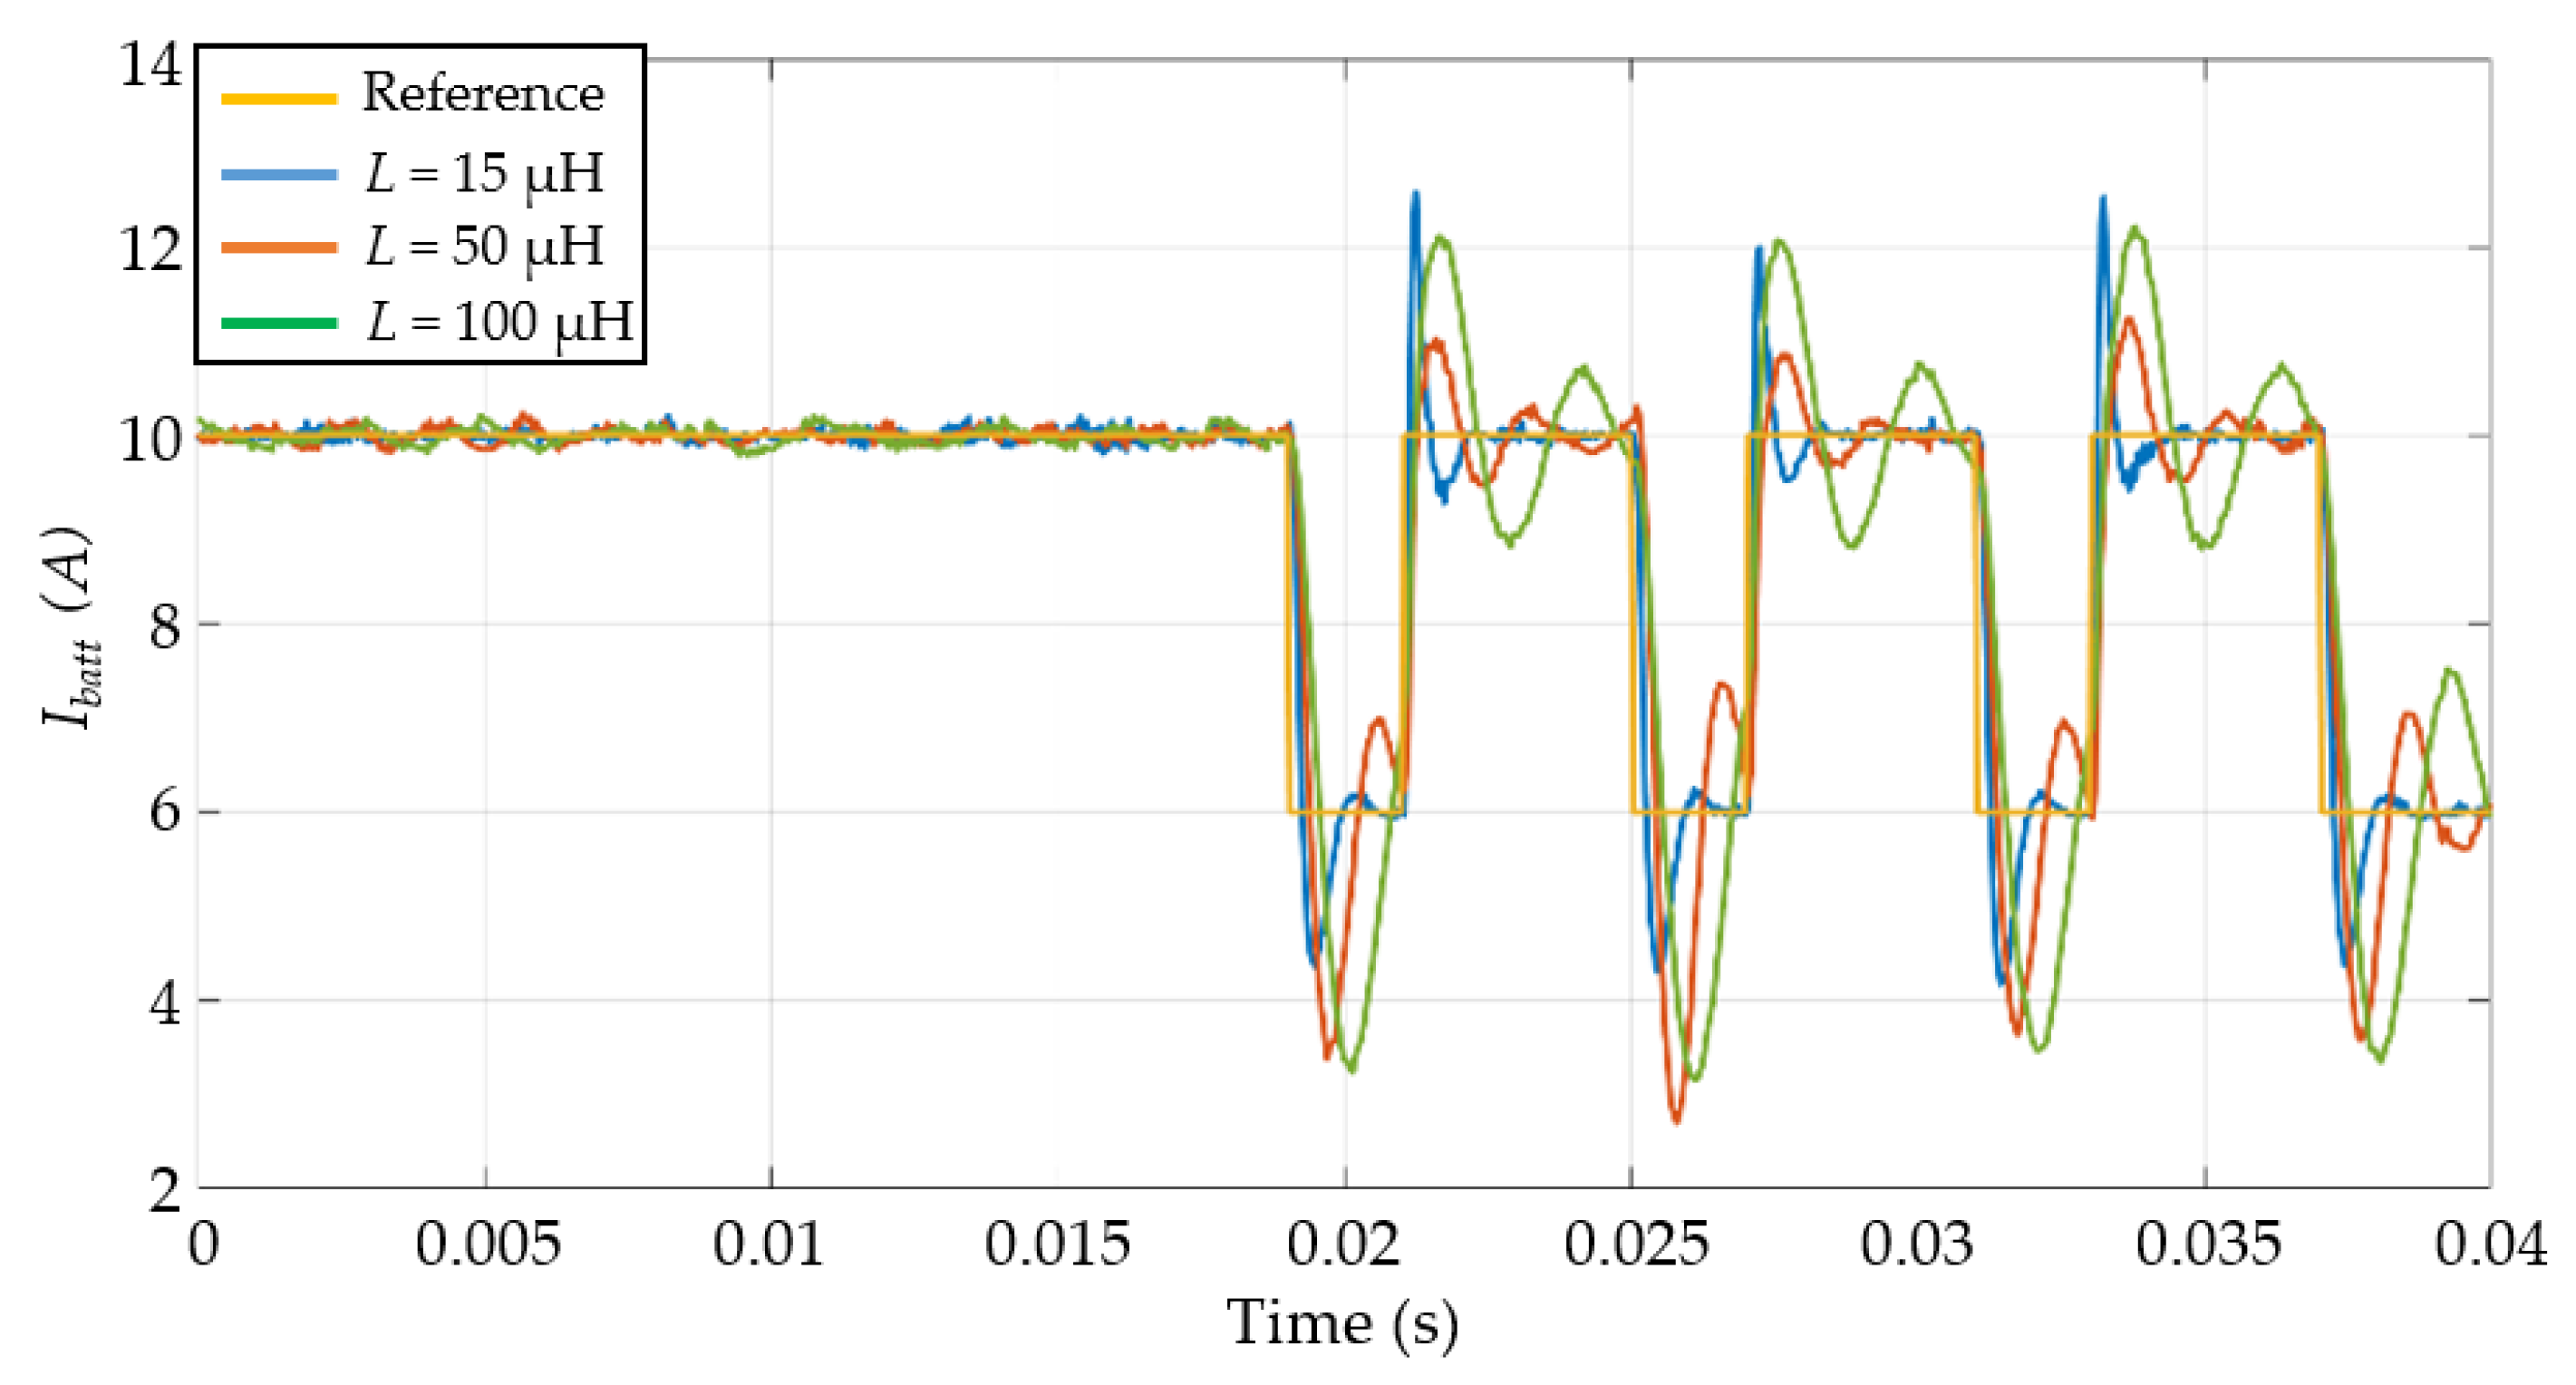
The EIS test, based on a 500 Hz PRBS excitation, is embedded in the 5 kHz digital controller. The impedance estimations for different PRBS peak-to-peak current level values and LC inductances values have been evaluated. Figure 10 shows the PRBS current generated by considering the peak-to-peak level fixed to the rate of charge of C/5. Designing the controller by using the direct synthesis method, it is necessary to know the linear transfer function of the secondary circuit P(s), as shown in Figure 5. The impedance estimation results, in the frequency band [50,300] Hz at different PRBS current levels and LC inductances, are depicted in Figure 10. White noise with a standard deviation of 1.5 mV has been added to the current and voltage measurements. Hence, by increasing the PRBS peak-to-peak current level, the PSD voltage, and spectral coherence increase, reducing the impedance estimation errors. This last deduction has been demonstrated in Figure 11: by increasing the amplitude of the PRBS signal until C/4, the impedance estimation data get close to the reference.
To have a summary of EIS test performances during simulations, results of the mean comparison real and imaginary impedance estimates with references are depicted in Figure 12.
Real and imaginary impedance comparison errors are calculated according to the following relative values:
e r r real , % = 1 N t o t j = 1 N t o t | Re ( Z est ( j ) ) Re ( Z ref ( j ) ) | | Re ( Z ref ( j ) ) | × 100
e r r imag , % = 1 N t o t j = 1 N t o t | Im ( Z est ( j ) ) Im ( Z ref ( j ) ) | | Im ( Z ref ( j ) ) | × 100 .
It is inferable that by increasing the peak-to-peak PRBS charging current levels, the relative comparison error is drastically reduced, whereas the error is slightly reduced by increasing the CLC inductance. The current waveforms obtained during Constant Current (CC) charging are shown in Figure 13. As demonstrated in the previous section, the current ripple is reduced by increasing the inductance of the CLC filter.

6. Conclusions

This paper introduces a novel wireless charging system with an embedded battery state diagnosis through the use of a fast spectroscopy (EIS) test. EIS is a powerful technique to investigate battery chemical–physical changes due to aging or failure events. The EIS test is performed by using the PRBS signal simultaneously with the CC charging.
Simulation EIS tests are performed on a battery impedance model, characterized by an equivalent circuit model. Circuit parameters are evaluated by fitting experimental impedance data. Simulation results confirm that it is possible to charge and identify battery impedance at the same time by using the PRBS embedded in the control system. Accurate impedance estimation has been obtained increasing the peak-to-peak PRBS excitation signal. Moreover, the increase of the CLC filter inductance has slightly improved the accuracy of impedance estimation. Moreover, it has reduced the charging current ripple during the CC charging phase.
With the proposed method, battery impedance can be monitored every time the battery is charged; hence, failure events can be avoided, and battery lifetime can be prolonged. In addition, the charging regulations can be modified according to the battery state.

Author Contributions

Conceptualization, E.L., F.C. and L.P.; methodology, E.L., F.C.; software, E.L., F.C.; validation, E.L., F.C., L.P. and A.R.; formal analysis, E.L., F.C.; investigation, E.L.; resources, E.L., F.C., L.P., A.R., L.B. and G.L.; data curation, E.L. and F.C.; writing—original draft preparation, E.L. and F.C.; writing—review and editing, E.L., F.C., L.P., A.R., L.B. and G.L.; visualization, E.L. and F.C.; supervision, L.P., A.R. and G.L.; project administration, L.P., A.R. and G.L.; funding acquisition, G.L. All authors have read and agreed to the published version of the manuscript.

Funding

This research received no external funding.

Institutional Review Board Statement

Not applicable.

Informed Consent Statement

Not applicable.

Data Availability Statement

Data sharing not applicable.

Conflicts of Interest

The authors declare no conflict of interest.

References

  1. Berckmans, G.; Messagie, M.; Smekens, J.; Omar, N.; Vanhaverbeke, L.; Van Mierlo, J. Cost projection of state of the art lithium-ion batteries for electric vehicles up to 2030. Energies 2017, 10, 1314. [Google Scholar] [CrossRef] [Green Version]
  2. Lebedeva, N.; Persio, F.D.; Boon-Brett, L. Lithium Ion Battery Value Chain and Related Opportunities for Europe (No. EUR 28534 EN); Publications Office of the European Union: Luxembourg, 2017. [Google Scholar]
  3. Figgener, J.; Stenzel, P.; Kairies, K.P.; Linßen, J.; Haberschusz, D.; Wessels, O.; Angenendt, G.; Robinius, M.; Stolten, D.; Sauer, D.U. The development of stationary battery storage systems in Germany—A market review. J. Energy Storage 2020, 29, 101153. [Google Scholar] [CrossRef]
  4. Watrin, N.; Blunier, B.; Miraoui, A. Review of adaptive systems for lithium batteries State-of-Charge and State-of-Health estimation. In Proceedings of the 2012 IEEE Transportation Electrification Conference and Expo (ITEC), Dearborn, MI, USA, 18–20 June 2012; pp. 1–6. [Google Scholar]
  5. Locorotondo, E.; Pugi, L.; Berzi, L.; Pierini, M.; Lutzemberger, G. Online Identification of Thevenin Equivalent Circuit Model Parameters and Estimation State of Charge of Lithium-Ion Batteries. In Proceedings of the 2018 IEEE International Conference on Environment and Electrical Engineering and 2018 IEEE Industrial and Commercial Power Systems Europe (EEEIC/I&CPS Europe), Palermo, Italy, 12–15 June 2018; pp. 1–6. [Google Scholar]
  6. Li, X.; Jiang, J.; Chen, D.; Zhang, Y.; Zhang, C. A capacity model based on charging process for state of health estimation of lithium ion batteries. Appl. Energy 2016, 177, 537–543. [Google Scholar] [CrossRef]
  7. Kim, I. A Technique for Estimating the State of Health of Lithium Batteries through a Dual-Sliding-Mode Observer. IEEE Trans. Power Electron. 2010, 25, 1013–1022. [Google Scholar]
  8. Lei, Y.; Li, N.; Guo, L.; Li, N.; Yan, T.; Lin, J. Machinery health prognostics: A systematic review from data acquisition to RUL prediction. Mech. Syst. Signal Process. 2018, 104, 799–834. [Google Scholar] [CrossRef]
  9. Khaleghi, S.; Firouz, Y.; Van Mierlo, J.; Van den Bossche, P. Developing a real-time data-driven battery health diagnosis method, using time and frequency domain condition indicators. Appl. Energy 2019, 255, 113813. [Google Scholar] [CrossRef]
  10. Liu, D.; Pang, J.; Zhou, J.; Peng, Y.; Pecht, M. Prognostics for state of health estimation of lithium-ion batteries based on combination Gaussian process functional regression. Microelectron. Reliab. 2013, 53, 832–839. [Google Scholar] [CrossRef]
  11. De Sutter, L.; Firouz, Y.; De Hoog, J.; Omar, N.; Van Mierlo, J. Battery aging assessment and parametric study of lithium-ion batteries by means of a fractional differential model. Electrochim. Acta 2019, 305, 24–36. [Google Scholar] [CrossRef]
  12. Tröltzsch, U.; Kanoun, O.; Tränkler, H.R. Characterizing aging effects of lithium ion batteries by impedance spectroscopy. Electrochim. Acta 2006, 51, 1664–1672. [Google Scholar] [CrossRef]
  13. Wang, X.; Wei, X.; Dai, H. Estimation of state of health of lithium-ion batteries based on charge transfer resistance considering different temperature and state of charge. J. Energy Storage 2019, 21, 618–631. [Google Scholar] [CrossRef]
  14. Xiong, R.; Tian, J.; Mu, H.; Wang, C. A systematic model-based degradation behavior recognition and health monitoring method for lithium-ion batteries. Appl. Energy 2017, 207, 372–383. [Google Scholar] [CrossRef]
  15. Christophersen, J.P.; Morrison, J.; Morrison, W.; Motloch, C. Rapid impedance spectrum measurements for state-of-health assessment of energy storage devices. SAE Int. J. Passeng. Cars-Electron. Electr. Syst. 2012, 5, 246–256. [Google Scholar] [CrossRef] [Green Version]
  16. Haußmann, P.; Melbert, J. Optimized mixed-domain signal synthesis for broadband impedance spectroscopy measurements on lithium ion cells for automotive applications. J. Sens. Sens. Syst. 2017, 6, 65. [Google Scholar] [CrossRef]
  17. Relan, R.; Firouz, Y.; Timmermans, J.; Schoukens, J. Data-Driven Nonlinear Identification of Li-Ion Battery Based on a Frequency Domain Nonparametric Analysis. IEEE Trans. Control Syst. Technol. 2017, 25, 1825–1832. [Google Scholar] [CrossRef] [Green Version]
  18. Sihvo, J.; Stroe, D.; Messo, T.; Roinila, T. Fast Approach for Battery Impedance Identification Using Pseudo-Random Sequence Signals. IEEE Trans. Power Electron. 2020, 35, 2548–2557. [Google Scholar] [CrossRef]
  19. Locorotondo, E.; Scavuzzo, S.; Pugi, L.; Ferraris, A.; Berzi, L.; Airale, A.; Pierini, M.; Carello, M. Electrochemical Impedance Spectroscopy of Li-Ion battery on-board the Electric Vehicles based on Fast nonparametric identification method. In Proceedings of the 2019 IEEE International Conference on Environment and Electrical Engineering and 2019 IEEE Industrial and Commercial Power Systems Europe (EEEIC/I&CPS Europe), Genova, Italy, 11–14 June 2019; pp. 1–6. [Google Scholar]
  20. Al Nazer, R.; Cattin, V.; Granjon, P.; Montaru, M.; Ranieri, M. Broadband Identification of Battery Electrical Impedance for HEVs. IEEE Trans. Veh. Technol. 2013, 62, 2896–2905. [Google Scholar] [CrossRef] [Green Version]
  21. Piret, H.; Granjon, P.; Guillet, N.; Cattin, V. Tracking of electrochemical impedance of batteries. J. Power Sources 2016, 312, 60–69. [Google Scholar] [CrossRef] [Green Version]
  22. Howey, D.A.; Mitcheson, P.D.; Yufit, V.; Offer, G.J.; Brandon, N.P. Online Measurement of Battery Impedance Using Motor Controller Excitation. IEEE Trans. Veh. Technol. 2014, 63, 2557–2566. [Google Scholar] [CrossRef]
  23. Nguyen, T.; Tran, V.; Choi, W. Development of the intelligent charger with battery State-Of-Health estimation using online impedance spectroscopy. In Proceedings of the 2014 IEEE 23rd International Symposium on Industrial Electronics (ISIE), Istanbul, Turkey, 1–4 June 2014. [Google Scholar]
  24. De Angelis, A.; Crescentini, M.; Ramilli, R.; De Angelis, G.; Tartagni, M.; Moschitta, A.; Traverso, P.A.; Carbone, P. A Compact System for On-line Electrochemical Impedance Spectroscopy on Lithium-Ion Batteries. In Proceedings of the 2020 IEEE International Instrumentation and Measurement Technology Conference (I2MTC), Dubrovnik, Croatia, 25–28 May 2020; pp. 1–6. [Google Scholar]
  25. Serni, T.; Locorotondo, E.; Pugi, L.; Berzi, L.; Pierini, M.; Cultrera, V. A Low Cost Programmable Hardware for Online Spectroscopy of Lithium Batteries. In Proceedings of the 2020 IEEE 20th Mediterranean Electrotechnical Conference (MELECON), Palermo, Italy, 16–18 June 2020; pp. 57–62. [Google Scholar]
  26. Jung, M. Optimized design of DC-DC converter LC output filter for EV battery charging applications in terms of defined battery current and voltage ripple as well as overall system efficiency. In Proceedings of the 2016 18th European Conference on Power Electronics and Applications (EPE’16 ECCE Europe), Karlsruhe, Germany, 5–9 September 2016; pp. 1–8. [Google Scholar]
  27. Ljung, L. System Identification-Theory for the User; Prentice Hall: Upper Saddle River, NJ, USA, 1999. [Google Scholar]
  28. Raijmakers, L.H.J.; Danilov, D.L.; Van Lammeren, J.P.M.; Lammers, M.J.G.; Notten, P.H.L. Sensorless battery temperature measurements based on electrochemical impedance spectroscopy. J. Power Sources 2014, 247, 539–544. [Google Scholar] [CrossRef]
  29. Stroe, D.I.; Swierczynski, M.; Stan, A.I.; Knap, V.; Teodorescu, R.; Andreasen, S.J. Diagnosis of lithium-ion batteries state-of-health based on electrochemical impedance spectroscopy technique. In Proceedings of the 2014 IEEE Energy Conversion Congress and Exposition (ECCE), Pittsburgh, PA, USA, 14–18 September 2014; pp. 4576–4582. [Google Scholar]
  30. Huria, T.; Ludovici, G.; Lutzemberger, G.I.O.V.A.N.N.I. State of charge estimation of high power lithium iron phosphate cells. J. Power Sources 2014, 249, 92–102. [Google Scholar] [CrossRef]
  31. Waag, W.; Käbitz, S.; Sauer, D.U. Experimental investigation of the lithium-ion battery impedance characteristic at various conditions and aging states and its influence on the application. Appl. Energy 2013, 102, 885–897. [Google Scholar] [CrossRef]
  32. Silva, J.; Maia, N. Modal Analysis and Testing; Applied Science; Springer Science & Business Media: Berlin, Germany, 1999; Volume 363. [Google Scholar]
  33. Pintelon, R.; Schoukens, J. System Identification: A Frequency Domain Approach; John Wiley & Sons: Hoboken, NJ, USA, 2012. [Google Scholar]
  34. GFranklin, F.; Powell, J.D.; Emami-Naeini, A. Feedback Control of Dynamic Systems, 3rd ed.; Addison-Wesley: Boston, MA, USA, 1994. [Google Scholar]
  35. Randles, J.E.B. Kinetics of rapid electrode reactions. Discuss. Faraday Soc. 1947, 1, 11–19. [Google Scholar] [CrossRef]
  36. Berthier, F.; Diard, J.P.; Michel, R. Distinguishability of equivalent circuits containing CPEs: Part I. Theoretical part. J. Electroanal. Chem. 2001, 510, 1–11. [Google Scholar] [CrossRef]
  37. Locorotondc, E.; Pugi, L.; Berzi, L.; Pierini, M.; Scavuzzc, S.; Ferraris, A.; Airale, A.G.; Carello, M. Modeling and simulation of Constant Phase Element for battery Electrochemical Impedance Spectroscopy. In Proceedings of the 2019 IEEE 5th International forum on Research and Technology for Society and Industry (RTSI), Florence, Italy, 9–12 September 2019; pp. 225–230. [Google Scholar]
  38. Locorotondo, E.; Cultrera, V.; Pugi, L.; Berzi, L.; Pasquali, M.; Andrenacci, N.; Lutzemberger, G.; Pierini, M. Impedance spectroscopy characterization of lithium batteries with different ages in second life application. In Proceedings of the 2020 IEEE International Conference on Environment and Electrical Engineering and 2020 IEEE Industrial and Commercial Power Systems Europe (EEEIC/I&CPS Europe), Madrid, Spain, 9–12 June 2020; pp. 1–6. [Google Scholar]
  39. EIG Battery Official Site. Available online: www.eigbattery.com (accessed on 3 August 2018).
  40. Schönleber, M.; Klotz, D.; Ivers-Tiffée, E. A method for improving the robustness of linear Kramers-Kronig validity tests. Electrochim. Acta 2014, 131, 20–27. [Google Scholar]
  41. PLECS. The Simulation Platform for Power Electronic Systems. Available online: https://www.plexim.com/plecs (accessed on 7 July 2020).
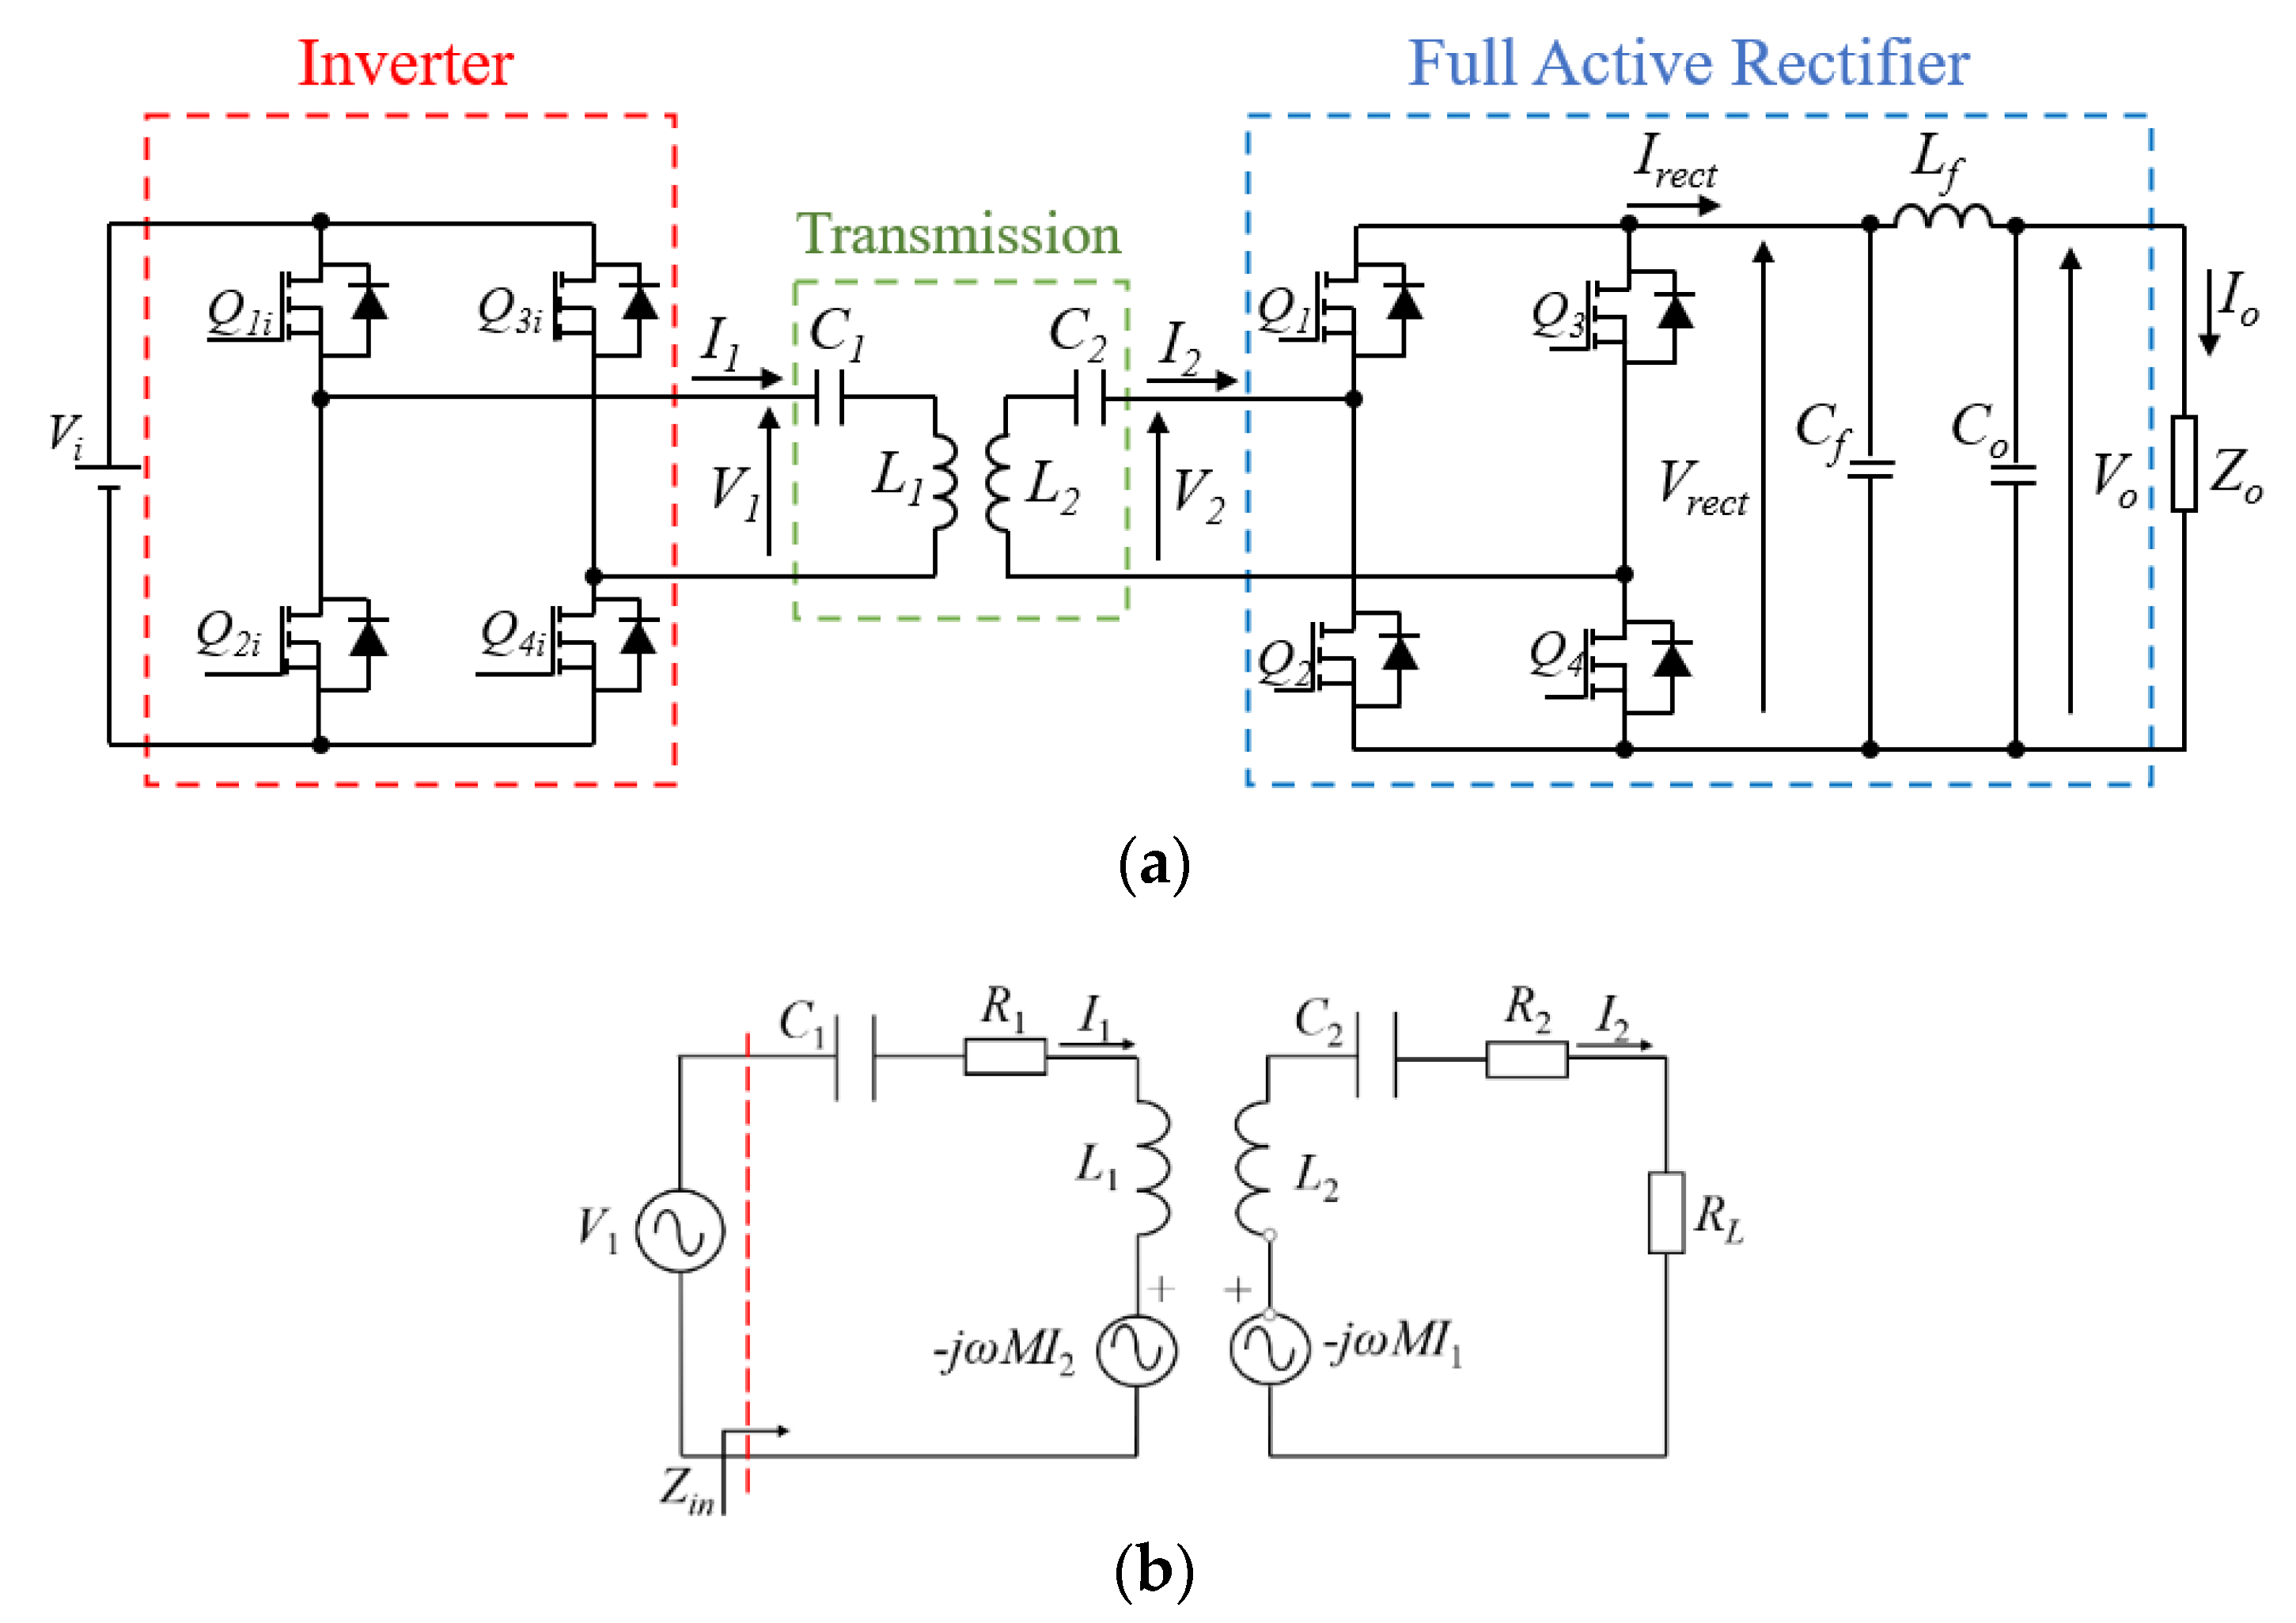
Figure 1. Wireless power transfer system architecture. (a) Topology of the whole system. (b) Equivalent circuit of series-series compensation.
Energies 14 00218 g001
Figure 2. Filter analysis. (a) Rectifier voltage and current waveforms. (b) Electric circuit of the output π filter. (c) Output current ripple for different values of L f , and C 0 . (d) Current transfer function for different values of C f .
Energies 14 00218 g002
Figure 3. Structure of the online electrochemical impedance spectroscopy (EIS) test during wireless charging.
Energies 14 00218 g003
Figure 4. Structure of the impedance and coherence estimation after the EIS test.
Energies 14 00218 g004
Figure 5. Scheme of the secondary circuit control law.
Energies 14 00218 g005
Figure 6. Battery impedance model.
Energies 14 00218 g006
Figure 7. Laboratory battery EIS test setup.
Energies 14 00218 g007
Figure 8. Experimental impedance measurements obtained during the EIS test on NMC battery considering a fixed State of Charge (SOC) (60%), and different States of Health (SOHs), in the frequency band [50,300] Hz.
Energies 14 00218 g008
Figure 9. Comparison between experimental impedance measurements and simulation results with the battery impedance model using N-RC groups.
Energies 14 00218 g009
Figure 10. Simulation of charging current generated by the control system during the EIS test (PRBS generator) at different CLC inductance values.
Energies 14 00218 g010
Figure 11. Comparison between reference impedance and simulation results using pseudo-random binary sequences (PRBS) charging current signal, at different peak-to-peak PRBS level, and fixed Lf = 15 µH (a). Ordinary coherence results obtained measuring impedance (b).
Energies 14 00218 g011
Figure 12. Relative comparison average error in impedance estimation using different peak-to-peak PRBS current levels and LC inductance values: real impedance (a), imaginary impedance (b).
Energies 14 00218 g012
Figure 13. Charging current ripple given in output by the CLC filter to the battery.
Energies 14 00218 g013
Table 1. Wireless power transfer system parameters.
ParametersValues
Resonant Frequency f 0 85 kHz
Primary Inductance L 1 89.22 µH
Secondary Inductance L 2 90.02 µH
Mutual Inductance M 15.8 µH
Coils Distance d 20 cm
Primary Resonant Capacitance C 1 33 nF
Secondary Resonant Capacitance C 2 33 nF
Output Power P 0 3.7 kW
Table 2. Parameters of the control loop and the secondary circuit system.
ParametersValues
Digital controller sample frequency f c = 1 / T c 5 kHz
Filtering inductance L f [15,50,100] µH
Filtering capacitance C f 1950 µF
Output capacitance C 0 45 µF
Shunt resistance R s 0.1 Ω
Desired overshoot S max 20%
Desired bandwidth ω b 2.513 × 10 4 rad/s
Damping factor ξ 0.6
Undamped natural frequency ω n 2.514 × 10 4 rad/s
Publisher’s Note: MDPI stays neutral with regard to jurisdictional claims in published maps and institutional affiliations.