1. Introduction
Globally, cities generate about 80% of the GDP, consume about 75% of global primary energy, and cause more than 70% of energy-related carbon dioxide emissions [
1]. The number of the urban population is rapidly increasing worldwide, from 751 million in 1950 to 4.2 billion in 2018. It is likely to reach about 5.1 billion by 2030 [
2]. In Europe, the majority of citizens live in urban areas, and for their daily life, they require some kind of private or public mobility. Urban mobility is an important facilitator for economic growth, employment and development. In the EU, urban mobility already accounts for 40% of all CO
2 emissions of road transport and up to 70% of other pollutants from transport [
3]. With increasing urbanization, problems such as congestion and pollution are becoming more and more evident, especially in larger cities. Hence, one of the key challenges in the transition towards more sustainable development of the energy system is the transport sector. Moreover, there are two trends, urbanization and electrification, which are deeply transforming energy systems globally [
4]. However, most of the cities have car-centric infrastructures built in the 20th century, which occupy large territories and cause high rates of urban air pollution and congestion. Especially in urban areas, electric mobility is seen as an important means to cope with local environmental problems as well as to combat global warming.
The shift from private cars to public transport and the electrification of mobility are often seen as the right ways towards sustainable development of urban areas. However, it is important to notice that electric mobility in both private and public transport has a long history.
In particular, the capital of Austria has a long history of electric mobility. In Vienna, trams powered by electricity, at 600 V DC, have been used since 1897. Due to their lower noise and smell compared to horse-drawn and steam trams, they very quickly became the favorable option. Horse-driven trams were removed from use in 1903 and steam trams in 1922. In the first half of the 20th century, since private cars were too expensive for most of the population, trams were a major transport mode in Vienna. Still today, electric trams are an essential part of the public transport system in Vienna in spite of the broader portfolio of other mobility options. Over time, some parts of the tramlines were replaced with buses and metros, but the Viennese trams network comprises around 220 km, which makes it the sixth largest in the world [
5].
Today, the metro is the backbone of the public transport system in Vienna. After the first test operations in 1976, the modern metro opened in 1978. Over time, the number of lines increased, as did the total length of the network. The current underground network extends to 83 km.
Besides the tram and metro network, there is also a bus line network in Vienna of about 850 km. Although most of the buses are still powered by fossil fuels, there are different initiatives for purchasing electric buses. Since 2013, fully electric eight-meter minibuses have been used in the city center. Currently, 12-m battery-electric buses are in the test stage and should be included in passenger service from 2023. Moreover, the first hydrogen bus is in test operation this year, 2020 [
6,
7,
8].
The electrification and historical development of the public transport system in Vienna is depicted in
Figure 1.
Reorganizing urban mobility towards more sustainability is a common challenge to all major cities. Efficient and effective urban transport is crucial for the achievement of sustainability goals. However, the development of mobility is very dependent on policies implemented and policy objectives set for the future. Already in 2011, the Transport White Paper [
9] sets the goal to reduce the use of conventional fossil-fueled cars in urban transport by 50% by 2030 and to phase them out completely by 2050. As a follow-up to this document, the European Commission came up in 2013 with an Urban Mobility Package with a special focus on urban road charging and access restriction schemes, monitoring and management of urban freight flows and financial support mechanisms for the preparation of Urban Mobility Plans.
However, the success of the European policies and goals, which are agreed upon at the EU level, depends also on actions taken and policies implemented by national, regional and local authorities. This is the reason that the development of urban mobility is quite different from city to city. Although the developments are different, the increasing use of alternative fuels and alternative automotive technologies can be noticed in most cities. Over the last decade, special interest in electrification of mobility has been rapidly increasing.
In the literature, different aspects of electrification of mobility have been discussed in recent years. Held and Geritts [
10] conducted a qualitative comparative analysis of urban e-mobility policies in 15 European cities. Liberto et al. [
11] analyzed the impact of electric mobility in Rome. Ajanovic and Haas [
12] examined the major impact factors on the broader dissemination of electric vehicles in urban areas. Assessment of the electrification of urban mobility with the special focus on buses was conducted by Scarinci [
13]. Since public transport is one of the backbones of sustainable transport strategy in the EU, further electrification of public transport is essential for the reduction in emissions in this sector. In the scope of the ELIPTIC project, 20 showcases with variations of electrified public transport under different operational, geographical and climate conditions are demonstrated and analyzed [
14]. The development of e-mobility in urban areas is very different from city to city, and it is important to exchange lessons learned. However, in the literature, only a few contributions exist dealing with e-mobility in all its facets. Currently, there are many papers focusing on electric cars despite their minor relevance compared to public transport, e.g., underground and trams.
The major contribution of this paper is the comprehensive analysis of electric mobility in the city of Vienna from an economic and environmental point of view considering the individual as well as public mobility powered by electricity. An additional aim is to assess CO2 emissions taking into account various electricity generation portfolios as well as the hidden and embedded GHG emissions from production, assembling and scrappage of the electric vehicles. The paper documents the major historical developments, shows the current situation and analyzes possible future scenarios for the electrification of mobility considering existing targets and policy framework, as well as the effects of stronger use of renewable energy in electricity generation.
This paper starts with a brief history of electric mobility in Vienna. In the next section, the recent developments and current situation of mobility in Vienna are described. In
Section 3 policy framework is documented.
Section 4 describes the methods used for economic and environmental assessments. In the next sections, the results of our economic and environmental analysis are provided. The scenarios for future development are presented in
Section 7, and major conclusions are derived at the end.
2. Background: Recent Developments and the Current Situation of Mobility in Vienna
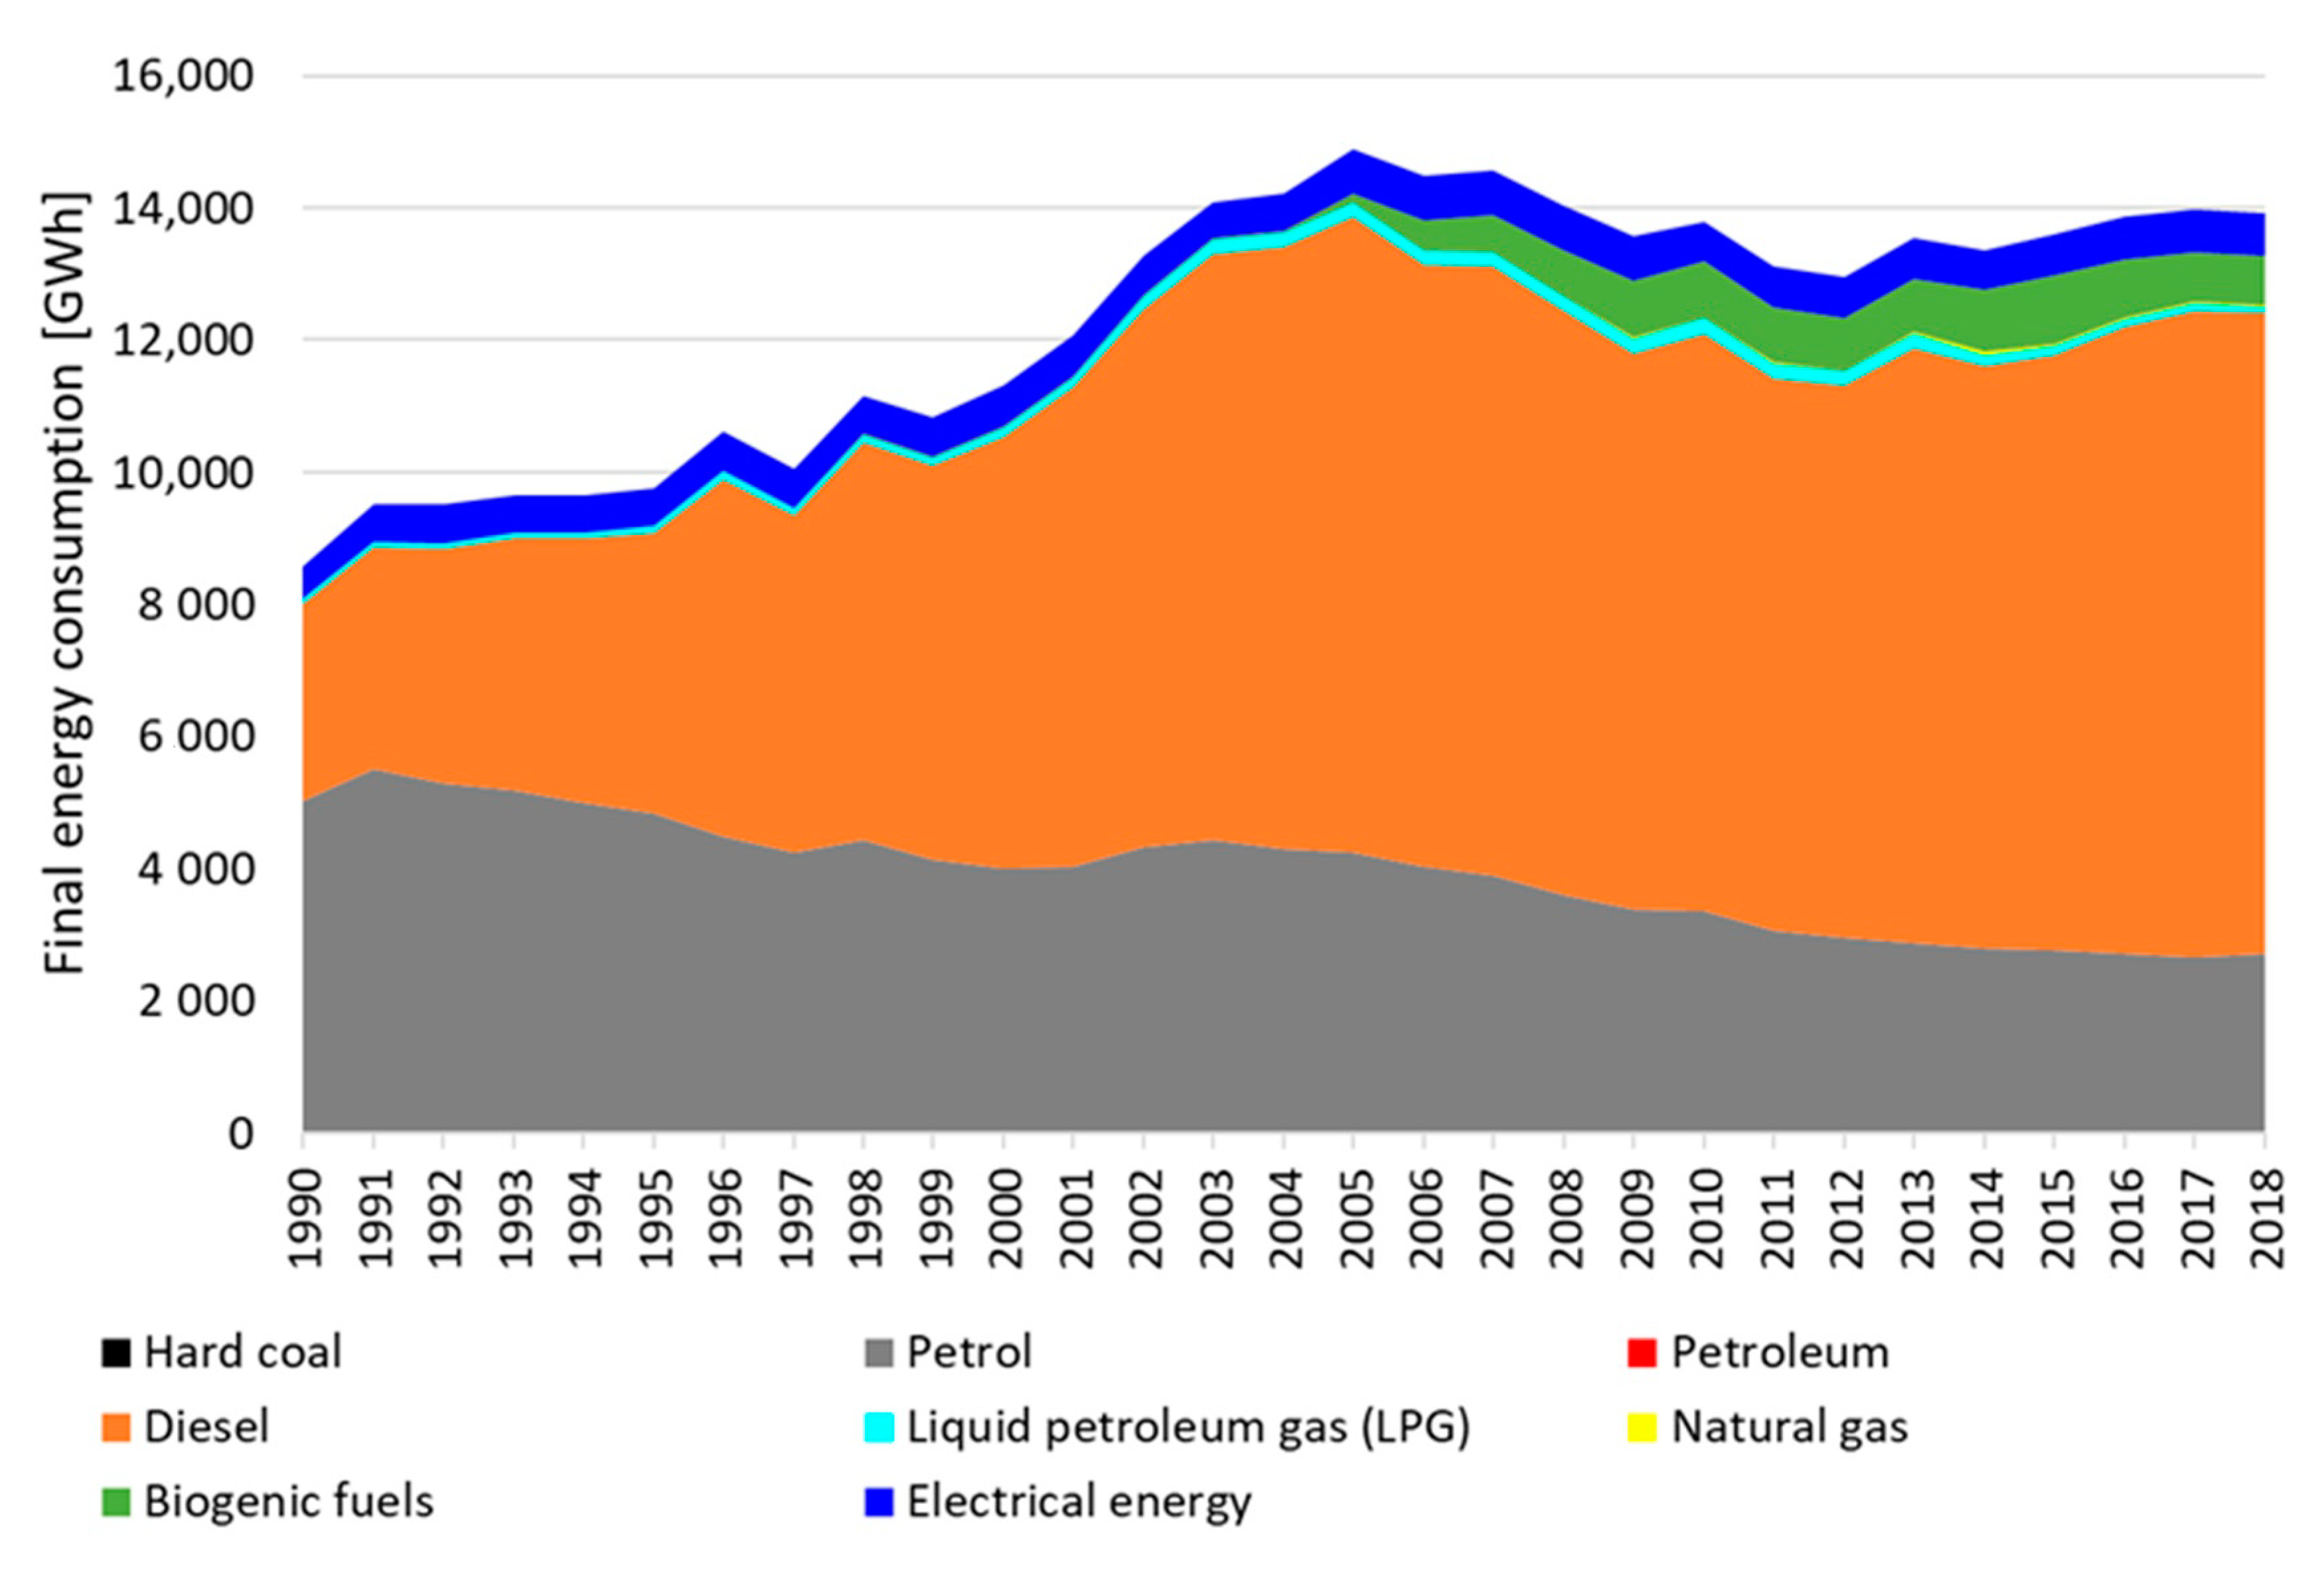
Vienna is a city with a continuously growing population and consequently an increasing demand for energy services, including mobility. The development of overall energy consumption in transport by fuel in Vienna is depicted in
Figure 2. The increase in energy consumption between 1990 and 2018 was about 63%. The largest amount of this energy consumption was covered by fossil fuels. For example, in 2018, the total final energy consumption was about 14 TWh, with only a small amount, 644.3 GWh, covered by electrical energy. In total, the highest energy consumption was reached in 2005 with about 15 TWh.
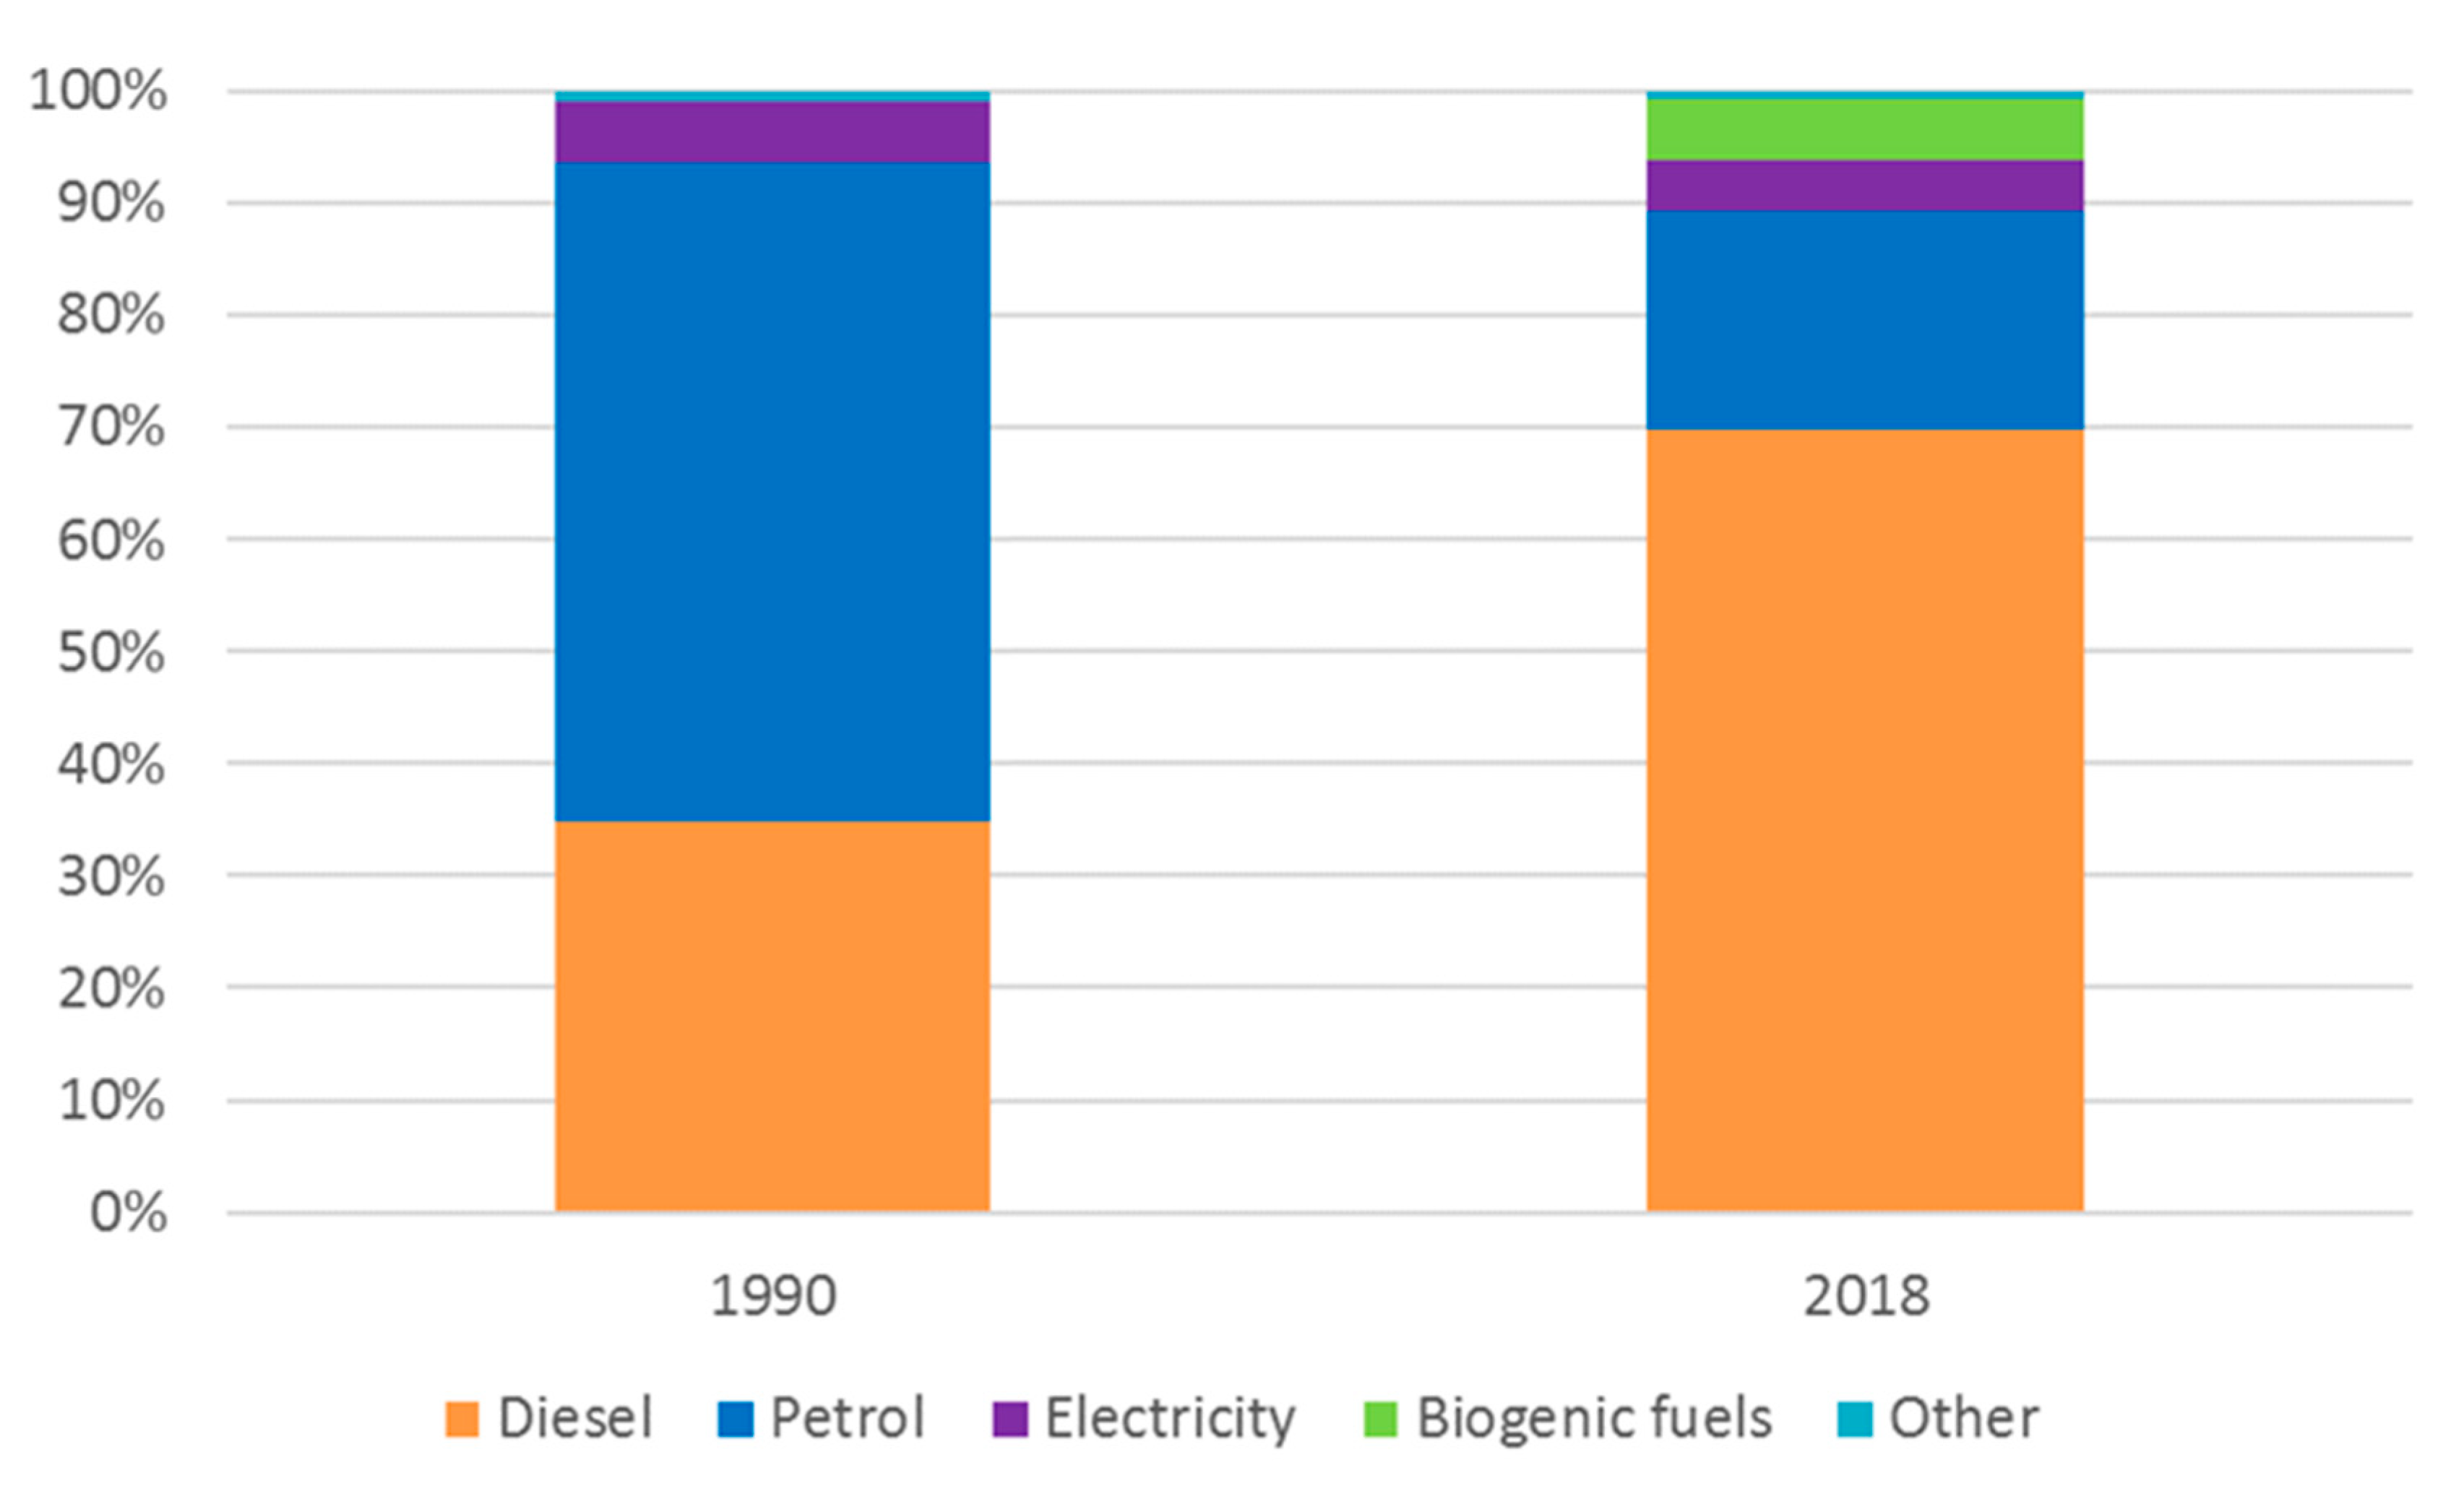
Over time, different fuel mixes have been used in the transport sector. The fuel used most in 1990 was petrol and in 2018 diesel. For example, in 1990, the share of diesel fuel in the energy mix was 35%, but this had risen to 70% by 2018; see
Figure 3. It is interesting to note that in spite of all supporting measures implemented with the goal of accelerating electrification of mobility, the share of electricity in the energy mix in the transport sector in 2018 was almost the same as in 2000 at about 5%.
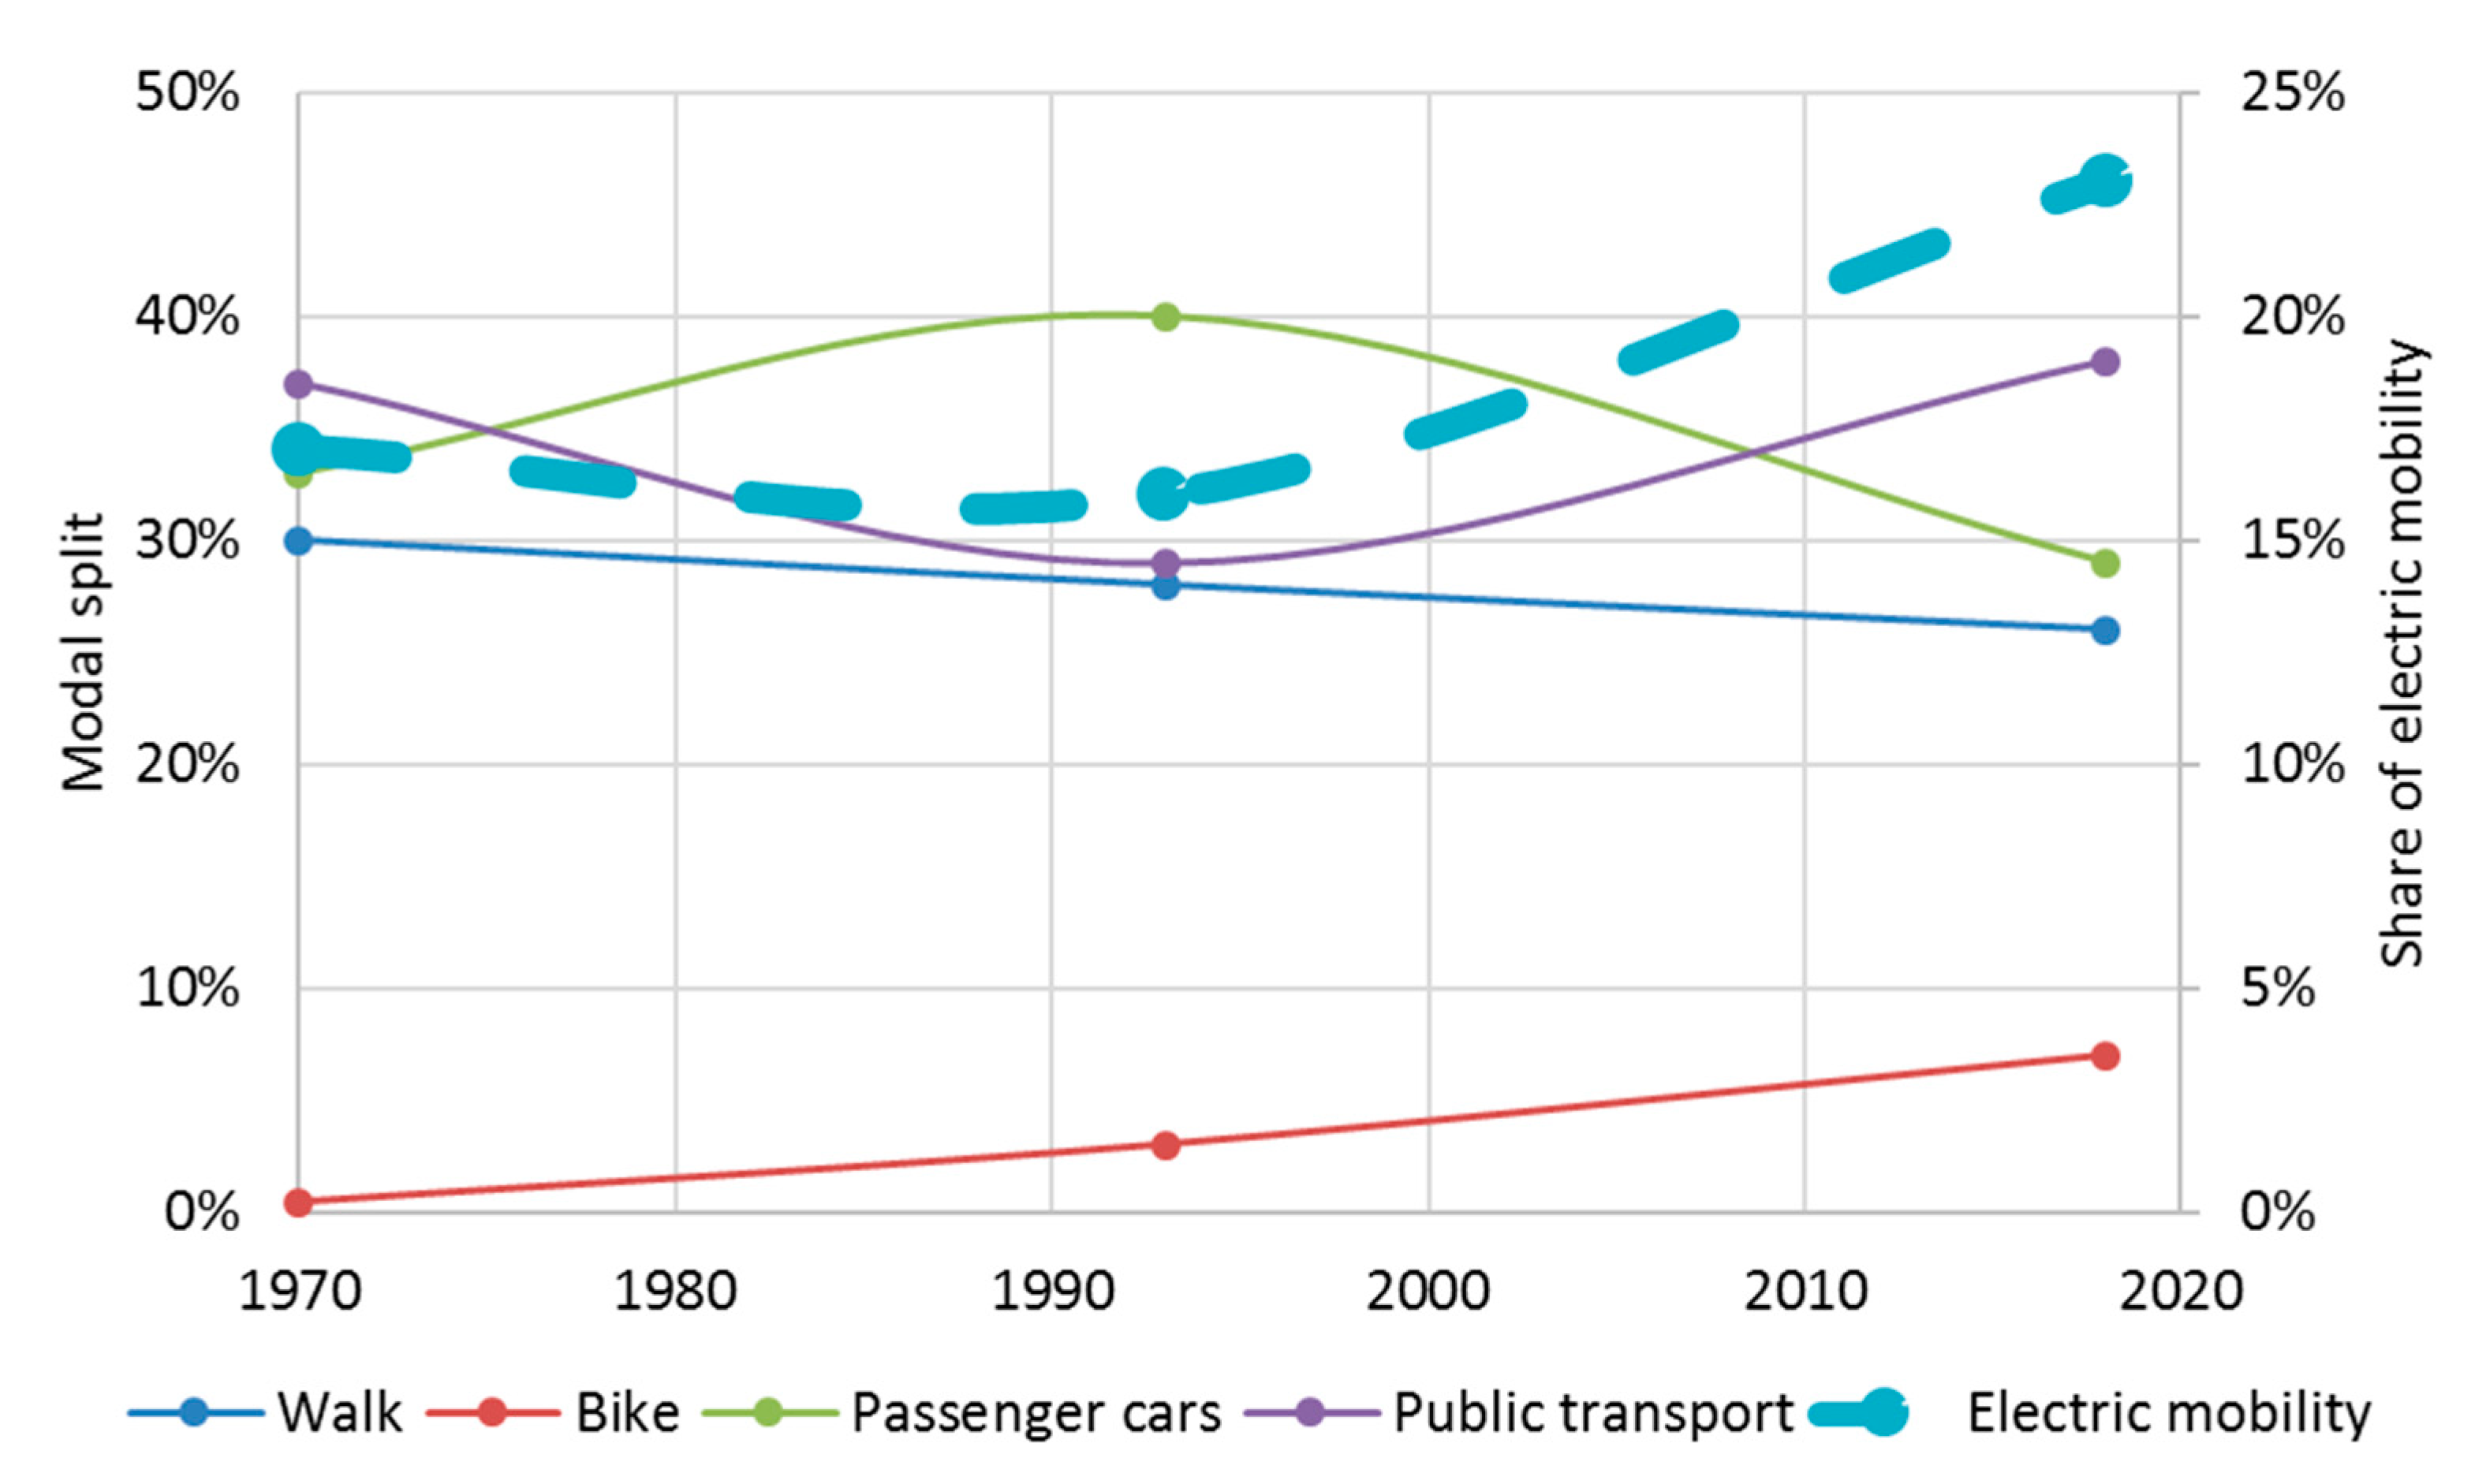
Over the years, interest in different transport modes has also changed. Between the 1970s and the early 1990s, the use of public transport steadily decreased while the use of private passenger cars increased. However, due to the more evident environmental problems related to the transport sector, as well as reduced service prices and improved quality in services, the use of public transport in Vienna has increased remarkably in recent years; see
Figure 4. Moreover, like in other cities, cycling is becoming a more and more popular mobility option. Electric mobility increased in total from about 17% in 1970 to about 23% in 2019 with a historical low in 1993.
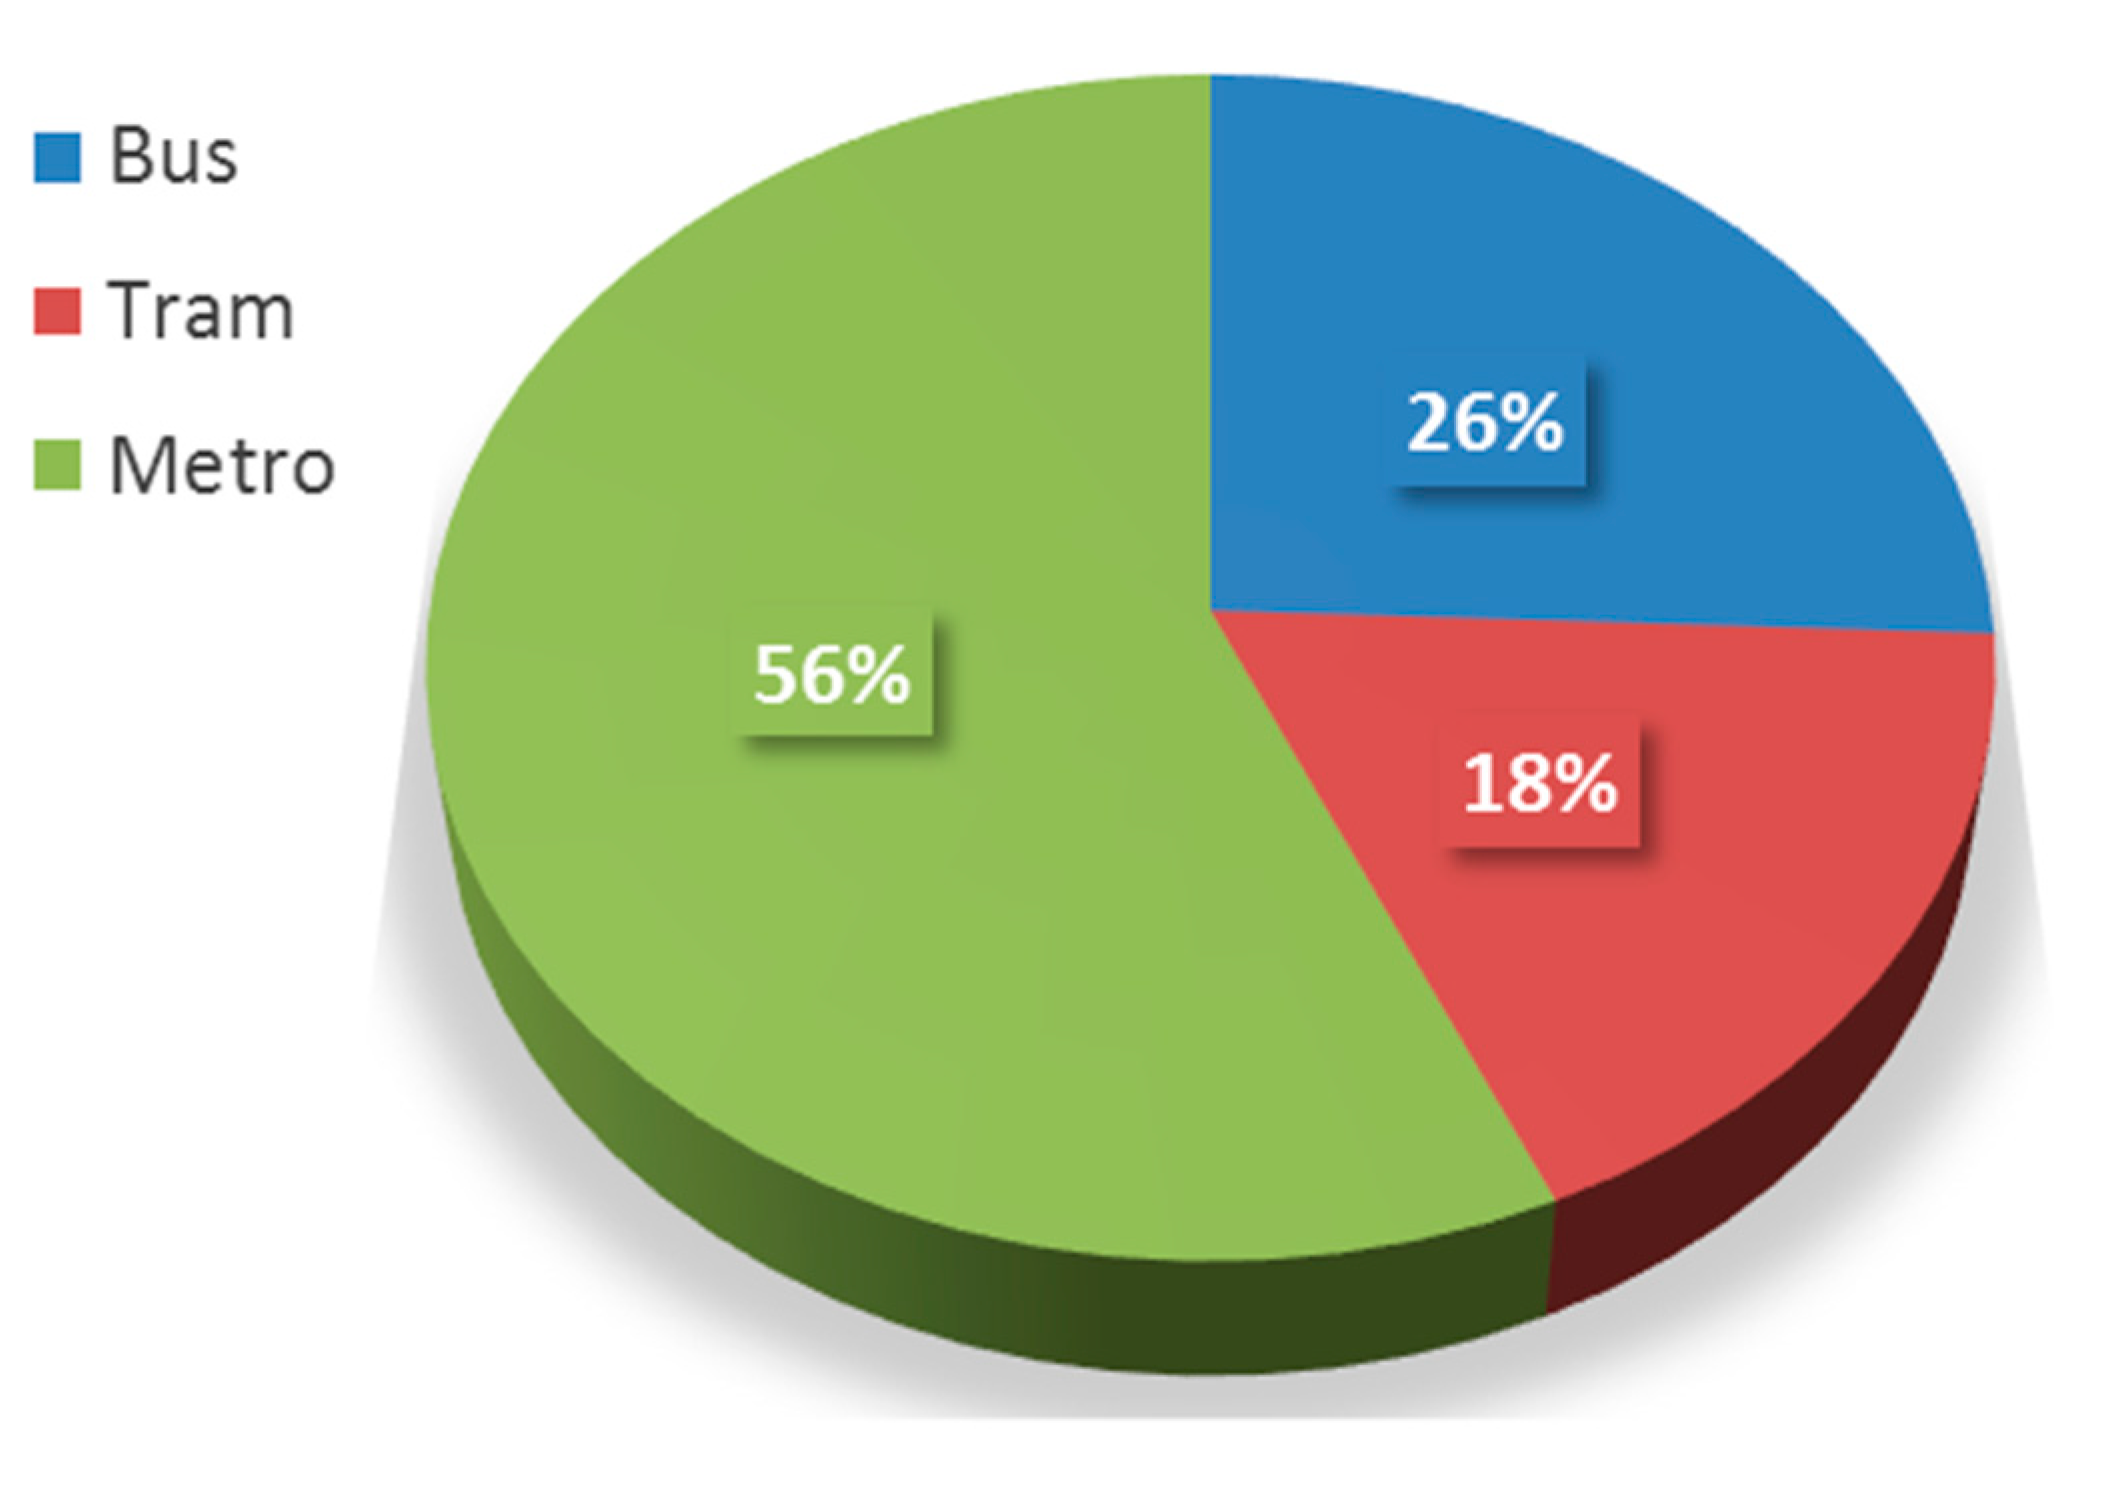
Currently, the most kilometers driven in Vienna are covered by public transport. In 2018 in total, 153 million vehicle kilometers (vkm) were traveled by public transport. The underground had the biggest share, with 70.7 million vkm; see
Figure 5. In Vienna, most of the buses still operate on fossil fuels, but there is a significant effort to increase the use of electric buses, with electric minibuses used currently in the city center.
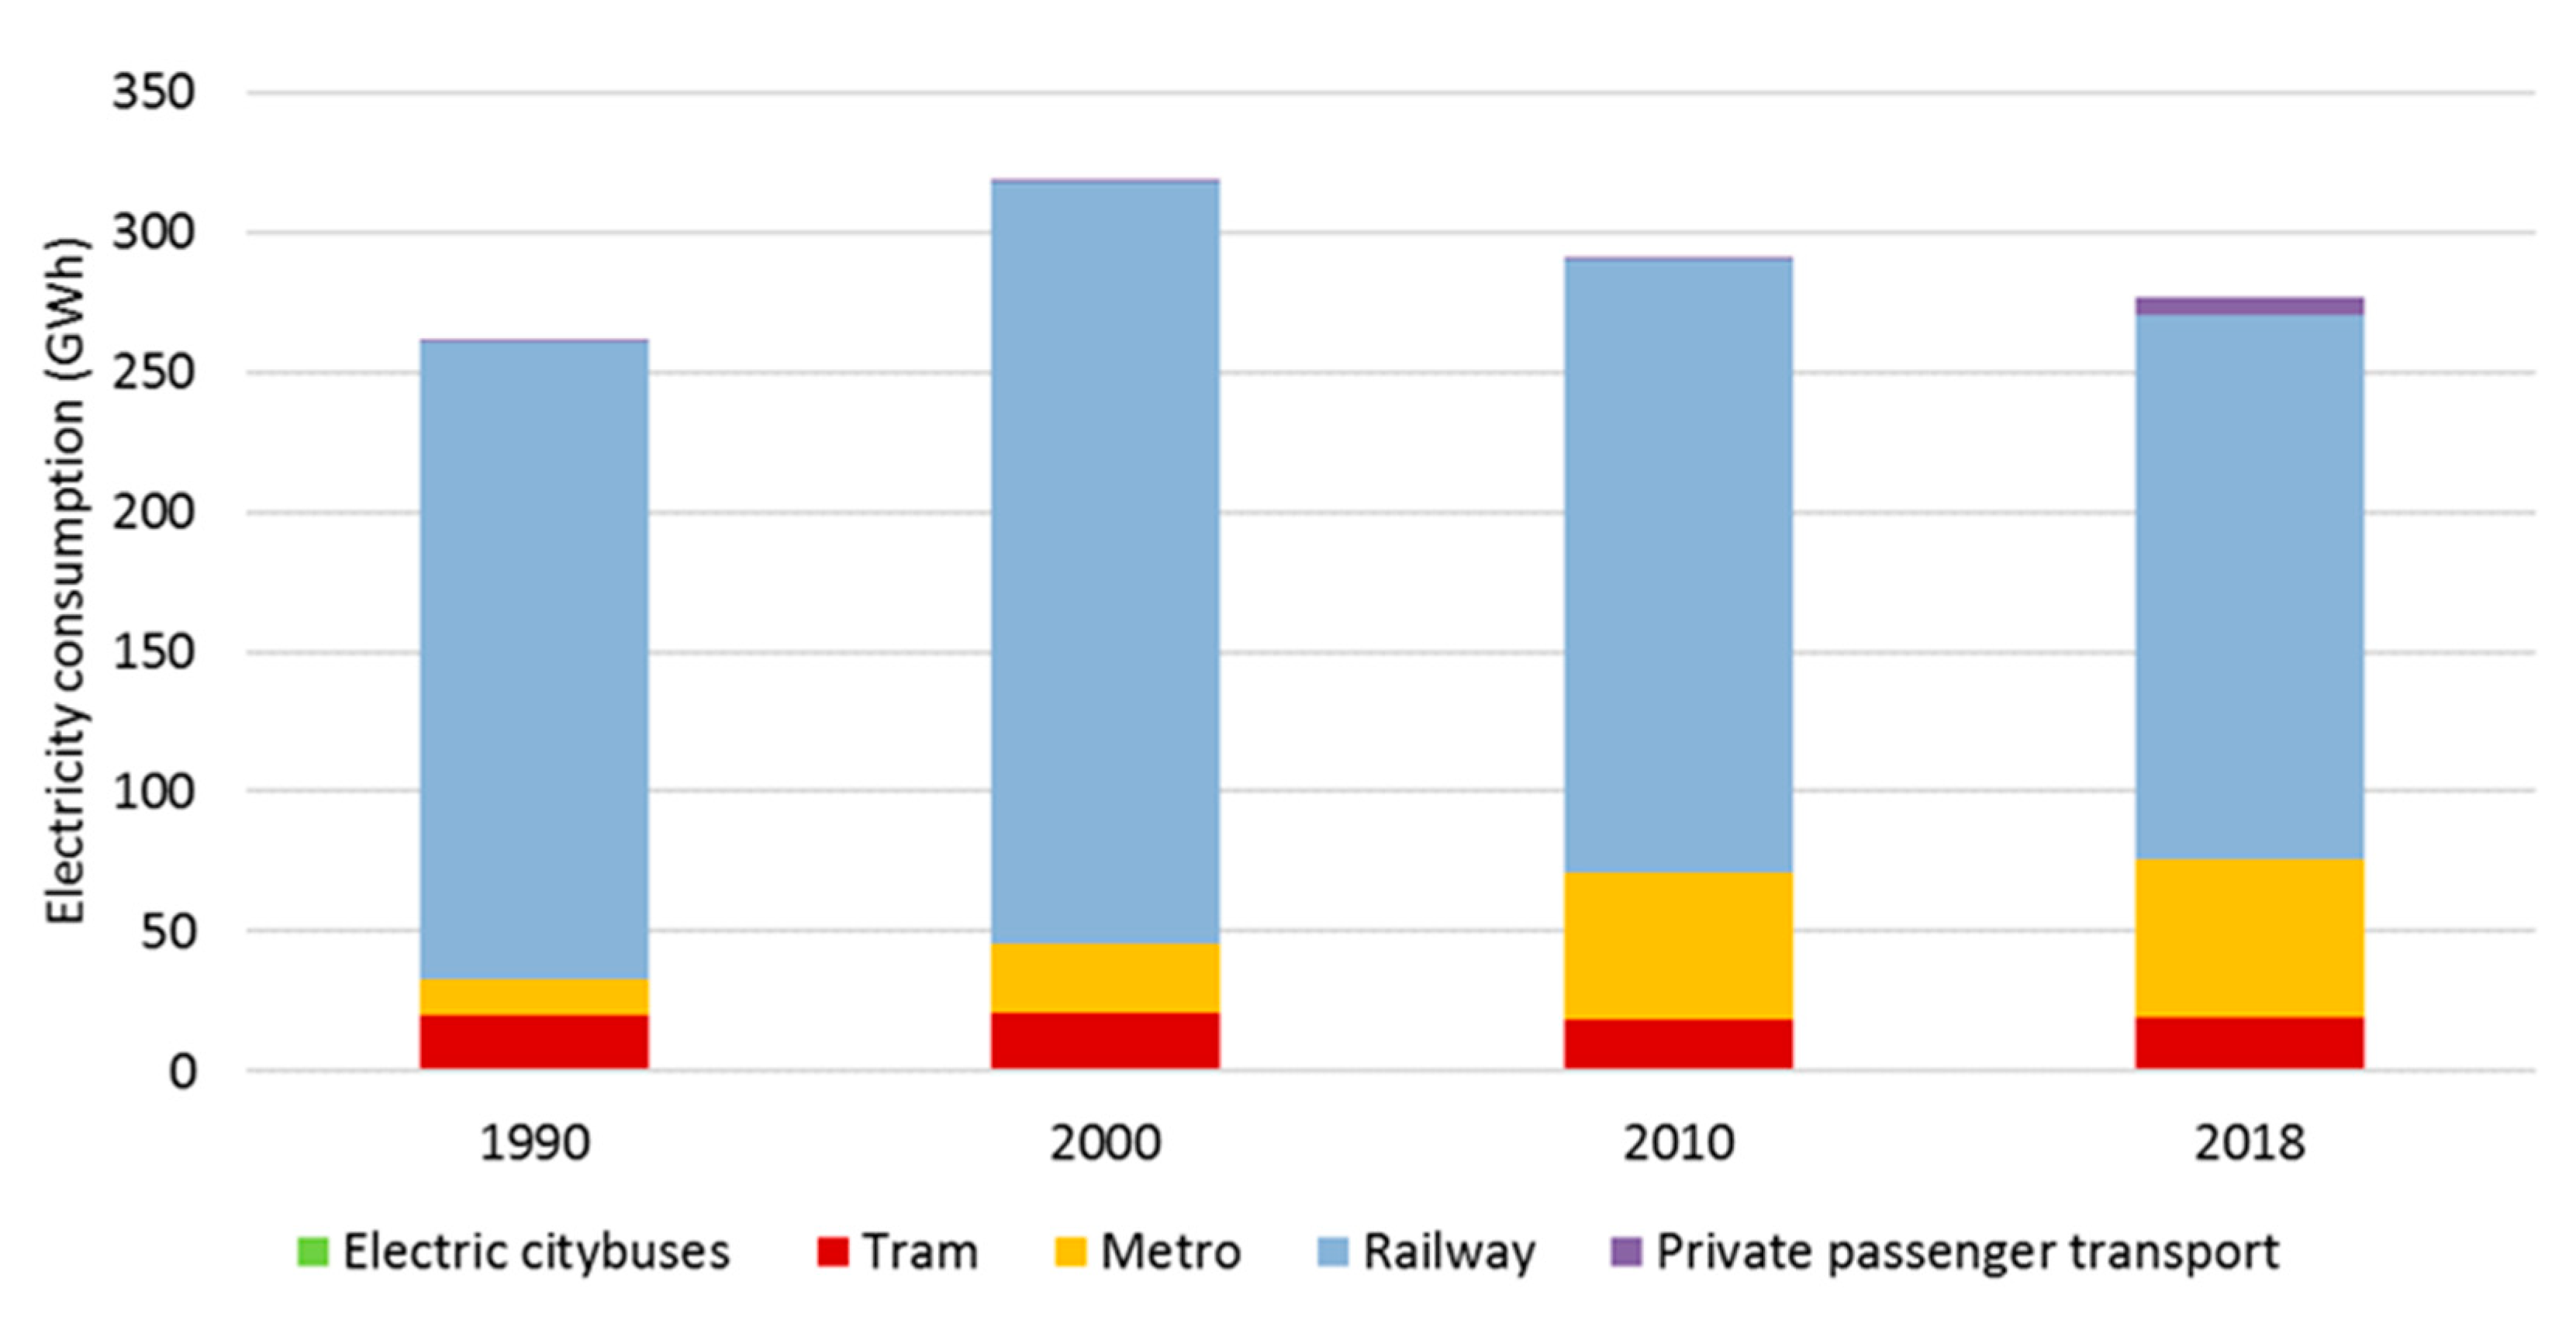
The development of electricity consumption in transport is depicted by mode in
Figure 6. The results combine a top-down and a bottom-up approach. The electrical energy consumption of railway and underground is available in statistical data [
15]. The electricity demand of city buses, trams and passenger cars is calculated using data for the vehicle’s fuel intensity (FI) and vehicle kilometers driven (
dvkm):
with
.
Electricity consumption in tram transport was stable in the period of 1990–2018, whereas the electricity consumption of underground transport more than quadrupled in the same time.
The use of electricity for private passenger mobility is still very low, although a broad portfolio of policy measures is provided with the goal of accelerating the use of electric vehicles.
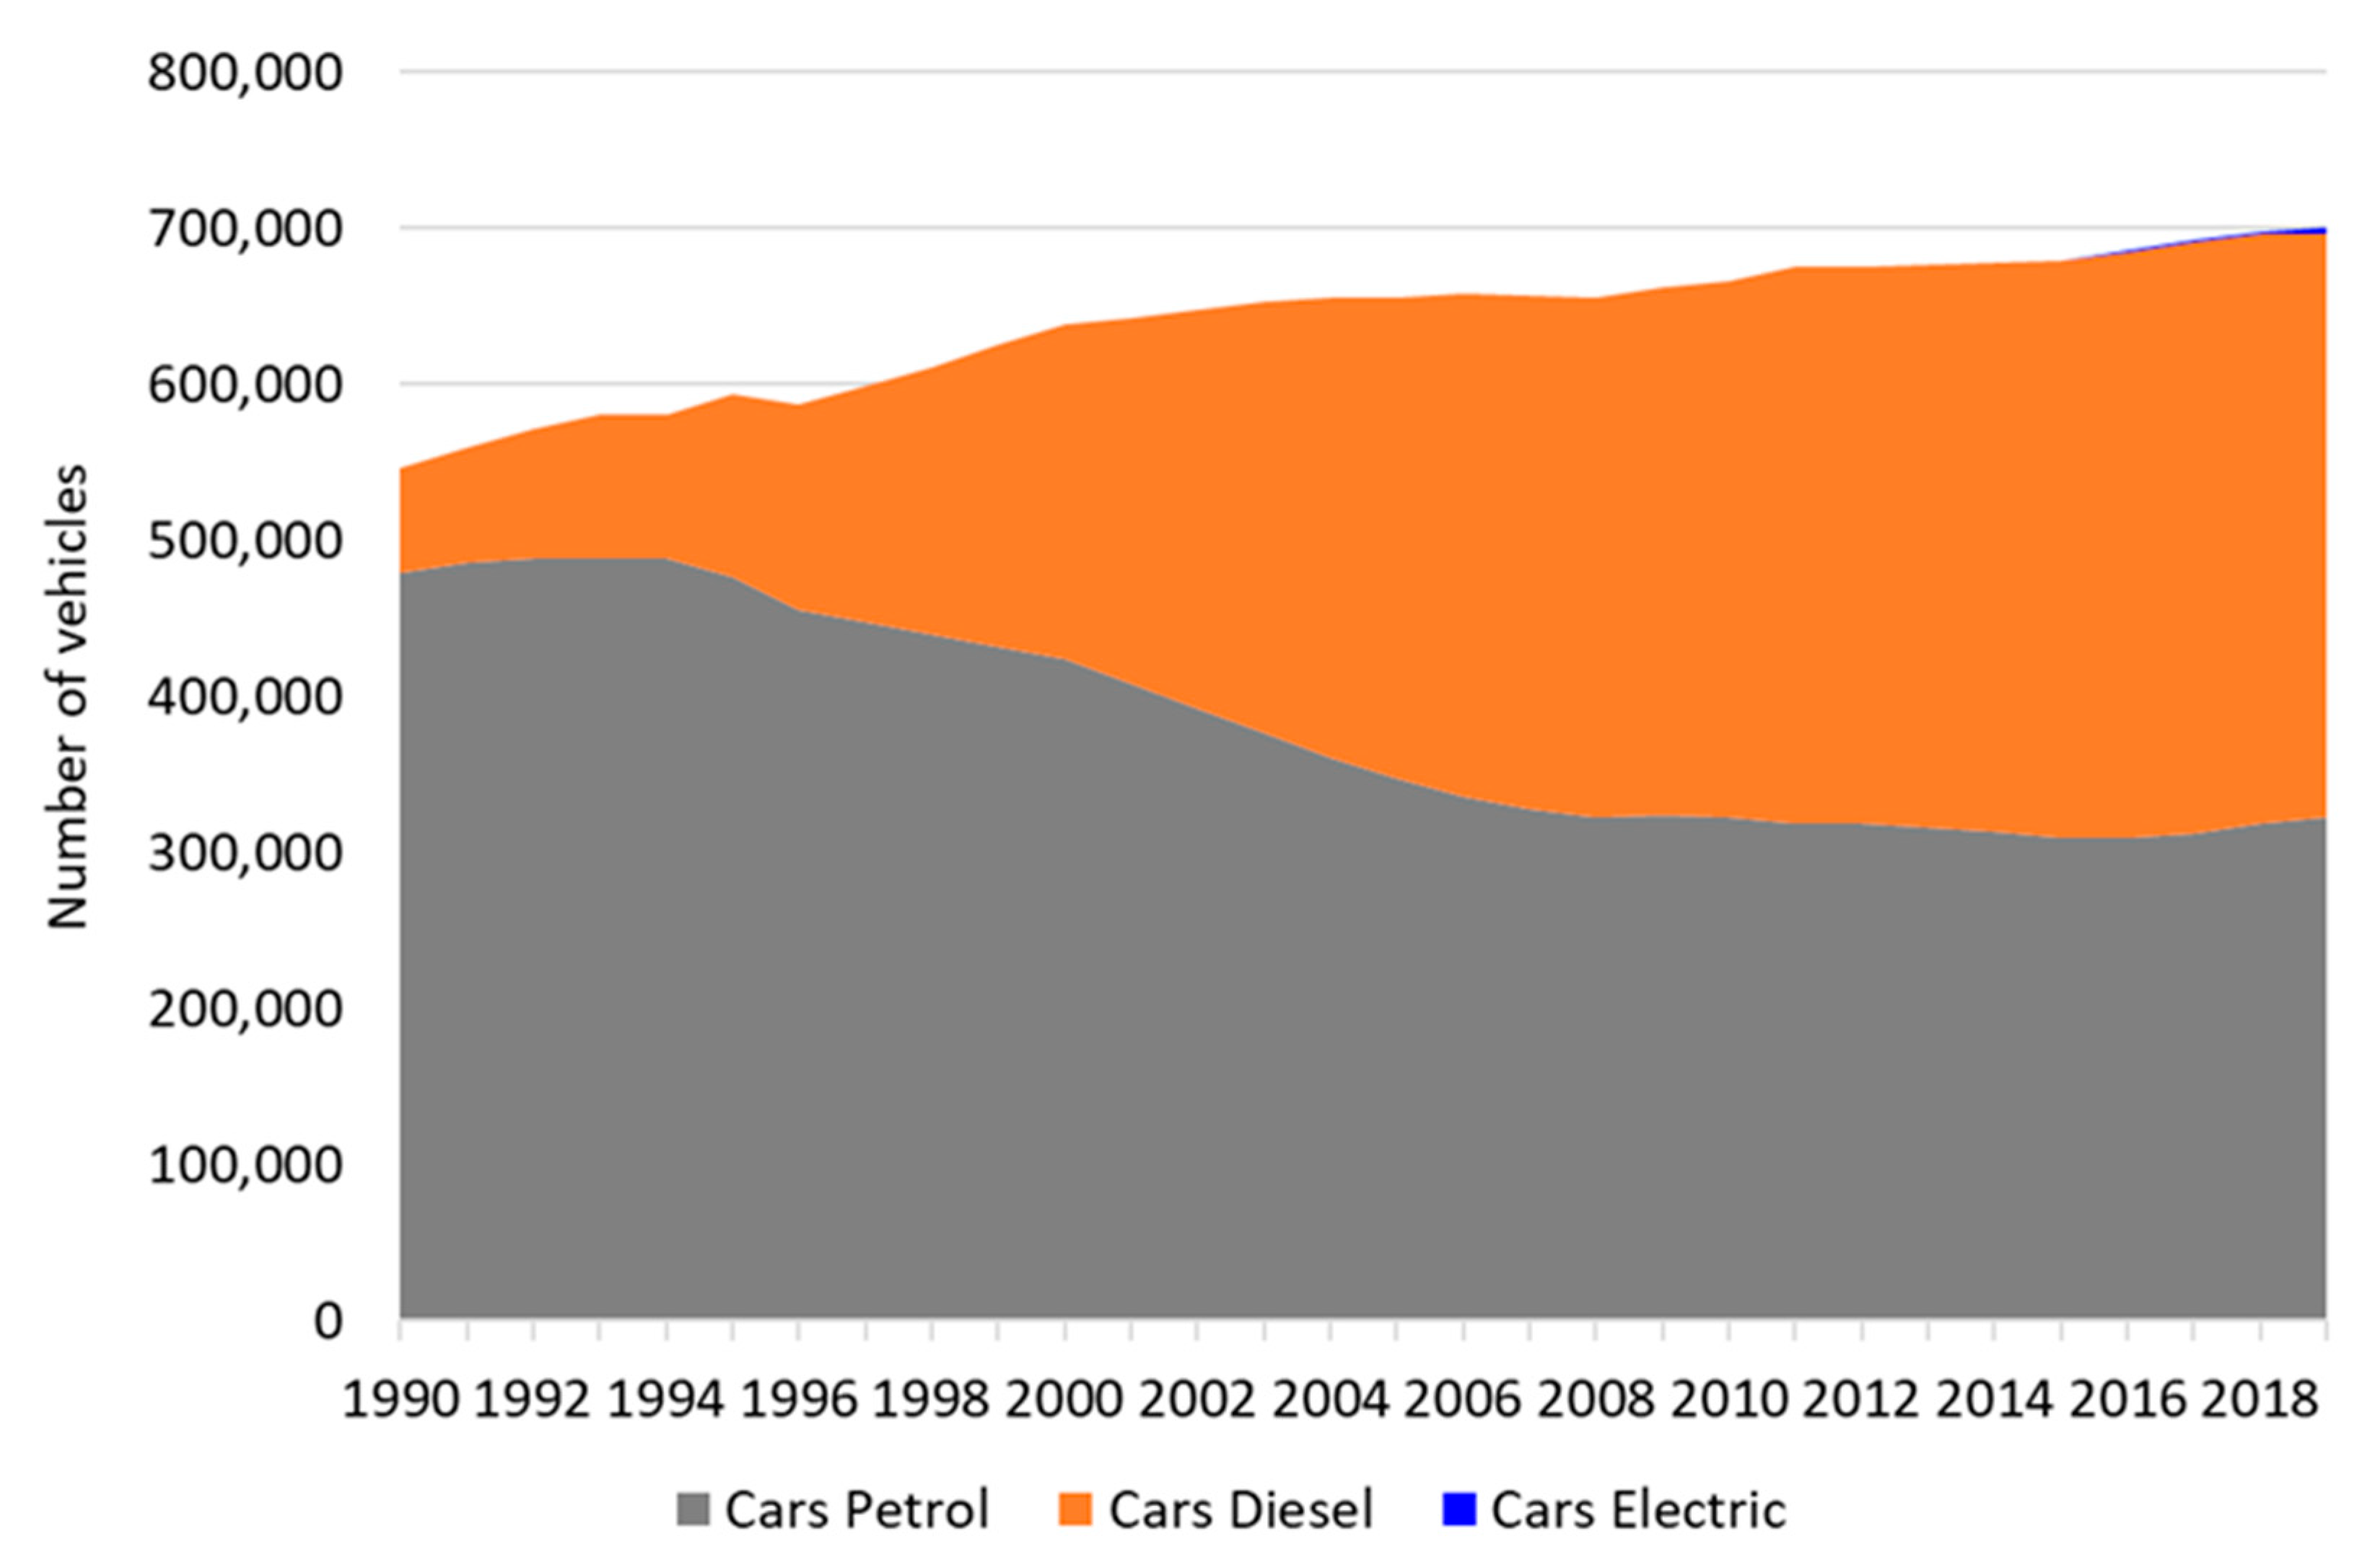
Figure 7 shows the development of the passenger car stock from 1990 to 2019. Private passenger mobility is dominated by conventional internal combustion engine vehicles, powered by petrol and diesel.
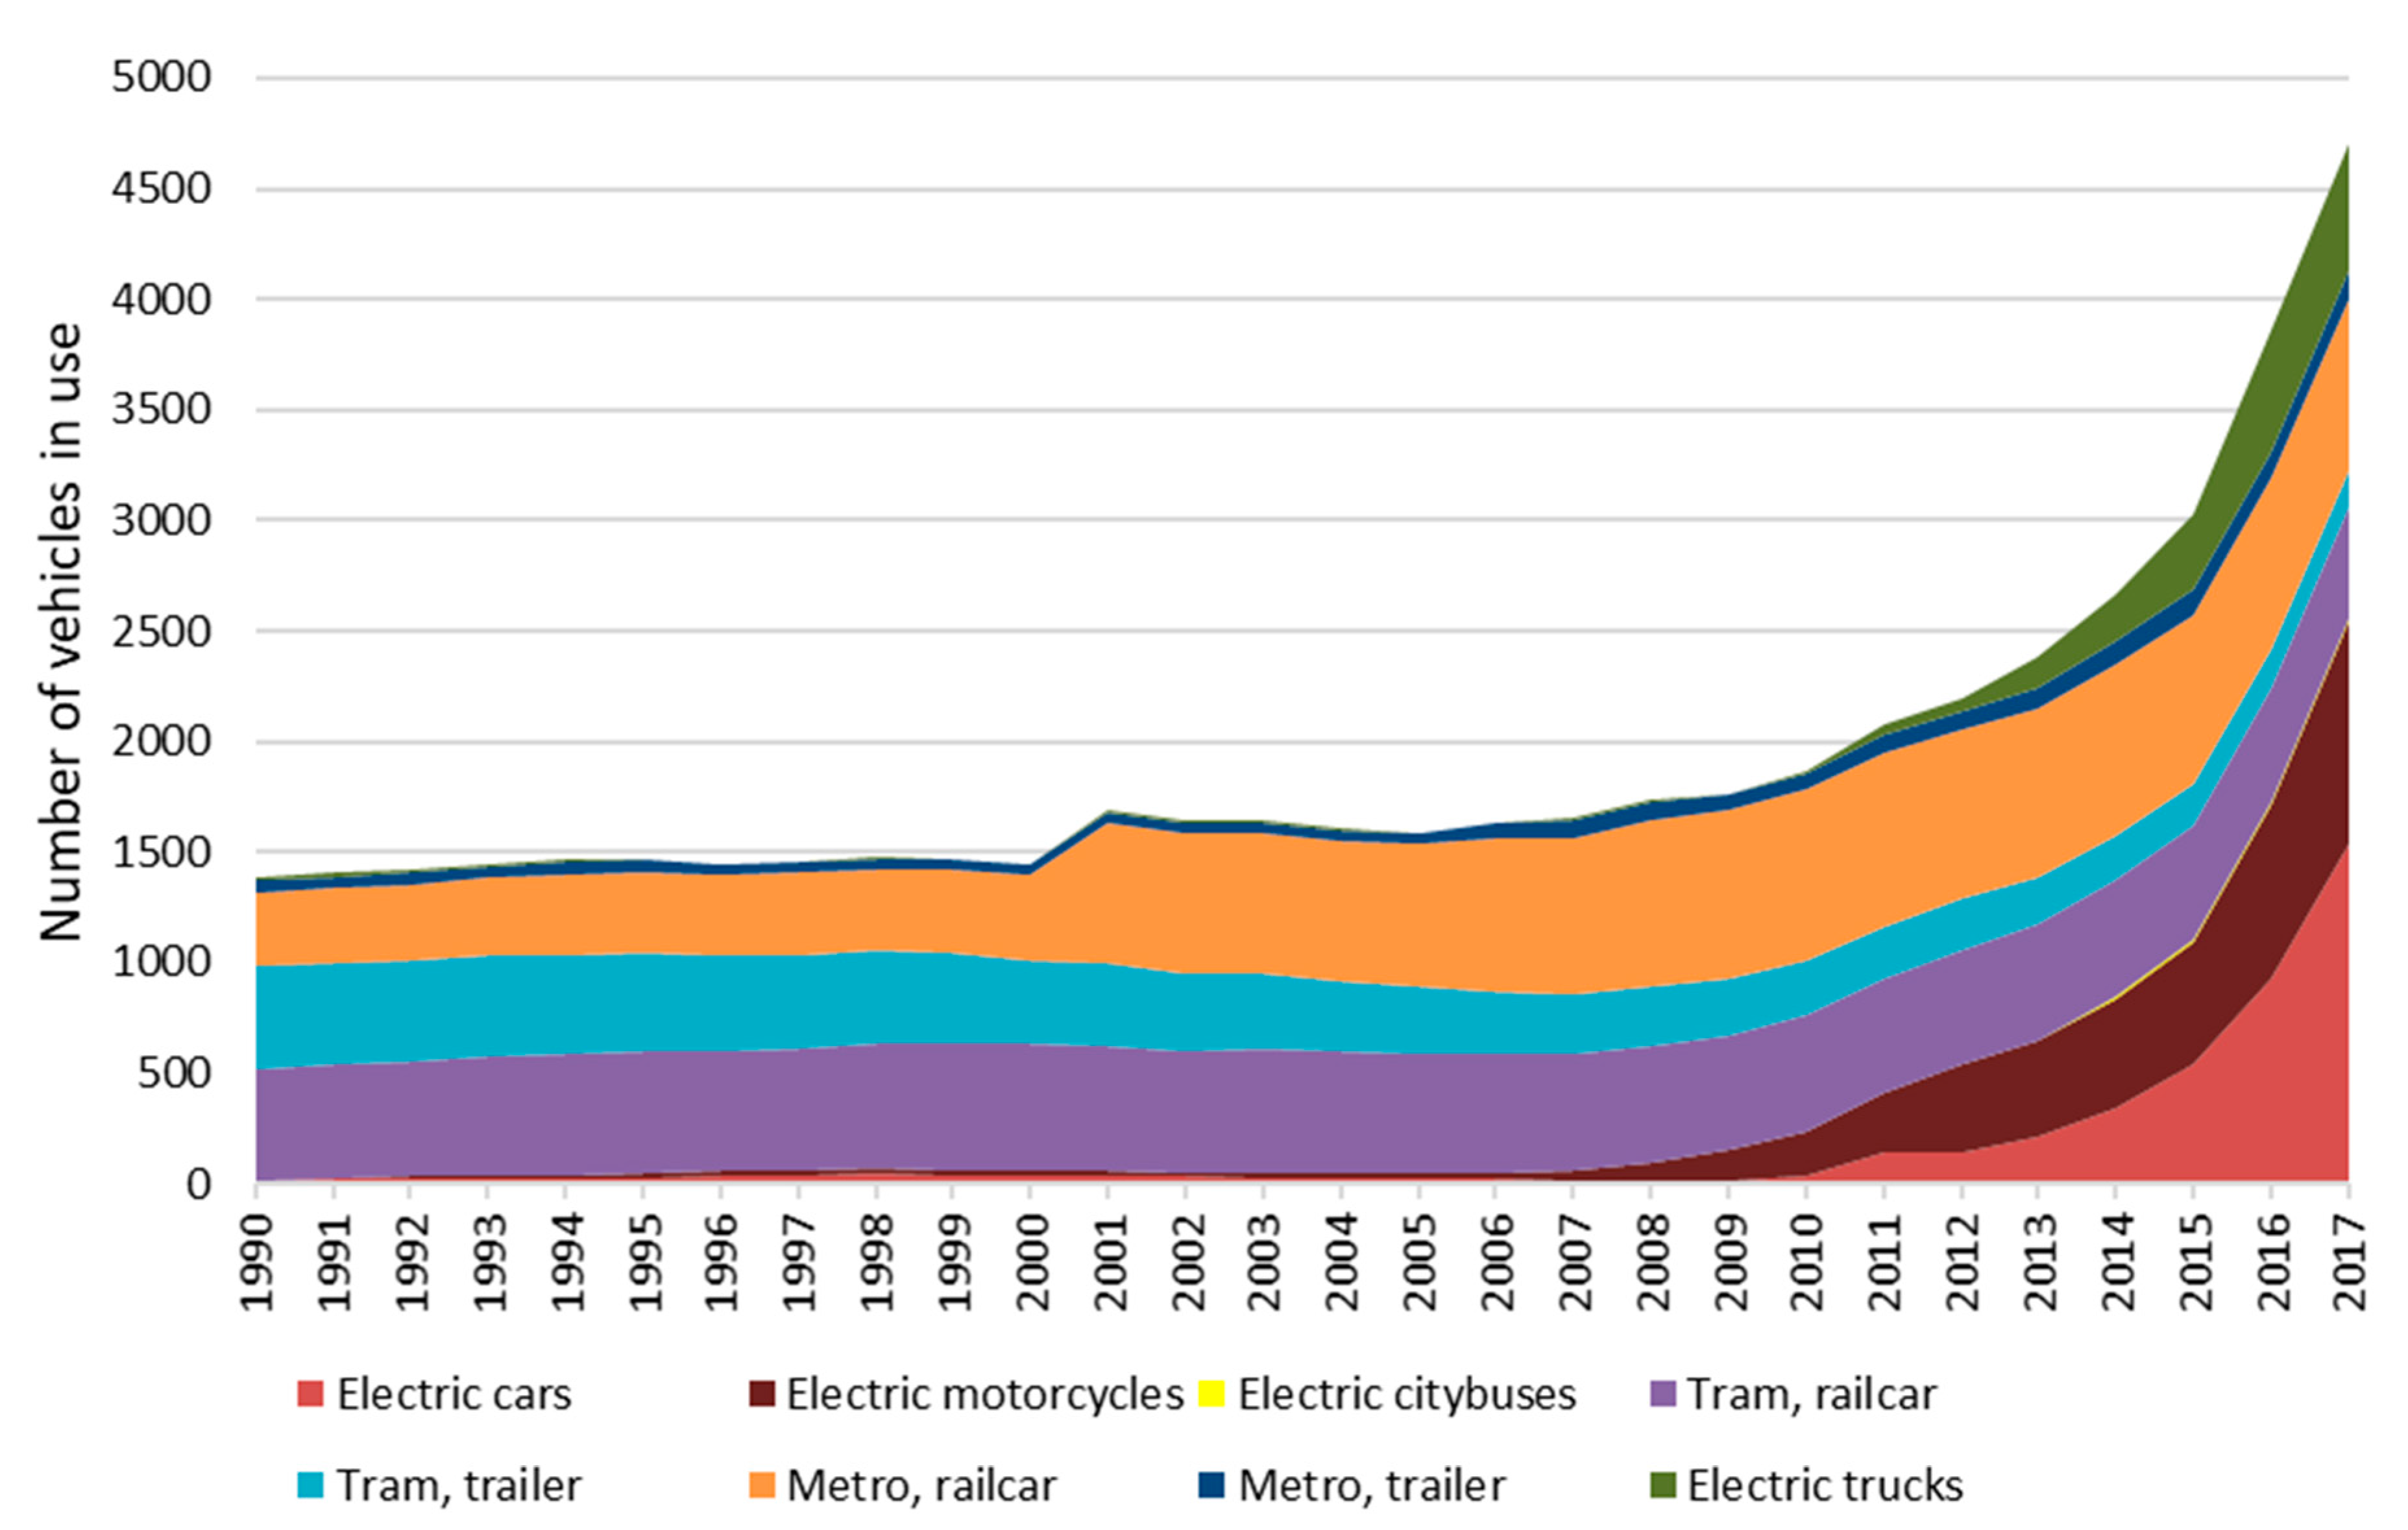
However, the total number of electric vehicles used for private and public mobility is rapidly increasing over time; see
Figure 8. Since 2010, electric cars, motorcycles and trucks have shown significant growth in their stock numbers.
In 2001, Wiener Linien, Vienna’s public transport operator, fundamentally changed its counting method of underground trains. This explains the immediate growth of metro railcar stock between 2000 and 2001.
The number of underground railcars is significantly higher than the number of underground trailers. The standard U-type underground train has six railcar wagons (three twin railcars). The type T has mostly four railcars. Type V consists of six wagons, with the end-wagons as trailers without a propulsion system, meaning a type V metro train regularly consists of two trailers and four railcars.
3. Policy Framework
With the oil crisis in the 1970s, it became apparent that traffic could not continue to grow only based on fossil fuels. At first, measures such as restrictions in car use, e.g., leaving the car at home one day a week were implemented. In addition, in the 1980s, the extension of local public transport was accelerated. Due to environmental problems, freight transport was transferred from road to rail. The Transport Master Plan [
19] was published in 1991 with the goal to improve the attractiveness of public transport, to reduce road-traffic-related emissions (noise and air pollution) and to introduce the concept of true costs in the transport sector.
The Traffic Concept for Vienna was first published in 1969. Since then, new transport and mobility concepts have been adopted every ten years. Currently, the policy framework in Vienna is based on policies and targets set on the EU and Austrian national level. The most relevant documents on the EU level are the White Paper on Transport [
9], and the guidelines for Sustainable Urban Mobility Plans [
20]. On the national level, the most important documents are the Energy Strategy Austria from 2010 and the Transport Master Plan from 2013. With the Smart City Vienna Framework Strategy (2014), Vienna has committed to the European energy and climate targets [
21,
22]. the documents such as the Urban Development Plan (STEP 2025) from 2014, Urban Mobility Plan Vienna (2015) and E-Mobility Strategy (2016), the goals for the future development of mobility in Vienna are also clearly set.
The essential strategies relevant for the implementation of e-Mobility are [
22]:
- -
Development of a master plan for electric mobility;
- -
Development of innovative business models, creating market rules for the provision and use of electricity and charging infrastructure;
- -
Creation of tax incentives to promote the procurement and distribution of electric vehicles;
- -
Information, motivation, training and awareness-raising.
There are different tax benefits and incentives provided for e-mobility. They can be divided into three categories: federal subsidies for private individuals, subsidies for companies and tax advantages.
Currently, individuals who purchase electric cars, e-mopeds, e-motorcycles and e-transport bikes receive subsidies. Prerequisites are the use of electricity from renewable energies with a range of at least 50 km and a gross list price of a maximum of €50,000. Electric and fuel cell vehicles are subsidized with €1500, plug-in hybrid and range extender with €750, e-motorcycles with €500, e-mopeds with €350 and e-transport bikes with €200. The purchase of e-charging stations is also subsidized. In addition, there are federal-state subsidies (e.g., €1000 per e-car in Lower Austria) [
23]. The same subsidies are also available for companies. However, the gross list price may not exceed €60,000.
Moreover, e-vehicles are exempt from the standard consumption tax (NoVA), the motor vehicle tax above 3.5 tons, and the motor-related insurance tax up to 3.5 tons. In addition, they are exempt from mineral oil tax (MÖSt), and only minor energy taxes (electricity) are payable [
24]. If an e-vehicle (max. 80,000 purchase price) is used for business purposes, there is the possibility of an input tax deduction (purchase costs, leasing expenses, operating costs) [
23].
Besides different tax benefits and incentives provided for e-mobility, there are also subsidiary programs provided with the goal to support implementation of various pilot and demonstrations projects, e.g., purchase of different types of electric vehicles (electric scooters, mopeds, motorcycles, electric bicycles), development of infrastructure, e-mobility management, e-fleets and e-logistics.
The City of Vienna supports expansion measures and enacts laws relevant to e-mobility. The Vienna Parking Garage Law stipulates the provisioning of empty cable ducts for future charging stations in new parking garages. Furthermore, it is recommended to provide charging infrastructure in semi-public areas such as parking slots and petrol stations. Strategic locations such as multimodal hubs are particularly suitable for the installation of charging infrastructure [
22].
E-vehicles are increasingly used in the logistics sector. This reduces emissions as well as noise and increases the performance coefficient. With the framework strategy “Smart City Vienna”, the City of Vienna has committed itself to cooperate with the logistics sector [
25].
Energy suppliers should follow existing systems like the Vienna Energy “tank” system. They should offer tailor-made business models and integrated solutions for private and business customers from a single source that are economically viable, suitable for everyday use and user-friendly (regarding the existing electrical power supply infrastructure, the installation of charging stations and energy billing) [
22].
One of the most important research projects in the field of e-Mobility is the E-Delivery on Demand’ (Tranform+) project, a mobility lab that has been running since 2015. At the Liesing Industrial Park, it tests how delivery services, car rentals and carpools can be organized more efficiently. The aim is to generate a pooled, demand-oriented and cost-efficient model with the use of e-vehicles [
22]. Another mobility lab is the aspern.mobil LAB, which deals with active mobility, mobility as a service as well as first- and last-mile logistics. The mobility lab thinkport VIENNA deals with freight logistics solely. The research program Mobility of the Future should also be mentioned here: it was started in 2012 and focuses on the sustainable and environmentally friendly development of alternative and innovative drive technologies and mobility solutions.
Furthermore, there is a big focus on raising the awareness of the general public regarding e-Mobility via campaigns. Advancements in e-mobility bring new jobs and thus a need for training and further education.
4. Method of Approach
In this section, the method of approach for the economic and environmental analyses conducted in this paper is documented. This approach is based on the Total Cost of Ownership calculation method of the total mobility costs [
26,
27], well-to-wheel methodology [
28,
29], as well as on the assessment framework developed in our previous works [
30,
31,
32].
For the economic assessment investment costs, energy costs and other operating and maintenance costs, as well as relevant taxes and incentives, are considered. The total costs per km driven
Ckm are calculated as:
where:
IC: investment costs [€/car]
α: Α capital recovery factor
skm: specific km driven per car per year [km/(car.yr)]
Pf: energy price incl. taxes [€/kWh]
CO&M: operating and maintenance costs
FI: energy intensity [kWh/100 km].
The environmental assessment is divided into assessment of well-to-tank (WTT) and tank-to-wheel (TTW) emissions. In addition, emissions embedded in the car (TTW
car) are included in the analysis. WTT emissions in the fuel cycle are calculated using the following equation:
where:
fprCO2: CO2 emission factor of primary energy
Epr: primary energy input.
TTW emissions in the fuel cycle are calculated using data for the energy intensity of vehicles and the specific CO
2 emission factors of energy used, as well as depending on the specific number of kilometers driven per year:
where:
fCO2: CO2 emission factor of fuels
FI: fuel intensity
skm: specific km driven per year and car.
The embedded emissions of the car are calculated per year and kilometers driven as:
where:
CO2car: CO2 emissions of car manufacturing including materials
LT: lifetime of car.
Finally, the total CO
2-emissions are calculated as the sum of all emissions related to energy use including the embedded emissions of the car:
5. Costs of Private and Public Mobility
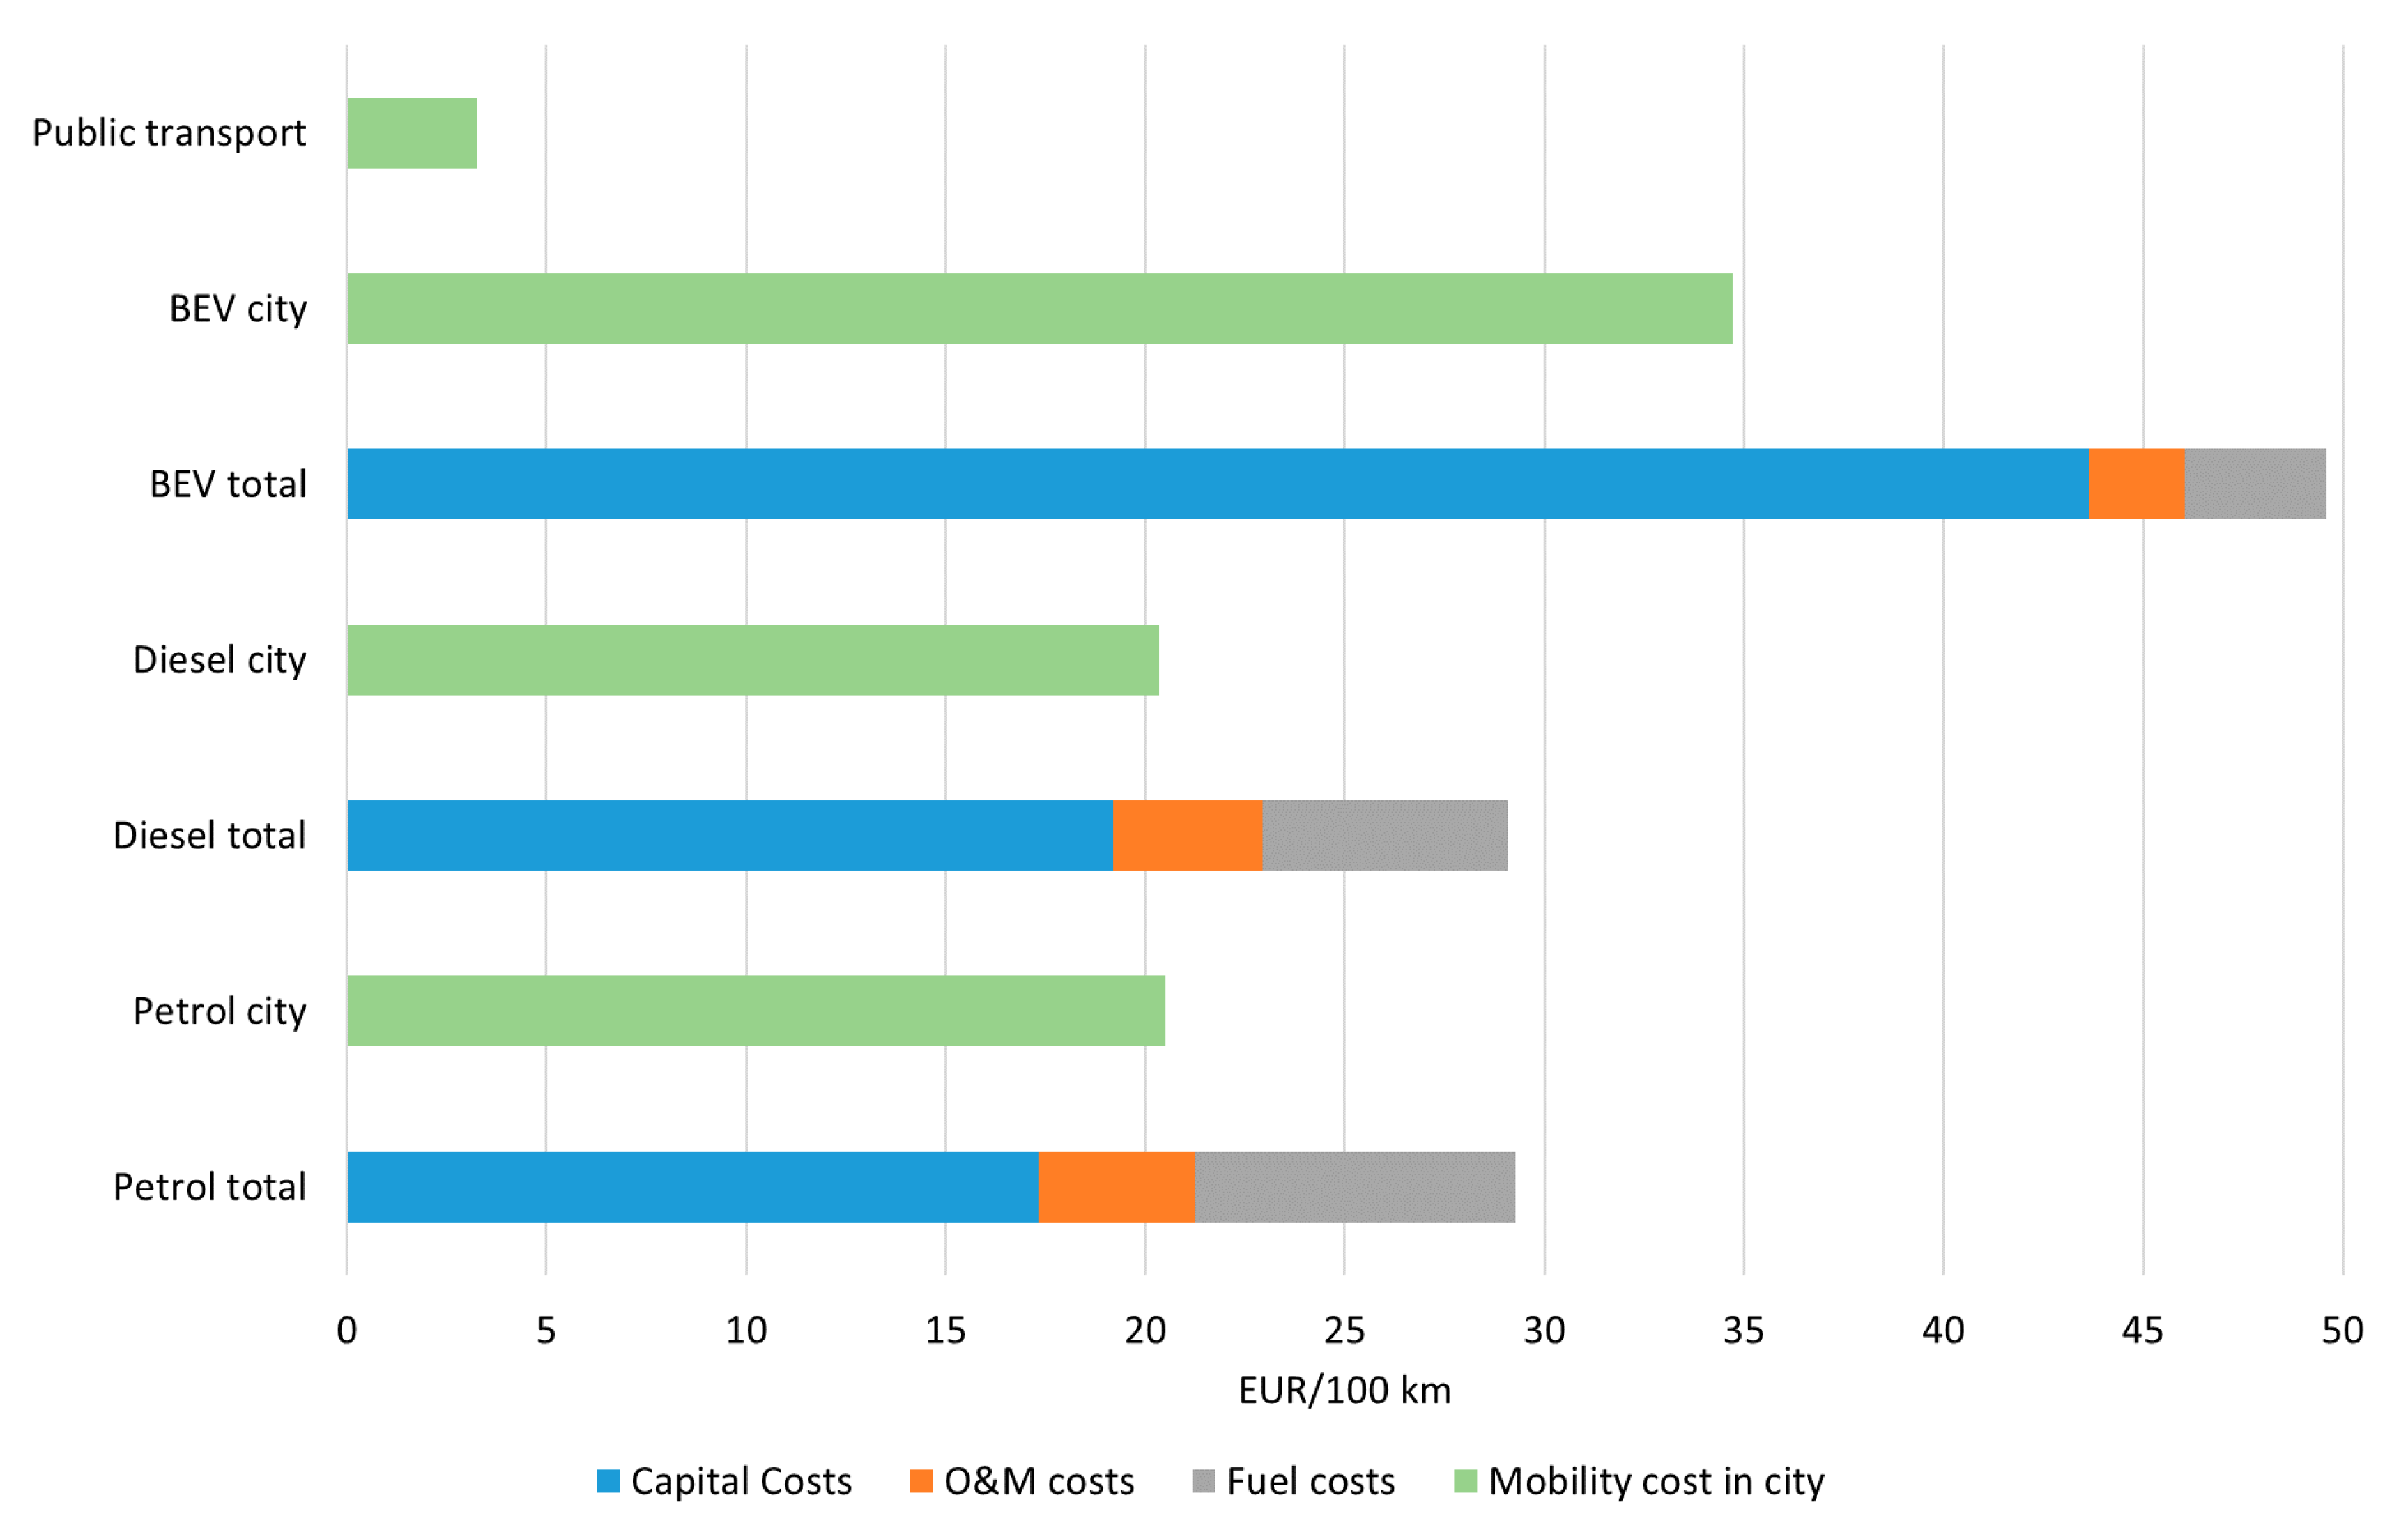
One of the major reasons for the low number of battery electric vehicles (BEV) is related to their higher mobility costs in comparison to conventional vehicles.
Figure 9 depicts the structure of total mobility costs per 100 km driven for conventional petrol and diesel cars in comparison to battery electric vehicles, assuming 16,000 km driven per year for all car types and 70% of the total travel activity in Vienna. It can be seen that the advantage of lower energy costs in the case of electric vehicles is currently more than compensated by higher capital costs; see
Figure 9. They are currently not economically competitive with conventional cars. Moreover, considering the same travel activity, it is obvious that public transport is by far the cheapest mobility option in Vienna.
The major assumptions for the calculation of the total mobility costs of passenger cars per 100 km driven in 2018 are given in
Table 1. In the case of private cars, there is a significant price difference in mobility depending on the vehicle type and energy used. However, in the case of public transport, the situation is completely different. In Vienna, all public transport means have the same price. Nevertheless, the most expensive is to purchase single tickets, and cheapest to have an annual ticket for public transport. The annual ticket is valid on all means of public transport within Vienna for exactly 365 days. It costs on average 1 EUR per day. This is the reason that the number of such tickets is rapidly increasing. In 2018, 822,000 annual tickets were sold.
It is of course clear that the number of km driven is not the same for all transport technologies and modes. Yet for the sake of comparison, the same number of km driven is assumed for all vehicles, and 70% of the total travel activity is in the city.
6. Environmental Assessment
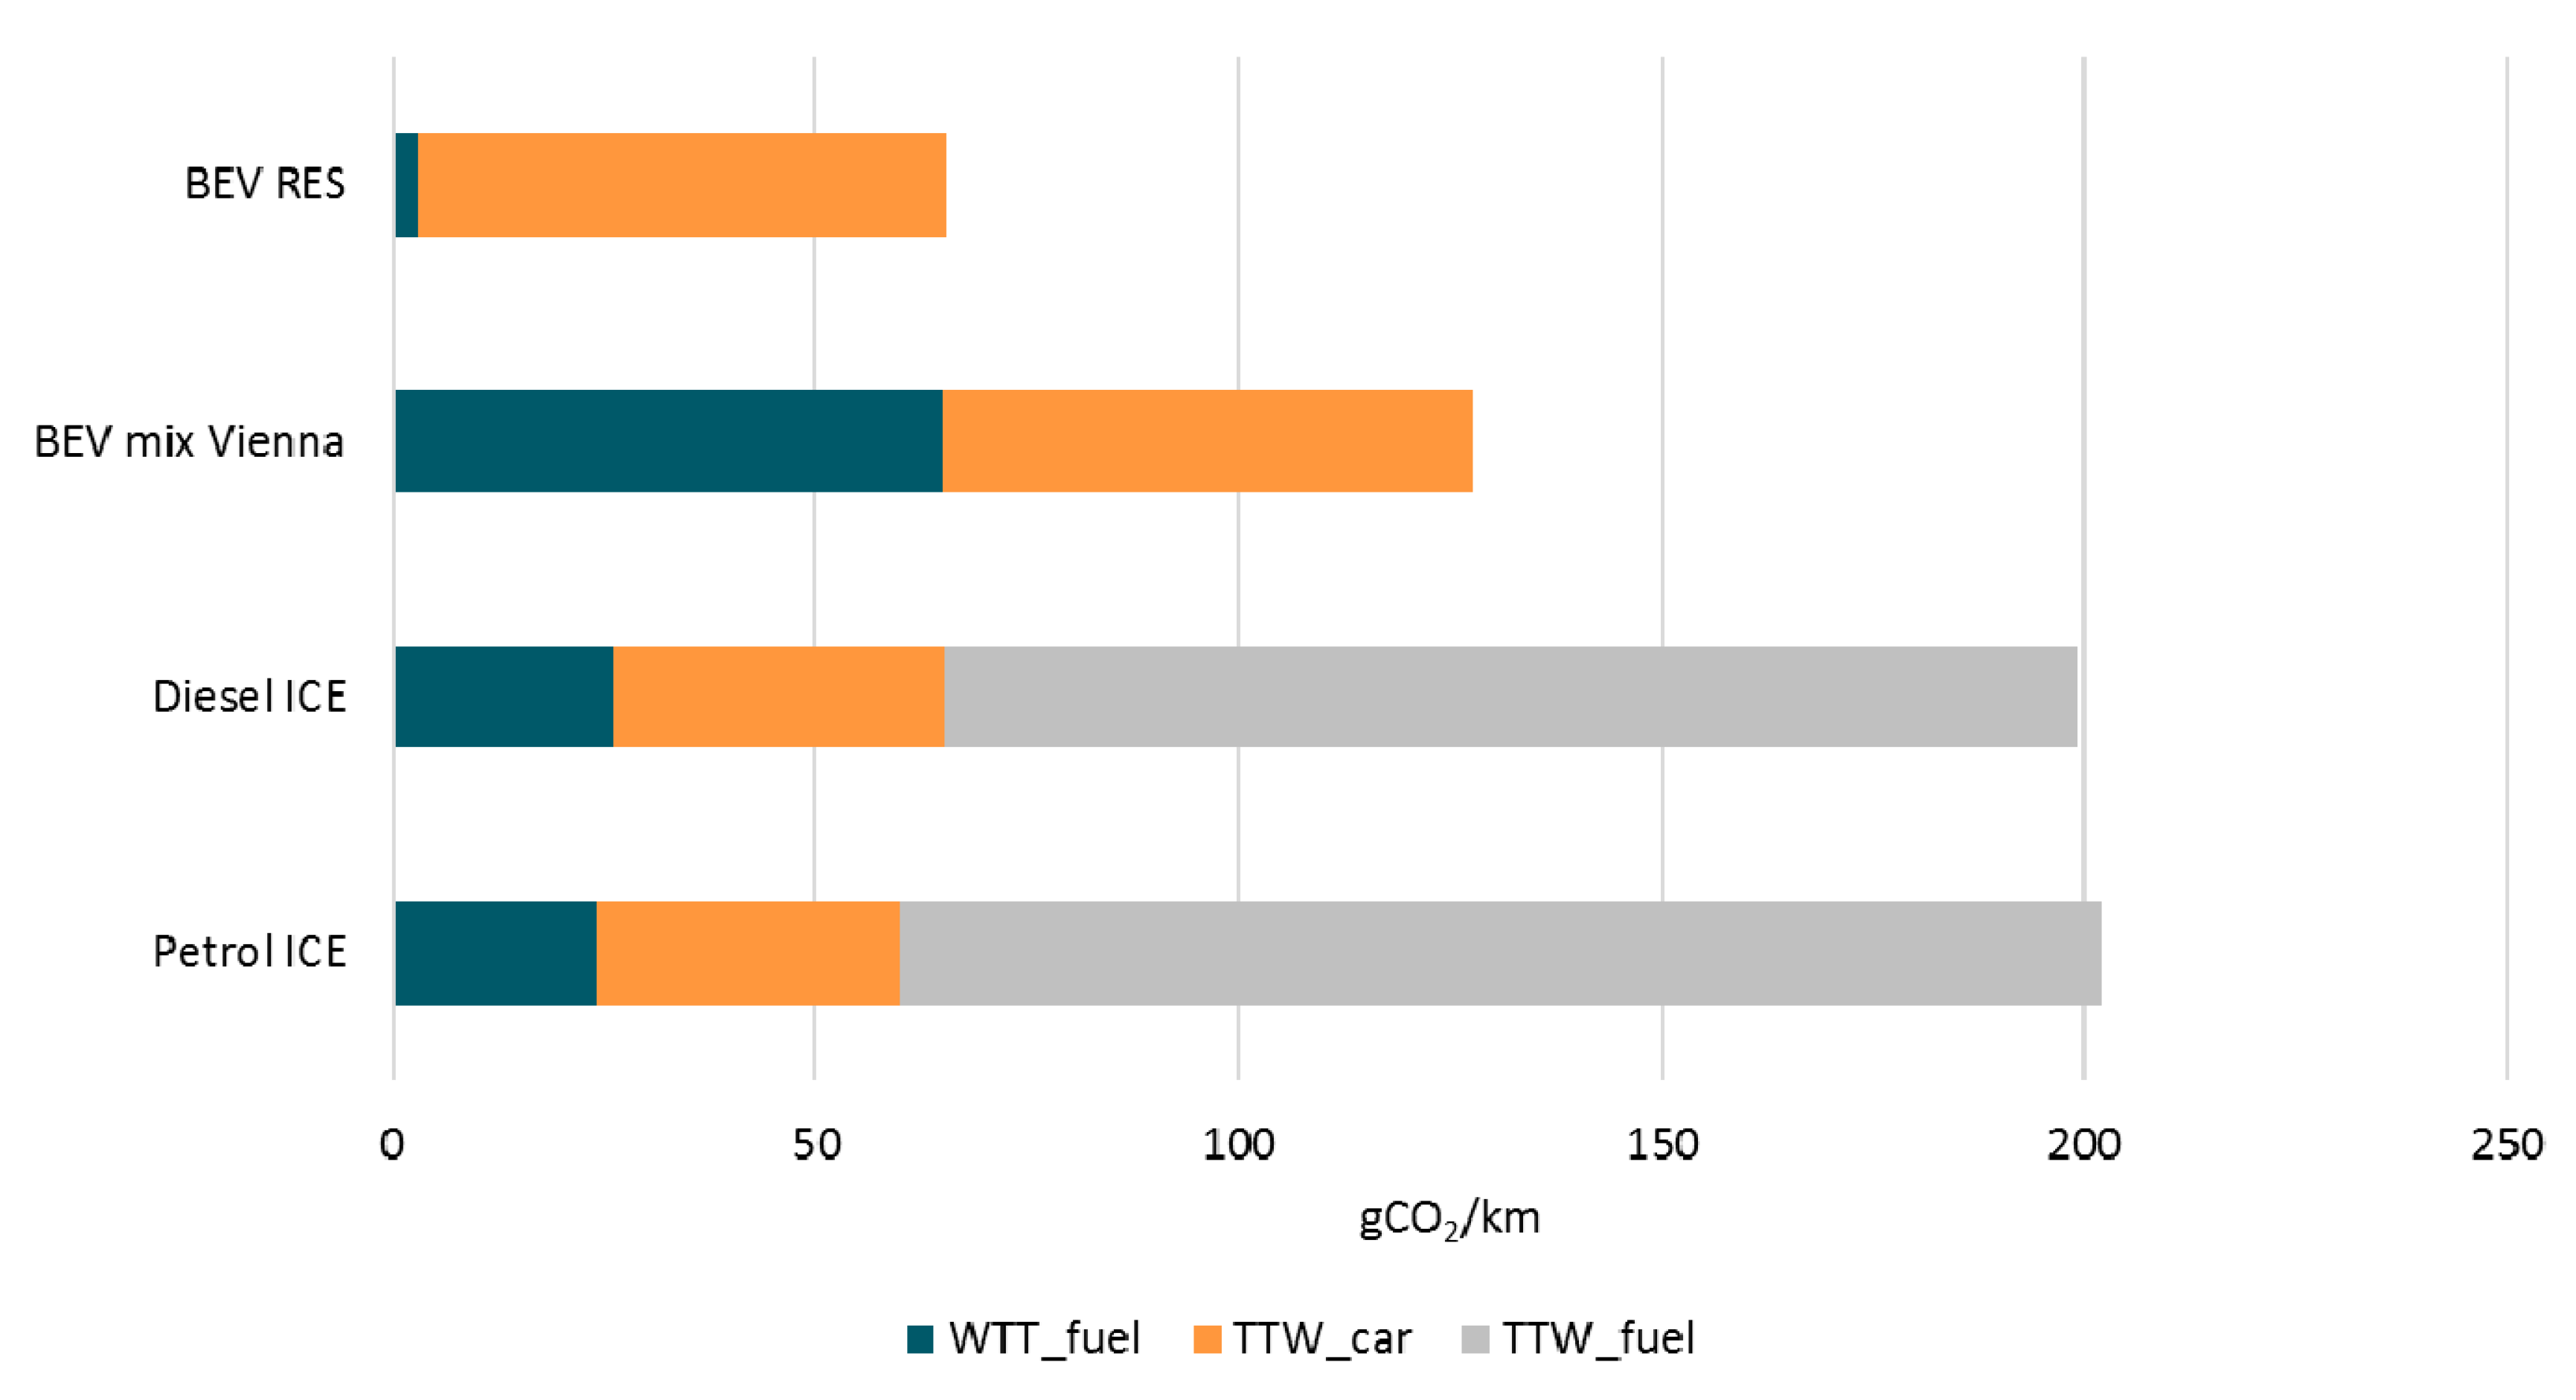
In the following, at first, the current CO
2 emissions of battery-electric and conventional vehicles are compared, considering different primary energy sources; see
Figure 10. Note that in overall CO
2 emissions, the embedded CO
2-emissions of car and battery production as well as of the materials used (
TTWcar) are included. For BEV, two different cases are analyzed, one with electricity produced from renewable energy sources (RES), and one with the electricity generation mix in Vienna in 2018, which is largely dominated by natural gas-fired power plants. A major perception of this figure is that despite the fact that BEVs do not emit CO
2 at the point of use (
TTWfuel), their full environmental benefits are possible if the electricity used is generated from renewable energy sources and not in fossil power plants.
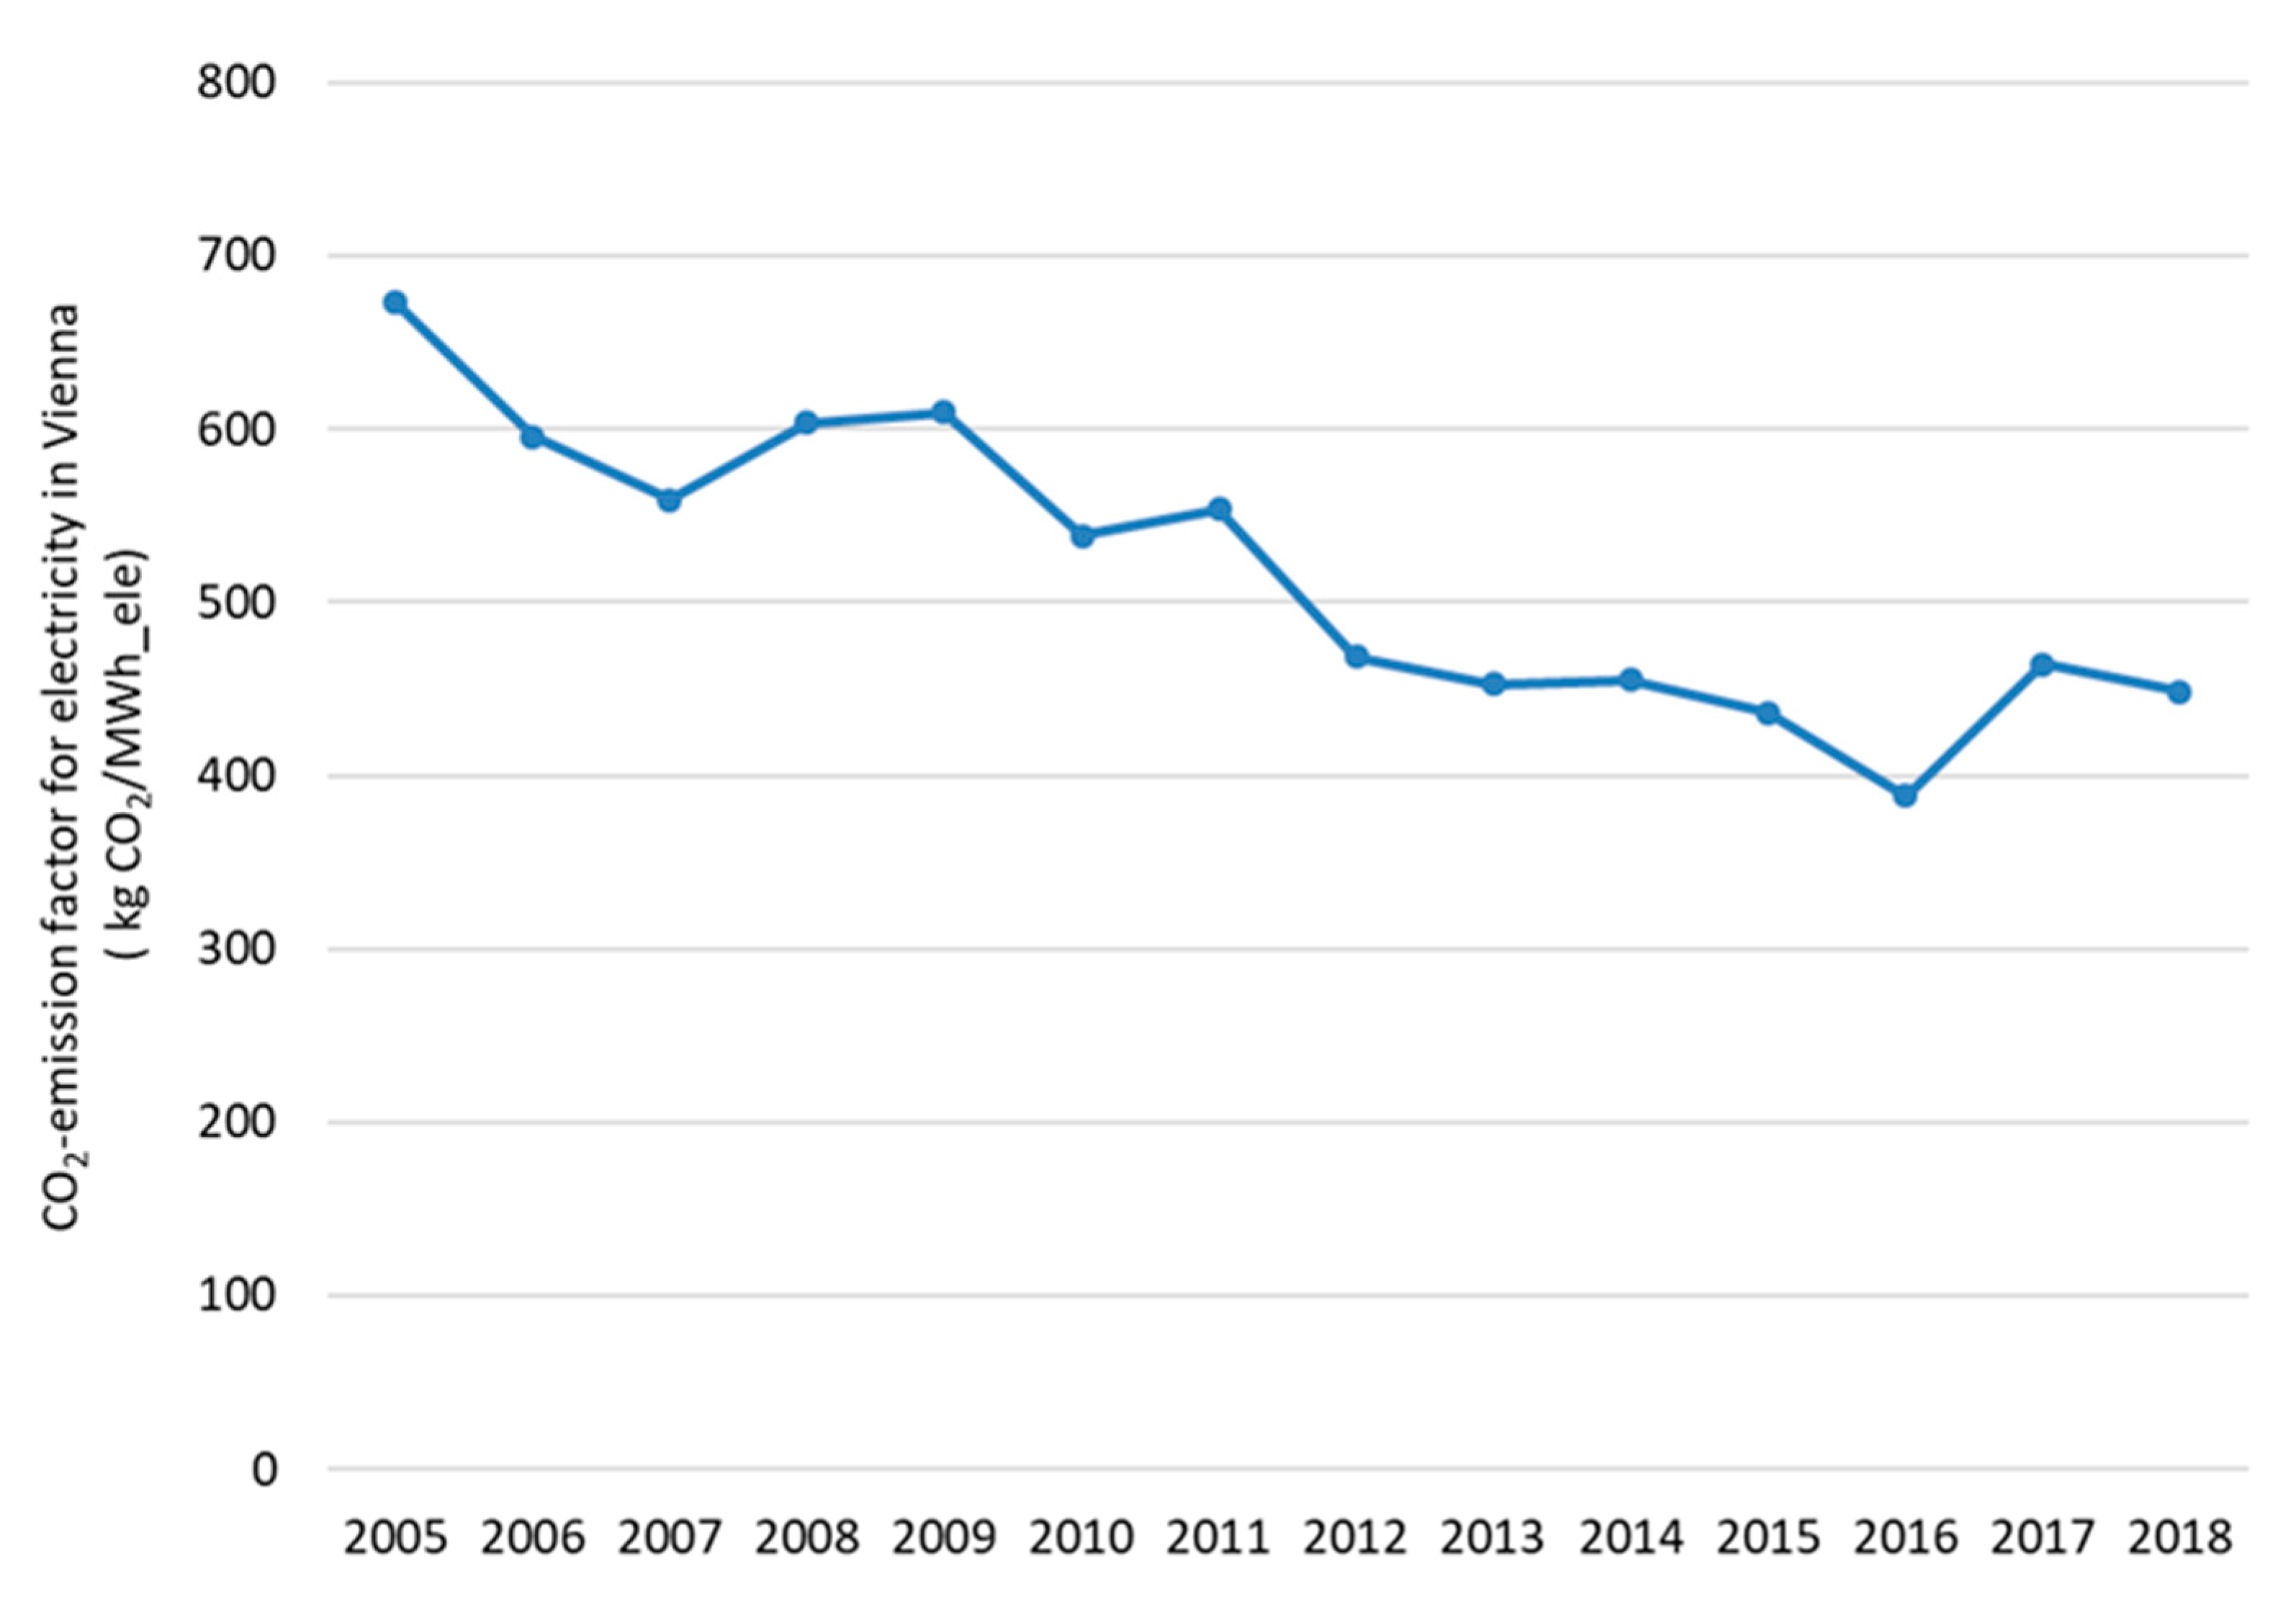
WTT emissions of BEVs are very dependent on the primary energy sources used for electricity generation. The historical development of the CO
2-emission factor of electricity used in Vienna is shown in
Figure 11. For electricity, the emission factor of primary energy f
prCO2 is calculated for every year based on the stock of Viennese power plants and the electricity imports. It can be seen in
Figure 11 that over time, a continuous decrease took place. However, in Vienna, this factor is still very high compared to the Austrian average (it was 264 kg CO
2/MWh in 2018). The possible future developments of this factor up to 2030 are sketched at the end of
Section 7.
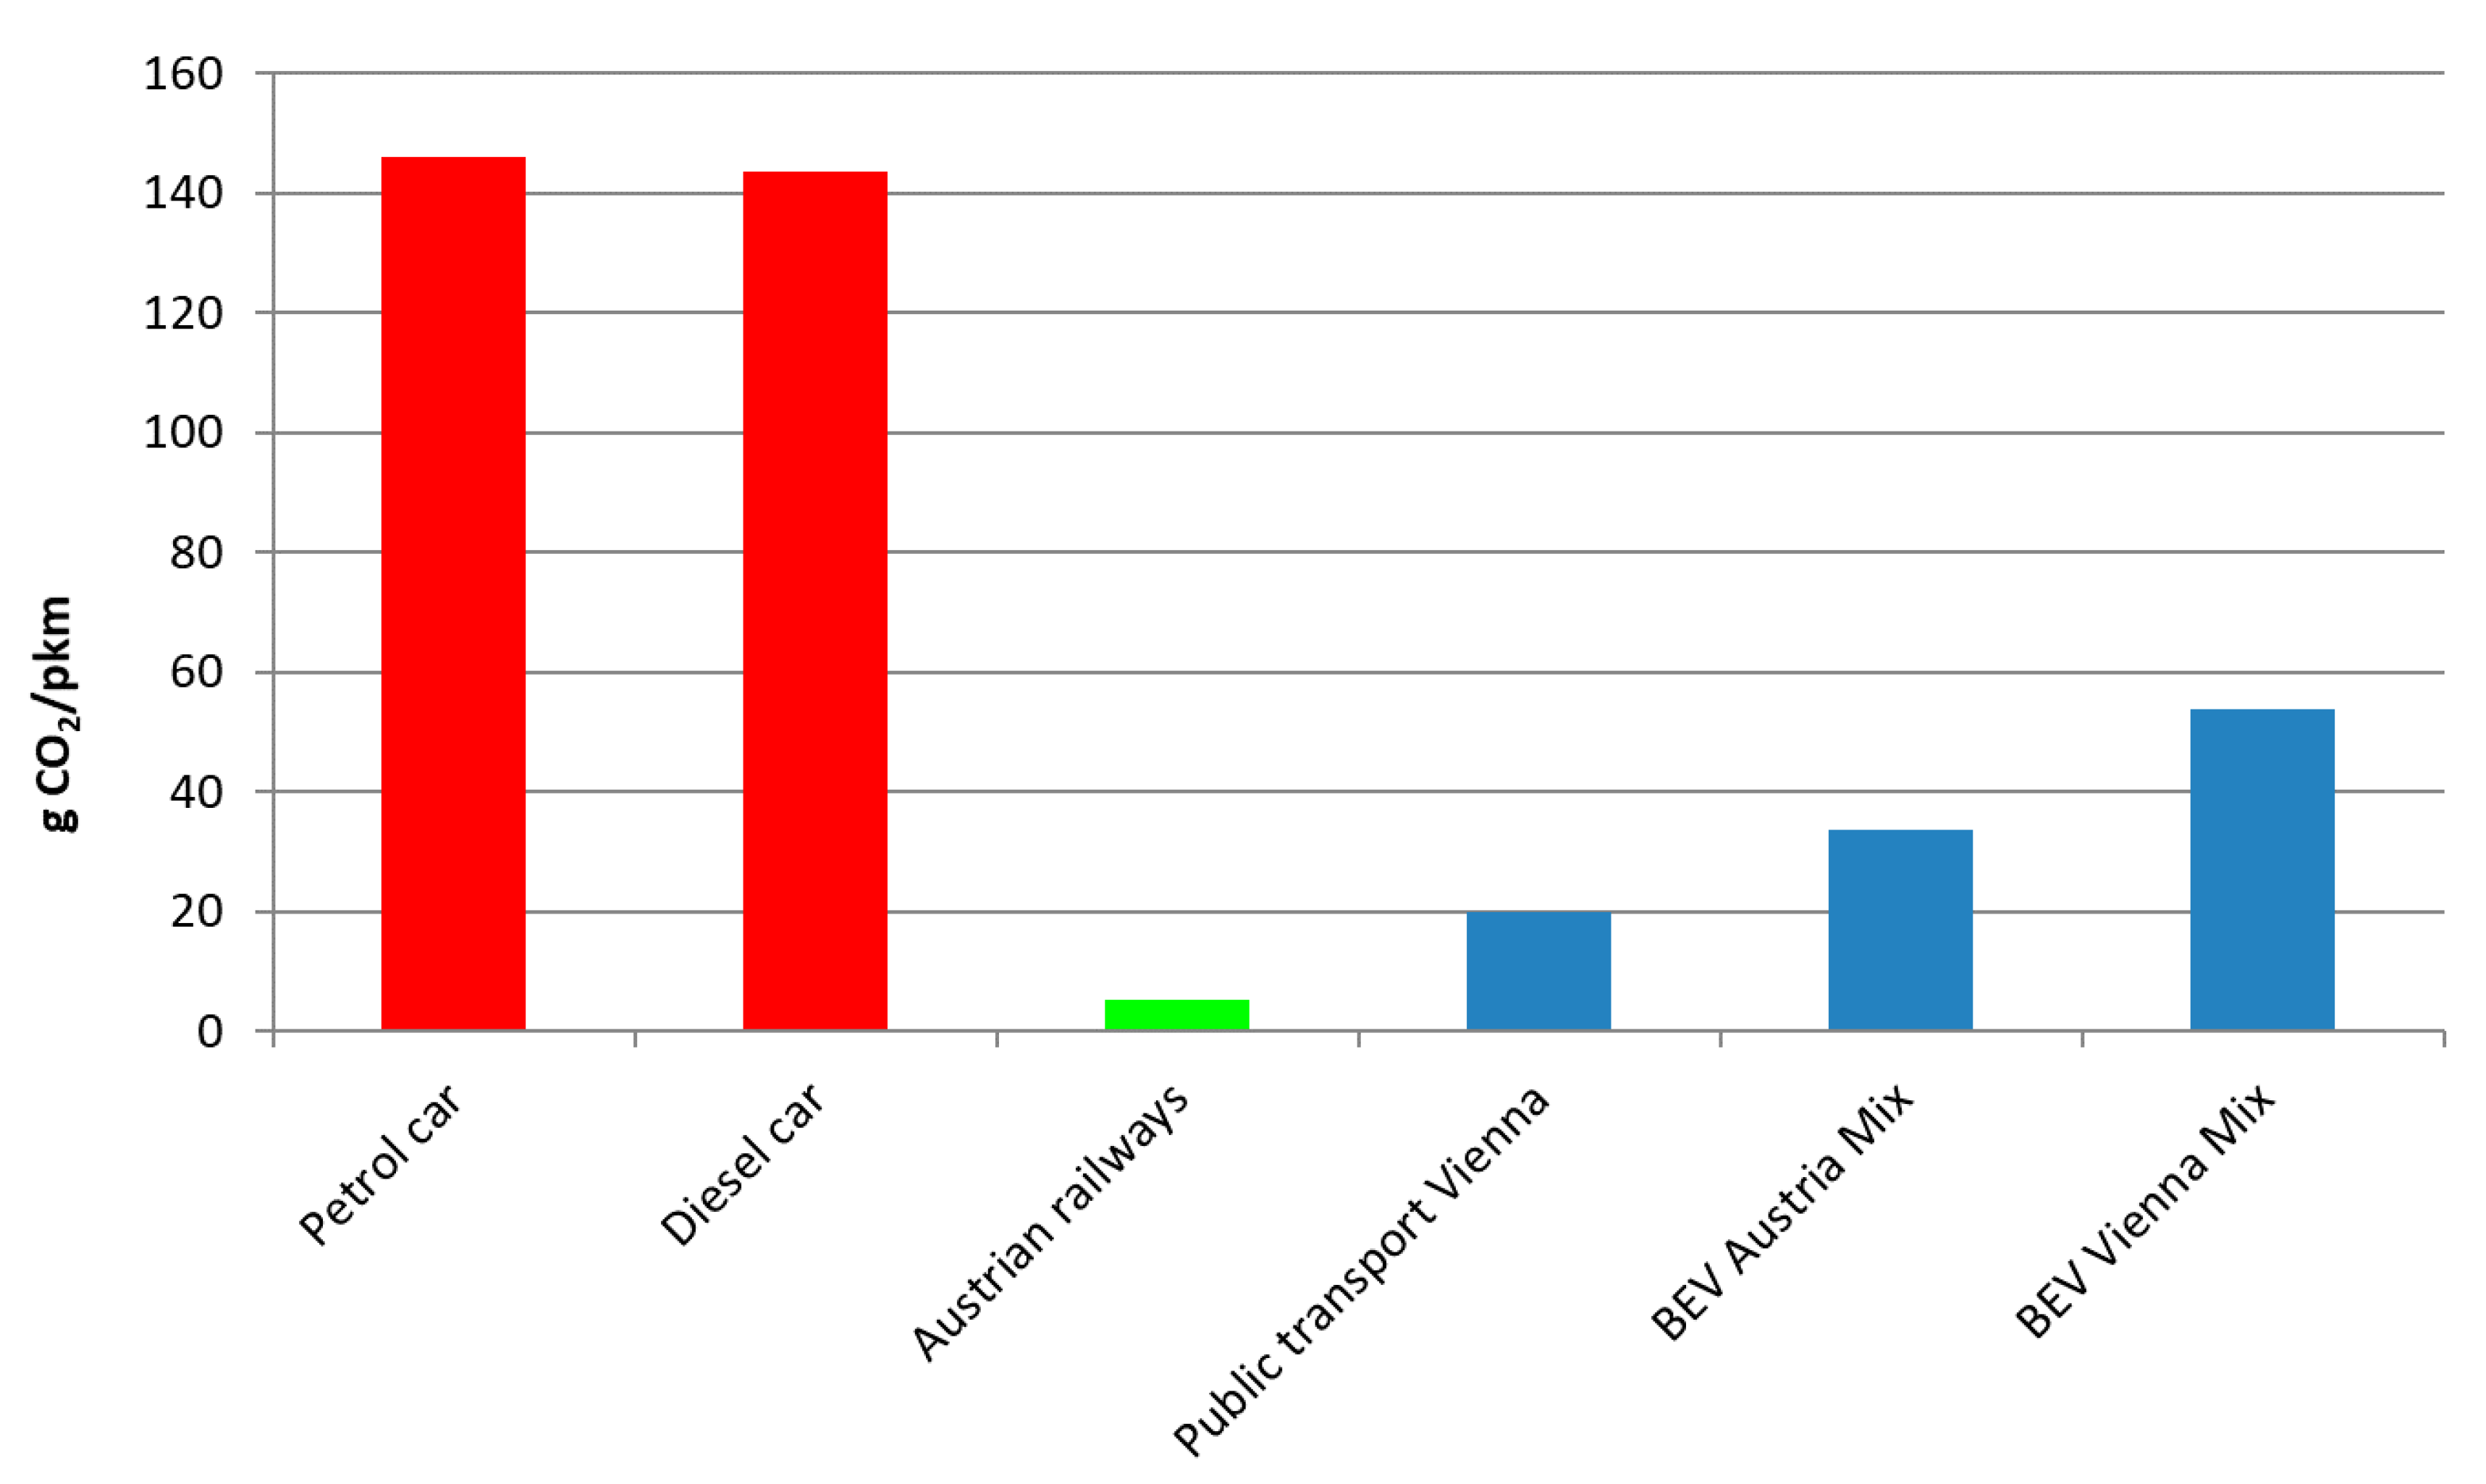
Based on this emission factor, it is possible to compare the emissions of public transport, Austrian railways and passenger cars.
Figure 12 shows a comparison of CO
2 emissions of various transport modes in Vienna in 2018. For BEV, CO
2 emission factor in Vienna is used, according to
Figure 11. The figure of Austrian railways is from their own electricity generation portfolio, which almost solely consists of hydropower plants. The number for BEV Austria builds on 72% RES in the Austrian electricity mix. Public transport in Vienna builds on the same electricity generation mix as BEV in Vienna, yet with a higher occupation.
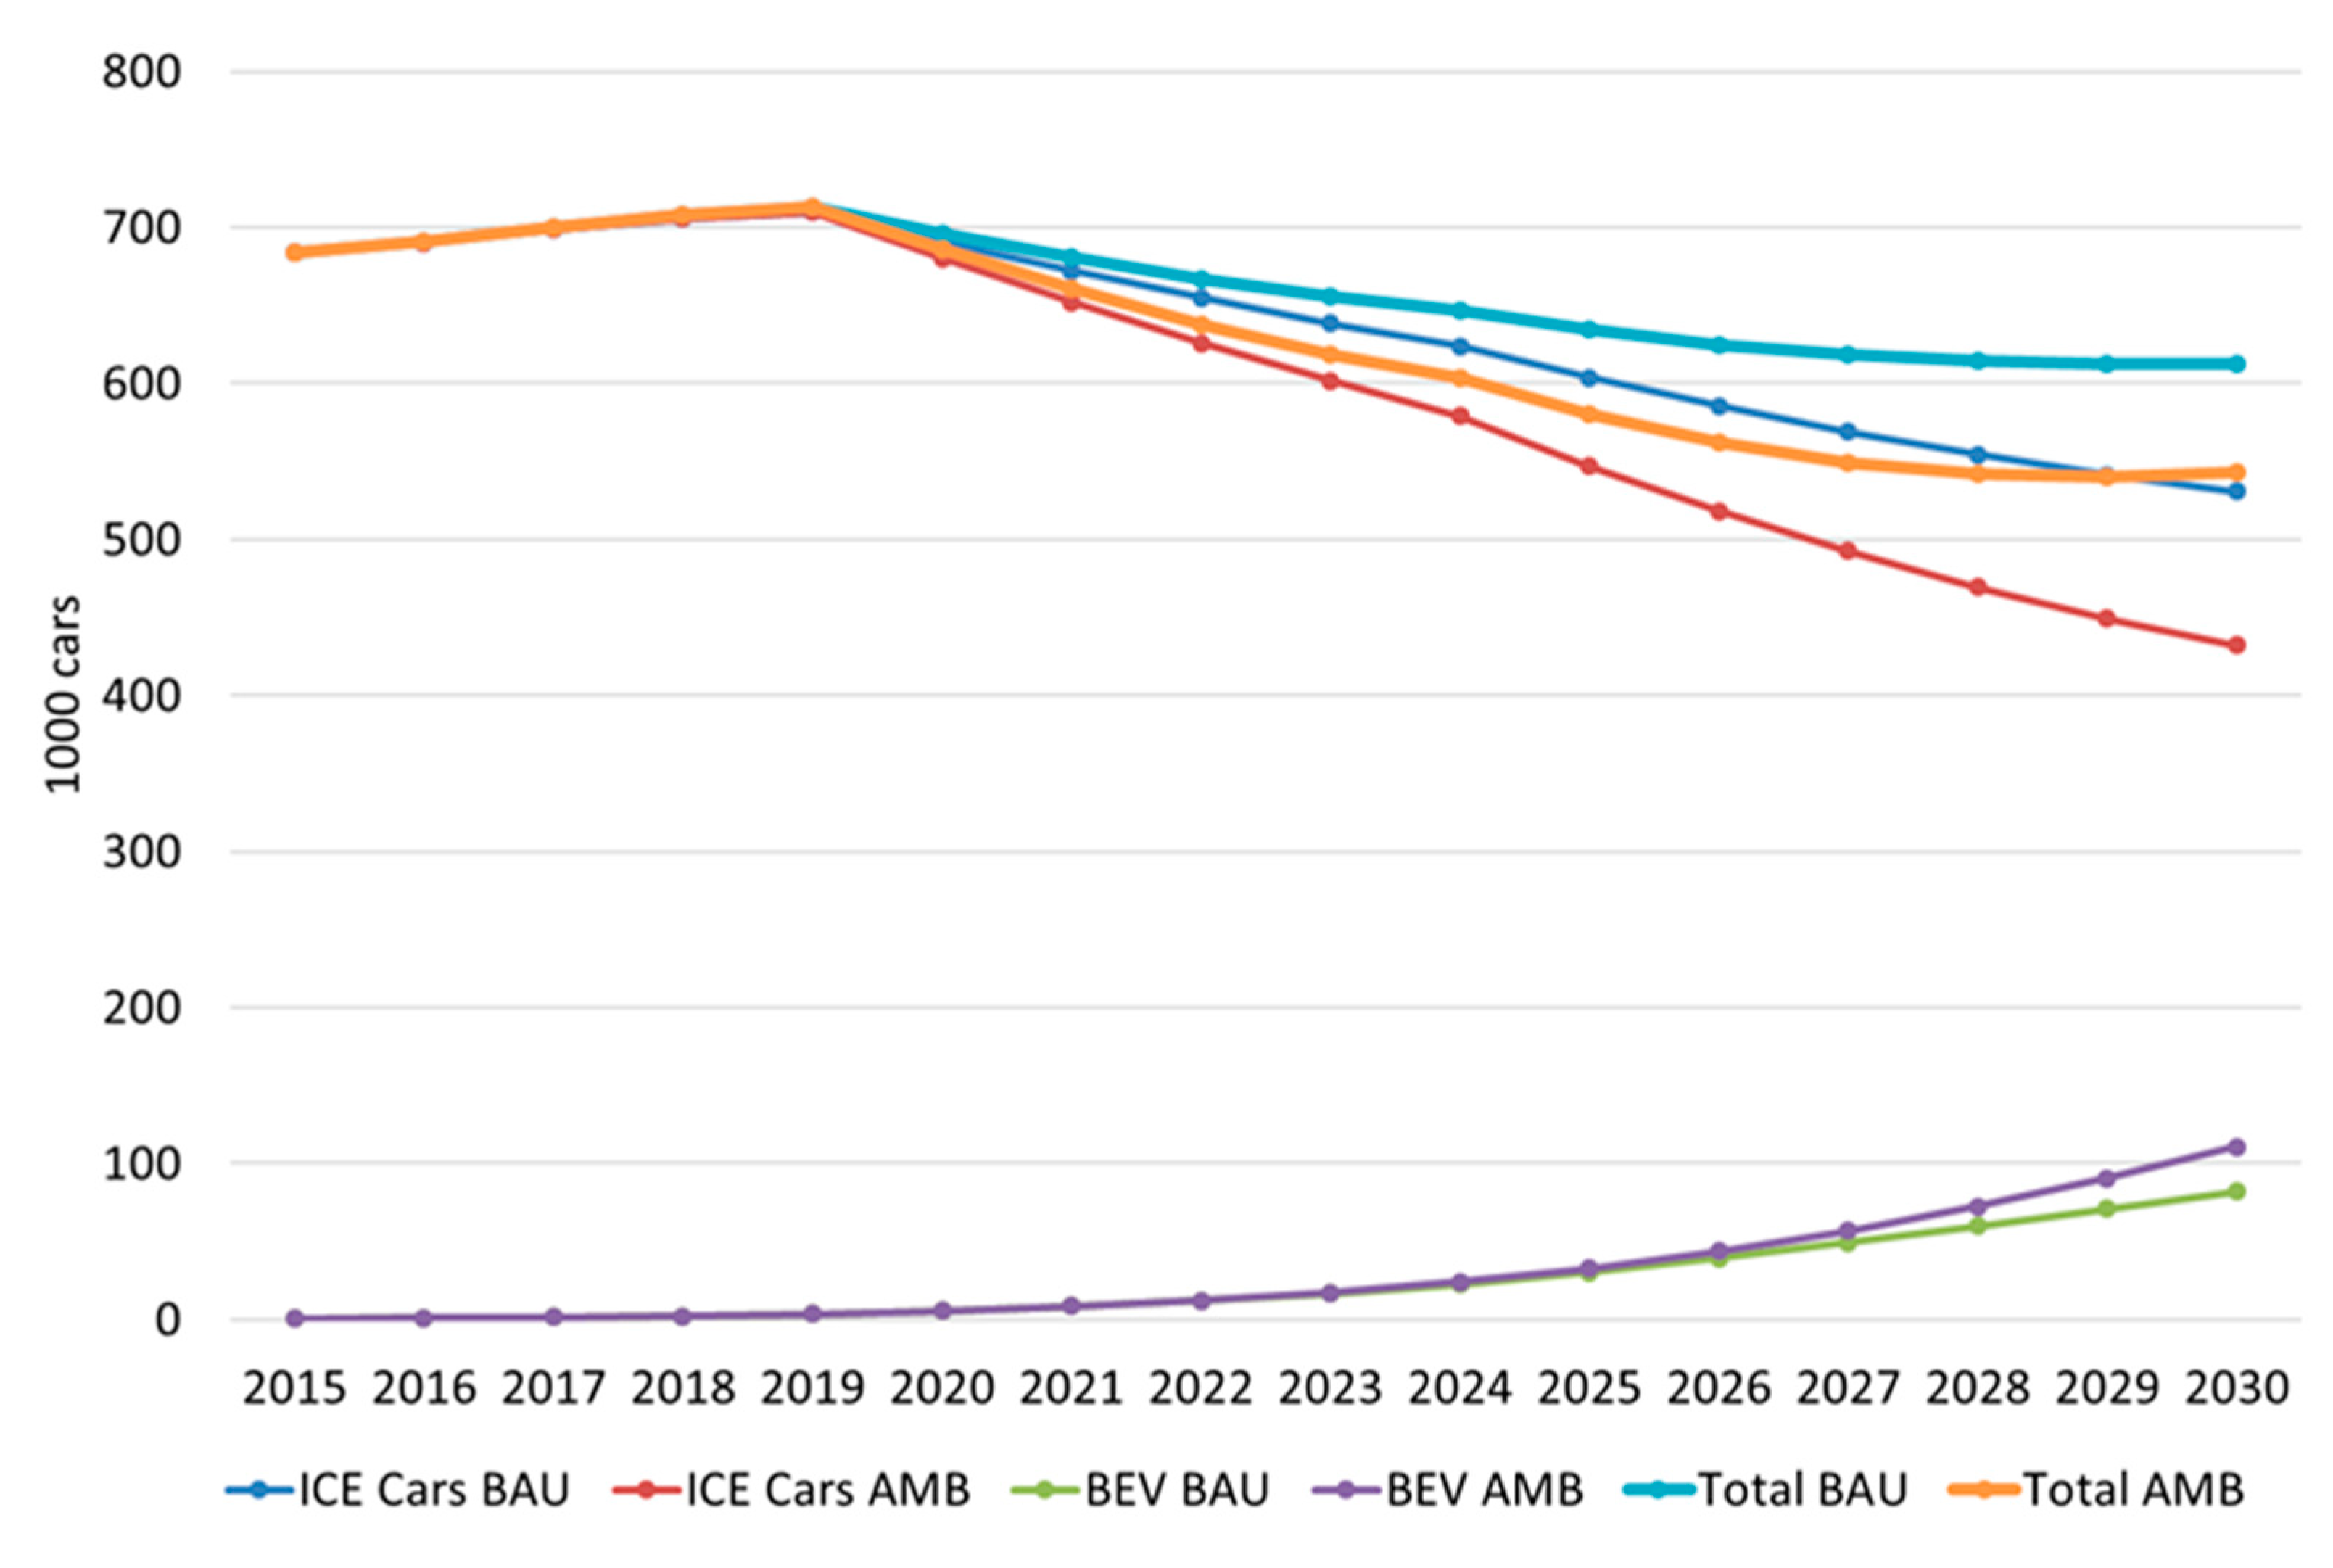
7. Scenarios for the Future of Electric Mobility in Vienna
Since the development of public transport in Vienna is already planned up to 2030, there is limited freedom in the development of scenarios. The only segment where significant changes are possible is passenger car transport, where the shift to BEV could be intensified. In the following, two possible scenarios for the deployment of BEVs in passenger car transport are presented.
The first scenario is a business-as-usual (BAU) scenario created based on recent trends and developments. In the BAU scenario, it is assumed that the growing rate of BEVs, which was on average 63% over the last five years, will remain up to 2025 and then will be reduced to 40% by 2030.
The second scenario is an ambitious (AMB) scenario created assuming stronger promotion policies such as higher subsidies and other benefits for electric vehicle drivers. Here, the growing rate of BEVs is reduced from 63% in 2018 to only 50% in 2030. Of course, the decrease in conventional vehicles will be steeper in the AMB scenario including the target of an overall reduction in the total number of cars (−10%) by 2030.
The vehicle stock (VST) is modeled as:
where:
VSTjt: stock of vehicle type j in year t
fg_jt: growth factor of car type j in year t.
The magnitude of fg_jt is 10% in the BAU scenario and 15% in the AMB scenario.
In addition, the total vehicle stock in 2030 must be lower than the maximum (
) allowed by current policy restrictions:
VSTTot_2030: total car stock in the year 2030.
Figure 13 depicts the development of the car stock in the BAU and AMB scenario. In both scenarios, an increase of BEVs and a decrease in the number of internal combustion engine (ICE) vehicles, as well as in total vehicle stock, can be seen. The curves on the bottom represent the scenarios for BEVs. In the AMB scenario, the number of BEVs could be about 110,000 in 2030. Due to policies and measures already implemented, the number of overall car is decreases even in the BAU scenario. The curve on the top shows the development of overall car stock in the BAU scenario.
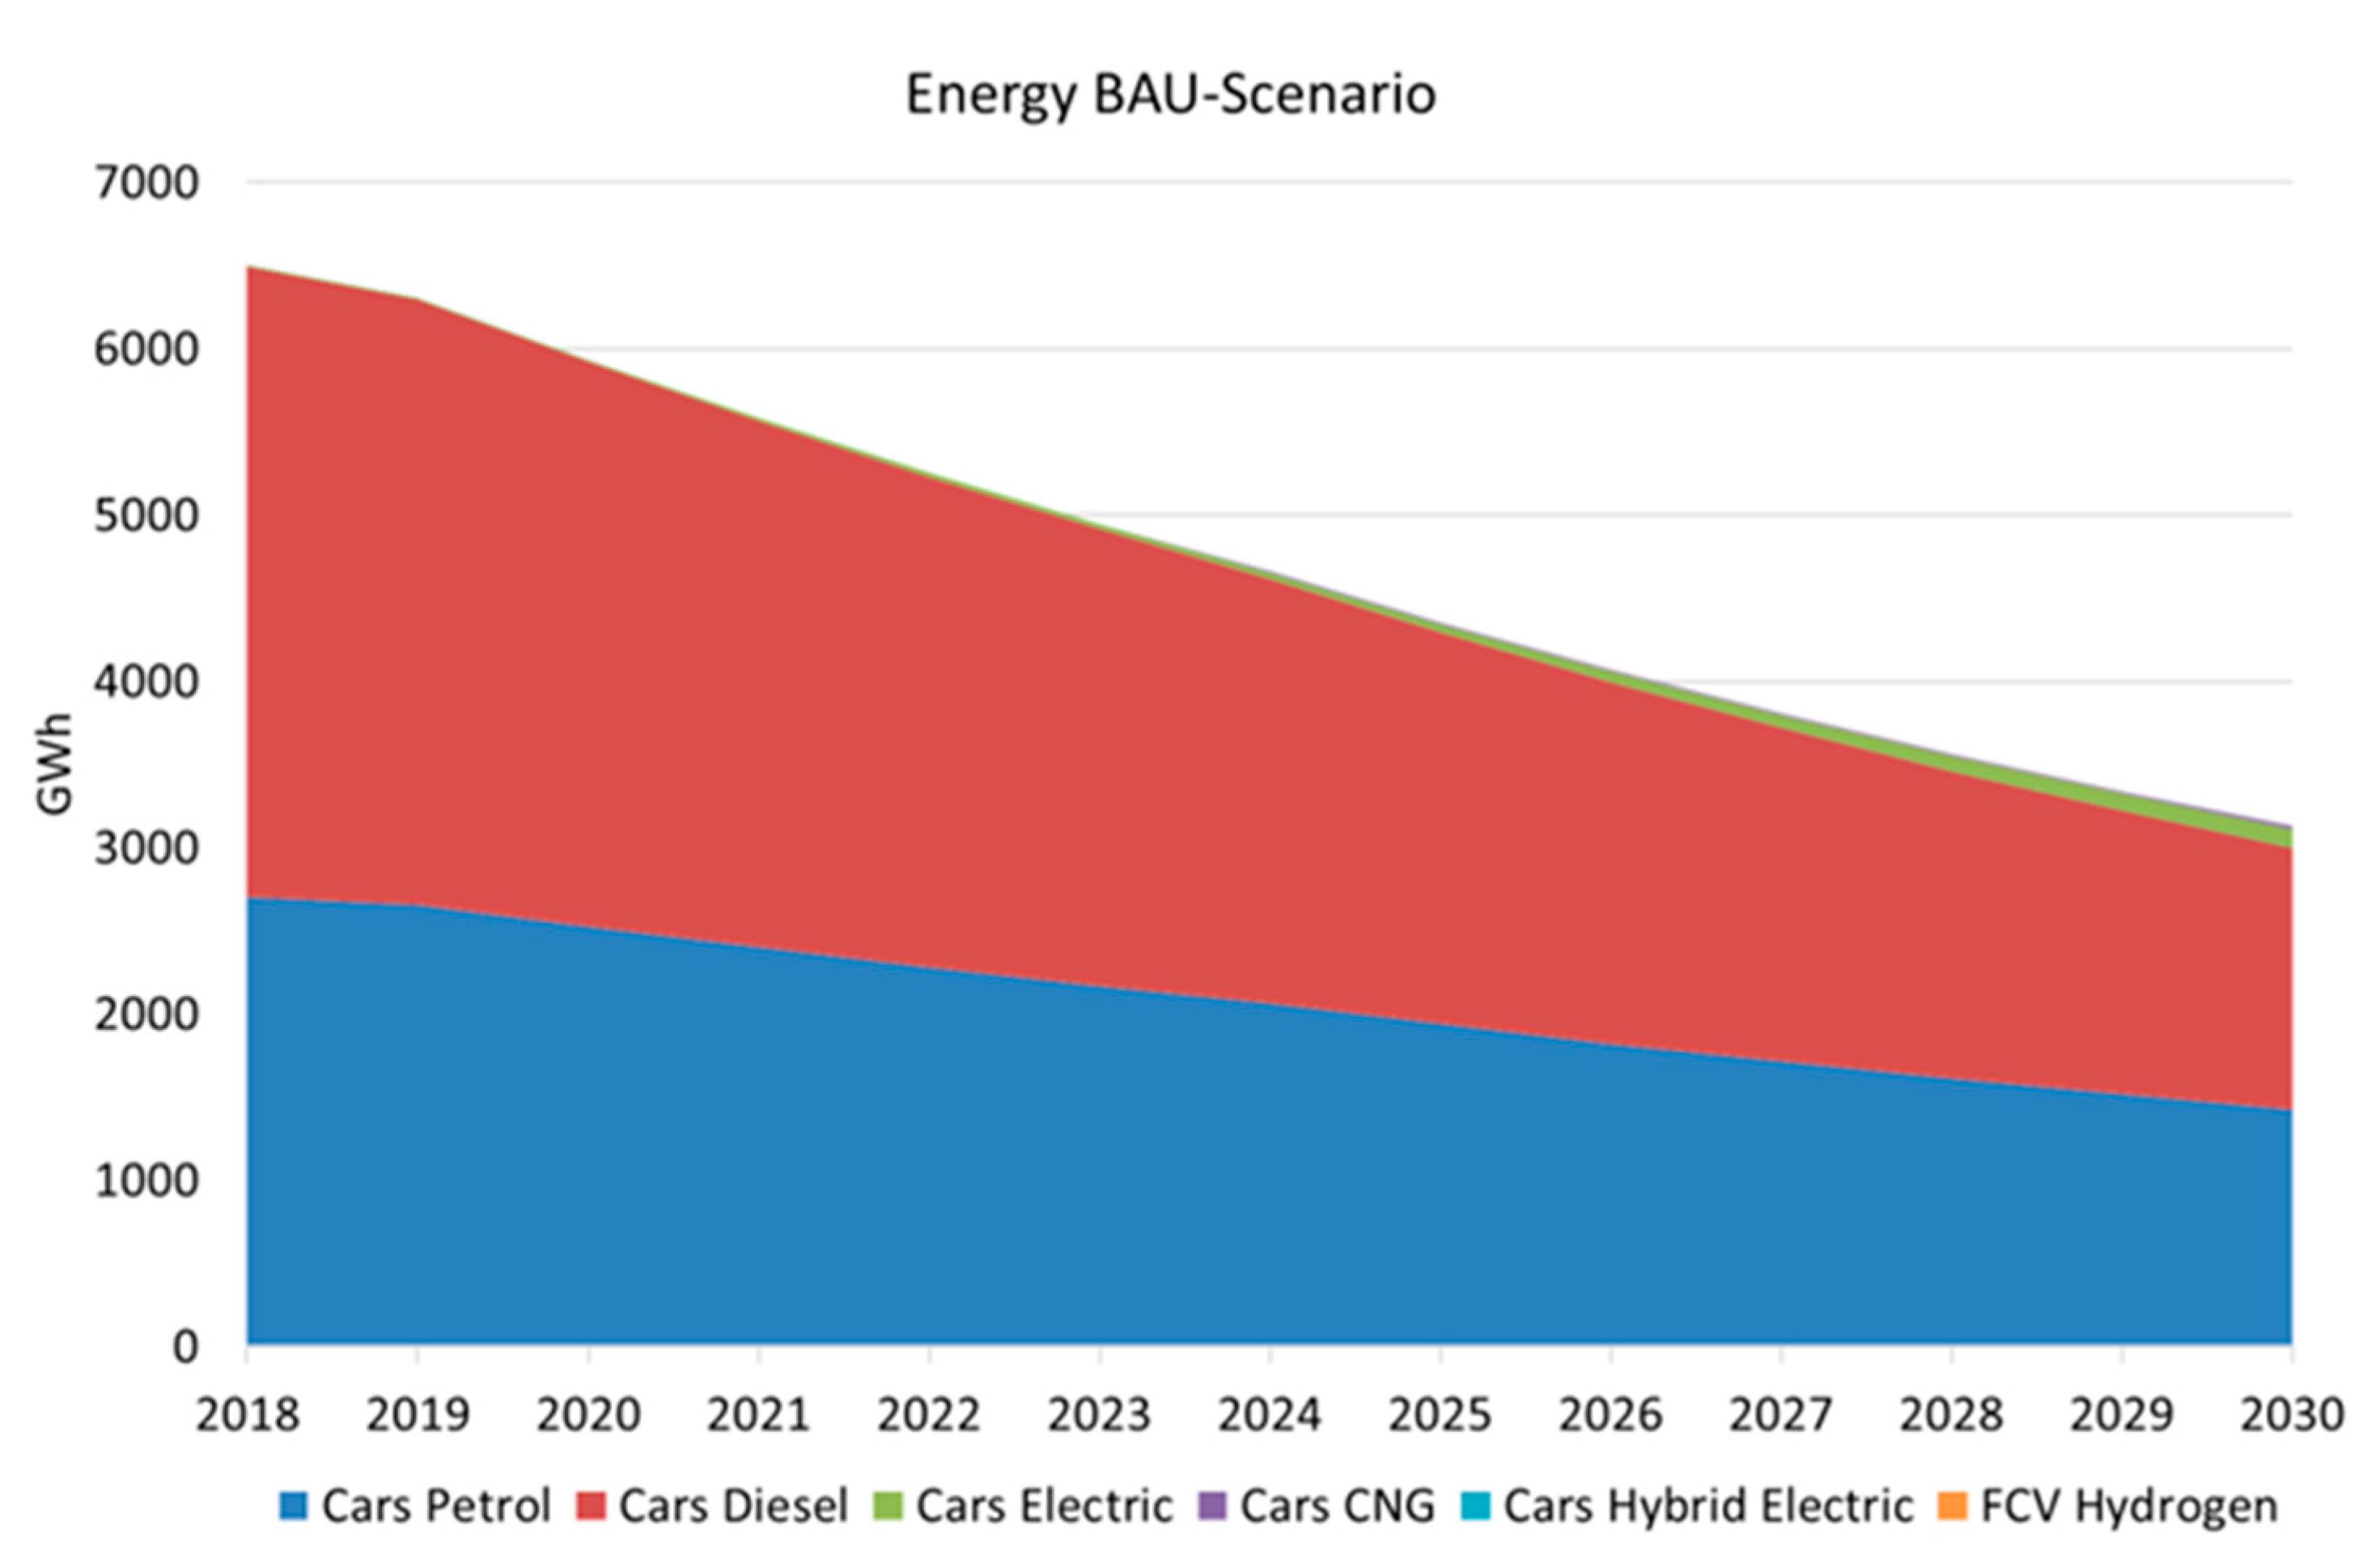
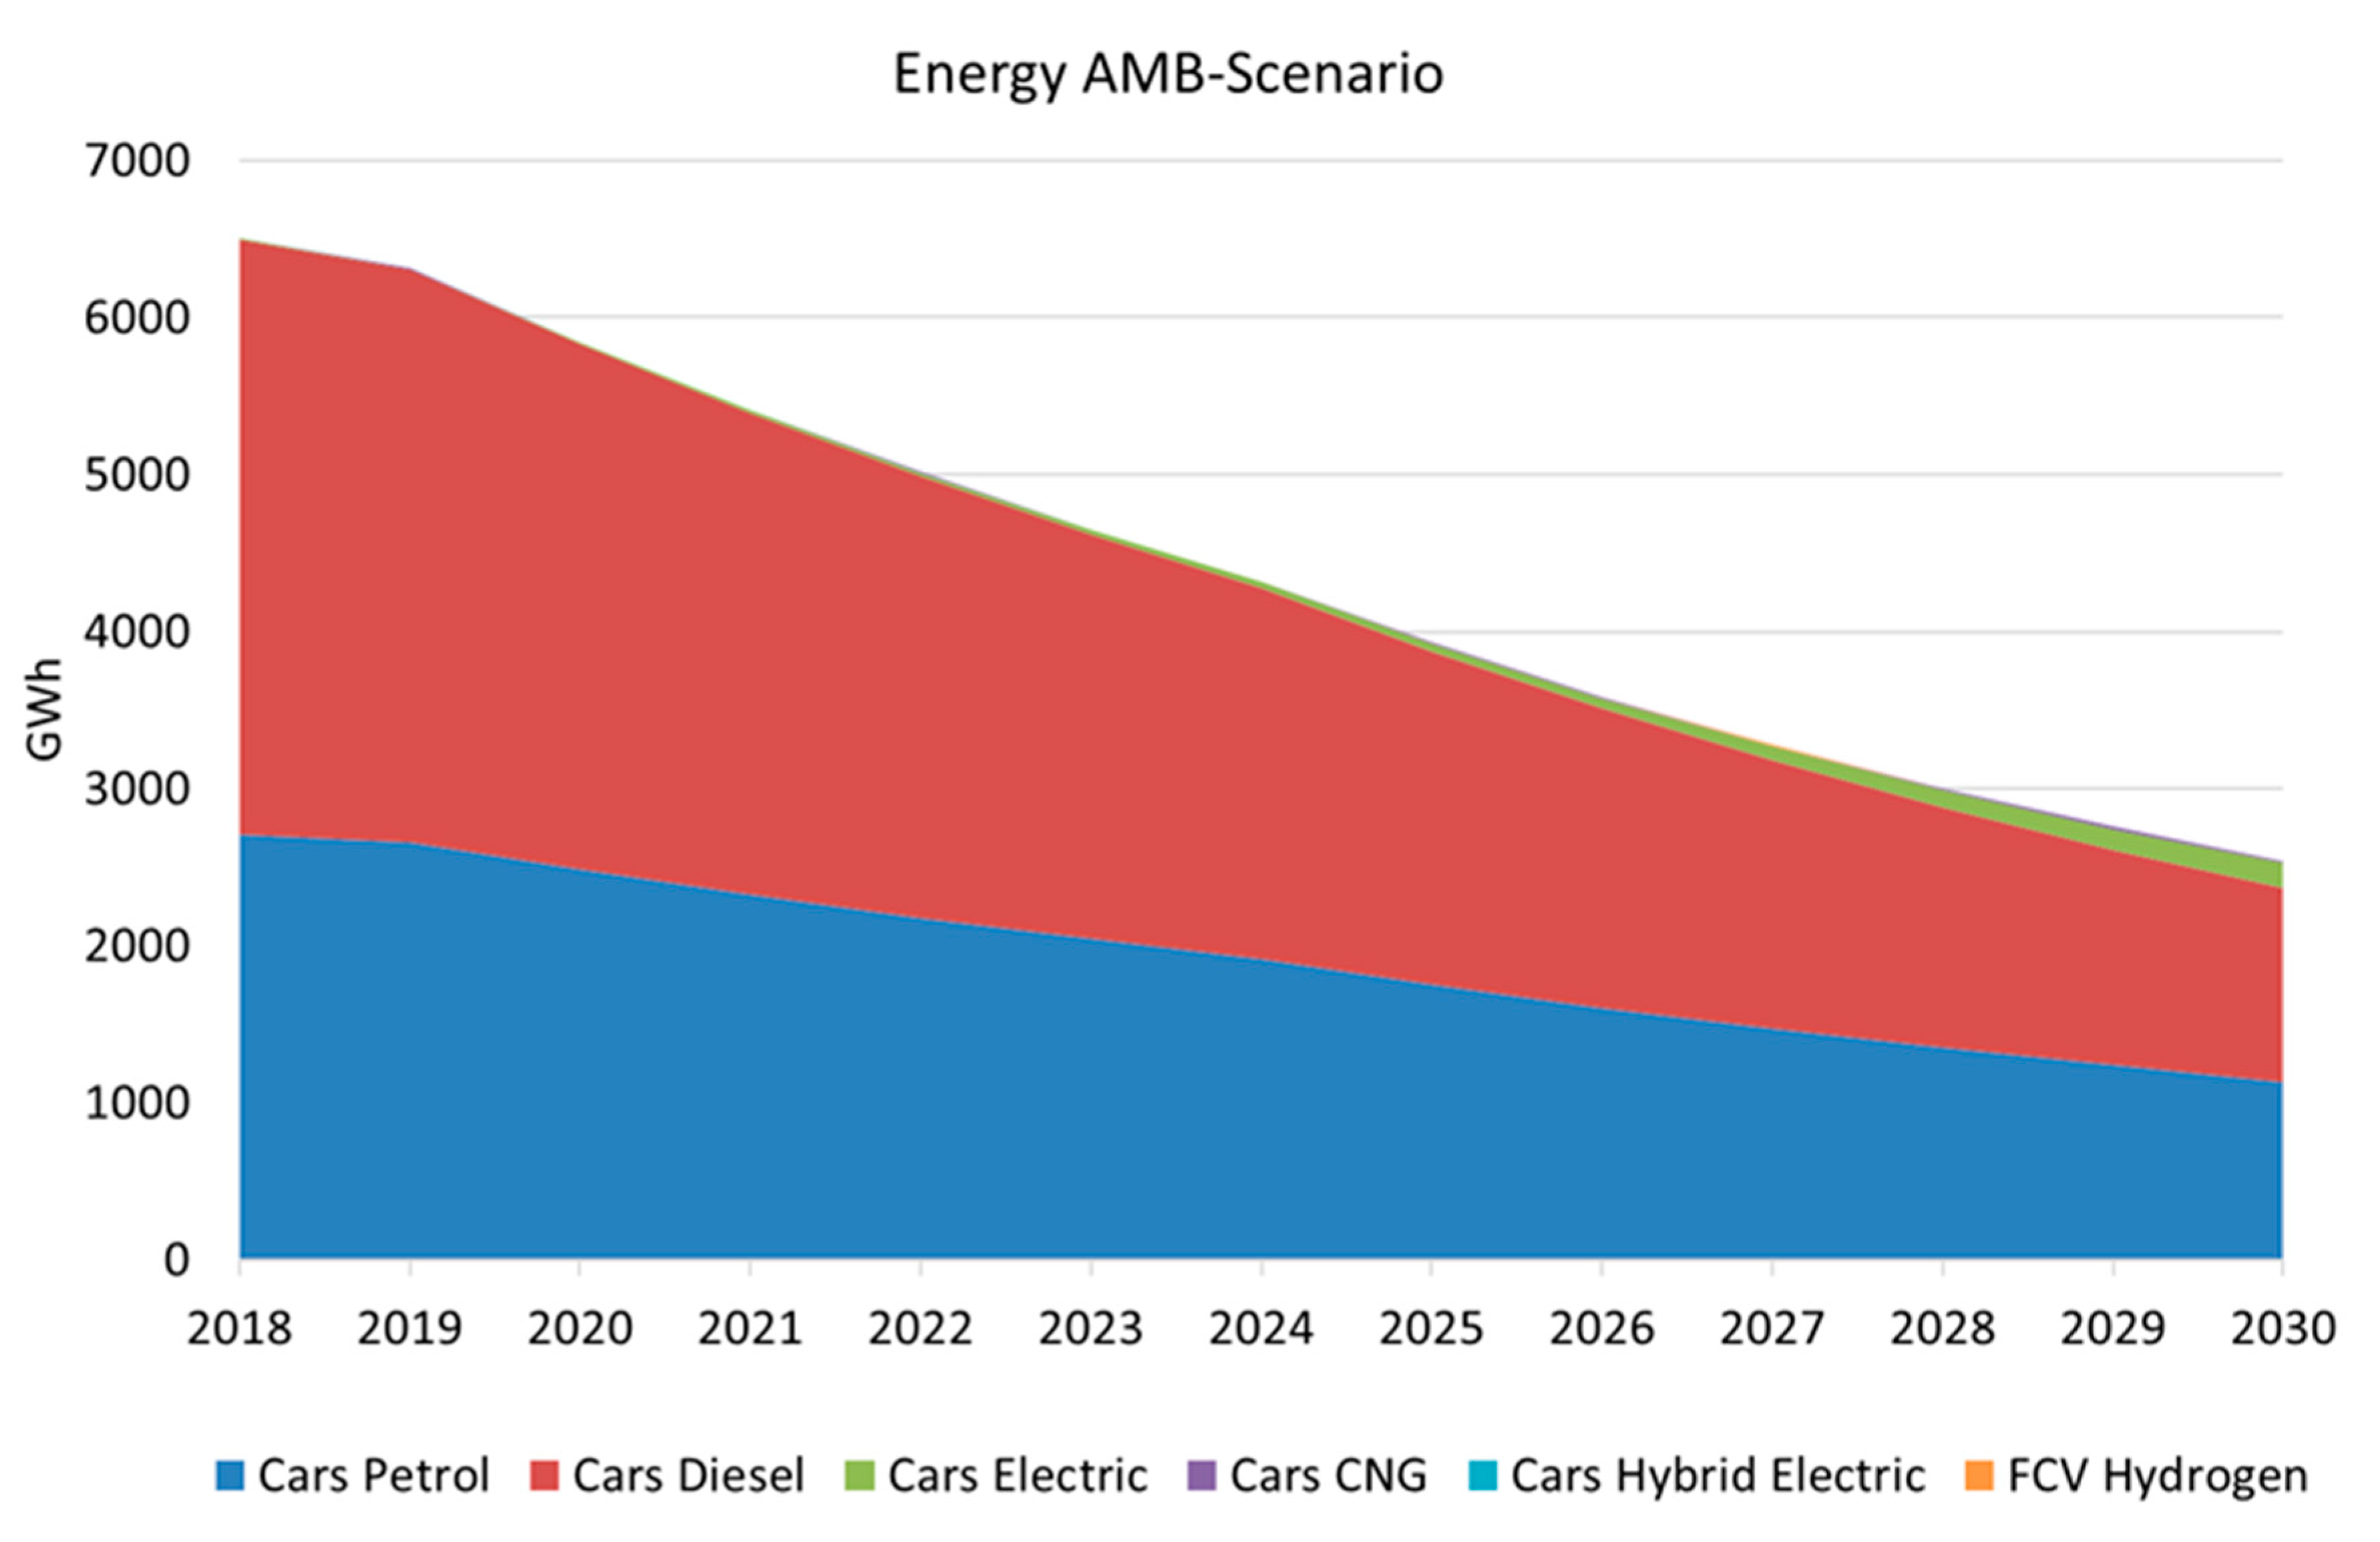
The major results of the scenarios with respect to energy demand are shown in
Figure 14 and
Figure 15. Most important is that in the AMB scenario, through the introduction of BEV, the total energy demand in road transport can be reduced by about 60% in 2030 compared to 2018. In the BAU scenario, energy demand also decreases but just by 35%, mainly because of the mandatory reduction of the overall vehicle stock. As
Figure 14 shows, already in the BAU scenario, overall energy demand in passenger car transport can be reduced by 50% given an overall reduction of the car stock.
Although the number of BEVs in the AMB-scenario is higher than in the BAU scenario, the corresponding increase in energy demand is small, since BEVs have a high efficiency and hence can be seen as an energy conservation technology.
The major finding is that until 2030, the total energy demand was reduced from 3.1 TWh in the BAU-scenario to 2.5 TWh in the AMB-scenario.
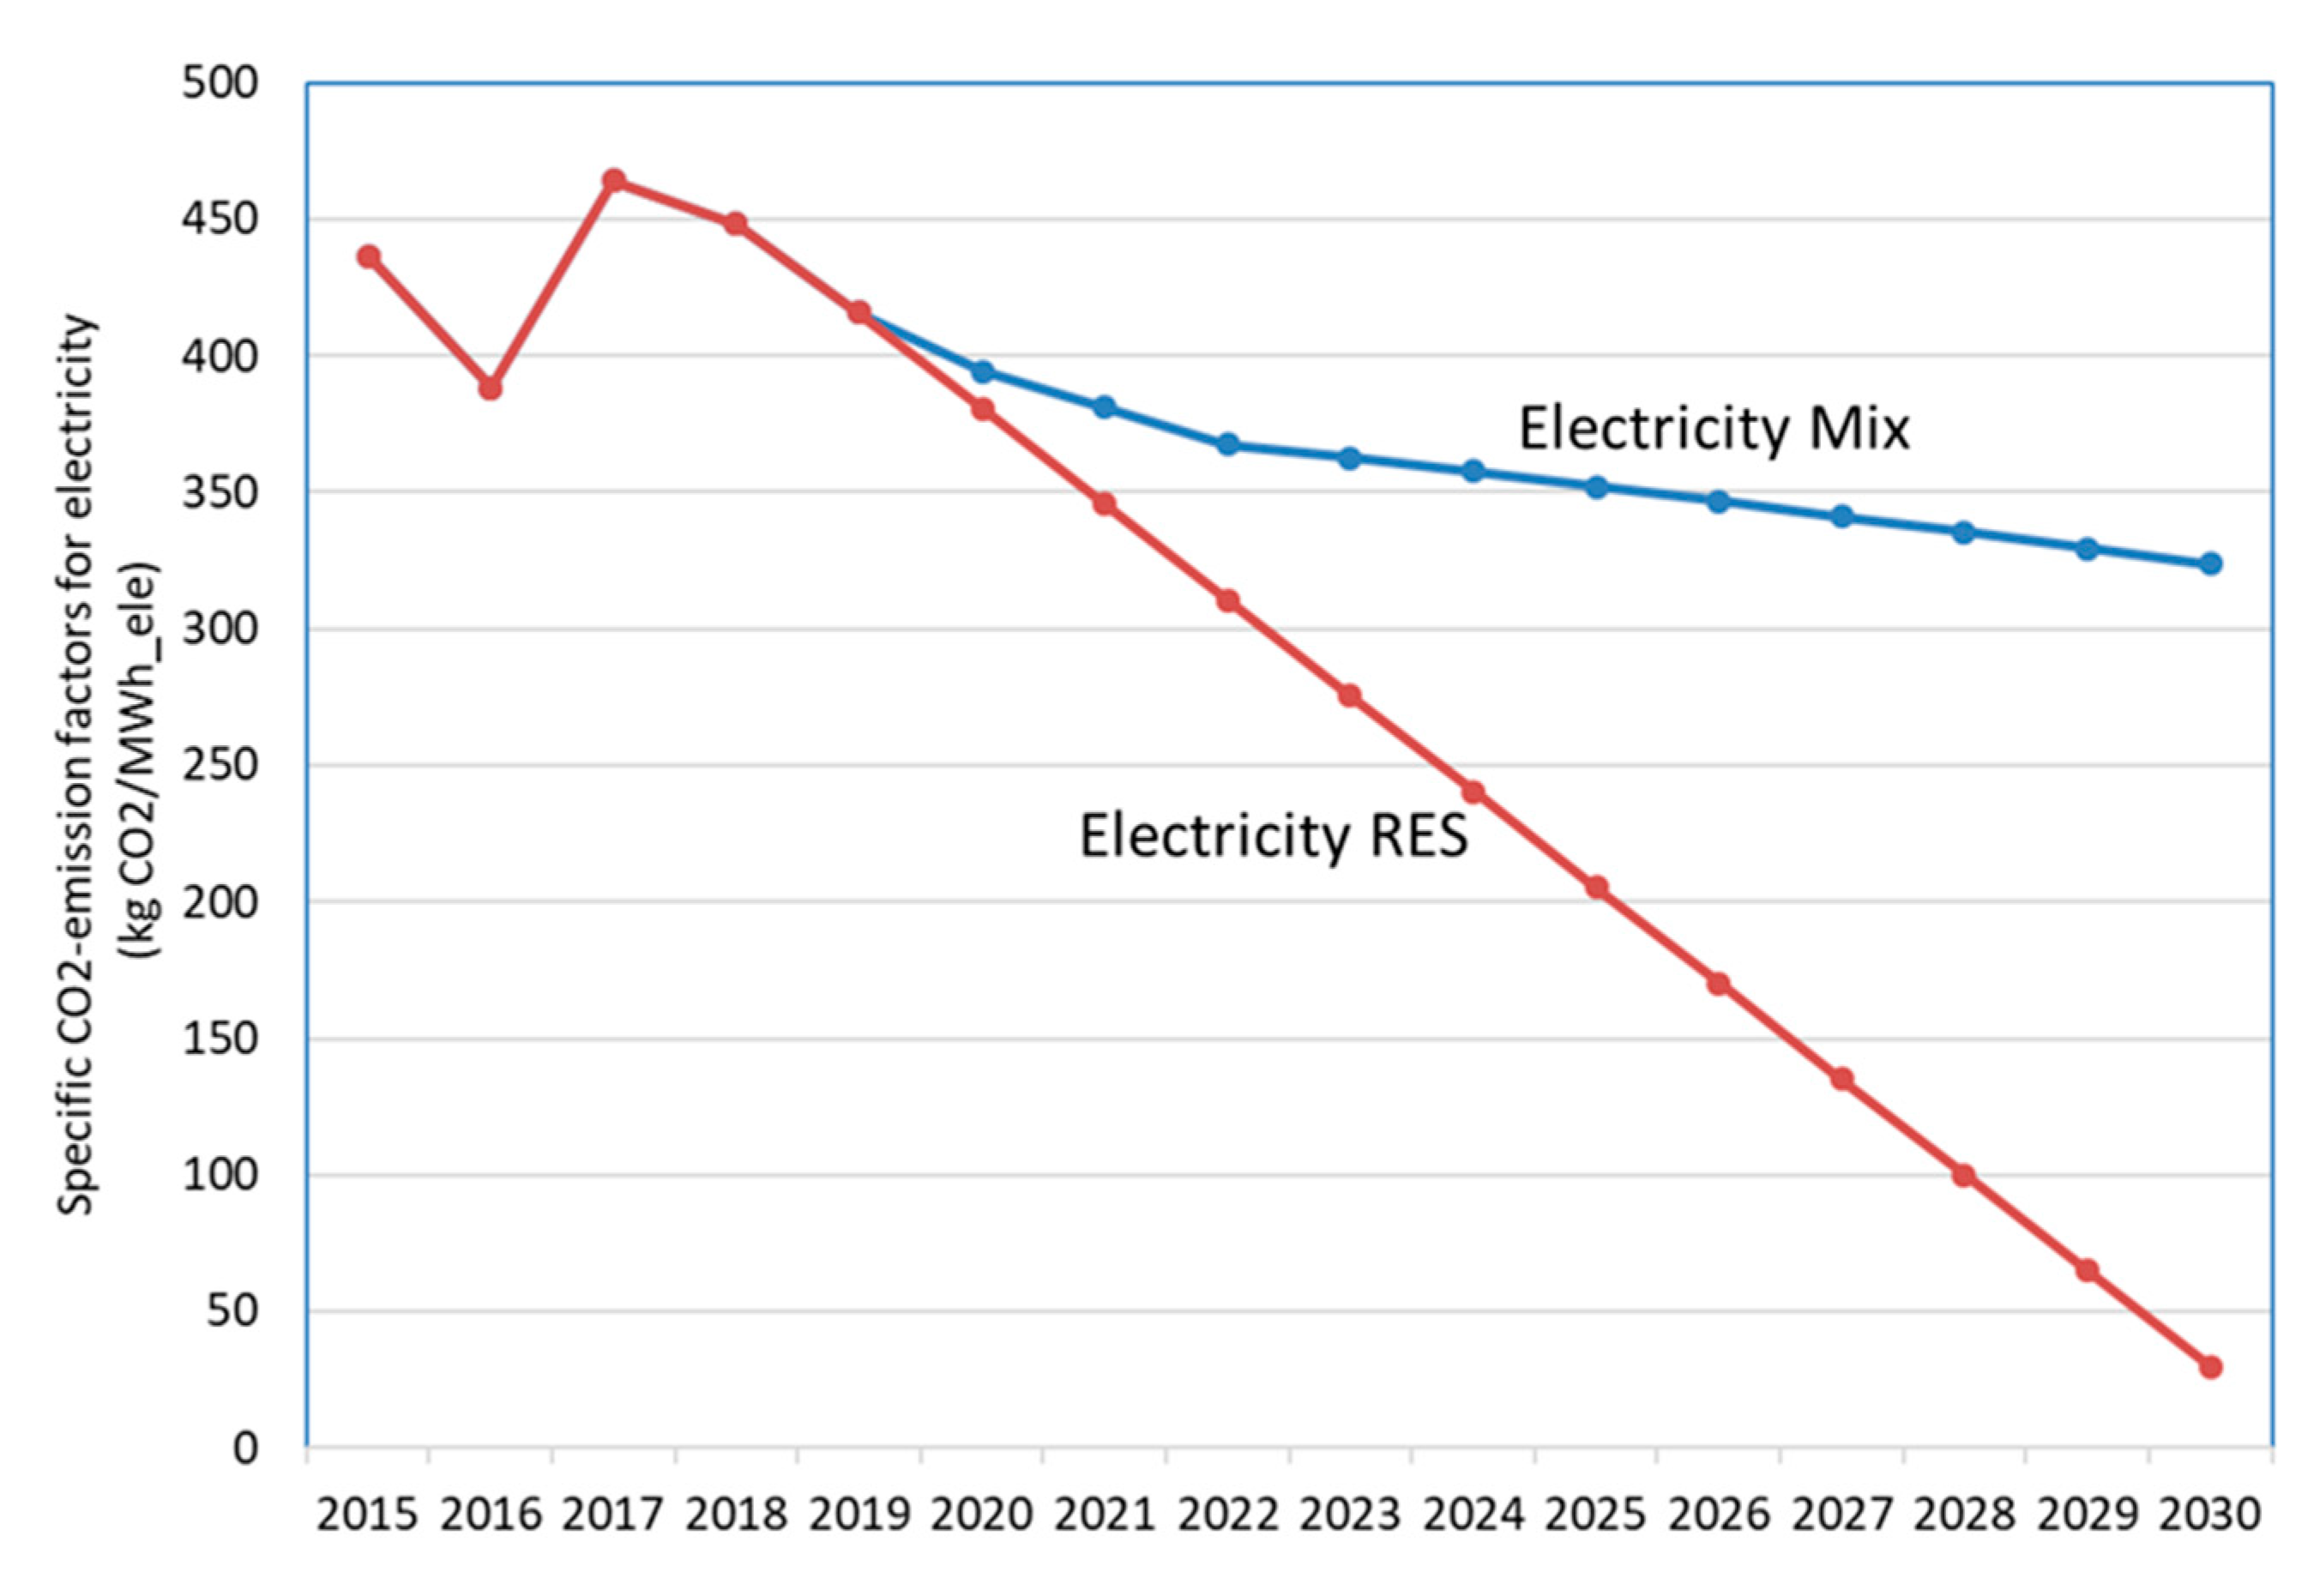
The development of specific CO
2-emission factors of the electricity mix is depicted in
Figure 16. The figure shows two possible scenarios: a BAU electricity mix scenario and a progressive RES scenario. The mix scenario considers that the district heating share requires more combined heat and power production, which is in principle favorable to the current mix but worse than electricity generation from RES. The RES scenario assumes that 100% RES electricity generation is reached in Austria by 2030.
The total CO
2-emissions (
CO2Tot) in these scenarios are calculated as:
with
Ejt: Energy consumption of energy carrier j in year t (MWh)
fCO2_j_t: Overall CO2 emission factor of fuel j.
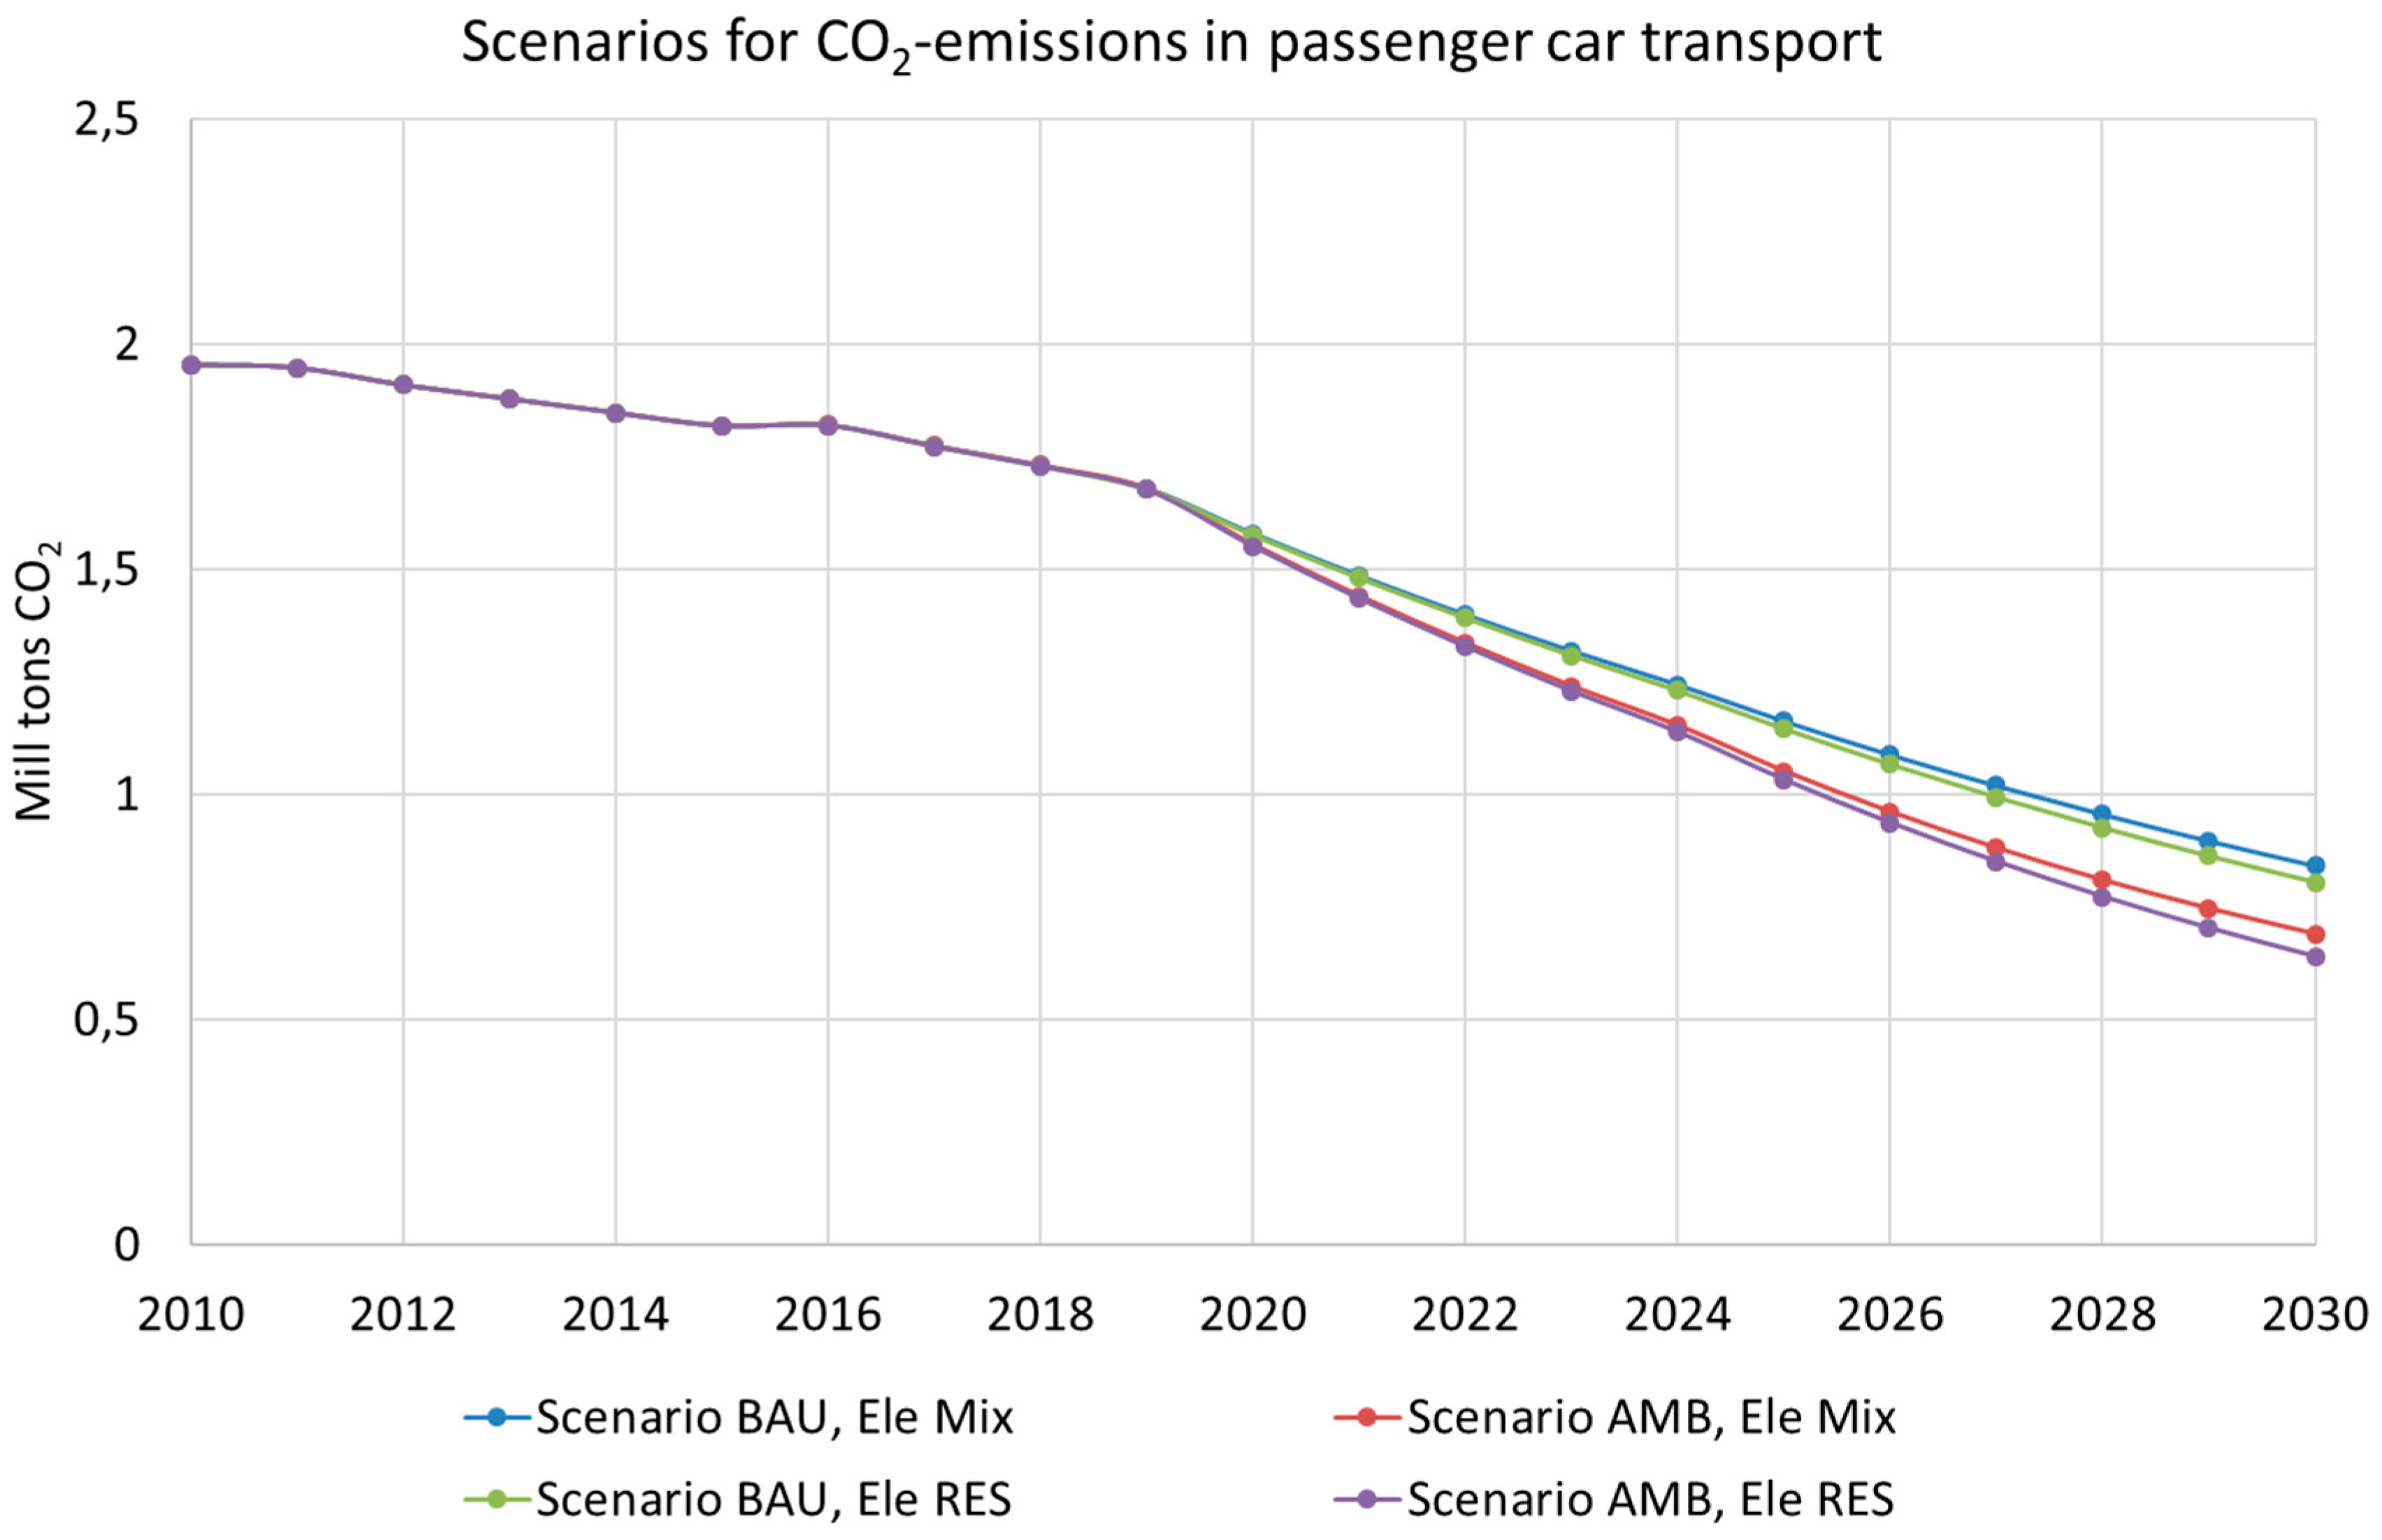
Figure 17 shows the development of overall CO
2-emissions in passenger car transport in the BAU and the AMB scenario for BEV development and for electricity in an electricity mix and a progressive electricity RES scenario. Four possible paths are considered. It can be noticed that the electricity mix used in BEVs has a considerable impact on total emissions and that use of electricity from RES in the AMB scenario can significantly reduce emissions from passenger car transport.
8. Conclusions
The major conclusion is that the policy of the city will have the largest impact on the future development of e-mobility in Vienna. This concerns public transport as well as private BEVs. With respect to the promotion of BEVs, two major options are subsidies and emission-free zones. In addition, announced bans of internal combustion vehicles, especially diesel vehicles, could also become a strong incentive to purchase BEVs.
However, the following important questions with respect to the development of electricity generation and electricity demand remain open. First, regarding the environmental performance, by far the most important is how the electricity generation mix for the electricity used for e-mobility will develop. Second, specifically for the city of Vienna, it is important how the demand for district heating will develop. A higher district heating share requires more combined heat and power production, which is in principle favorable to the current electricity mix but worse than electricity generation from RES. Finally, it is also important how the overall electricity demand will develop. The lower it is in general, the easier it will be to have a larger share of renewable electricity.
Another important issue is the development of the corresponding infrastructure. The deployment of the proper infrastructure such as overhead lines or other grids for electricity, installation of rapid and regular charging stations is of utmost importance. The development of infrastructure is in principle always dependent on regulation, which means it highly depends on the corresponding policies.
Furthermore, the national policies of Austria will play an important role. A current official overall target of Austrian energy policy is to reach 100% RES electricity generation by 2030 in a balanced system. If this could be achieved, of course, it would be a huge jump forwards towards a sustainable energy system. Consequently, electricity used in transport would become much more environmentally benign, and the corresponding CO2-emissions could be reduced significantly.
However, there are also other options for emission-free energy carriers in transport such as hydrogen or green gases. Today, for short distances and smaller cars, hydrogen is not an economically viable solution. However, for larger buses, it could at least be a possible option.
An outlook for the future emphasizes the core role of generating electricity from RES. This is the core crucial issue for environmentally benign electric mobility regardless of which mode is chosen. In addition, there is the question of whether the city will introduce a more ambitious strategy with respect to the reduction of private cars in general and ambitious towards more environmentally benign mobility modes. In any case, from the individual and societal points of view, economics will play a crucial and predominant role.
In summary, concrete steps recommended for future policies are to (i) introduce and extend emission-free zones in urban areas; (ii) force electricity generation from RES; (iii) ensure that mobility costs of all transport modes reflect full life cycle emissions are as correct as possible. Finally, it can be stated that these findings are generalizable virtually worldwide.


