1. Introduction
Cities play a major role in social and economic aspects around the world and have a huge impact on the environment [
1]. In the last two decades, the smart city concept has become increasingly popular in the scientific literature and international politics. To understand this concept, it is important to recognize why cities are considered key elements for the future. The most common characteristics of smart cities are highlighted below:
urban network infrastructure that enables political efficiency and social and cultural development;
emphasis on business urban development and creative activities to promote urban growth;
social inclusion of different inhabitants of the city and social capital in urban development;
natural environment as a strategic component for the future.
The global 100% Renewable Energy initiative supports local governments committed to the goal of using 100% renewable energy. This initiative aims to show how 100% renewable energy can be implemented, all through ongoing projects at the local, regional and national levels. The cities committed to using 100% renewable energy by 2030 are Salt Lake City (UT, USA), Aspen (CO, USA), Copenhagen (Denmark), Munich (Germany), Agadir (Morocco), Kasese (Uganda), Takarazuka (Japan), and Sydney (Australia). One of the best smart cities in the world is Hong Kong, where there were 143 initiated or completed smart city projects at the beginning of the 2013 [
2]. The smart city project distribution by regions is: Asia 50, Europe 47, North America 35, Middle East and Africa 10 [
3]. Different smart city concepts have been analyzed and implemented worldwide. The “Smart Capital” project involves improvement of business, local government and the community through the use of online resources in Ottawa (ON, Canada). In California (USA) traffic is improving and old infrastructure (water, sewage and electrical) is being replaced by technology-based transformation. Furthermore, ICT technology was main factor for the claims of San Diego and San Francisco to be the cities of future for the past 15 years. According to China Smart Cities Forum statistics, six provinces and 51 cities in China have included smart cities in their government performance reports [
4].
Renewable energy sources are a good choice to cover energy needs and are expected to lead to a complete transformation of the electricity sector. By the year 2050, wind farms will be one of the main electricity sources. One-third of electricity demands should be supplied from wind farms.
A second renewable energy source for utilization should be photovoltaic power plants. Nowadays, solar energy has become one of the most suitable energy sources that can be used in various ways and can be an alternative to conventional energy sources [
5]. It should supply one quarter of the total electricity demands. To achieve this therefore it is necessary to increase the production from photovoltaic power plants tenfold compared to the production from 2016. In order to fulfill the previous task by 2050, a significantly larger expansion of solar photovoltaic capacity (8519 GW) is needed compared to wind (6044 GW). By the production of this amount of electricity by photovoltaic power plants, the emissions of greenhouse gases could be significantly reduced (4.9 Gt CO
2). This reduction represents 21% of the total greenhouse gases emission reduction through the use of renewable sources and energy efficiency measures. By applying 6044 GW of wind power, emissions can be reduced to 6.3 Gt CO
2, representing 27% of the total emission reduction [
6]. Solar energy systems are also of great interest for this purpose [
7] and can be used as an adequate alternative to conventional energy systems [
8]. Among all low-carbon technology options, solar photovoltaic energy contributes to great emission reduction potential by 2050 due to the significant use of renewable energy that replaces conventional energy sources by using the best technological and contributes to drastic cost reduction and socio-economic growth. This section applies to global energy transformation: the role of solar and wind energy worldwide based on references [
4,
5].
In this paper the application of a floating photovoltaic (FPV) system for electricity generation is proposed. In addition, the concept of installation of FPV 30 MW and 115 MW prosumers for electric heating of 35,000 households is proposed. By this concept the heating period continues after sunset during winter. With FPV in combination with the existing pumped storage hydropower plant, it is possible to save energy during the day and thus avoid buying energy from the electricity market at a time of very high prices, which is quite possible in Sarajevo Canton in the real case. The floating photovoltaic system is a new system for the production of electricity that has attracted a lot of attention from the professional and scientific community in the last few years due to its many advantages. In addition to producing electricity, these systems reduce water evaporation, leave no traces on the soil and do not pollute water. As matter of fact, shading produced by FPVs reduces algal growth and therefore improve water quality. Floating photovoltaic systems also have some advantages compared to classical photovoltaic systems such as higher electricity power output due to lower temperature of the water surface [
9,
10,
11]. Furthermore, since they are placed on a water surface shading of the PV modules by other objects is drastically reduced and on the water surface sunlight reflection coefficient is higher [
12]. Therefore, floating photovoltaic electricity generation systems have become a desirable renewable energy system [
13].
The first floating photovoltaic power plant was installed in Japan in 2007. This floating photovoltaic power plant was built for research purposes. The capacity of first floating photovoltaic power plant was 20 kW [
14]. Not long after that, floating photovoltaic power plants were installed in numerous countries such as the USA, Italy, Spain, France, South Korea and Singapore. Recently, a floating photovoltaic power plant with capacity of 40 MW was installed in China [
15]. In fact, approximately 25% of the world’s electricity needs could be met by covering only 1% of the surface of natural pools with FPVs [
16]. The advantages of FPV over onshore systems are the use of existing electricity transmission infrastructure at hydropower sites. The possibility of adding FVP capacities to existing hydropower plants is of particular interest, especially in the case of large hydropower plants that can be flexibly managed. Solar capacity can be used to increase the energy yield of such power plants and can also help manage periods of poor water availability, allowing the hydropower plant to operate at peak rather than nominal load.
As previously stated, one of the crucial steps for the reduction of the greenhouse gas emissions is the use of renewable energy systems (RES). For the electricity production different renewable energy technology can be used. Which renewable energy technology or combination of technologies is better for a specific location depends on a number of technical, physical and economic factors. This technology is evolving rapidly in response to environmental issues [
17].
Due to the different nature of different RES technologies (variability, availability, programmability) it is appropriate to combine different RES technology at one site i.e., to use hybrid RES electricity sources [
18]. Based on the location of installations and the work principle of floating photovoltaic planta it is suitable to combine them with hydro power plants [
12,
18]. The combination of a floating photovoltaic plant and a hydro power plant has some advantages such as same grid connection can be used for both power plants, reduction of the power fluctuation and water saving [
18]. Furthermore, floating photovoltaic systems can be combined with the wind power plants in marine applications. In [
19] it was shown that combined power plants increase the capacity density and reduce the intra-annual variability of the energy output.
This paper is organized as follows: In
Section 2 an overview of energy consumption by fuel type in Sarajevo Canton according to the heating system and environmental protection objectives is presented. Then in
Section 3 a hybrid EMD-SARIMA model for air quality index (AQI) and a solar production forecast is presented. A solar energy analysis is also presented.
Section 4 describes a new concept of using fossil fuels in households and a new energy policy, more precisely the use of renewable electricity for the purpose of domestic heating in order to promote Sarajevo Canton towards becoming a smart city. Findings based on the results and the conclusions are presented in
Section 5.
2. The Current Situation in Sarajevo Canton
In the Sarajevo Canton, with an area of 1276.9 km, there are 419,414 inhabitants. The population density of Sarajevo Canton is thus 328.5 inhabitants/km² [
20]. The total energy demands in Sarajevo Canton for 2019 amounted to 4795.49 GWh, of which electricity was in the amount of 1436.16 GWh or 29.95%, natural gas 1215.73 GWh or 25.35%, solid fuels 524.88 GWh or 10.95% and petroleum products 1618.72 GWh or 33.76%, and they were higher by 59.27 GWh or 1.25%, compared to 2018. According to the total energy demands in the Sarajevo Canton for 2019, imported energy sources were in the amount of 2834.45 GWh or 59.11%, and domestic energy sources were 1961.04 GWh or 40.89%. The number of electricity customers in the past four years has grown by 3.95%, and the number of natural gas customers in the mentioned period has grown by 4.93%. In 2018, compared to 2017, the growth of investments in electricity facilities amounted to 26.44%, and the amount of these investments in 2018 was 2,729,998.36 USD. However, it should be emphasized that the volume of construction of the gas distribution network in Sarajevo Canton has been showing a declining trend [
21]. Electricity losses in 2019 were 6.38%, and were mainly losses in the electricity distribution system, because it is an older electricity distribution system (mostly composed of overhead lines, older substations, etc.).
Total energy consumption in Sarajevo Canton in 2018, compared to 2017, was higher by 116.04 GWh or 2.51%.
Table 1 presents an overview of the energy consumption by fuel type in Sarajevo Canton. The data in
Table 1 refer to the total annual consumption of LPG in Sarajevo Canton, including vehicle consumption.
2.1. Sarajevo Canton Heating System
Production and distribution heating systems in Sarajevo Canton can be classified into three groups, based on the sources and means of distribution:
District heating systems (DHS) managed by both public and private companies engaged in the production and distribution of heat: Cantonal Public Utility Company (KJPK) Toplane-Sarajevo d.o.o. Sarajevo, BAGS Energotehnika d.d. Vogošća, and UNIS Energetika d.o.o. Sarajevo.
Central boiler rooms that are not owned by any distributor and that produce heat from natural gas, electricity and liquid and solid fuels. A significant number of public institutions and buildings, as well as commercial buildings, are thus supplied with heat. This group also includes newly built residential buildings with high heat consumption.
Individual stoves that use gas, coal, firewood, pellets and electricity. This group includes individual houses as well as residential buildings not affiliated with an DHS operated by one of the distributors [
22].
Gas is currently the main fuel used in the district heating systems of Sarajevo Canton. As DHS mainly cover residential buildings, this heating system is mostly used in three city municipalities (Novi Grad Sarajevo, Novo Sarajevo and Center Sarajevo). The Sarajevo Canton consists of nine municipalities, of which four comprise the city of Sarajevo. The territory of the Canton comprises the territories of the Center, Hadžići, Ilidža, Ilijaš, Novi Grad, Novo Sarajevo, Stari Grad, Trnovo and Vogošća municipalities. In the total energy consumption in Sarajevo Canton, gas accounts for 53.2% (with 29.7% used in DHS), followed by firewood with 17.5%, lignite coal with 13.05%, brown coal with 7.7%, electricity with 6.0%, heating oil 1.6%, and wood pellets/briquettes with 0.95% [
20].
The main sources of air pollution in Sarajevo Canton are small combustion plants, more precisely the use of solid fuels, firewood, including briquettes and pellets, as well as coal. Unfortunately, boilers and stoves used in households are still traditional old firing machines. It is worth mentioning that use carbon rich fuels along with inefficient combustion technology cause a high rate of carbon emissions. Photovoltaic plants can help to mitigate carbon emissions by replacing this inefficient combustion technology with more carbon intensive sources of heat and power [
23].
Available data indicate that the majority of the population uses individual heating systems, of which the most common are firewood and coal systems (in about 30% of households in Sarajevo Canton). There are some indications that consumers currently participationg in the gas distribution are partially giving up the use of this energy source and switching to individual systems. Also, in larger cities such as Sarajevo, heating systems are being abandoned in favor of individual solutions. Individual systems are characterized by a small number of efficient systems such as pellet condensing boilers, heat accumulators and integrated sanitary hot water production systems.
2.2. Environment Protection
In [
24] all the requirements for air quality monitoring and calculation, limit values and other standards according to air quality can be found. The project goal is the protection of the environment and public health through the provision of timely air quality information. This was achieved by continuous monitoring of the air pollutants in the Sarajevo Canton. Obtained data will further be used for creating long-term plans of the current state of air quality improvement as well as remediation of the existing state. Also, air quality monitoring enables urgent and timely action in cases of excessive air pollution [
25].
Air quality monitoring in Sarajevo Canton is performed through four automatic measuring stations owned by the Ministry of Physical Planning, Construction and Environmental Protection of Sarajevo Canton and also two measuring stations belonging to the Federal Hydro meteorological Institute. The stations are located at Ilidža Health Center (located in an urban area, Dr. Mustafe Pintola 1, Ilidža, 43°49′40′′, 18°26′04′′), Elementary school “Stari Ilijaš” (located in an urban area, Bosanski put 151 Ilijaš, longitude: 43°57′36′′ N, latitude: 18°16′09′′ E), Otoka (located next to the main road in city of Sarajevo, longitude: 43°50′54′′ N, latitude: 18°21′49′′ E), Sarajevo City Hall (located in an urban area, Obala Kulina bana, Sarajevo, longitude: 43°51′33′′ N, latitude: 18°26′04′′ E) and federal stations: Ivan Sedlo (located in rural area, longitude: 43°45′04′′ N, latitude: 18°02′10′′ E) and Bjelave (located in urban area, Bardakčije, longitude: 43°52′03′′ N/43°52′04′′ N, latitude: 18°25′23′′ E/18°25′20′′ E).
The automatic stations measurement parameters are wind speed and direction, temperature, relative humidity, atmospheric pressure, global solar radiation, precipitation. The air quality parameters currently measured are common to all stations: concentration of PM
10 (suspended particles below 10 microns in diameter), sulfur dioxide (SO
2), nitrogen oxides (NO, NO
2, NO
X), carbon monoxide (CO) at the City Hall station and ozone (O
3) at the Ilidža and Otoka stations [
25].
Pollution data from previous years are of great importance for the further development of this paper, so these data will be used in terms of developing models for forecasting air pollution for the future. In terms of the presented statistical data, this paper highlight the days in a given year with an overrun of a certain air pollutant of its limit value, all in accordance with the rulebook (Rulebook on monitoring air quality and defining types of pollutants, limit values), values and other air quality standards [
24].
The goal is to establish the number of days of air pollution exceedance for all pollutants in the next year, and on the basis of that number of days, the creation of new policies in order to combat pollution, and turn to sustainable management in the Sarajevo Canton for better living conditions for its citizens. The SO
2 and PM
10 pollutants pollution values are presented on
Figure 1 and
Figure 2 as an example.
2.3. AQI
An air quality index (AQI) is used to communicate to the public the current air pollution as well as the pollution forecast. The proposal of the Index for Bosnia and Herzegovina is modeled on the AQI applied by the US Environmental Protection Agency (EPA), with minor changes [
26]. These changes include the following: all concentration values in the formula for calculating the index are expressed in micrograms (PM
2.5 and PM
10, SO
2, NO
2 and O
3), or milligrams (CO). The index is expressed by a numerical value, color and the name of the qualitative category. The air quality index, in addition to the expressed numerical value, also contains a recommendation on adjusting activities and a note on risks for certain groups of the population, in accordance with the state of air quality at a given time. This recommendation is made or confirmed by the current national air quality standards [
27].
The air quality is presented using indices consisting of six levels in the range of values from 0 (very low) up to > 100 (very high) and is a relative measure of air pollution: good (0–50), moderate (51–100), unhealthy for sensitive groups (101–150), unhealthy (151–200), very unhealthy (201–300), dangerous (numeric value higher than 301). The formula for calculating the numerical value of the AQI for each pollutant as well as the table with the index levels depending on the concentration of each pollutant in the air can be found in [
28].
Table 2 below shows the ranges of certain pollutants for which the corresponding qualitative categories of the AQI apply.
For each pollutant, the index is calculated on the basis of the measured, hourly concentration of each pollutant from 2014 to 2019 in the Sarajevo Canton. The total
AQI is the highest index of a pollutant at a given time at a single air quality measuring station:
2.4. Energy Consumption in SARAJEVO
The energy source balance of the Sarajevo Canton energy needs in 2018 [
21] is shown in
Table 3.
Table 4 and
Table 5 present an overview of solid fuel needs and electricity consumption in Sarajevo Canton for 2018, respectively.
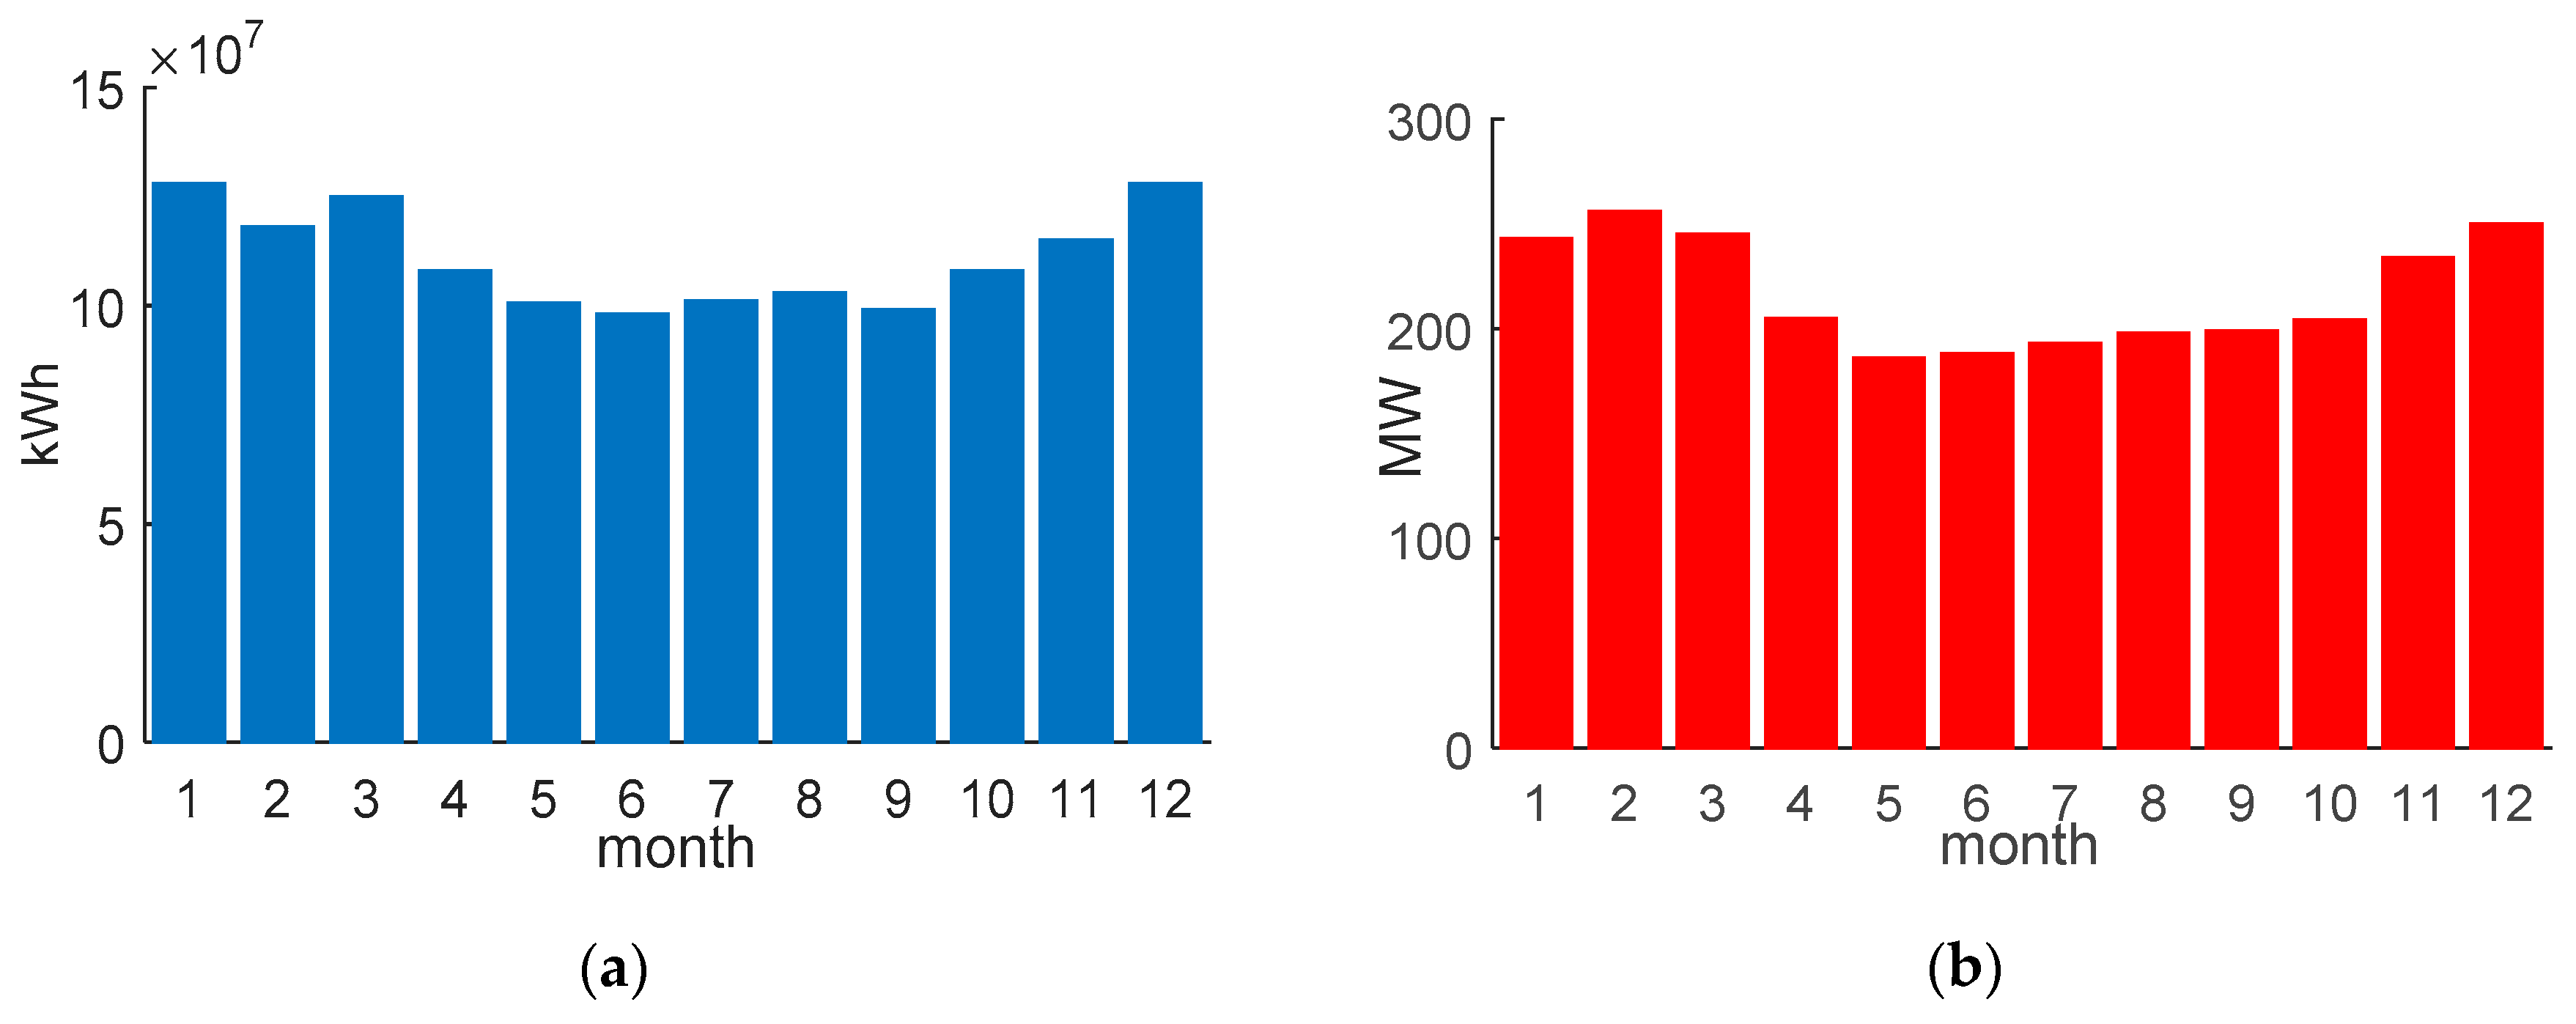
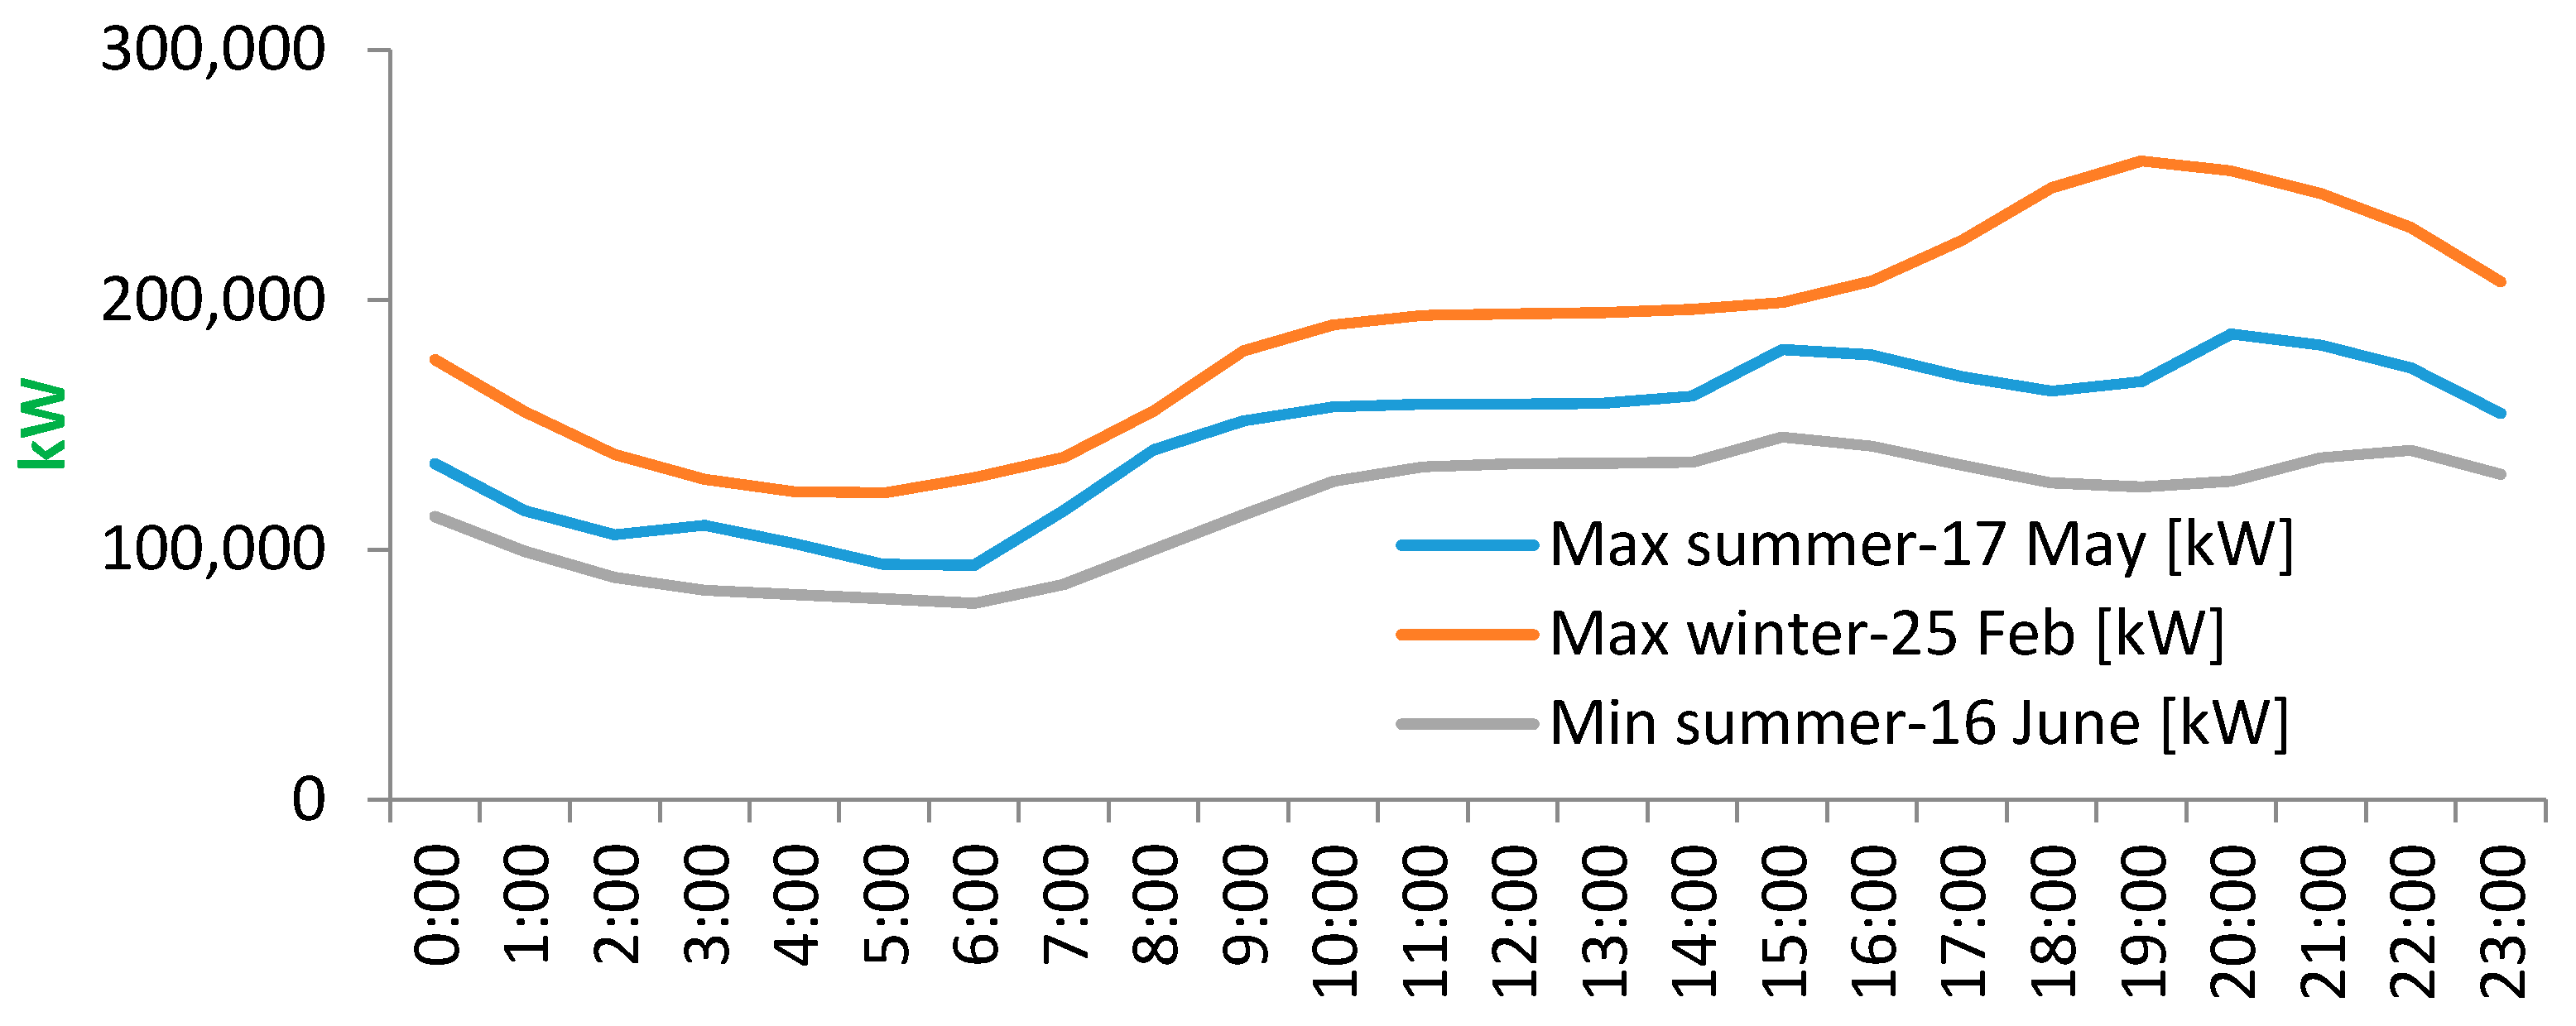
Figure 3 and
Figure 4 present the monthly electricity consumption, maximum active power measured in Sarajevo Canton for 2018 and active power load curves for characteristic days in Sarajevo Canton for 2018.
3. EMD-SARIMA Hybrid Model
In statistics and econometrics, the autoregressive integrated moving average (ARIMA) model has been used for many years to analyze and forecast time series. It consists of three parts:
Autoregressive model (AR)-a model that assumes that the time series behaves as a linear function of its lagged values.
Integrated component (I)-the part of the model that differentiates over the original time series.
Moving average model (MA)-a model that assumes that the error, i.e., the residual component of the series behaves as a linear function of errors from the past [
30].
This model is often specified as ARIMA (
p,
q,
d), where
p,
q and
d are parameters of individual components of the model.
P is the number of residual values of the series (regression to eigenvalues) over which the autoregressive model is performed,
q is the number of residual errors over which the moving average model is started, and
d is the degree of differentiation of the time series. There is also a seasonal version of the ARIMA model called SARIMA, and it contains three more parameters related to the seasonal version of the previously described parameters. Many time series are characterized by periodic behavior as a result of daily, weekly, annual, or some other periodicity. A seasonal multiplicative ARIMA model can be used to model such time series. The ARIMA seasonal model is recorded as follows:
where is:
m is the number of periods in the season.
The biggest problem in analysis and forecasting using the SARIMA model is the selection of parameters
p,
q,
d,
P,
Q and
D that should be selected by experts based on the analysis of time series components [
31]. In order to forecast the AQI and the production of electricity from the photovoltaic power plant, the hybrid EMD-SARIMA model [
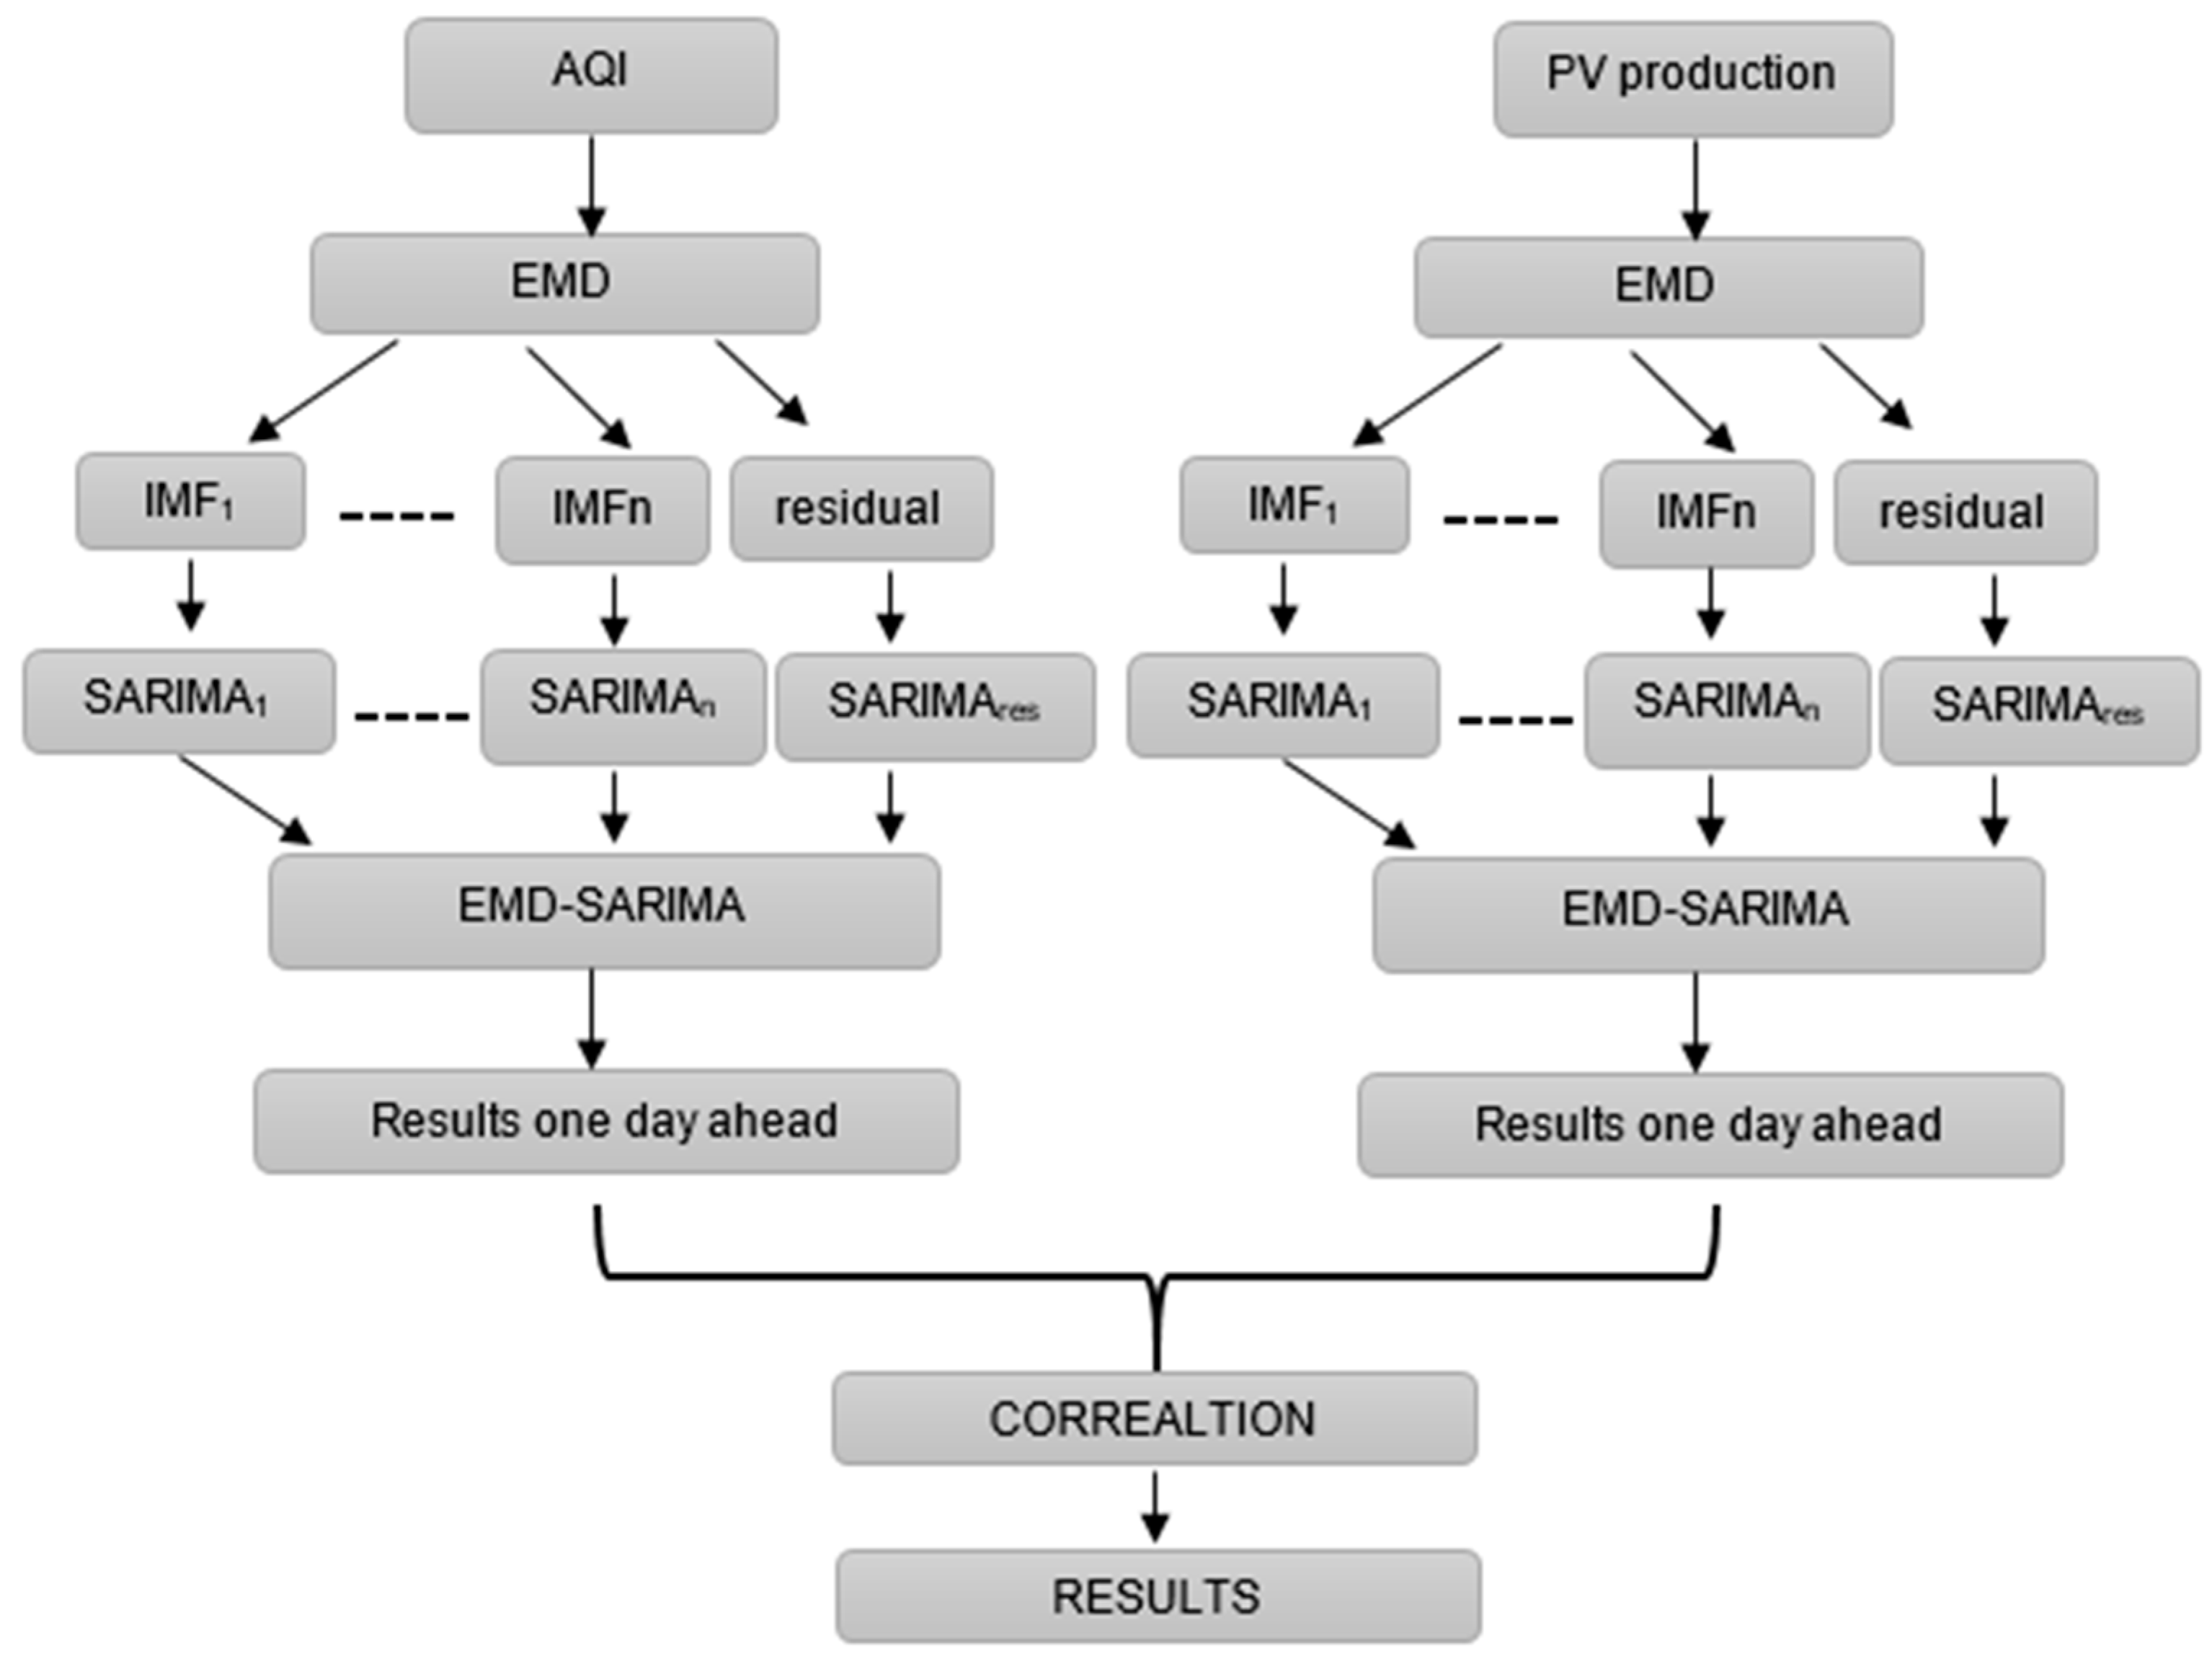
32] is used. The first step is to apply the EMD method to AQI and solar production time series in order to obtained intrinsic mode functions called IMF and residual. The method was primarily developed for the purpose of processing non-stationary signals and is based on the process of decomposing signals into a number of IMFs as an effective and efficient method for signal decomposition. After applying the EMD method, the SARIMA model is set up for each obtained IMF in order to obtain better prediction results. Forecasts are made one month ahead and based on the obtained results, a correlation is made between pollution (AQI) and electricity production from solar panels. The detailed procedure of the EMD-SARIMA modeling frame is shown in the
Figure 5.
The EMD algorithm can be represented as follows:
Step 1. The signal first identifies all local extremes-maxima and minima.
Step 2. Then all the local maxima are connected by the ‘cubic spline’ function thus obtaining the upper envelope. By connecting all local minima with the same function, the lower envelope is obtained.
Step 3. The upper and lower envelopes together cover the entire signal. Their mean value is denoted by
m1, where
is the upper envelope and
is the lower envelope:
Step 4. The difference between the original signal
x(
t) and the mean value of the envelope m
1 is the first component
h1:
Since the function
h1, has all the maxima positive and the minima negative, it should satisfy the definition of the IMF function. After the first iteration, local extremes may change. These new extremes can reveal the component of the corresponding frequency to which these extremes belong. By repeating this procedure, very small amplitude components that appear on the signal can be detected. In the next iteration,
h1 can be considered as a potential IMF. If it is determined that it does not meet the conditions set for the IMF function, then it is treated as a “new” signal and with it the process of obtaining IMFs is re-entered:
By repeating iterations
k times in the described way
h1k becomes IMF:
Furthermore, the problem that arises is the criterion for stopping the iteration process. There are two possible different criteria. The first, used by Huang himself, is a criterion determined by Cauchy’s condition for convergence. In particular, the condition requires the calculation of a normalized quadratic difference between two potential IMF functions obtained in adjacent iterations:
If
is less than some predetermined value, the iterative process will be stopped. This condition is strict, so it is very difficult to apply in practice. The disadvantage of this criterion is that it does not depend on the definition of the IMF function itself. The square difference may be small enough, but this does not guarantee that the function will have the same number of zero points and extremes. Therefore, a second criterion based on the coincidence of the number of zero points and extremes is imposed. The first IMF function c
1 contains the highest frequencies that appear in the signal. The obtained IMF function is subtracted from the original signal
x(
t) and other IMF function is obtained from the rest of the signal obtained by the same procedures [
33]:
This process continues and the following results are obtained:
The whole iterative process stops when any of the following criteria are met: either the
cn component or the
rn residue has become small enough to be less than a given value or when the rest of the
rn becomes a monotonic function from which further IMF functions can no longer be derived. Even if the original signal has a mean value equal to zero, the final remainder may still be nonzero. If the signal has a tendency (rise or fall), it is this final residue that will show what that tendency is. By summing all IMF functions and the final remainder, the original signal is obtained [
34]:
Seasonal autoregressive integrated processes of moving averages (
p,
d,
q) × (
P,
D,
Q)
m is achieved by removing the deterministic component are called stationary trend processes. The SARIMA model is used to model and predict time series with a consistent pattern of movement, seasonality [
35]. If there is seasonality in the time series, the time series can be modeled as follows:
where
is stationary, white noise. The component of the season is
, where
m is the length of the time series and:
The process
is a
process if [
35]:
where
and
are regular polynomials of the
and
processes, and
and
are seasonal autoregressive polynomials, and moving average polynomials for which the equation applies:
In general, there are four steps to create a SARIMA model:
Step 1. Examine the stationarity of the time series using the unit root test and examine the power spectrum for trend and seasonality, more precisely identification.
Based on the unit root test, a conclusion is made as to whether the series needs to be differentiated or not. The SARIMA model supports work with non-stationary data caused by the existence of a trend, so the parameter
d defines the order of differentiation which achieves stationary data. If the time series is already stationary, differentiation should be turned off by setting the parameter value to zero, thus avoiding unnecessary differentiation that could impair the accuracy of the forecast. The null hypothesis of unit root tests claims the existence of a unit root in a process thus withdrawing its nonstationary, while the stationary property is claimed by an alternative hypothesis. Thus, by rejecting the null hypothesis, with a certain level of certainty, the tests can confirm the stationarity of the time series. An example of a statistical test of this group is the extended Dickey-Fuller unit root test, abbreviated as the ADF test. The hypothesis testing is not performed on the original data, but on the values resulting from the first-order differentiation shown by the following equations.
Thus, the null hypothesis changes and the unit root exists, if the parameter δ is equal to 0. After performing the t-test to examine whether the parameter
δ is equal to 0, the obtained statistical value is compared with the critical values specific for Dickey- Fuller testing. If it is less than the defined critical values, the null hypothesis is rejected and the stationarity of the series is concluded with a certain level of certainty. Depending on whether there is a trend or a shift (the mean value of the time series is not equal to 0) in the data over testing is performed, it is necessary to choose a different type of testing that defines separate critical values. The extended Dickey-Fuller test allows the unit root to be examined over higher-order autoregressive processes, that is, when the future value of a time series depends linearly on
p previous values of the same series, where
p is a natural number. The general definition of such a model is shown by the equation:
Step 2. Make the necessary differentiation. If there is both trend and seasonality, then the data should be processed by seasonal differentiation, which means that differentiated values are not obtained by the difference of adjacent time series values as in ordinary differentiation, but by the difference of values distant for one season and estimate the trend.
Step 3. Examine the autocorrelation function (ACF) and the partial autocorrelation function (PACF) of a differentiated time series.
Step 4. Evaluate the model and examine the residuals, and compare the Akaike information criterion (AIC) and the Bayes information criterion (BIC) to identify the best model.
4. Methodology–New Approach
In this paper the IMFs and residual from EMD are separately modeled and forecasted by SARIMA in terms of their unique properties. The hybrid model takes full advantage of EMD as well as the properties of IMFs and SARIMA. Some of the previous study or analysis that can support this methodology are as follow. For example for AQI forecasting there are some research papers that employ hybrid models such as [
36,
37]. From a review of the literature, the hybrid models can make full use of various forecasting models. Also the hybrid models are effective at information extraction and can obtain more accurate prediction results [
38].
The choice of an adequate SARIMA model in the literature can be seen to depend on the input data and seasonality, for example it can be seen that a model SARIMA (0,0,1) × (0,1,1)
12 is used for modeling and forecasting monthly rainfall in Bangladesh [
39]. In [
40] is modeled Nigerian monthly inflation as a SARIMA(1,1,1) × (0,0,1)
12 and in [
41] is used a SARIMA(2,1,1) × (1,1,2)
12 to fit monthly mean surface temperature in Ghana. Also in [
42] is adopted the ARIMA model to predict the concentrations of NO
2, CO, SO
2, O
3 and PM
10.
A novel hybrid forecasting EMD–SARIMA model for air traffic has been proposed in [
31] and the results show that the hybrid framework can improve the forecasting accuracy.
This section presents a new concept of using fossil fuels in households and a new energy policy, more precisely the use of renewable electricity for the purpose of domestic heating in order to promote the Sarajevo Canton towards a smart city. This section is conceived in the following way, first the processing of measured pollutants data from different measuring stations from 2015 to 2019 is done. Then, for all pollutants, AQIs are calculated as a measure for determining the number of days in which the limit values of pollutants are exceeded. Furthermore, by applying the hybrid model EMD-SARIMA, the AQI for 2020 are identified, this Index provides information on the most polluted days in the year for Sarajevo Canton, and therefore extremely unhealthy for people [
43]. After processing the air quality in the Sarajevo Canton, the analysis for renewable electricity needs of households in Sarajevo Canton that use unclean fuels are presented.
4.1. AQI Forecast
In this methodology input data are AQI time series. More precisely model training data are used in the calculated AQI based on the collected measured pollution values of all pollutants.
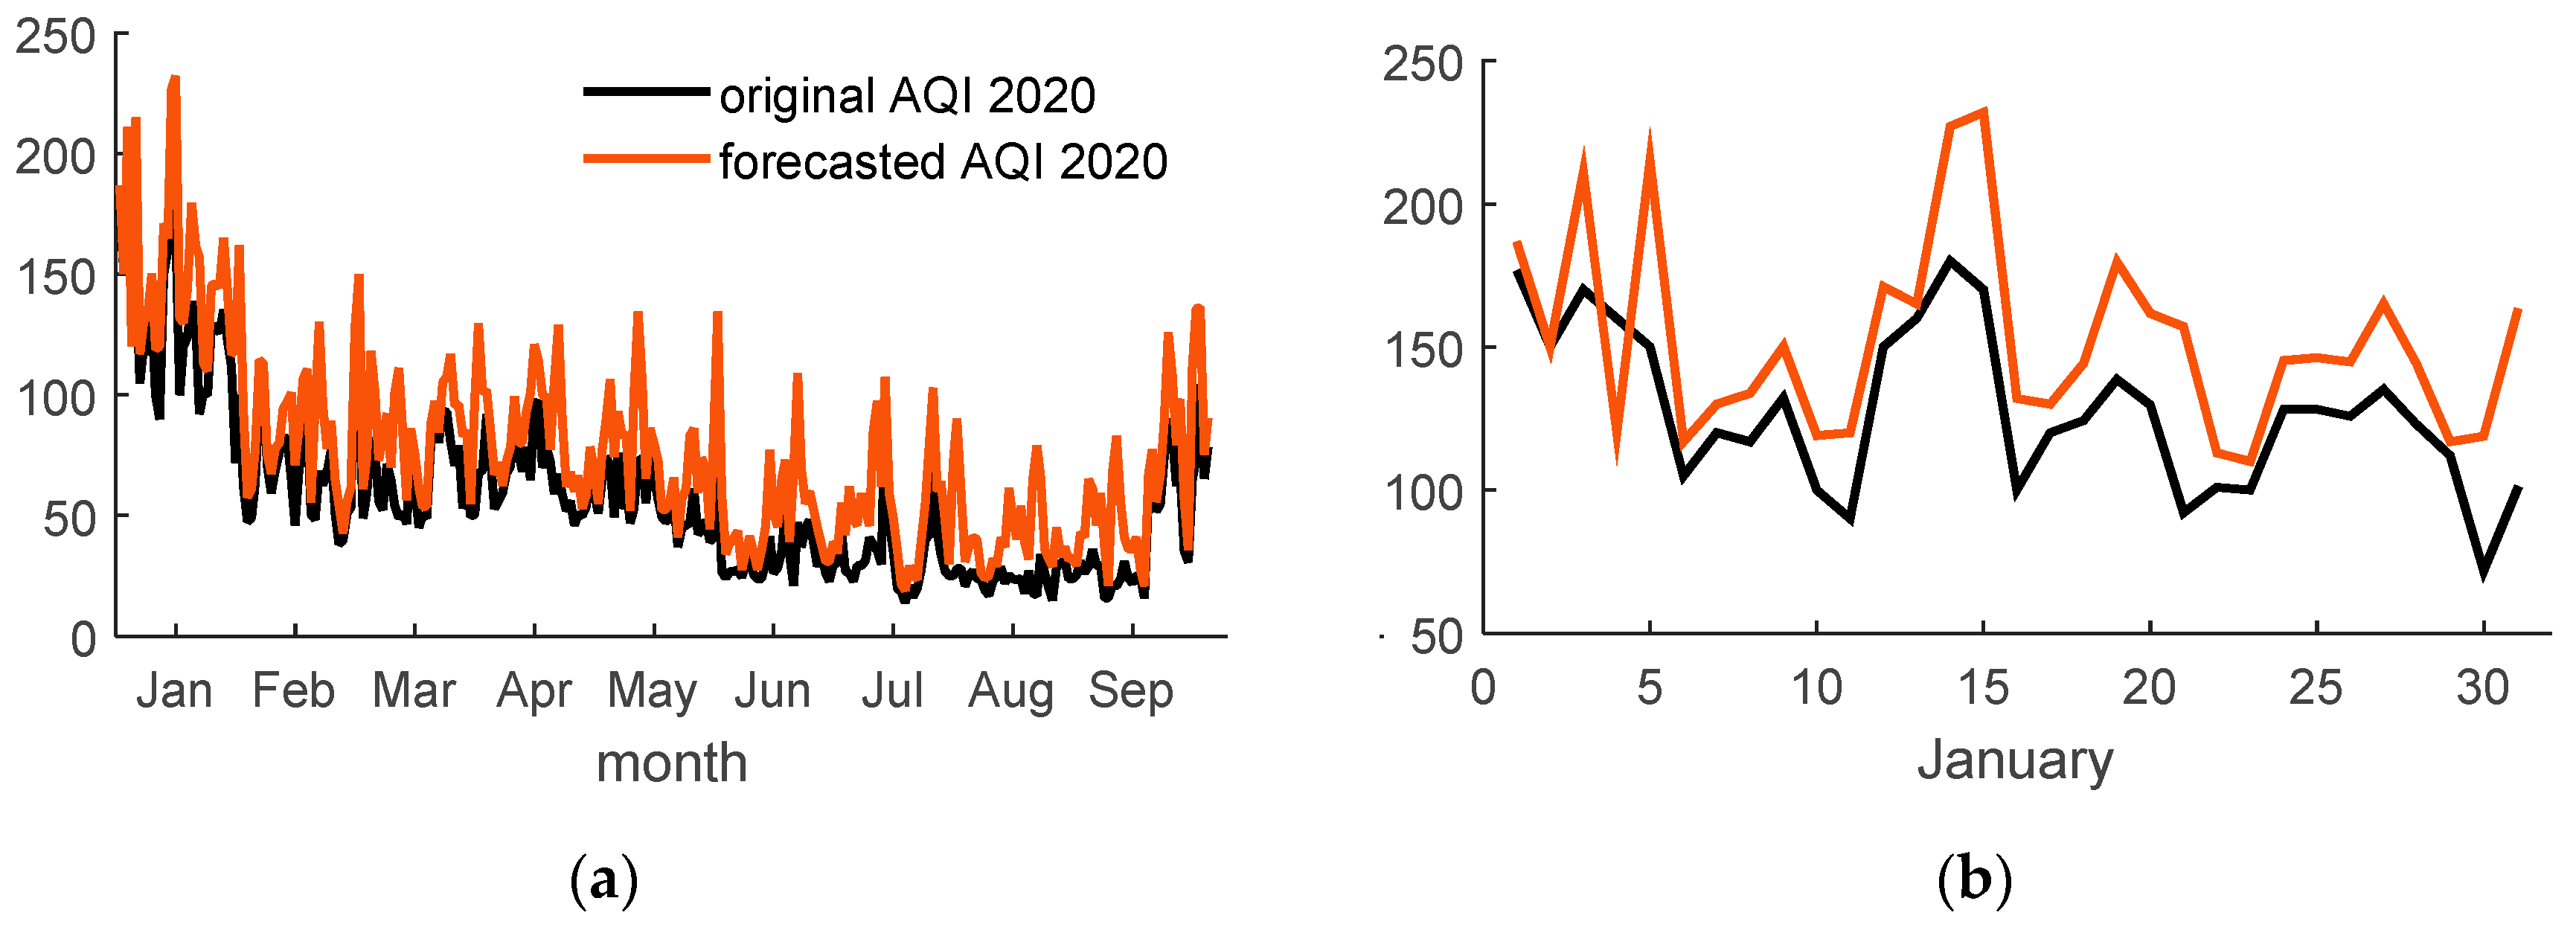
Figure 6a shows the time series of the calculated AQI in the period from 2015 to 2019. AQI time series on
Figure 6a are calculated on the basis of Equation (1) and in accordance with [
28]. The test data of the hybrid model are the values of the AQI for 2020.
Figure 6b presents the original measured AQIs for 2020. AQI data for 2020 are taken from [
44].
In general, there are two steps to AQI forecast used in this paper:
Step 1. Decompose the original time series of the AQI into components (IMFs) and residual (residual), from 2015 to 2019.
Step 2. Identification of the SARIMA model, all its seasonal and non-seasonal parameters. In this step autocorrelation (ACF) and partial autocorrelation (PACF) are examined to determine the best combinational order of the SARIMA model for each data set.
In the first step, nine IMFs are obtained, and one residue, shown in
Figure 7. The high frequency components are identified from IMF 1 to IMF 4, and the low frequency components are given from IMF 5 to IMF 9. The last component is the residual showing the trend of the original time series.
The first model implemented in this paper is a SARIMA without autoregressive coefficients, p and P both equal 0 (no significant positive spikes in ACF and PACF plots). The ACF and PACF plots are used as a starting point to determine the best SARIMA parameters. According to the most used notation the model belongs to the SARIMA (0,1,1) × (0,1,1)
12 type. Since the time series data of AQI have seasonal and non-seasonal trends, a non-seasonal and seasonal first order differencing are employed. In this model D of 1 calculate a first order seasonal difference and a Q = 1 use a first order errors in the model. Also, the value m = 12 means that the data is monthly and suggests a yearly seasonal cycle. The model can be analytically formulated as follows:
It was found that the model fitted the data well and the stochastic seasonal fluctuation was successfully modelled. The AIC and BIC values of all selected models are shown in
Table 6. Obviously from
Table 6 can be seen that the model SARIMA (0,1,1) × (0,1,1)
12 has the smallest value of AIC and BIC. Once the model is established, the parameters can be estimated using statistical techniques, such as least square estimation method. According to specific case in this paper and the estimation of the model parameters the equation is:
.
After the framework model is defined, an estimate of its parameters is approached. Then, based on the ARIMA model, the parameter of each AR and MA coefficient for non seasons
p, q and seasons
P,
Q, are identified. In the context of identifying the parameters of a model and predicting future events, Bayesian analysis is indispensable. Using this analysis, predictions can be made by integrating all parameters in accordance with the data, depending on the distributions, the probability of a particular model can be calculated, which leads to a principled way of selecting model parameters: SARIMA (0, 1, 1) × (0, 1, 1)
12. The results are presented in
Figure 8 and
Table 7.
According to [
45], the mean absolute percentage error (MAPE) less than 10% shows highly accurate model performance predictions.
For further continuation of the creation of measures for the improvement of the Sarajevo Canton, the time period to be considered is 80 days, the model predicted 79 days with exceeding the Index, while the actual value is 80 days.
The focus of the research is to identify the number of days during which AQI values are exceeded. The goal of future work and development of the Sarajevo Canton is the use of digital electronics that constantly monitor energy consumption, which would ensure the possibility of managing devices, i.e., to limit fuel consumption depending on the pollution and to limit energy consumption depending price of electricity. The idea is to stabilize and control energy consumption in the household for the purpose of saving and protecting the environment. During periods of expensive electricity (usually when the sun is shining) and exceeded AQI values, PV producers can consume their produced solar electricity locally and put the surplus in the grid. This would further benefit the regulation of local solar electricity consumption.
4.2. Solar Energy
In order to ensure clean, renewable energy for domestic heating, the use of the planned floating photovoltaic power plant on Lake Jablanica is incorporated, as well as the application of solar collectors on the roofs of houses for the production of electricity.
4.2.1. Floating Solar Power Plant
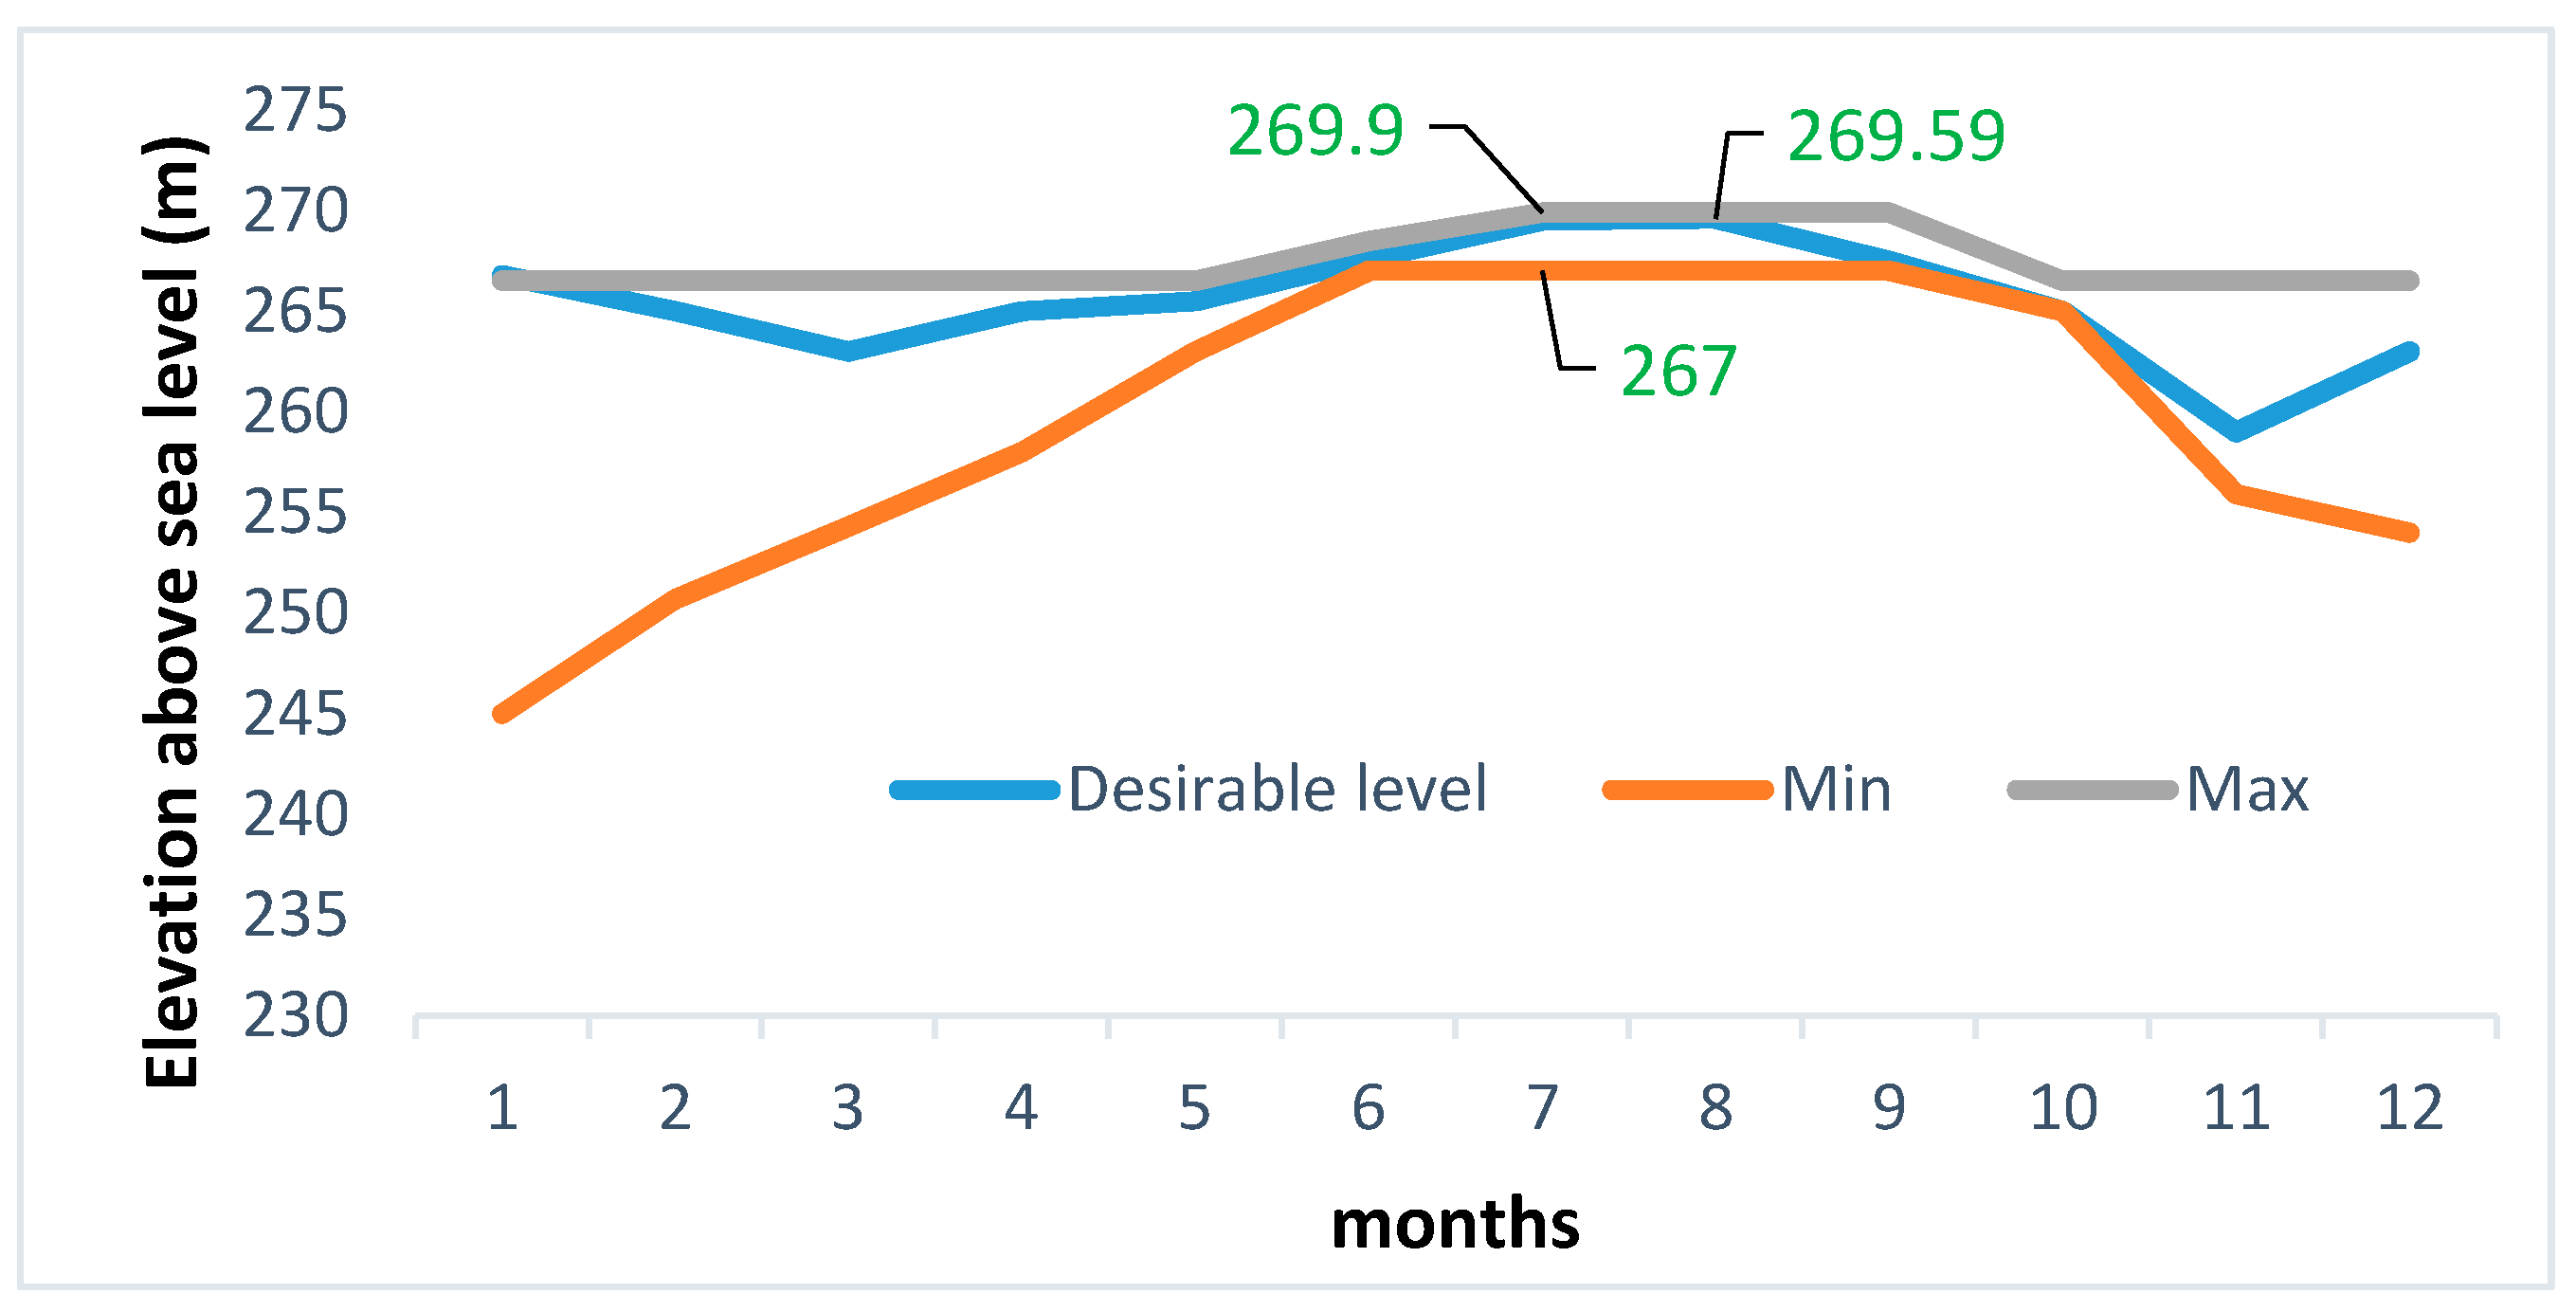
For selecting potential locations of a photovoltaic power plant construction, solar radiation maps and a transmission network map are taken into account. According to the advantages of floating photovoltaic power plants, the third condition for construction is a suitable water surface. The optimal location for the construction of the first floating photovoltaic power plant in Bosnia and Herzegovina is accumulation Lake Jablanica, which is actually an accumulation pool built for the needs of the hydroelectric power plant Jablanica. Desirable and boundary conditions of the accumulation lake are presented by the diagram in
Figure 9.
After selecting the appropriate type of photovoltaic module and inverter, it is possible to calculate the exact area of the lake that needs to be covered with photovoltaic panels. As the area will be divided into ten equal parts, the calculation will be carried out for a plant power of 3 MW. After obtaining the value of the area of one part of the plant, it is necessary to select the ten most suitable locations on the lake in order to obtain a plant with a capacity of 30 MW. In order to obtain the total area of the plant with a capacity of 30 MW, the obtained area of the plant with a capacity of 3 MW will be multiplied by ten, which means that the required area of the plant is 445,729.95 m2. Since the total area of the lake is 14.4 km2, and floating photovoltaic panels occupy 0.446 km2, about 3% of the lake area was used.
Bosnia and Herzegovina is in the zone of average solar radiation whose annual values range from 1200 kWh/m
2 to 1600 kWh/m
2 for the northern parts, and for southern parts from 1300 kWh/m
2 to 1800 kWh/m
2. Using PVGIS software, basic data on electricity production from a photovoltaic power plant were obtained. By creating a report for the entered parameters describing the characteristics of the floating photovoltaic power plant and the selected location, it was obtained that the annual electricity production from one part of the plant (3 MW) is 3.61 GWh.
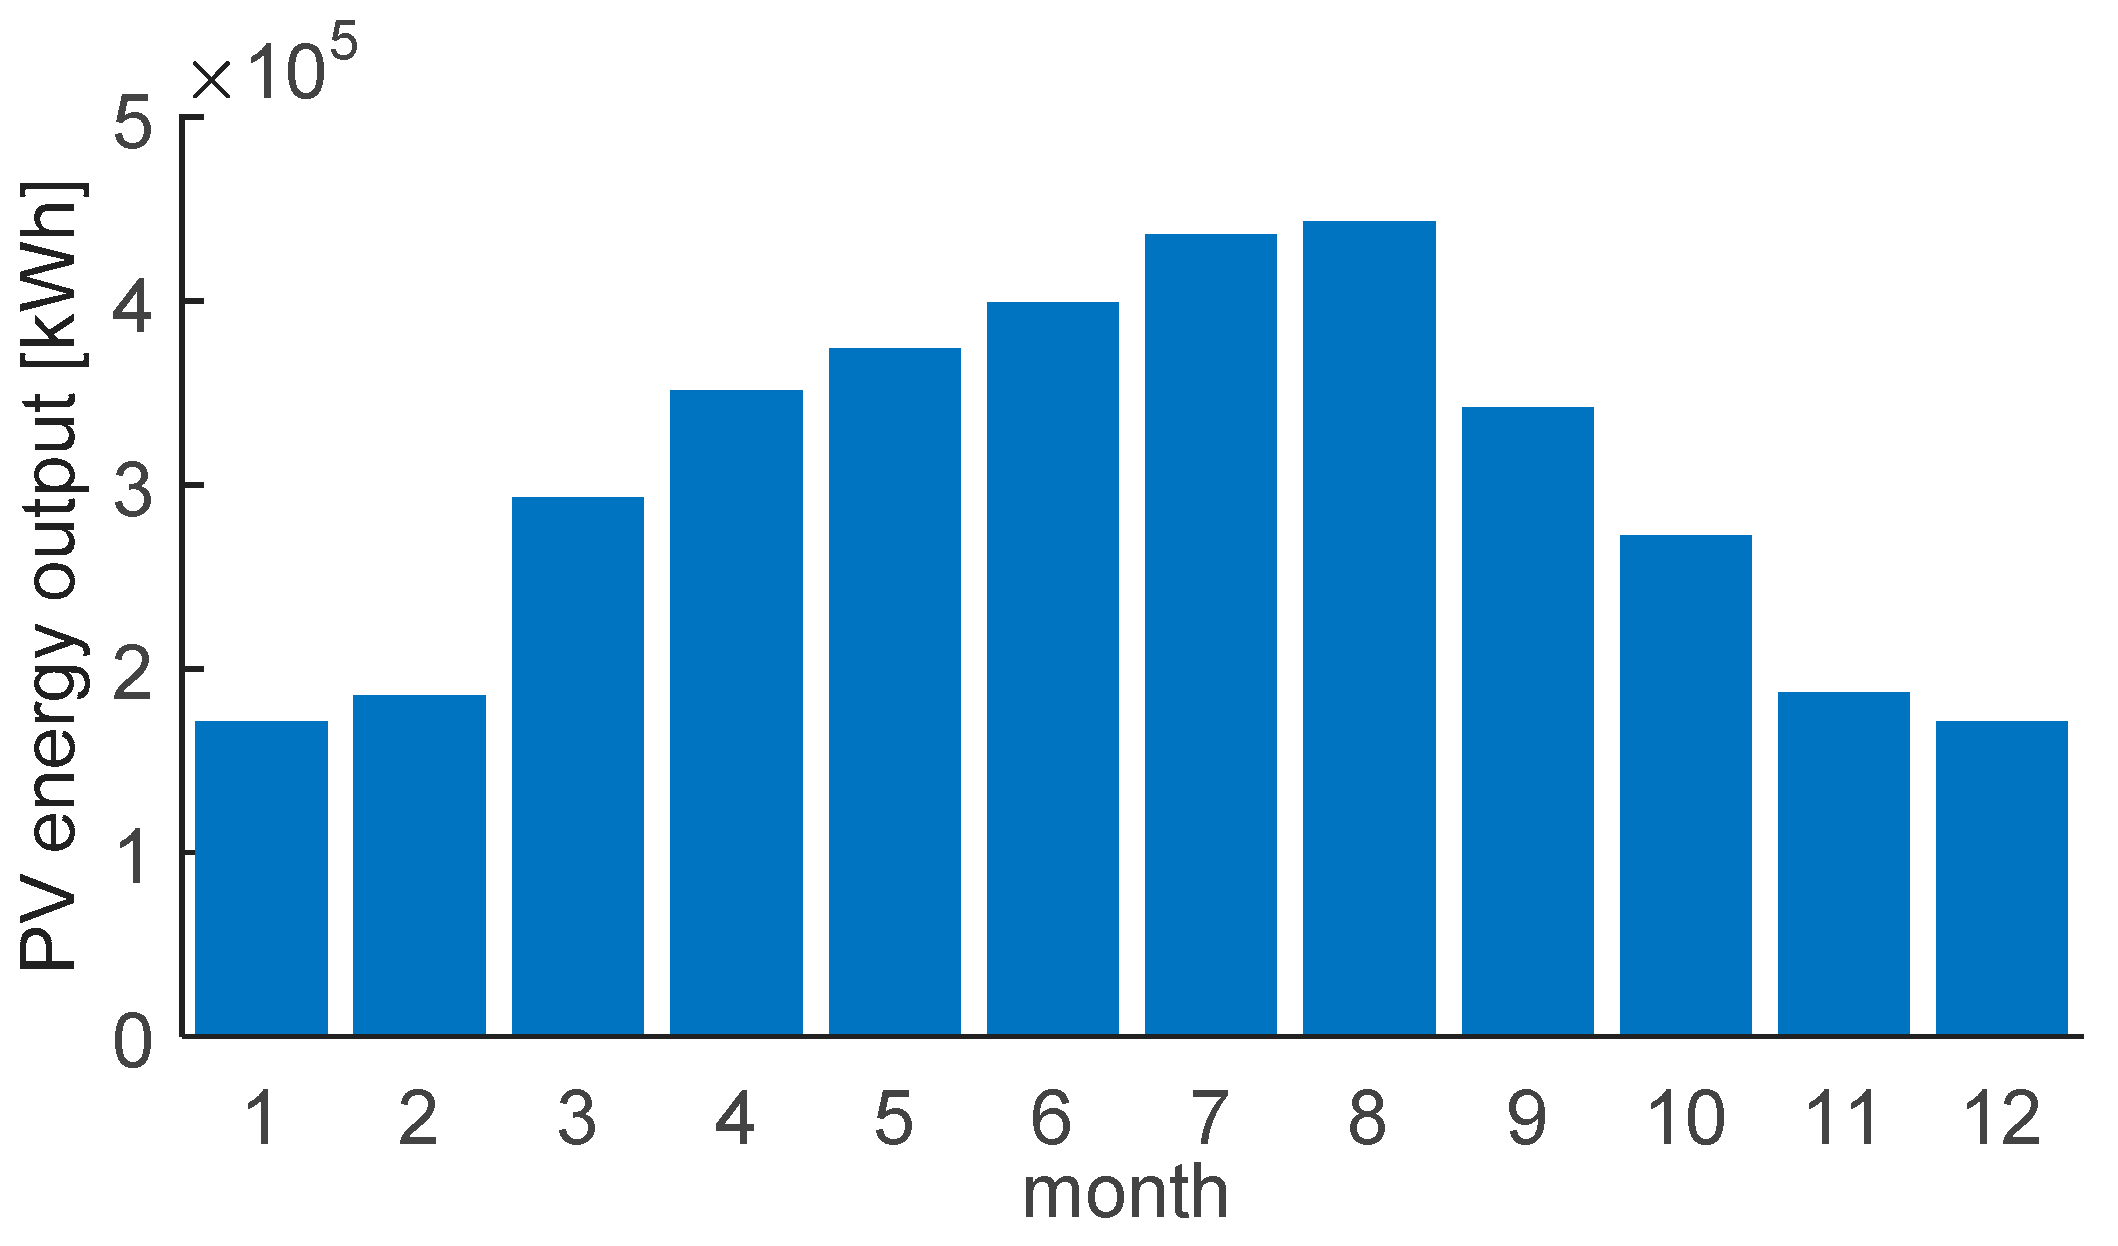
Table 8 provides data on the average monthly electricity production from a floating photovoltaic power plant (Em), then data on the average value of global irradiation that panels receive on a monthly basis (Hm), and the standard deviation of monthly electricity production (SDm), where annual variations of parameters are taken into account. Data are given for a 3 MW plant.
Figure 10 present the average electricity production from a 3 MW photovoltaic plant per month.
Multiplying the value of electricity produced from one part of the plant by the total number of parts of the plant, it is obtained that the annual production of electricity from the entire floating photovoltaic power plant is 36.1 GWh. This amount of electricity produced would lead to an annual accumulation of water with a total volume of 1458 × 108 m3 or 1458 × 1011 L of water.
4.2.2. Electrical Energy Needs for Heating
After the analysis and identification of the number of days with excessive emissions of pollutants, harmful to human health in accordance with the qualitative categories of the Air Quality Index, this section provide recommendations for the use of renewable electricity. A very important aspect in the whole process of improving the state of air quality in Sarajevo Canton is the low economic standard of citizens. Coal is the cheapest energy source, which is 30–40% cheaper than firewood and gas, and 2–3 times cheaper than electricity. In the case of using a more environmentally friendly energy source, heating costs would increase significantly, which is unacceptable with the existing standard of living.
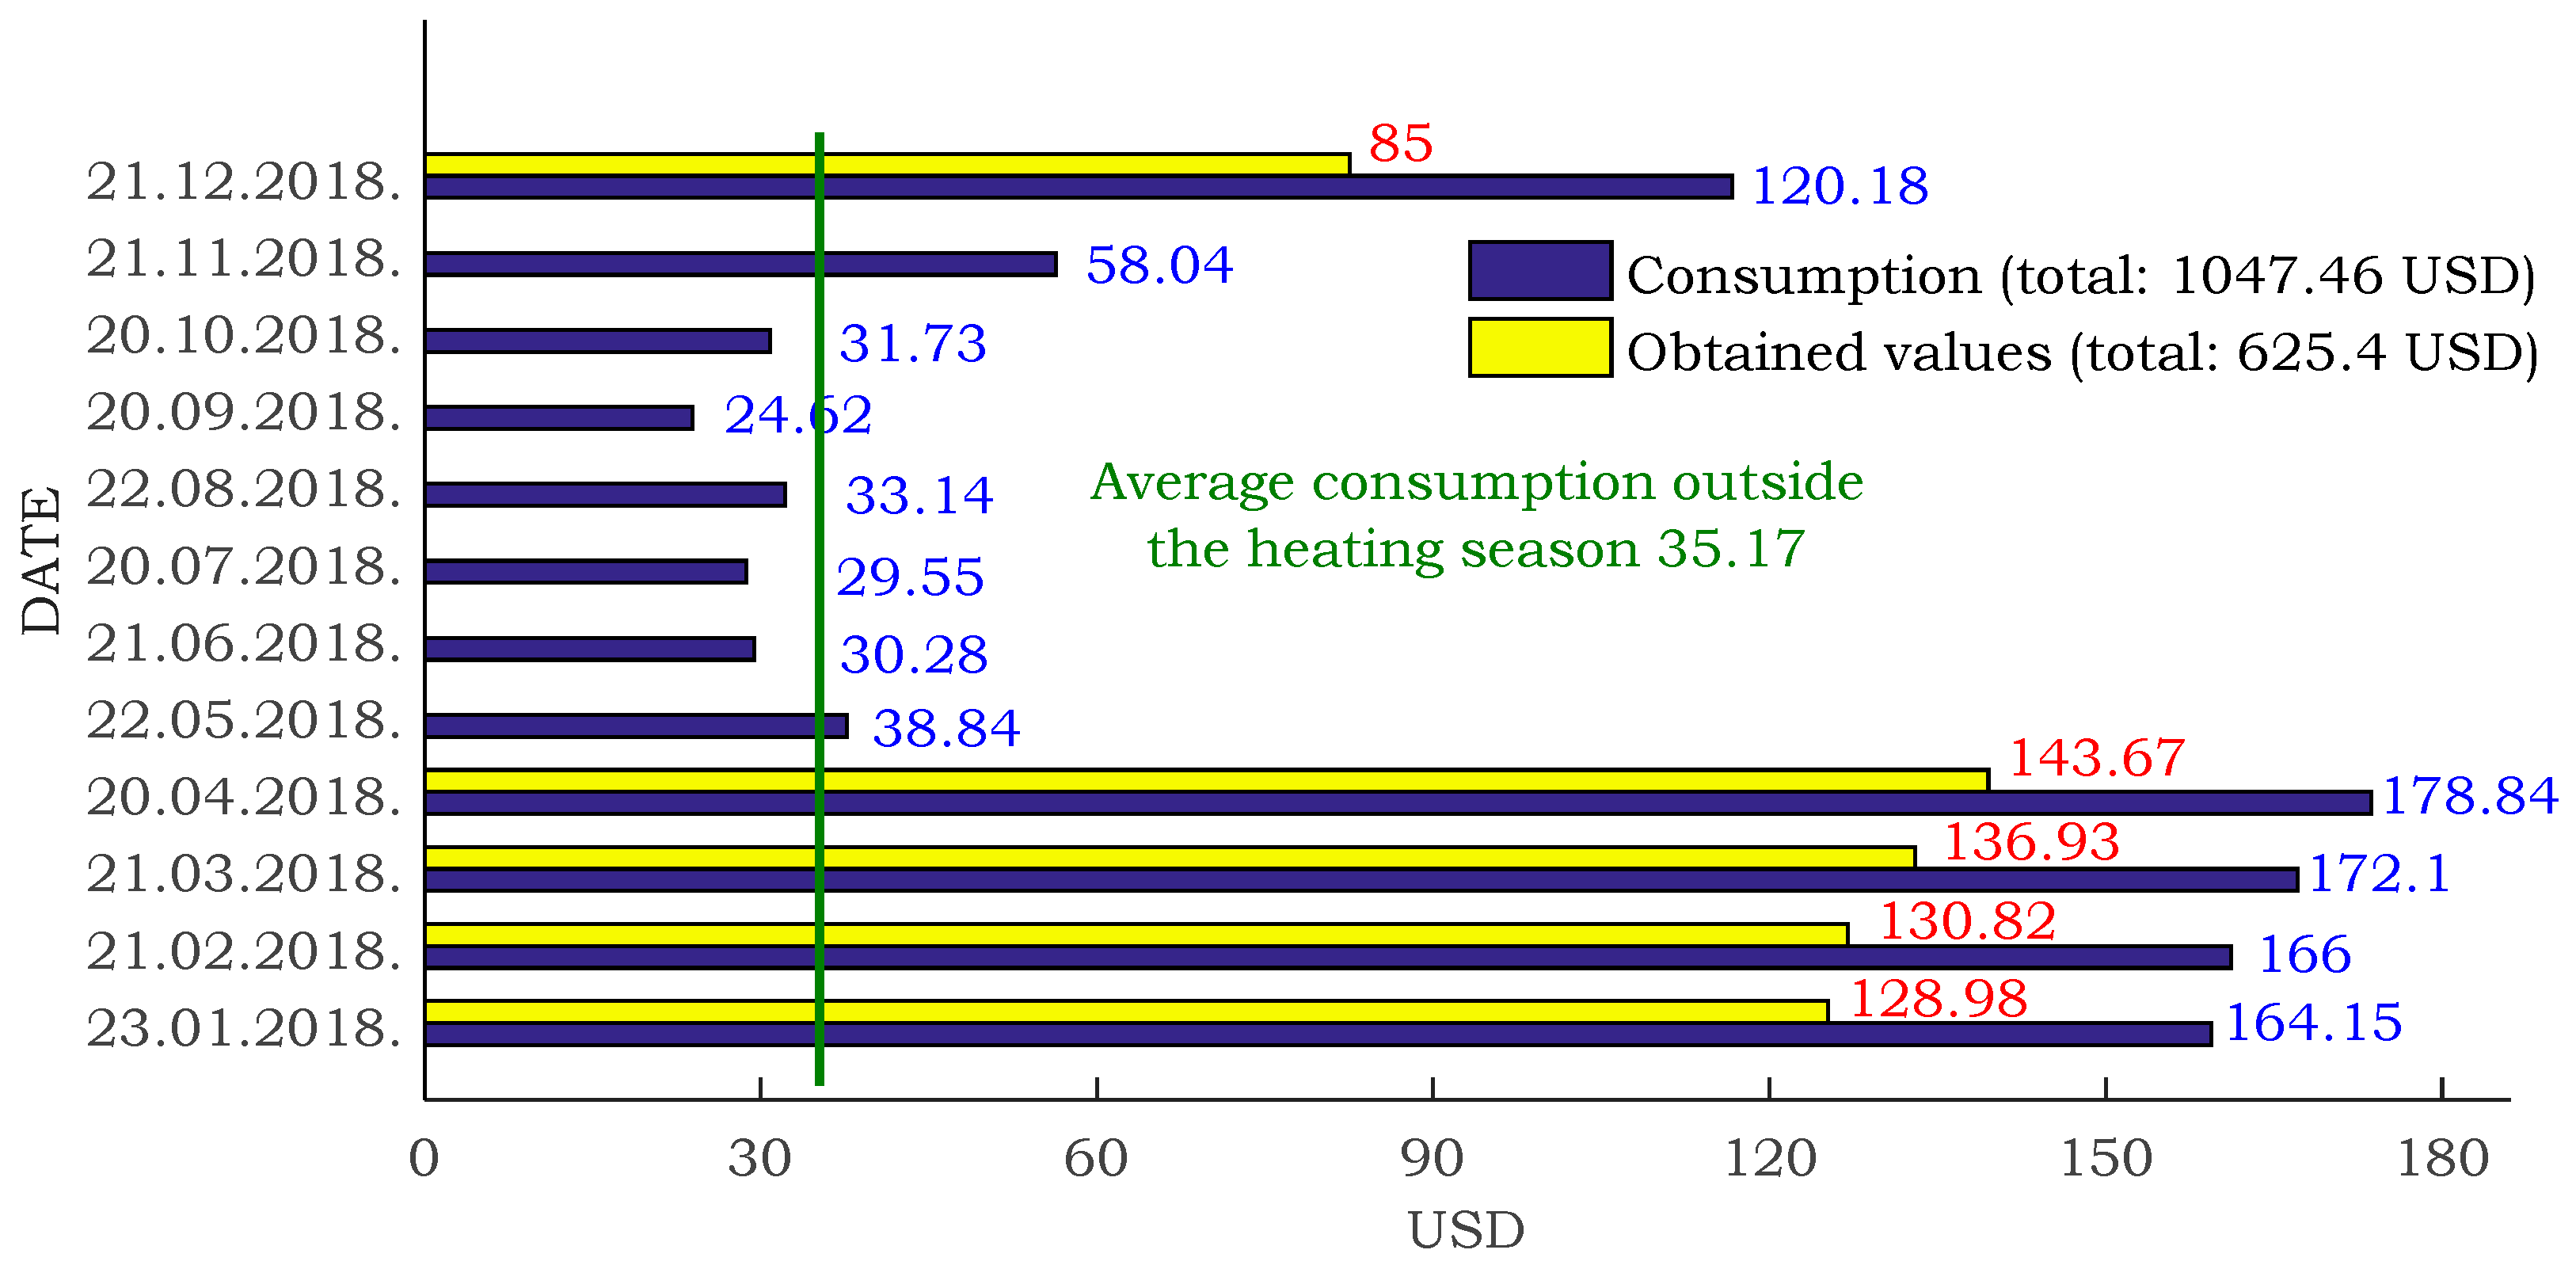
Furthermore, the analysis of one electricity bill on an annual basis for an apartment of 60 m
2, heated by electricity, will be approached (
Figure 11). The invoice is taken from PE Elektroprivreda BiH Ltd. Sarajevo, Branch “Elektrodistribucija” Tuzla, Gračanica.
By analyzing the electricity bill, it is established that the total annual household costs for electricity are 1049.38 USD, after calculating the average consumption outside the heating season, the value of 35.24 USD is obtained, which is also the value of consumption on a monthly basis of household electricity without heating on. Then, the mentioned value is subtracted from the monthly consumption in order to obtain the actual consumed electricity for heating during the heating season, and that amount is at the annual level of 626.55 USD (on
Figure 11 marked as obtained value). In order to calculate the consumed kWh of electricity for heating, the price is taken from the calculator for calculating the amount of the monthly electricity bill [
47] in the amount of 0.08 USD/kWh. The selected households are from the customer group and the I (first) tariff group.
In accordance with this price, 6300 kWh is spent on heating a residential unit of 60 m
2 for a period of five months, January, February, March, November and December. What is important to point out from the previous section is that the calculated and predicted maximum, exceeded values of the Air Quality Index on an annual basis are adopted with 80 days. Within this paper, for further analysis of household needs for renewable electricity for heating, a housing unit of 100 m
2 is analyzed, and the number of days for analysis is 150 days. During 150 days predicted AQI are moderate, unhealthy for sensitive groups, unhealthy and very unhealthy.
Table 9 below presents the kWh needs for a housing unit with an area of 100 m
2, during 150 days of the heating season, so 10,500 kWh is needed with corresponding price of 1046.18 USD.
Due to different types of coal used for heating in Sarajevo Canton with different prices, as well as due to the inefficiency of furnaces and boilers of individual stokehole for a unit of 100 m2, which is considered heated throughout the day and in all rooms, in accordance with general living standards, coal consumption averaged about 8.4 tons for one heating season (six months). The average price of coal in Sarajevo Canton is 92.86 USD. Regarding firewood, the situation is as follows, for the mentioned household the needs for one heating season are in the amount of 19.5 m3.
The following
Table 10 shows the needs of households with the same characteristics for solid fuel, more precisely coal and firewood, in order to achieve satisfactory heat conditions depending on the number of observed days during the heating season. For the purposes of calculating costs depending on the energy source, the following prices are taken, coal with the unit price of 92.86 USD, while for one cubic meter of firewood the unit price is 49.52 USD.
From the table it is possible to establish that the heating needs of the analyzed household for 150 days during the heating season is 7 tons of coal with a corresponding price of 650 USD per year, while 16.5 m3 of firewood is needed for 150 days during the heating season, with a corresponding price of 817.13 USD per year.
Regarding the issuance of guidelines for the use of cleaner renewable electricity, the number of households not connected to district heating is observed. The number of households that are not connected to district heating is in the amount of 74,512. However, data from a conference held at the end of 2019, organized by the Heinrich Boell Foundation entitled “Air Pollution in BiH”, which presented two analyzes that offer long-term and simple solutions to air pollution in BiH cities, show that the total number of households using solid fuels in the Sarajevo Canton are 35,000. Thus, according to data from aforementioned conference, for 35,000 households, the need for electricity in terms of heating is 196 GWh (
Table 11).
The proposed floating photovoltaic power plant on Lake Jablanica has an installed capacity of 30 MW and in accordance with its geographical position and insolation, its annual electricity production is 32.4 GWh. Based on the data given in the table above, it is possible to calculate the number of households (out of the total number of 35,000) that could cover their heating needs from renewable electricity with electricity produced from the floating solar power plant.
Herefore, it can be concluded from the
Table 12. that the number of households that could cover their needs for electricity heating from the planned floating photovoltaic power plant on Lake Jablanica is 5786. As this number and energy produced annually from the plant do not cover the total number of households who use solid fuels in Sarajevo Canton, it is necessary to define additional measures that would mitigate the negative effects of using solid fuel for domestic heating, and improve aspects not only of air quality, but the general living standard in Sarajevo Canton.
Furthermore, as the electricity need for 35,000 households in Sarajevo Canton (currently heated by solid fuel) for the identified 150 days, is 196 GWh, and the proposed floating power plant produces 32.4 GWh, the remaining electricity need, in the amount of 163.6 GWh, could be covered by installing solar photovoltaic systems on the roofs of houses.
4.2.3. Solar Prosumers
Furthermore, an analysis of the selected photovoltaic system configuration will be approached. The proposed system would produce electricity from the sun and deliver it to the public electricity grid.
The remaining need for electricity is as previously stated 163.6 GWh. To meet the needs of one household, we divide the required GWh by the number of households. The obtained value of electricity need per one household for the electric heating is 4700 kWh. This value represents the needs of one household for the remaining needs for electric heating for the period of the identified 150 days of exceeded AQI.
For the purpose of this paper and in accordance with the required kWh, the following photovoltaic modules of 16 m
2 are selected, placed on the roof of the household at an angle of 30° and azimuth 0°, on one side of the roof, facing south if possible. The electrical efficiency of the photovoltaic modules is 20%. The electrical efficiency of the photovoltaic module can be calculated by using following equation [
48]:
where
η is electrical efficiency of the photovoltaic module,
PPV output electrical power of the photovoltaic module,
APV is area of photovoltaic module and
GS is solar irradiance.
Installed power: 3.7 kWp
Area required per kW: 5 m2
Module technology: monocrystalline silicon
Typical power per panel: 330 W
Number of panels: 10
Panel dimensions: 1650 × 991 × 35 mm
Annual production: 4700 kWh
CO2 emission reduction: 3 t/a
In order to select the appropriate solar prosumer it is necessary to go through a few steps, the first is defining the consumption of the object. When the daily energy requirements are determined, the basic system parameters, the battery capacity and the energy required for daily battery charging, the number of photovoltaic modules can be determined.
From the public service PVGIS the data on how many kWh in a given month at the target location with the given orientation and slope of the module can produce 1 kWp of photovoltaic modules are obtained. The required number of modules is determined by dividing the obtained required power by the power of one module. Also, the area of a photovoltaic system is simply obtained by multiplying the number of modules by the area of one module. The capacity of a solar prosumers is designed in such a way that its own production satisfies the customer’s needs for electricity in times of more expensive tariffs. The solar prosumer is connected to the installation of the building and is in parallel with the public distribution network.
Significant application of solar prosumers can result in challenges to manage the distribution grid, but at the same time provide additional flexibility and facilitate better grid integration through smart applications, above all they will be the source of electricity supply to consumers at the lowest cost and benefit society as a whole.
There are various reasons for connecting a photovoltaic system to a distribution network. Some of the main reasons are: limiting CO2 emissions and protecting the environment, avoiding additional construction of networks and large generation units, increasing the quality of electricity and the availability of the distribution network, encouraging competition, etc.
4.3. Solar Production Forecast
In this section is presented solar production forecast using the EMD-SARIMA hybrid model.
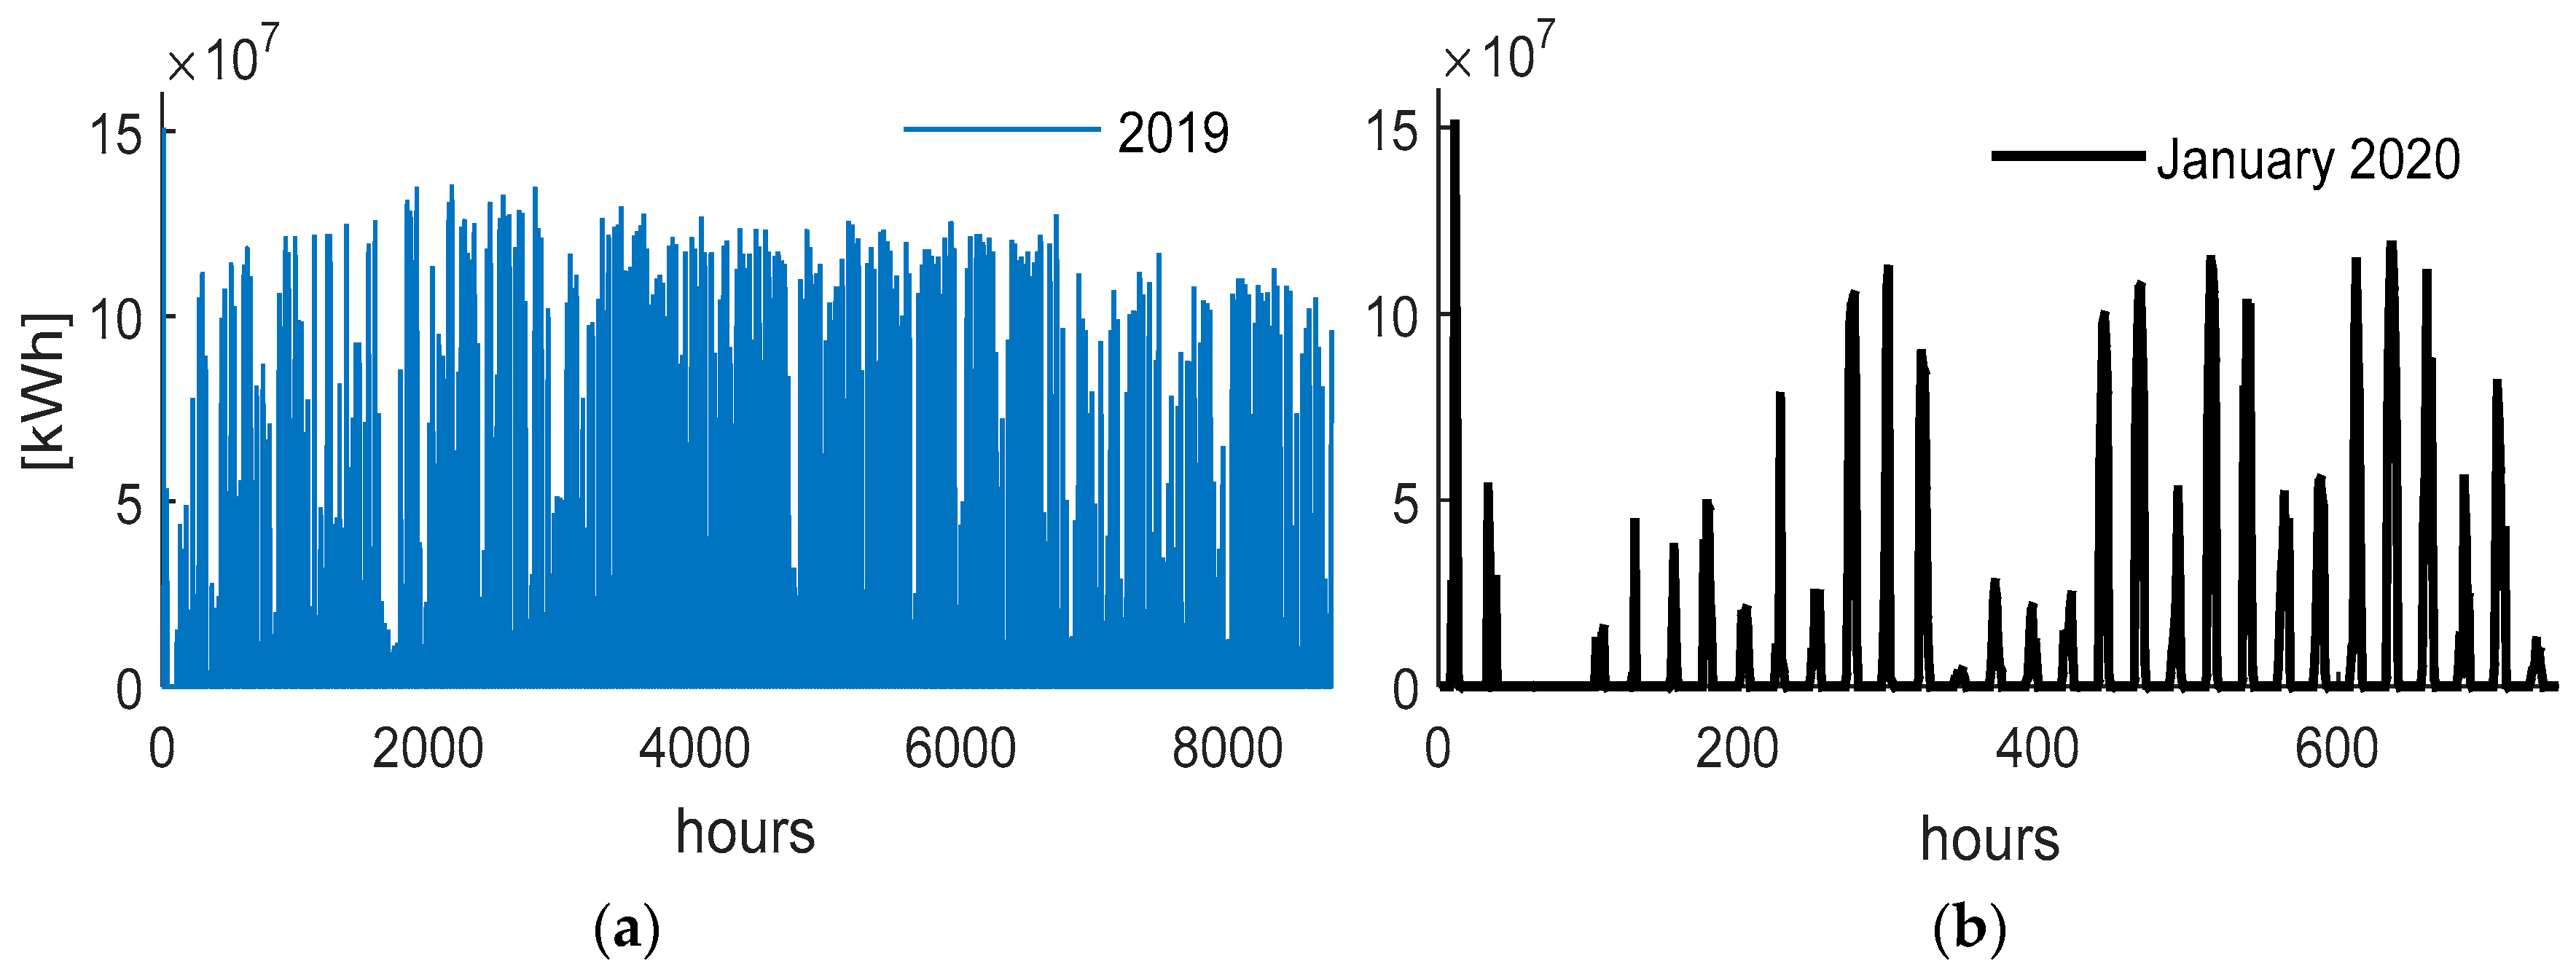
Figure 12 presents PV 160 MW production for 2019 and for January 2020.
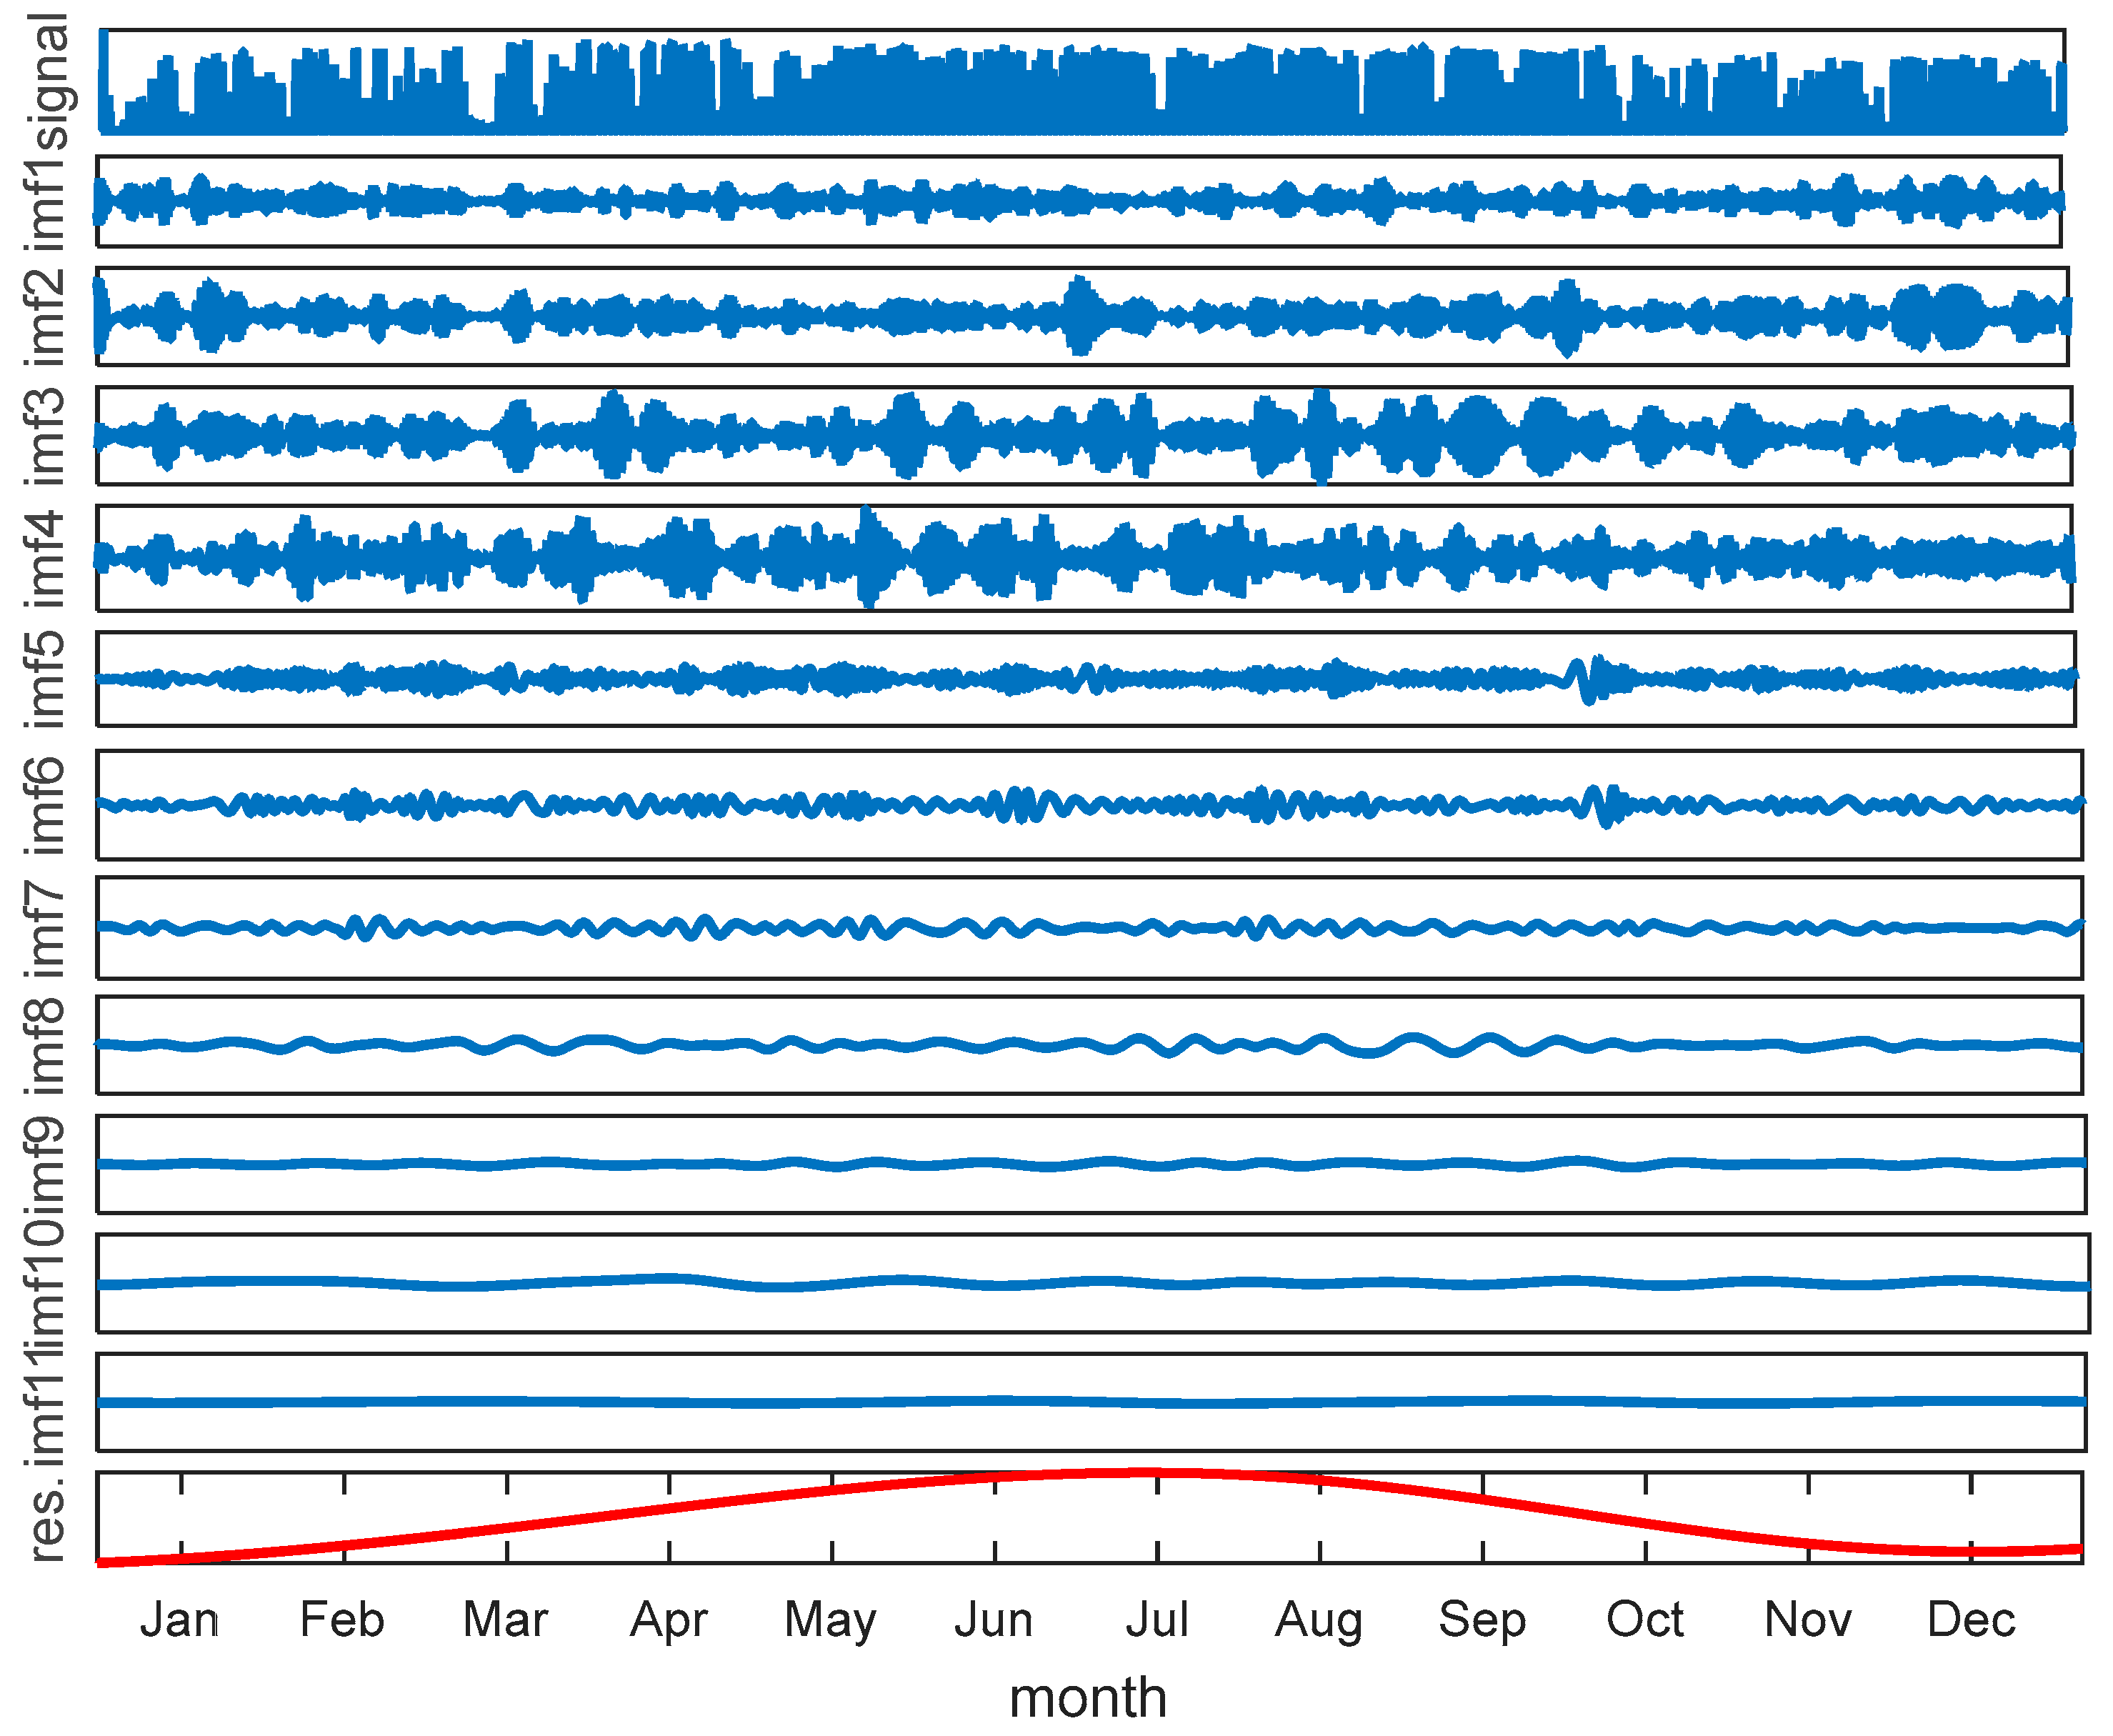
Firstly, EMD approach is applied over time series of the PV 160 MW production. As a result components (IMFs) and residual (residual) of original time series are obtained. After decomposition, eleven IMFs are obtained, and one residue, shown in the
Figure 13.
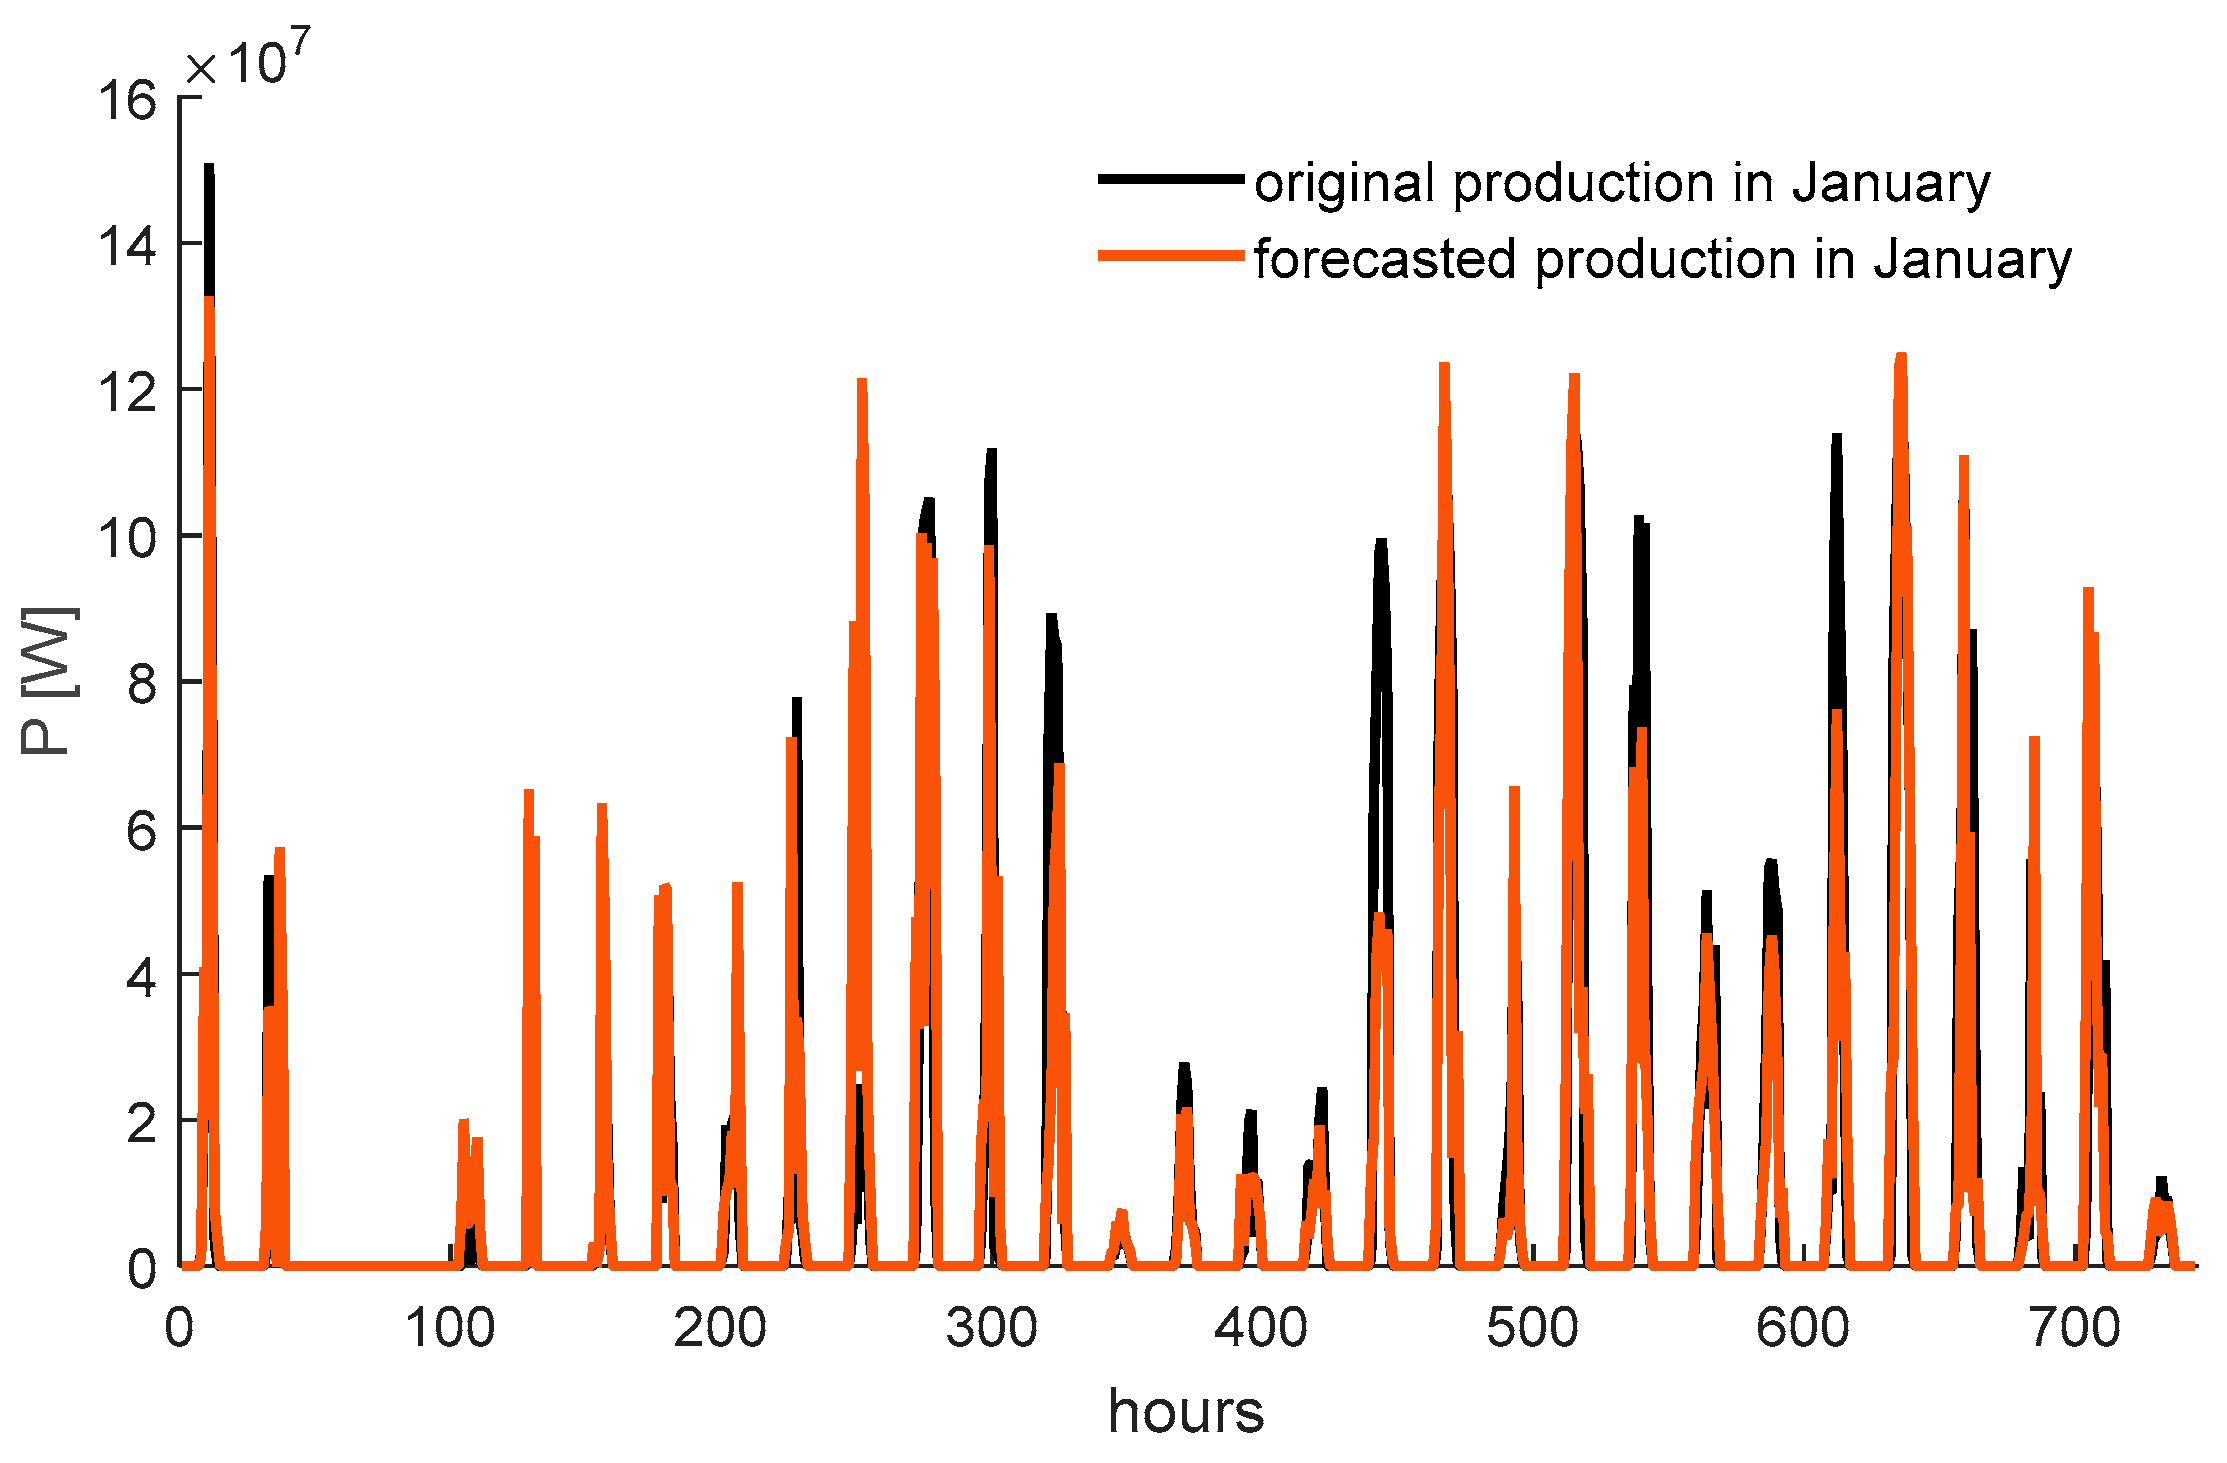
Then the identification of the SARIMA model seasonal and non-seasonal parameters is done. The forecasted results of electricity production from PV in January 2020 are presented on
Figure 14.
The same principle, criteria and use of graphs ACF and PACF are applied in this section as in
Section 4.1 for fitting the SARIMA model. In accordance with the lowest values of AIC and BIC, the best model is chosen. The form and parameters of the best fitted model are: SARIMA (1, 0, 1) × (0, 1, 1)
12. The results are presented in
Table 13 and the mean absolute percentage error (MAPE) is 4.52 (%).
4.4. Results and Correlation
The results of the correlation between the applications of renewable sources in domestic heating instead of fossil fuels with environmental pollution are presented in this section.
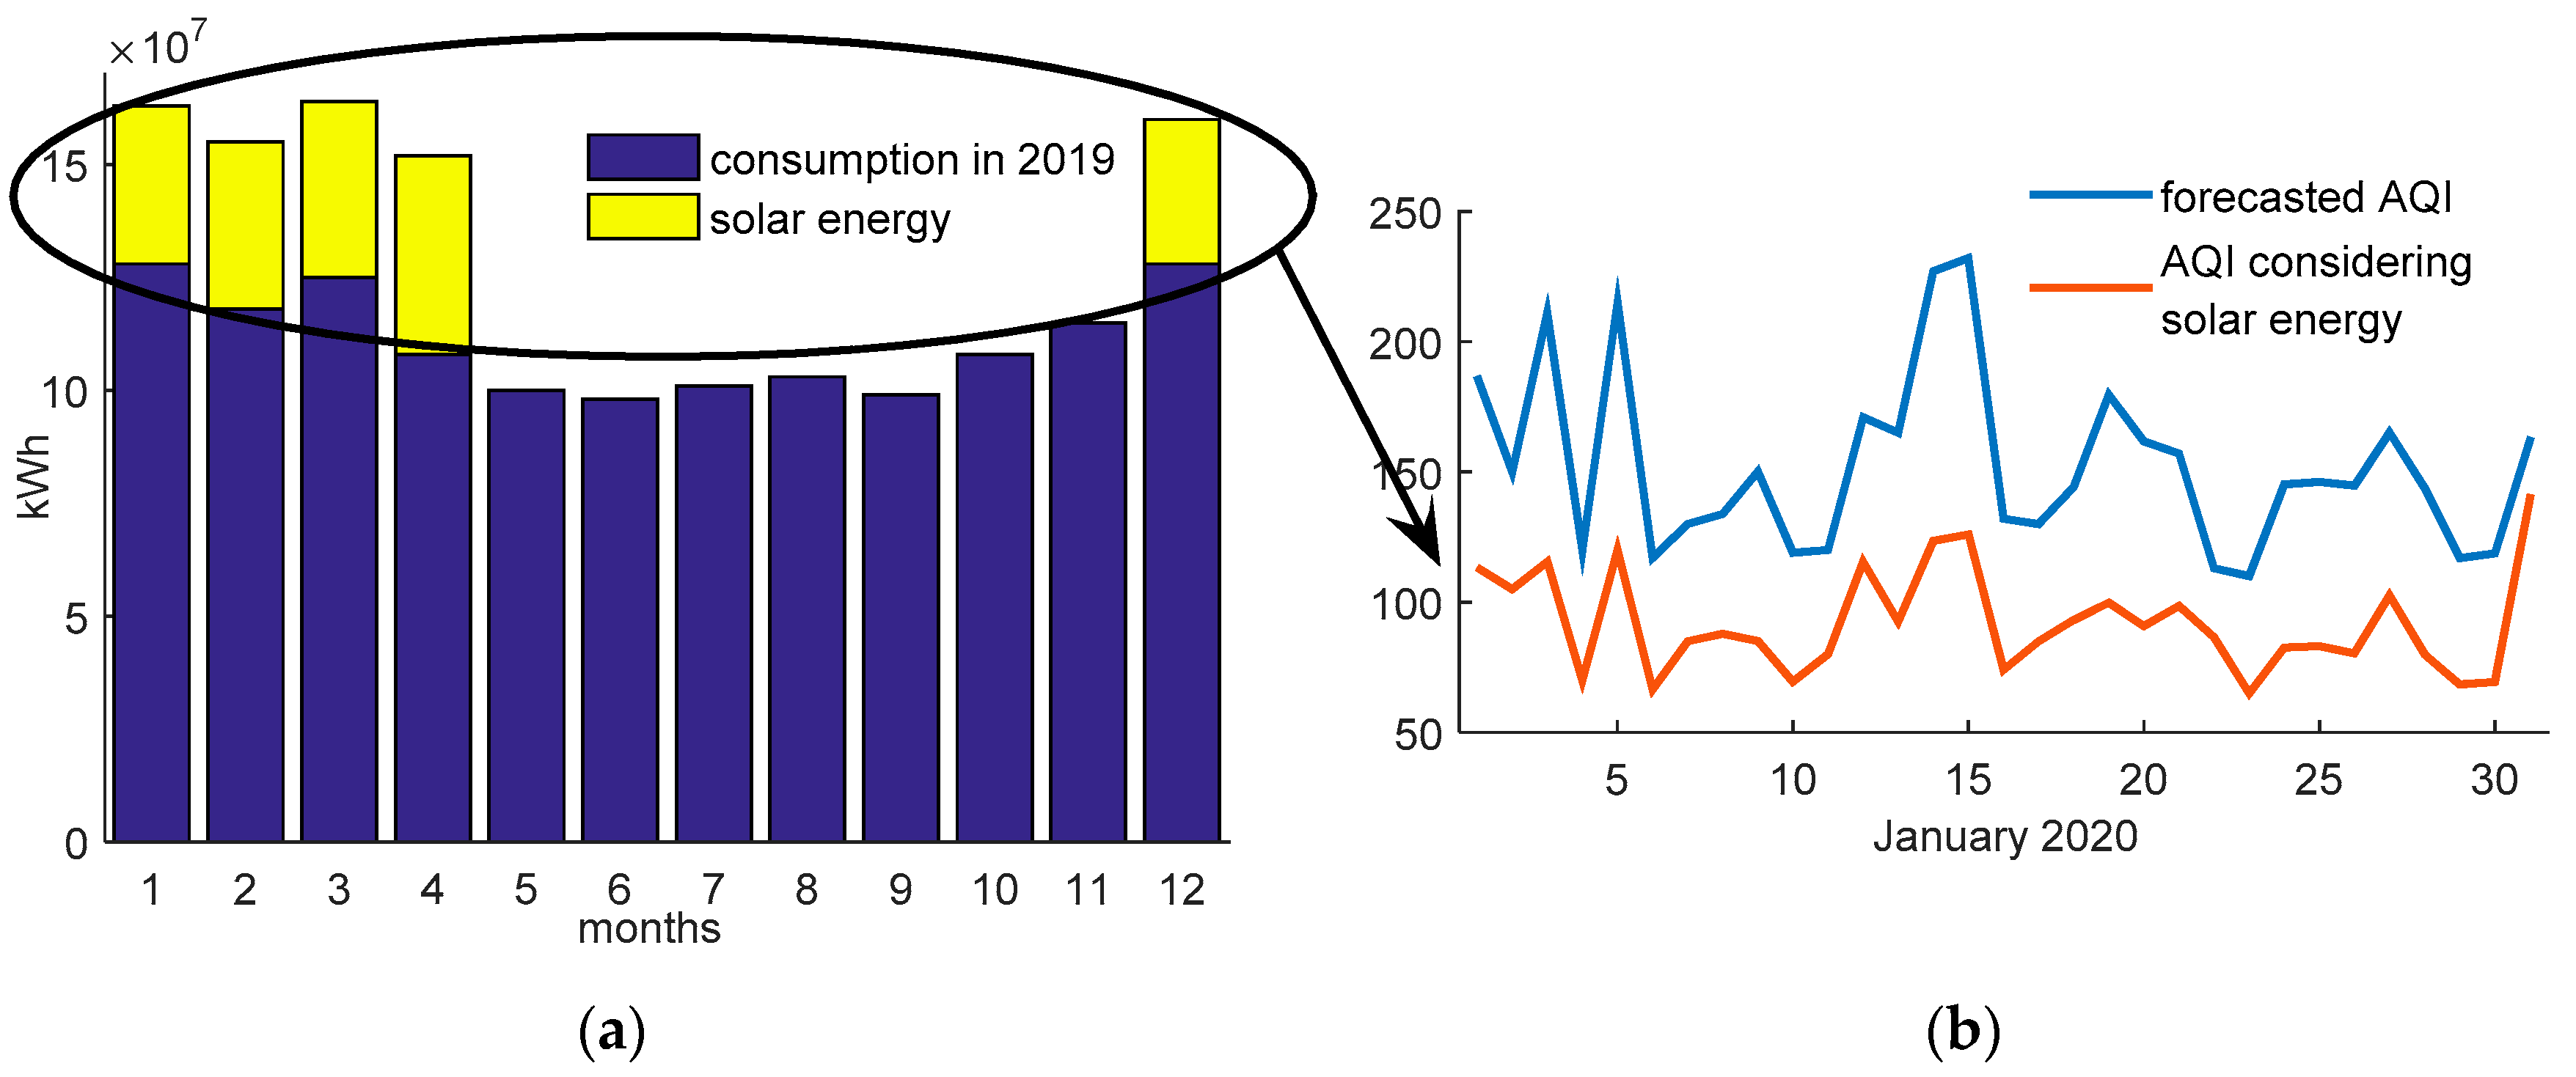
Figure 15a shows the forecasted electricity consumption, where the yellow color of the bars refers to the electricity consumption obtained from solar energy using a floating photovoltaic power plant, as well as solar prosumers installed on the roofs of houses. Actually, yellow bars represent additional electricity needs that would replace coal in the heating process for 35,000 households, and the same would be covered from the PV power plant. Domestic hating with clean renewable energy brings a significant reduction in pollutant emissions, which is reflected in AQI values. Regarding
Figure 15b, the blue line represents the AQI values for January 2020 forecasted in accordance with methodology presented in
Section 4. The orange line in the figure shows the AQI values in the case of using 196 GWh of clean renewable electricity for domestic heating. In line with the
Table 14, pollutants emission reductions as consequences of the transition from fossil to clean fuels in terms of household heating are visible. In accordance with
Table 15 it can be noticed a reduction in the use of fossil fuels compared to the current situation (for 2019 the consumption of fossil fuels is about 155,000 tons) in the amount of 60,000 t. Based on these values expressed in t/a, the average concentrations of pollutants in mg/m
3 are calculated using the equation (19) for all three pollutants SO
2, NO
x and PM
10 according to available data of volume flow in (m
3/h):
where
is annual pollutant emission [t/a],
is pollutant volume flow in [m
3/h] and
is time in [h].
The new average emission values of SO
2, NO
x and PM
10 expressed in (mg/m
3) are obtained by subtraction the measured emission values of these pollutants [
25,
44] with the calculated values based on the equation (i.e.,
). Based on the new average concentrations of SO
2, NO
x and PM
10 (caused by the reduction of consumption of solid fuels for household heating), the reconstructed AQI value for January 2020 is plotted on the
Figure 15b (orange lines) and calculated in accordance with Equation (1) in accordance with new input data of the average concentrations of pollutants in mg/m
3. The values of the Index, taking into account the application of solar energy, during 150 days, for five heating season months in one year, have significantly decreased and can be seen in the
Figure 15b. Also one can be notice the difference in values and the amount of Index reduction by comparing the obtained AQI values with the forecasted values presented in
Section 4 of this paper.
By abandoning the traditional way of heating with fossil fuels and replacing them with electricity produced from PV power plants, the total electricity consumption in the Sarajevo Canton would increase by monthly values in winter marked in yellow and shown in
Figure 15. Thus, for example, in January, the total electricity consumption would be higher than the existing one by 23.7%.
Furthermore, it is important to point out the following indicators regarding air quality protection. In
Table 14 is point out an overview of emissions from heating an uninsulated house using coal or firewood.
Also, it is important to highlight the values of reduction of annual emissions of pollutants during 150 days of the heating season in one year using renewable electricity for domestic heating. In this context, for energy production of 196 GWh for 35,000 households, 60,000 tons of solid fuels are needed. In terms of 32.4 GWh produced from a floating photovoltaic power plant, for 5786 houses with electric domestic heating, with an average area of 100 m
2, the solid fuel need is in the amount of 10,000 tons.
Table 15 shows the annual emissions reduction, if instead of 60,000 tons (35,000 households) and 10,000 tons of solid fuels (equivalent to 5768 households), renewable electricity is used for domestic heating, during 150 days with pollutant emissions in the category unhealthy and more, in terms of the Air Quality Index.
Thus, if instead of the required 60,000 tons of solid fuel for heating 35,000 households during 150 days, renewable electricity is used, annual emissions would be reduced by 1512.9 tons of SO2 pollutant, 92.4 tons of NOx pollutant, and in terms of PM10 particles, by 405.4 tons. Then, if instead of the required 10,000 tons of solid fuel for heating 5786 households during 150 days, renewable electricity from a floating photovoltaic power plant is used, annual emissions would be reduced by 252.2 tons of SO2 pollutant, 15.4 tons of NOx pollutant, and in terms of PM10 particles, 67.6 tons.
5. Conclusions
There is currently a special focus on measures and technologies that will enable the integration of a large number of photovoltaic power plants to individual and collective facilities in the city of Sarajevo and their integration into the existing power system. Also, this paper consider the possibility of building a floating photovoltaic power plant on one of the artificial lakes in Bosnia and Herzegovina, as authorities tool with incentive measures to reduce the consumption of solid fuels for heating during months of high air pollution in the Sarajevo Canton. According to the new regulative Bosnia and Herzegovina is obliged to make a comprehensive analysis of its territory in order to promote efficient cogeneration, taking into account cost-optimal solutions for district heating. This strategic path is outlined in two phases: increasing the share of district heating first to 30% and then to 50% and use of PV systems for heating electrification.
In this paper an EMD-SARIMA hybrid model for forecasting seasonal time series is presented. The methodology was tested on the Sarajevo Canton, taking into account 35,000 households. The results of the model forecast according to statistical parameters indicate the accuracy of the model prediction. In order for households to be heated with renewable electricity, it is necessary to provide 196 GWh. For this purpose, it is planned to implement the use of a floating photovoltaic power plant on Lake Jablanica with a capacity of 30 MW and solar prosumers with capacity of 115 MW. Applying the concept of penetration of electricity obtained from PV systems has its two advantages underlined in the paper. The first is that the forecasted AQI taking into account the application of solar energy has been drastically reduced, and the second is the reduction of pollution emissions, which can be seen from the following data. If instead of the required 60,000 tons of solid fuel for heating 35,000 households during 150 days of heating season, renewable electricity is used, annual emissions would be reduced by 1512.9 tons of SO2 pollutant, 92.4 tons of NOx pollutant, and in terms of PM10 particles, 405.4 tons. Consequently, the obtained results show that the employment of the EMD-SARIMA hybrid prediction model to the air pollution and PV production data is effective and promising. In the future, focus will be on more advanced models that include smart heat and electricity management. Adaptive intelligence in heating systems on the basis of forecasted AQI and PV production, will make Canton Sarajevo smart by enabling use of renewable electrical energy instead of solid fuels in heating system.
Further development of small renewable energy plants will depend exclusively on the implementation of incentive system to encourage electricity production from renewable sources, such as market-oriented auction mechanisms, etc. The benefits of prosumer penetration who independently meet part of their electricity needs, which will be even more pronounced in the scenario of building almost zero energy buildings which consume very little energy, satisfied from RES, are increasing entry of small investors into renewable energy projects and investing in battery systems. Bosnia and Herzegovina has a significant hydropower potential and the opportunity to build other RES projects, which can create a positive multiplier effect on the economy and encourage small and medium enterprises. In this context, it is important to actively manage the models or costs of compensation fees that create pressure on the final price of electricity and improve the legal and regulatory framework in order to facilitate and faster obtaining permits for the construction and operation of RES.
This paper includes an analysis of the Canton Sarajevo current situation, a list of sources of solid fuel emissions, including 35,000 house furnaces, an analysis of available fuels and furnaces and their impact on air quality, a proposal for establishing possible measures to reduce emissions. The future work will be to determine the necessary funds for the transition of consumers to more environmentally friendly energy sources. The development of the strategy is one of the priority projects for the reduction of air pollution envisaged by the development strategy of the Sarajevo Canton, as well as the cantonal environmental protection plan. The future development of RES is also supported by a strong trend of falling prices of technologies for production from renewable sources. This would reduce investment costs, increase efficiency and achieve even greater competitiveness in the market in relation to fossil fuels.
At current market prices, the value of installed kWp is about 910 USD in Bosnia and Herzegovina. In addition to ecology, the implementation of these systems and changes to existing energy sources would make a significant contribution to the development of the renewable energy industry in the Sarajevo Canton.


