Numerical and Experimental Analysis of Flow Pattern, Pressure Drop and Collection Efficiency in a Cyclone with a Square Inlet and Different Dimensions of a Vortex Finder


Abstract
1. Introduction
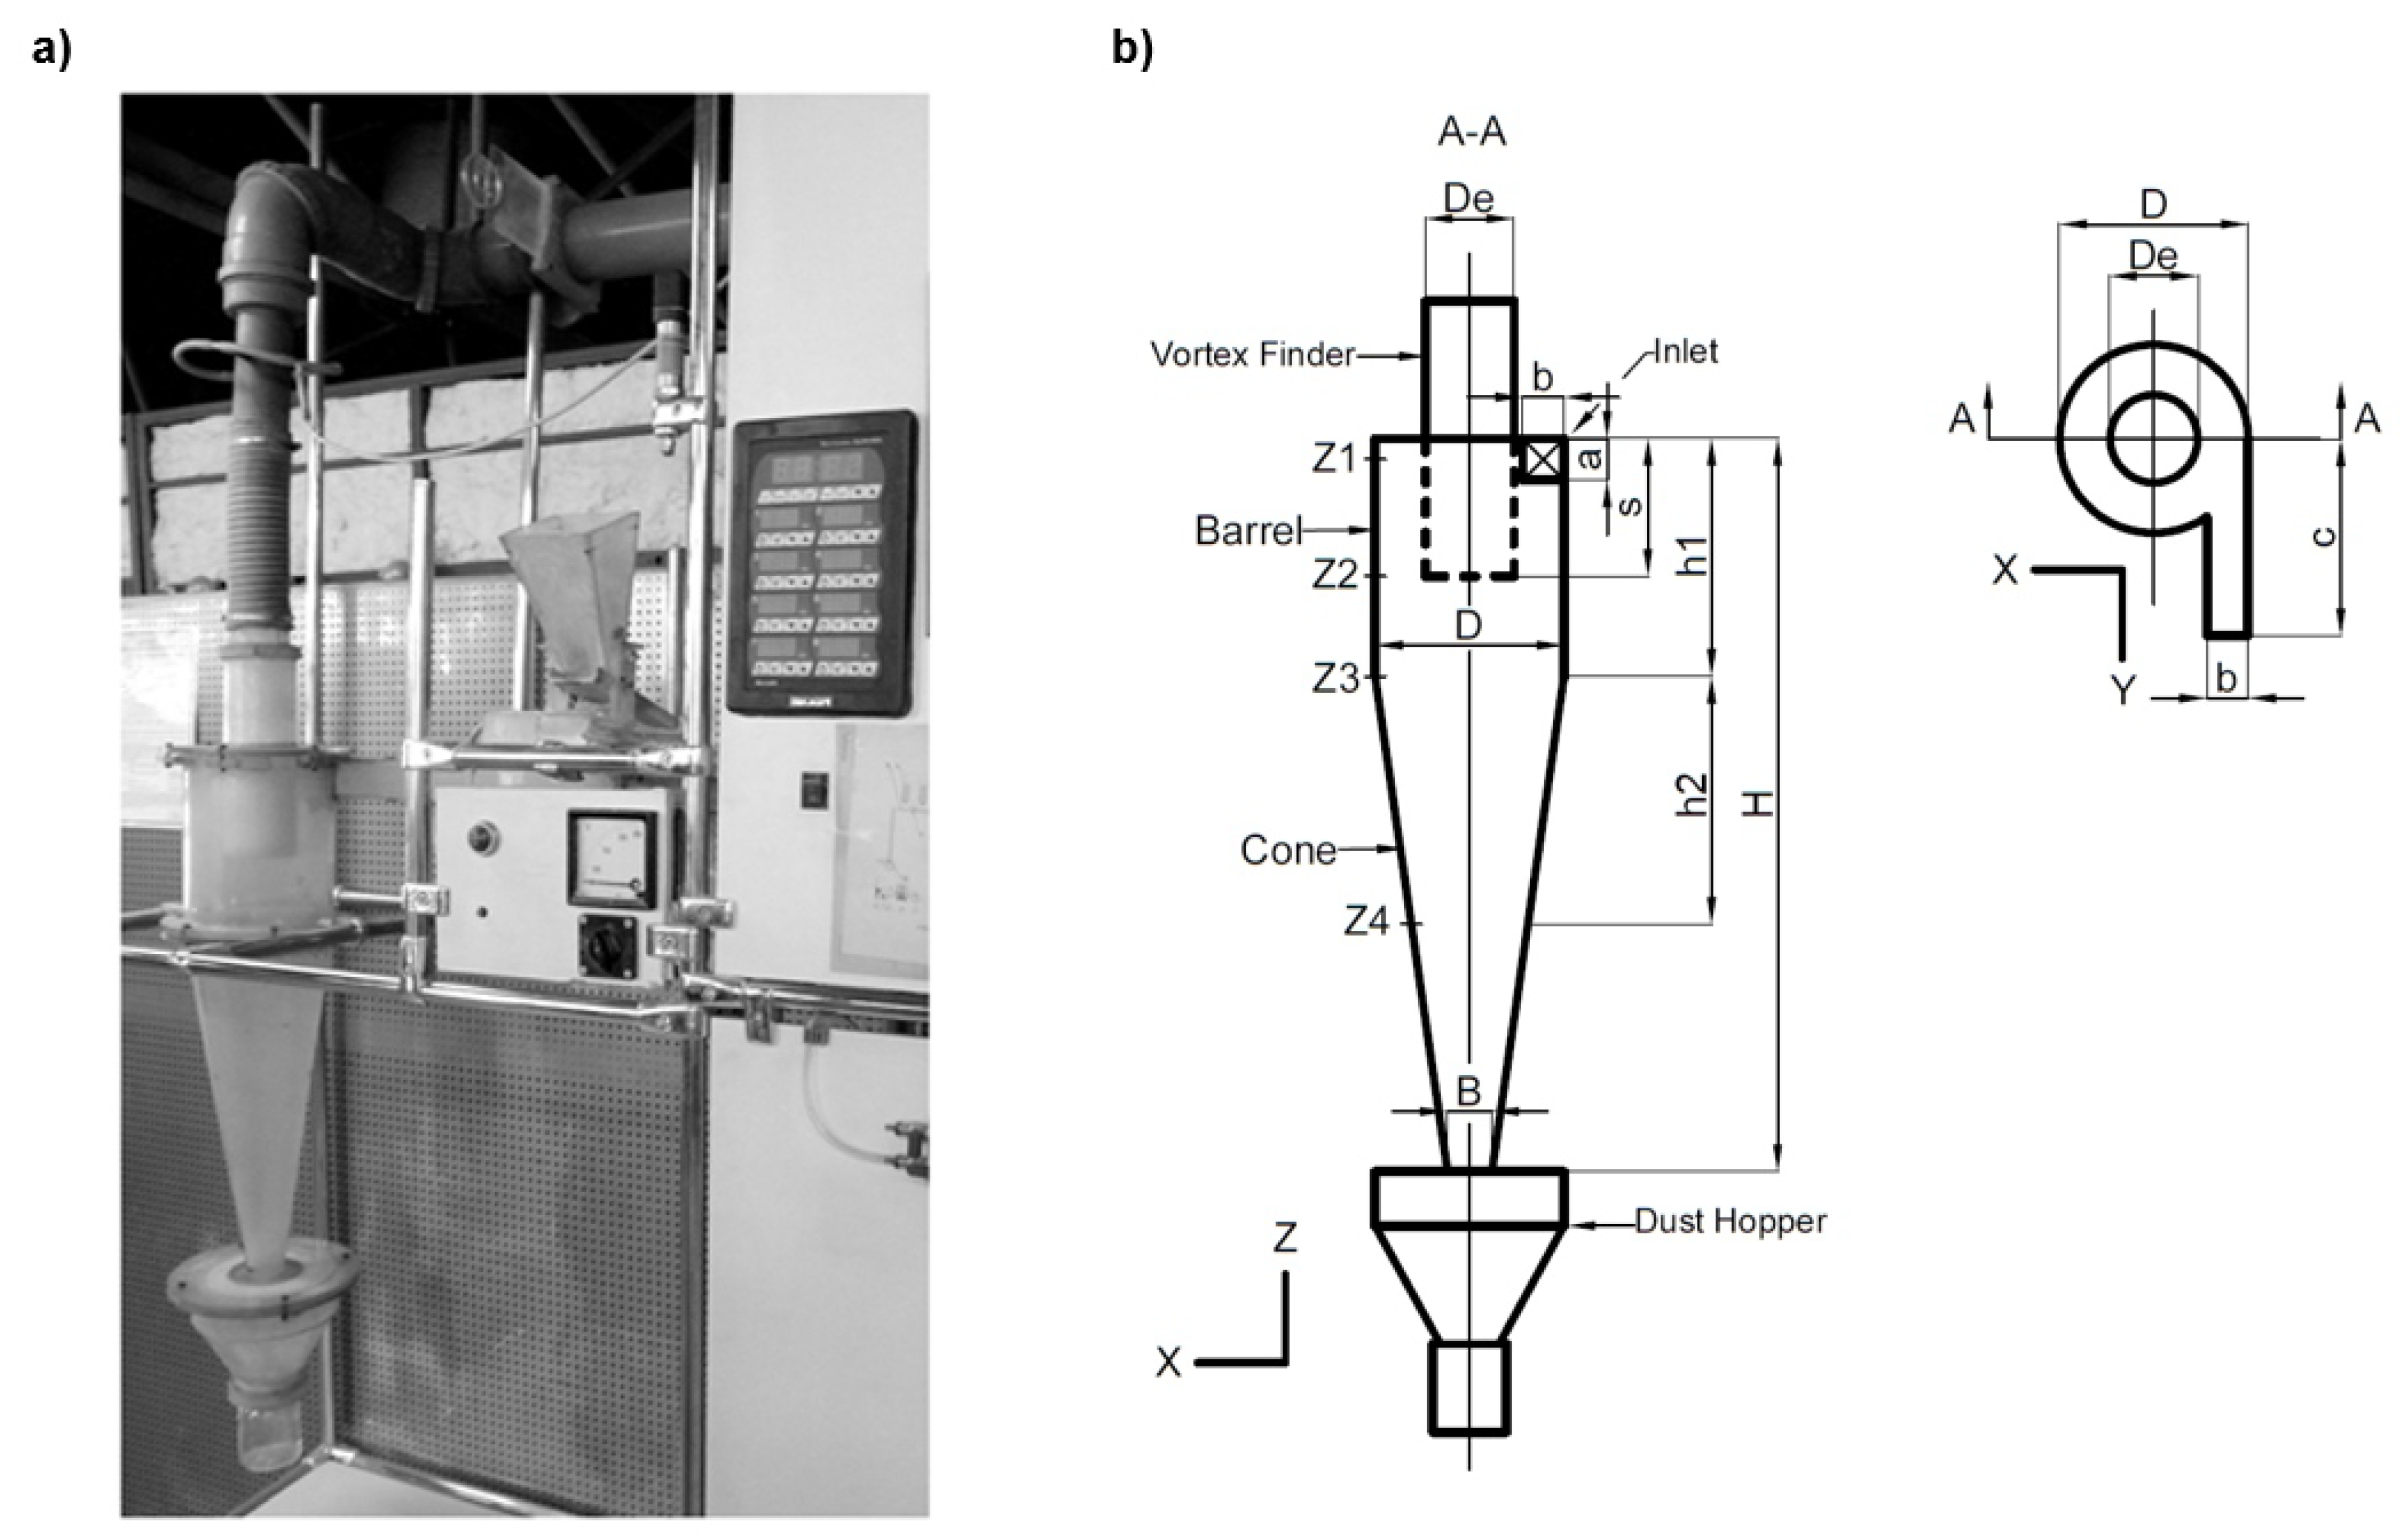
2. Experimental Setup
3. Methodology of Numerical Simulations
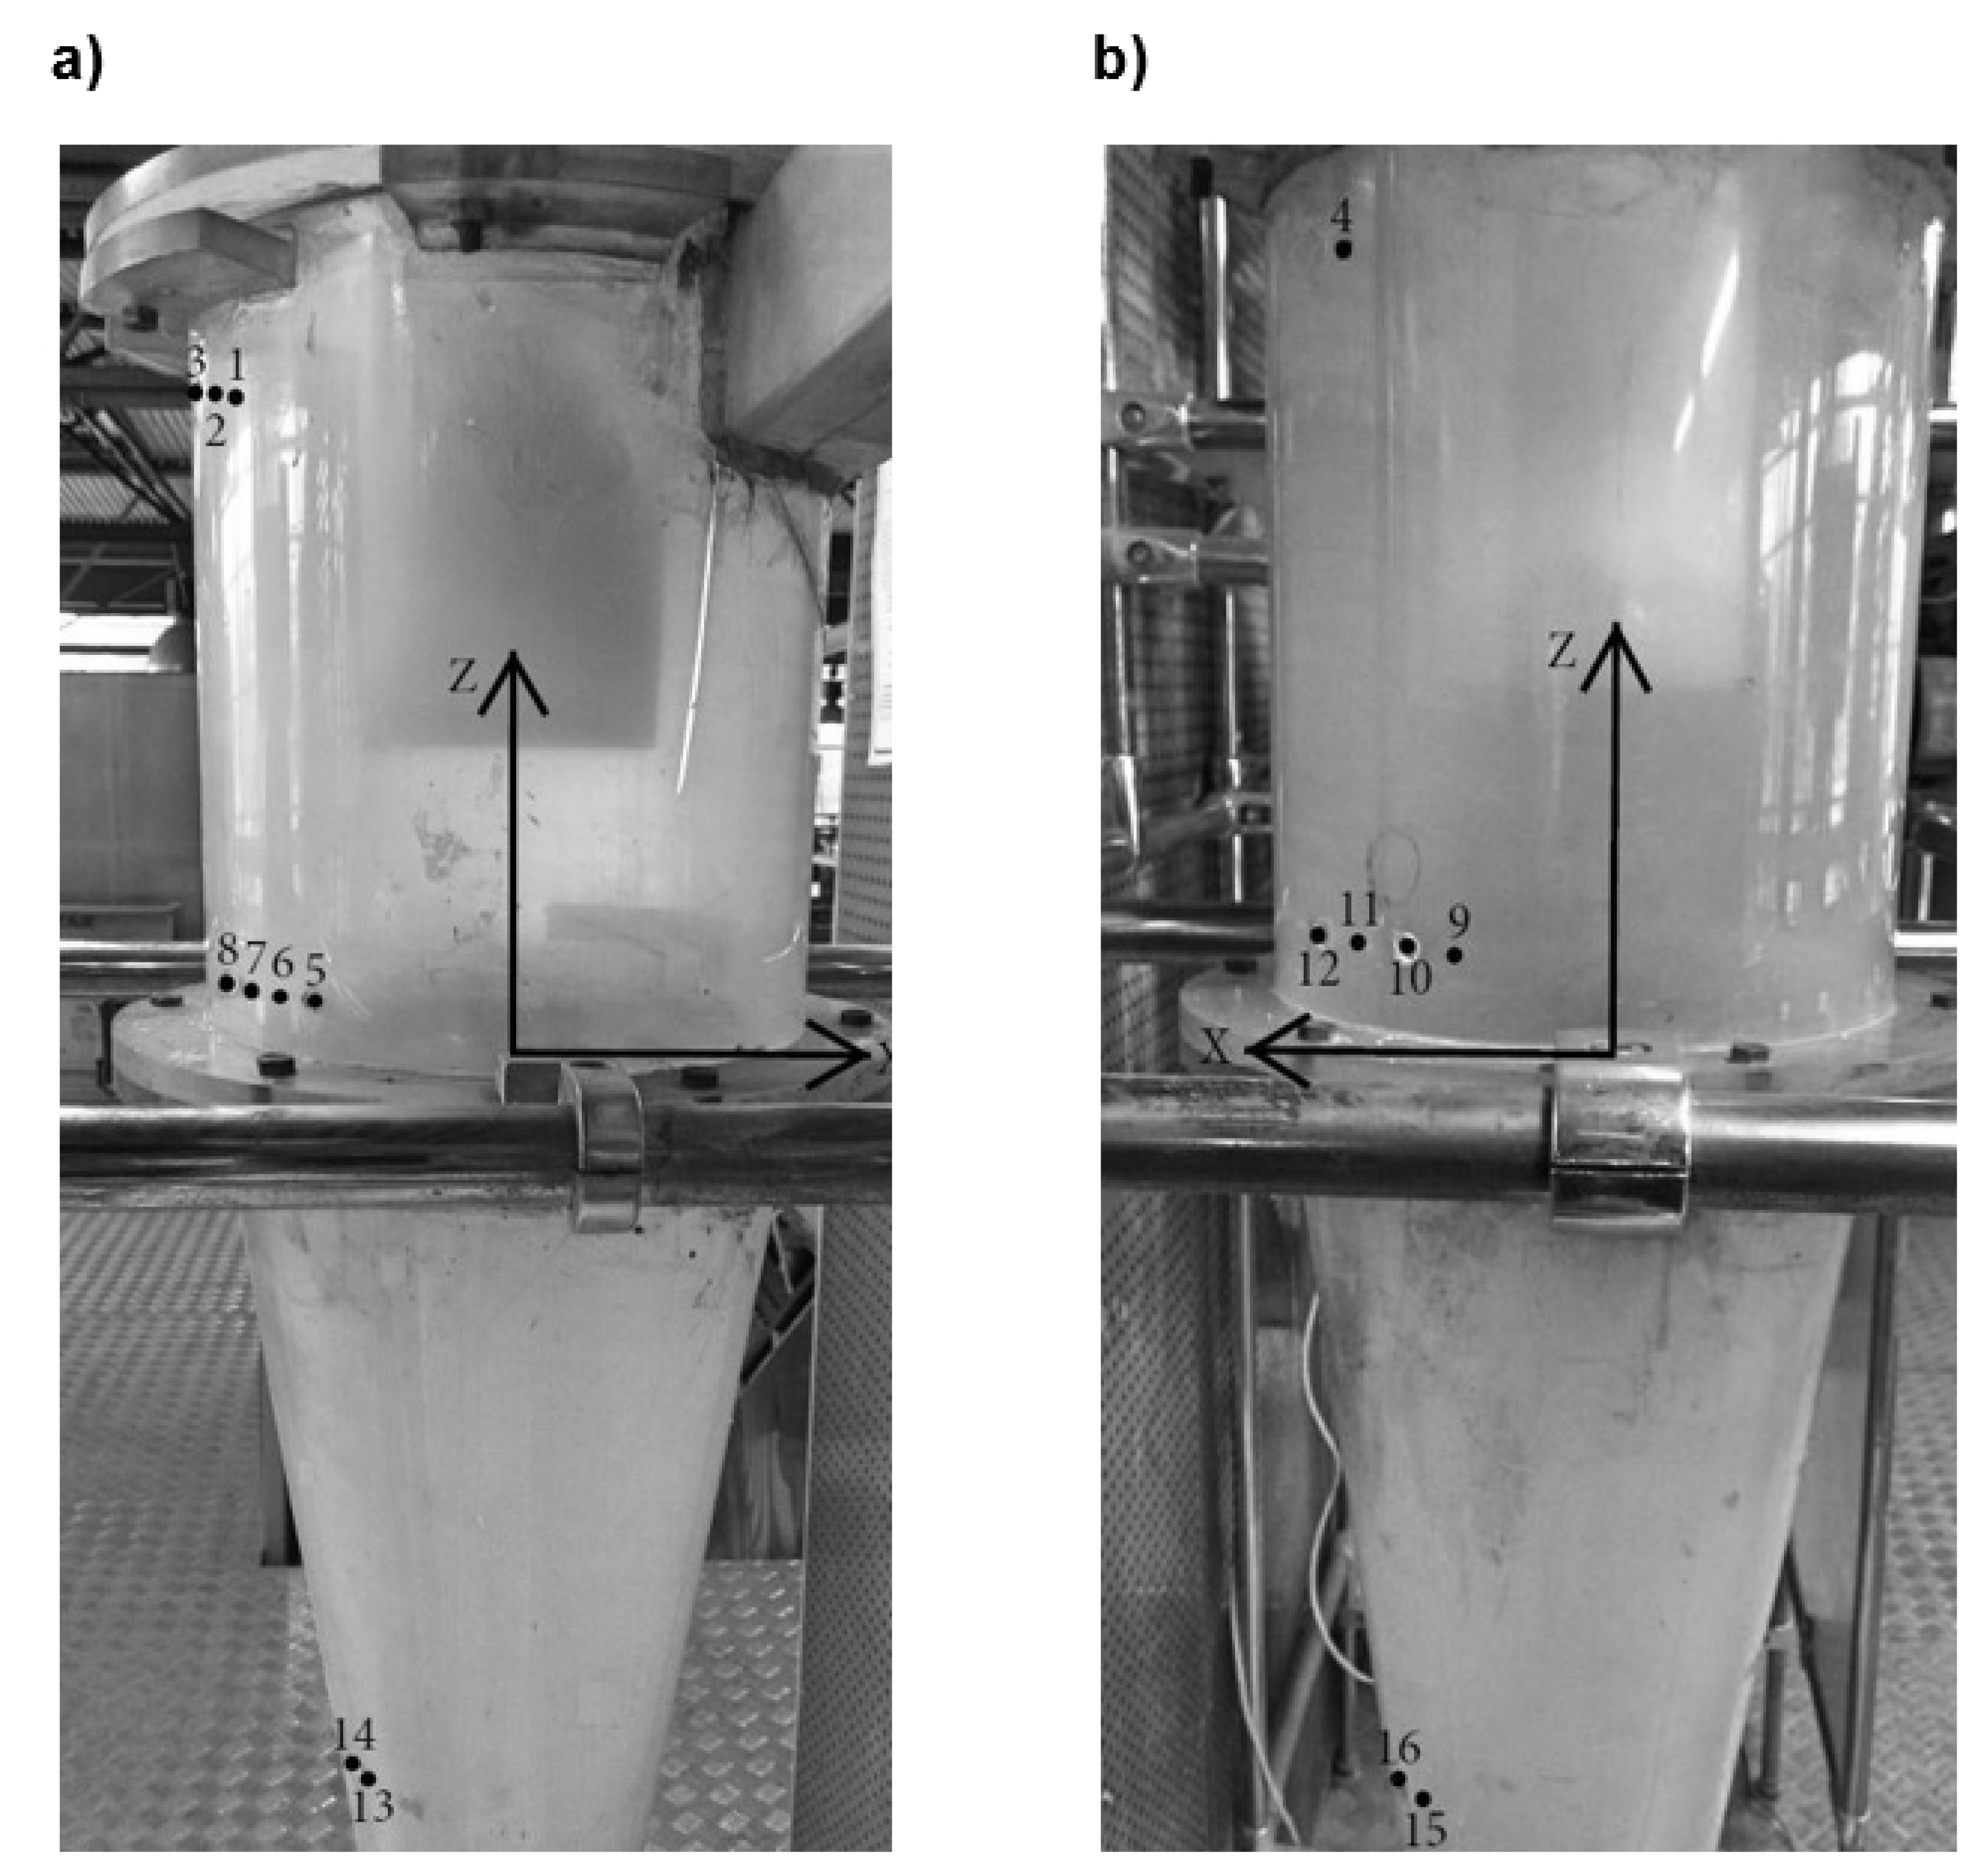
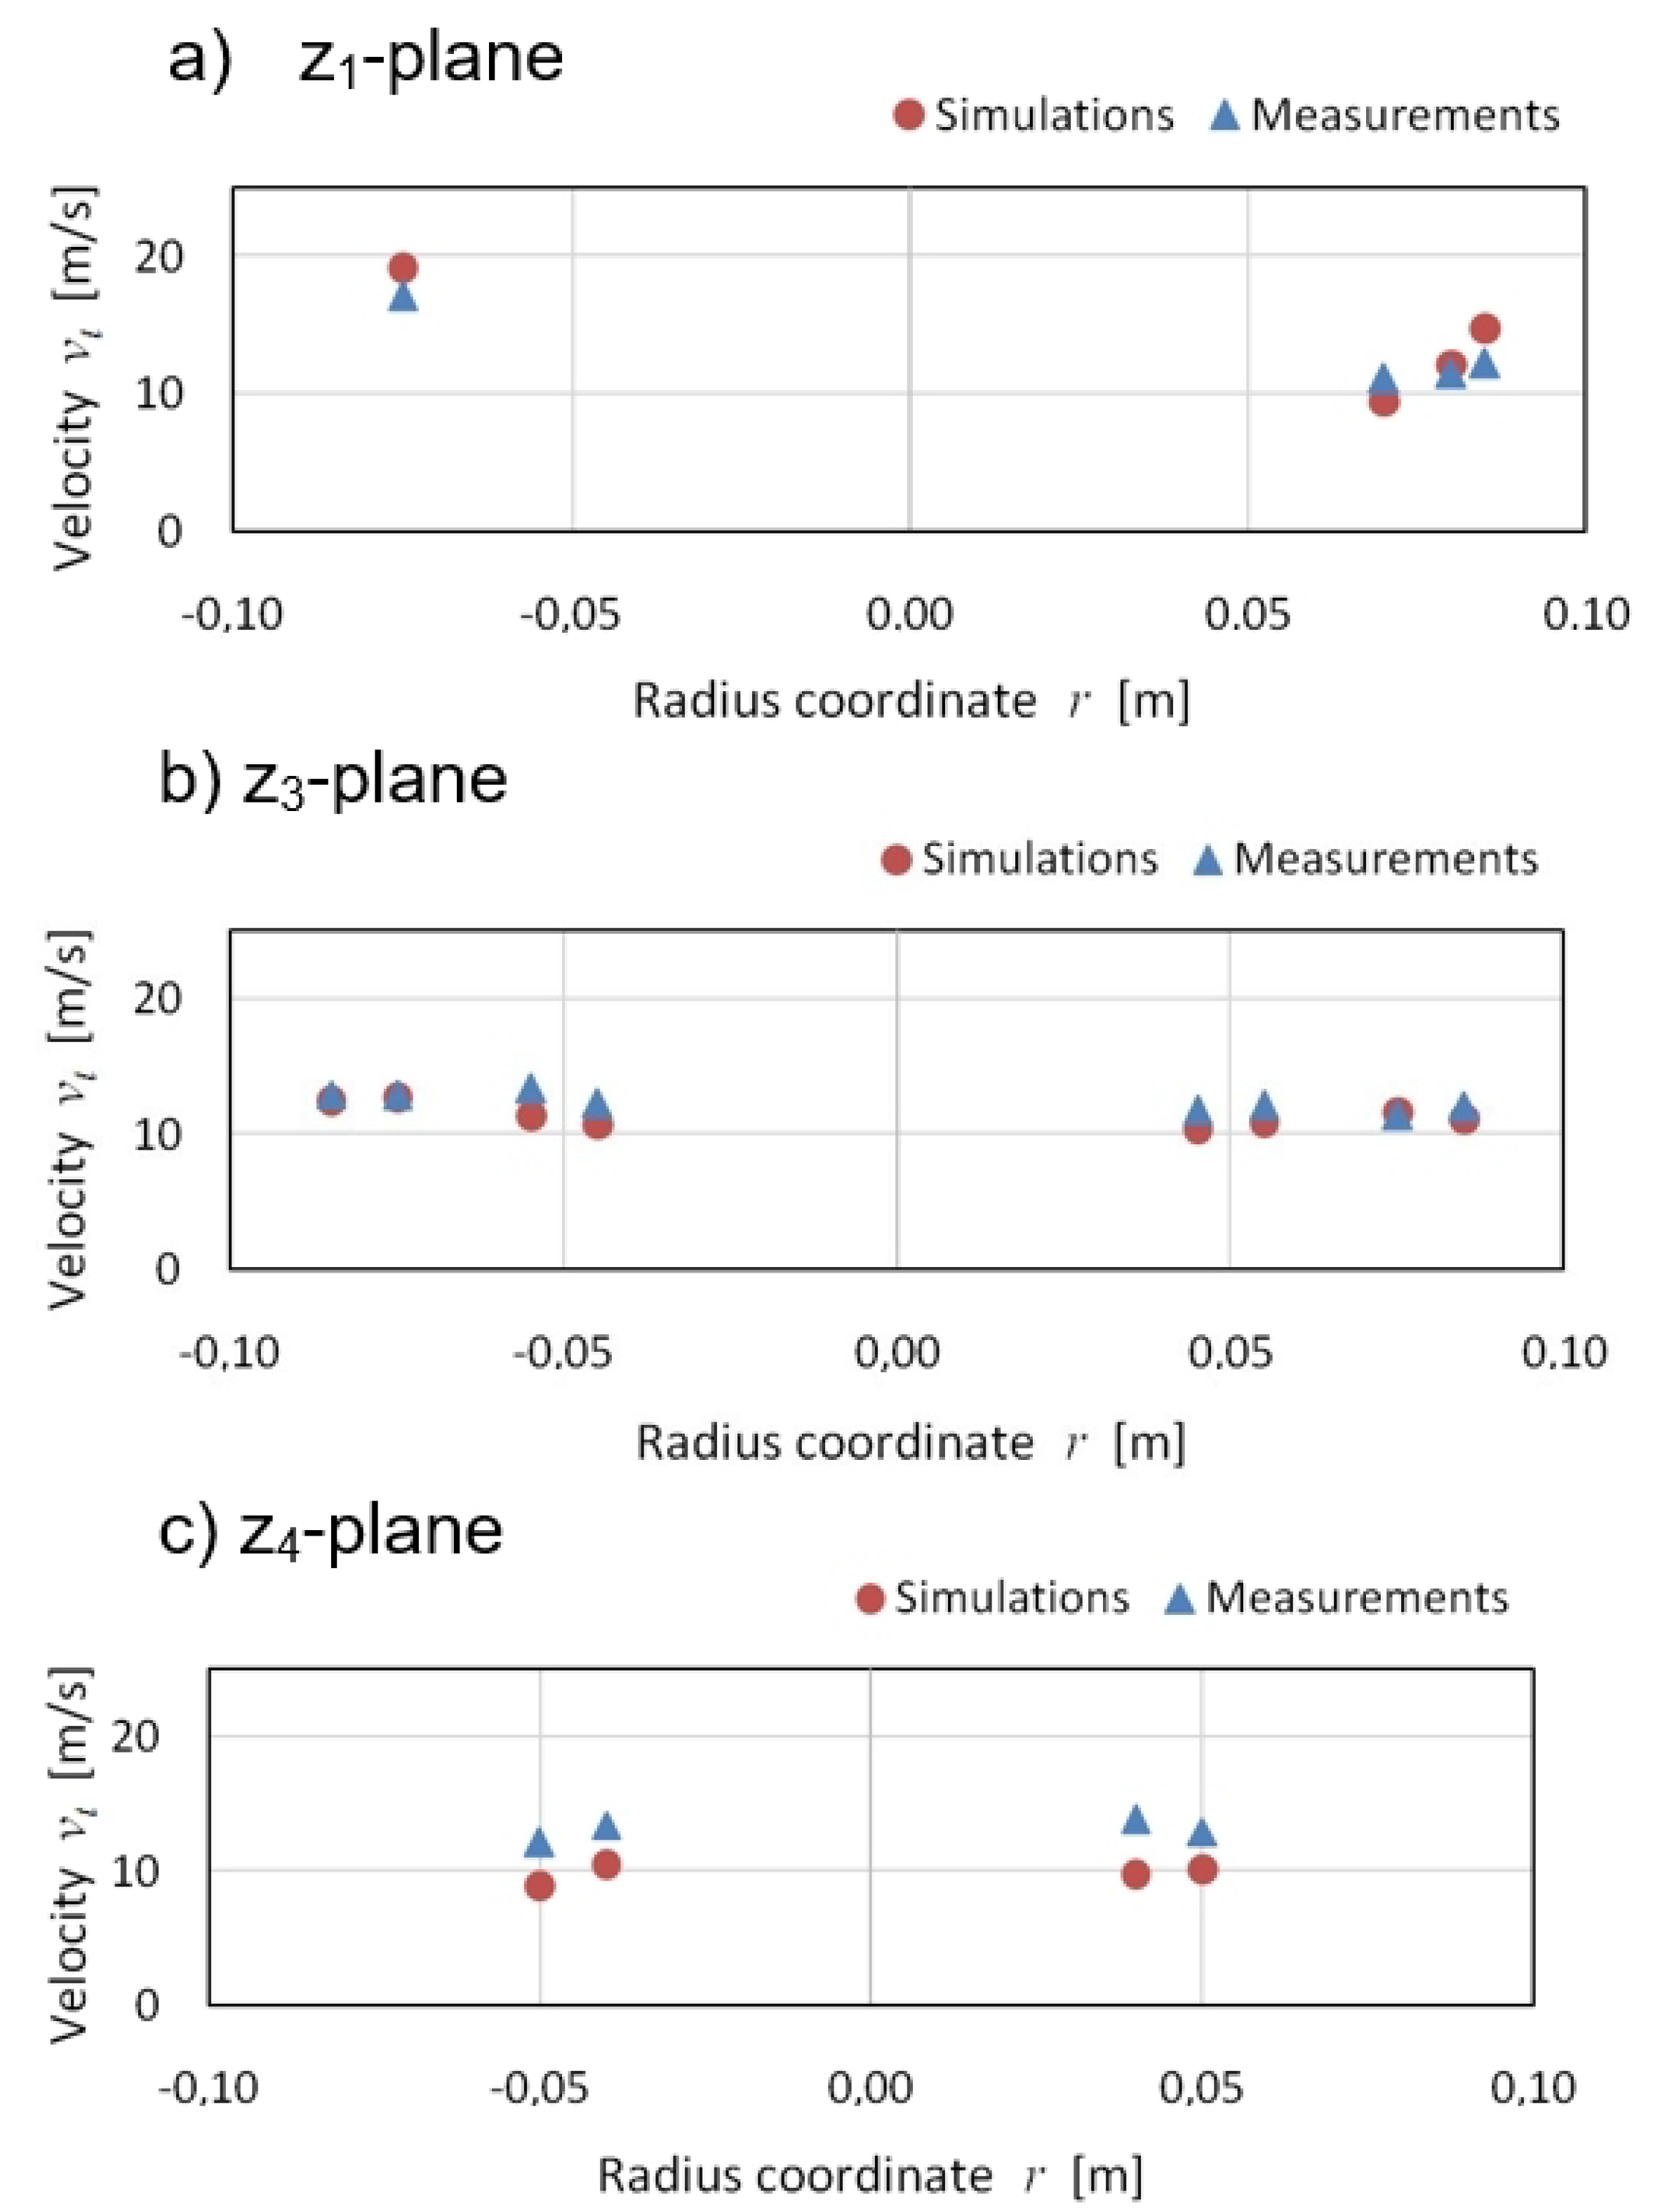
4. Validation of Numerical Model by Anemometry Measurements
5. Results and Discussion
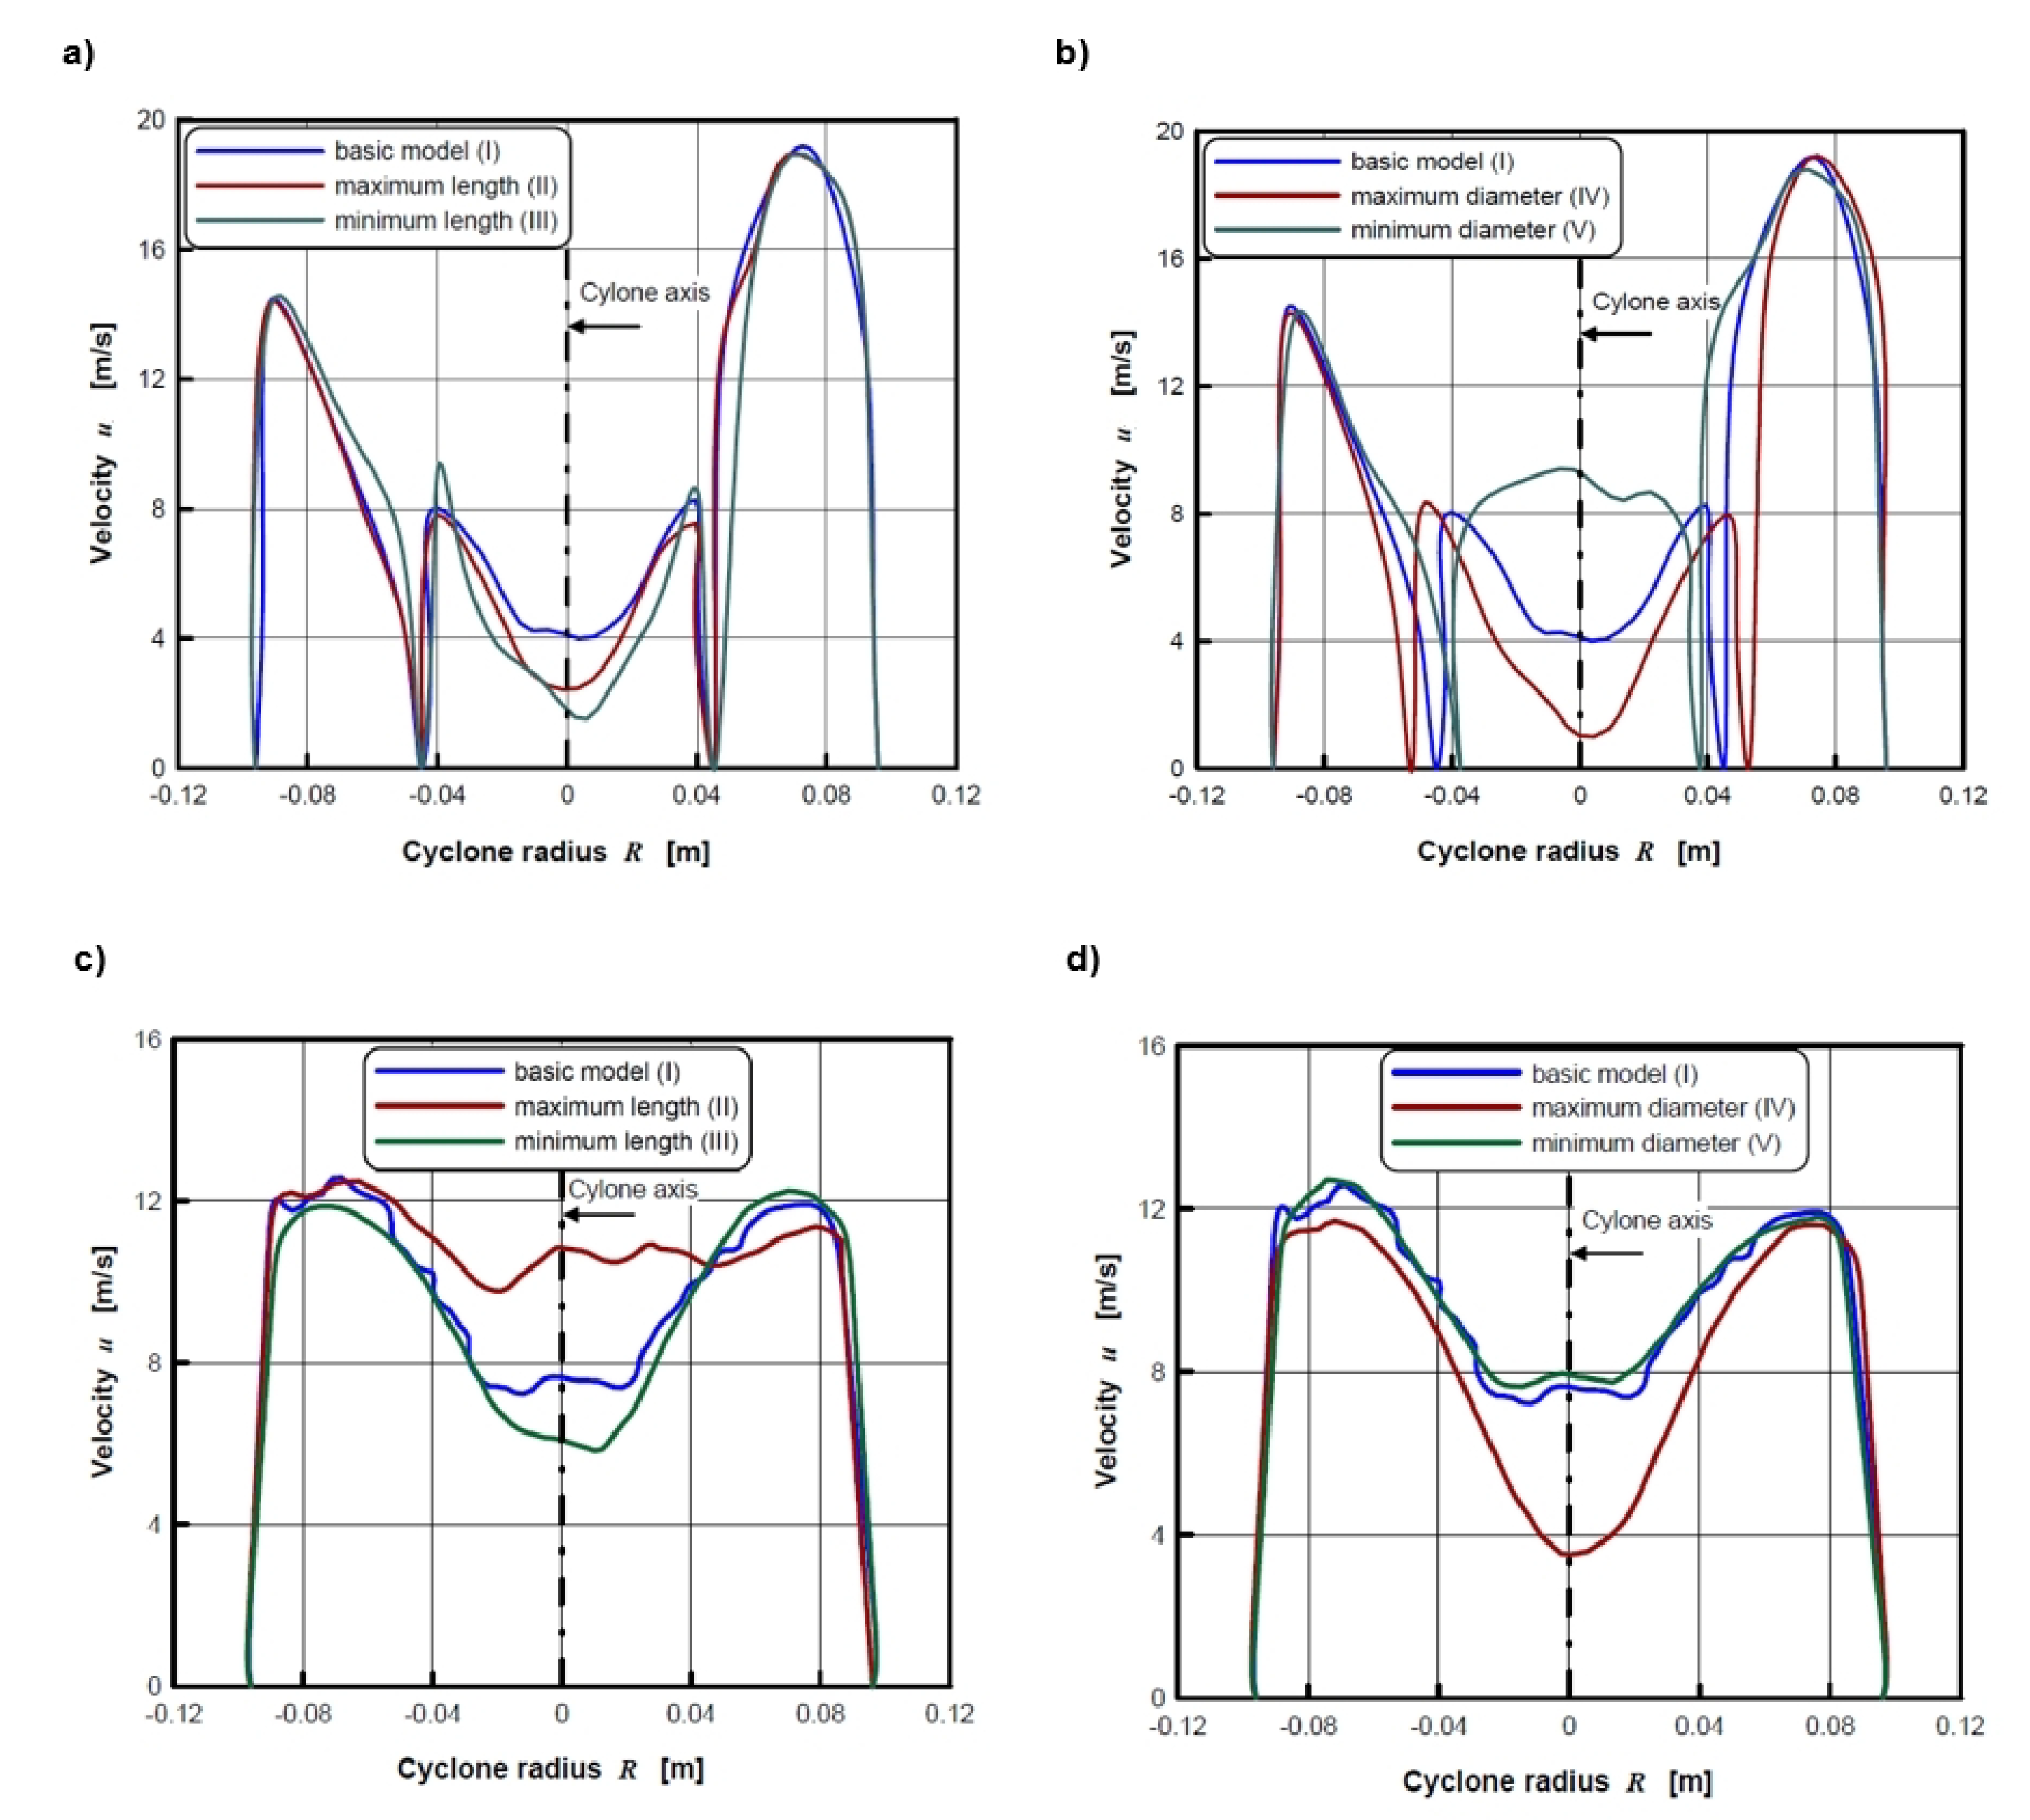
5.1. Flow Pattern and Gas Velocity
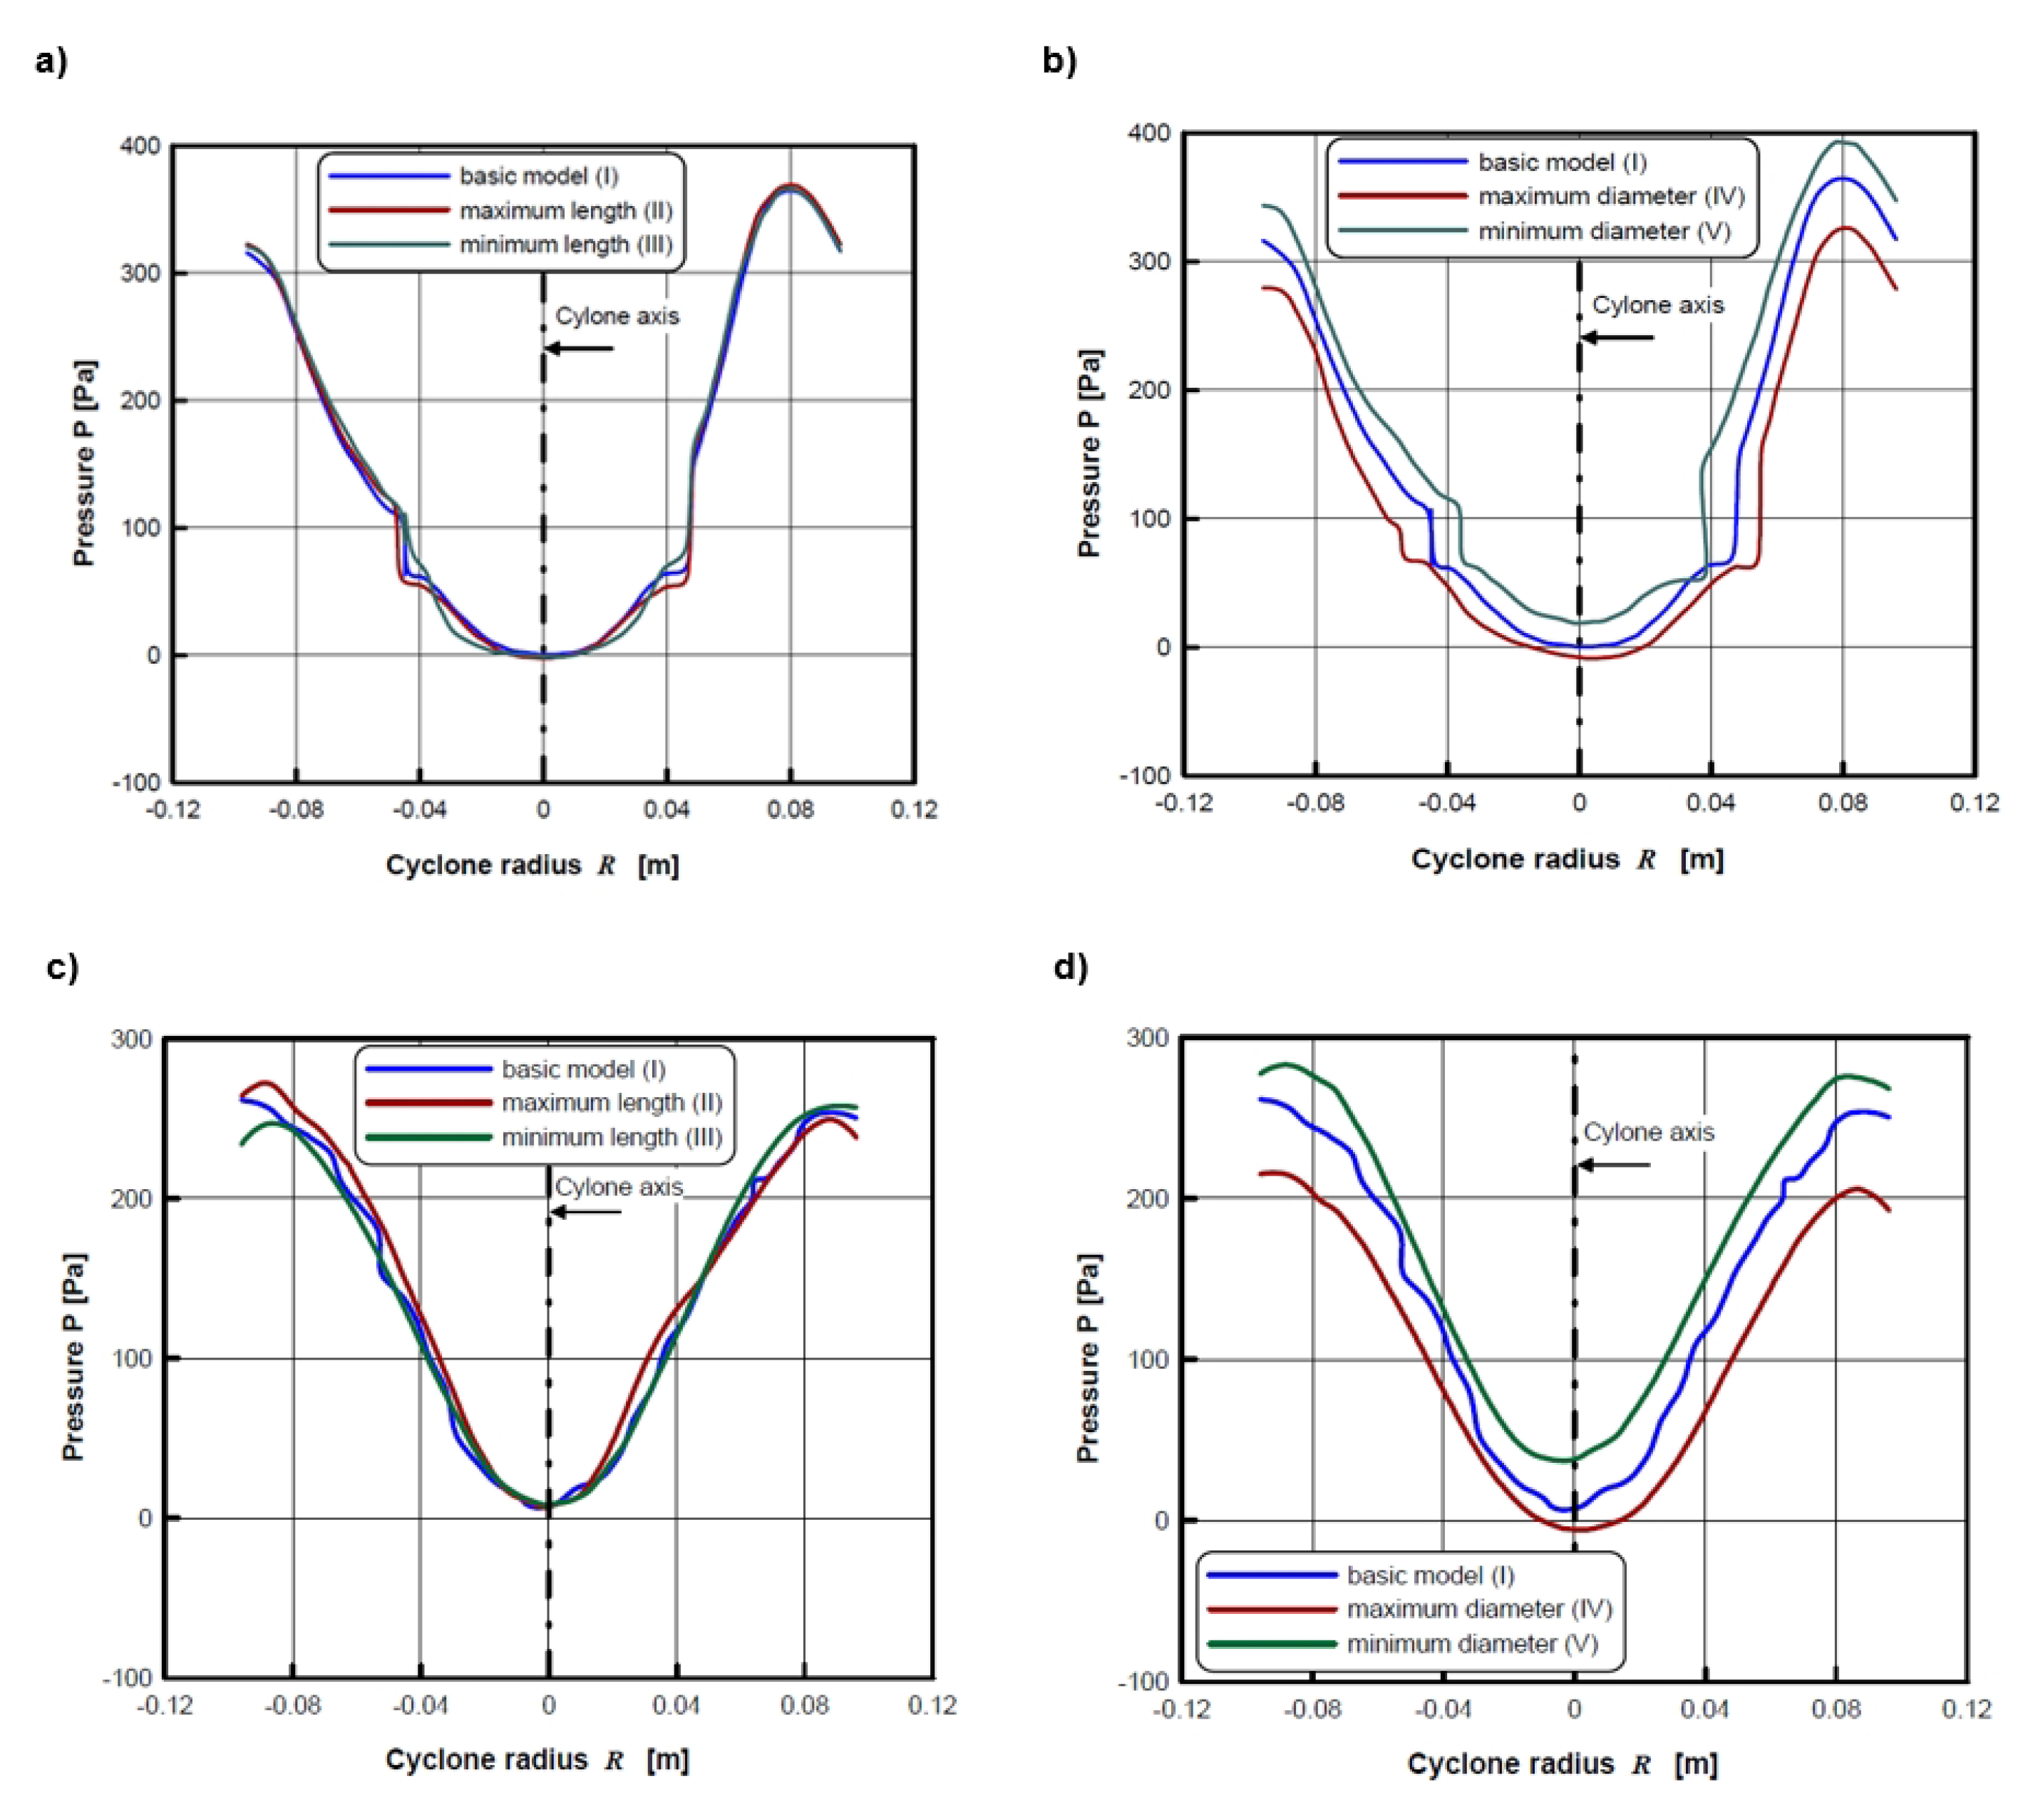
5.2. Pressure Distribution and Pressure Drop
5.3. Collection Efficiency
6. Conclusions
- 1.
- In cyclones of this kind the choice of a vortex finder geometry has an influence on their operation. It was observed both for the flow model, pressure drop and collection efficiency.
- 2.
- Numerical simulations and flow visualizations obtained from them, made it possible to determine the position, scale, range and intensity of outer and inner vortex in cyclones. It has also been shown that the above parameters are related to the geometry (length, diameter) of the vortex finder.
- 3.
- Flow velocity and flow pattern generated in cyclones are determined by the vortex finder geometry. Depending on it, the flow of dusty gas in the outlet and in the cyclone may be entirely different. Increasing the length of the vortex finder (with the same diameter) and reducing its diameter intensifies the gas flow leaving the cyclone. Conversely, shortening the length or increasing the diameter of the outlet reduces the flow.
- 4.
- The numerical simulations showed some unfavorable and beneficial effects and phenomena that may occur in cyclones with such design, e.g., disturbed and reverse flow of dusty gas in the outlet, an underpressure in the central part of the cyclone, the possibility of direct flow of dusty gas from the inlet to outlet or an increase in the gas flow velocity above the inlet velocity at the top of the cyclone.
- 5.
- The numerical analysis showed that the lowest pressure drop (305 Pa) was for the cyclone with the maximum vortex finder diameter ( = 0.105 m), the highest (358 Pa) in the cyclone with a minimum diameter ( = 0.075 m). The changes of a vortex finder length did not significantly affect the pressure drop.
- 6.
- It is different in the case of the collection efficiency.The highest value of this parameter equal to 89.5% was determined for the cyclone with a minimum length of the vortex finder (s = 0.060 m). The lowest efficiency 85.5% was determined for the cyclone with the maximum outlet length (s = 0.220 m). The influence of the diameter of the vortex finder on the collection efficiency was less significant.
- 7.
- As shown by presented data and comparisons with theory and experiments, the proposed numerical models of cyclones describe well the flow (flow pattern, velocity values), pressure (pressure distribution, pressure drop) as well as collection efficiency. The consistency is observed in terms of quality as well as quantity. The results are also consistent with research results and engineering practice.
Author Contributions
Funding
Institutional Review Board Statement
Informed Consent Statement
Data Availability Statement
Conflicts of Interest
References
- Clift, R.; Seville, J.P.K. Gas Cleaning at High Temperatures; Springer–Science + Business Media: Berlin, Germany, 1993. [Google Scholar]
- Seville, J.P.K. Gas Cleaning in Demanding Applications; Springer: Dordrecht, The Netherlands, 2013. [Google Scholar]
- Wójtowicz-Wróbel, A. Thermal waste processing system structures. Questions of locations and accessibility—Polish experiences. In Nuclear technologies recycling air pollution and climate change. In Proceedings of the 17th International Multidisciplinary Scientific Geoconference SGEM 2017, Albena, Bulgaria, 29 June–5 July 2017; STEF92 Technology Ltd.: Albena, Bulgaria, 2017; Volume 17, pp. 261–268. [Google Scholar] [CrossRef]
- Wójtowicz-Wróbel, A. From a vision to a necessity—from a necessity to a vision. Thermal Waste Processing Plants-Case Study Italy. In Proceedings of the IOP Conference Series: Materials Science and Engineering 3’rd World Multidisciplinary Civil Engineering, Architecture, Urban Planning Symposium (WMCAUS 2018), Prague, Czech Republic, 18–22 June 2018; IOP Publishing: Bristol, UK, 2019; Volume 471, pp. 1–9, (on-line). [Google Scholar] [CrossRef]
- Hoffmann, A.C.; Stein, L.E. Gas Cyclones and Swirl Tubes. Principles, Design and Operation; Springer: Berlin, Germany, 2008. [Google Scholar]
- Warych, J. Gas Cleaning; WNT: Warsaw, Poland, 1998. [Google Scholar]
- Elsayed, K.; Lacor, C. The effect of the dust outlet geometry on the performance and hydrodynamics of gas cyclones. Comput. Fluids 2012, 68, 134–147. [Google Scholar] [CrossRef]
- Elsayed, K.; Lacor, C. Numerical modeling of the flow field and performance in cyclones of different cone-tip diameters. Comput. Fluids 2011, 51, 48–59. [Google Scholar] [CrossRef]
- Elsayed, K.; Lacor, C. Optimization of the cyclone separator geometry for minimum pressure drop using mathematical models and CFD simulations. Chem. Eng. Sci. 2010, 65, 6048–6058. [Google Scholar] [CrossRef]
- Elsayed, K.; Lacor, C. The effect of cyclone vortex finder dimensions on the flow pattern and performance using LES. Comput. Fluids 2013, 71, 224–239. [Google Scholar] [CrossRef]
- Brar, L.S.; Sharma, R.P.; Elsayed, K. The effect of cyclone length on the performance of Stairmand high-efficiency cyclone. Powder Technol. 2015, 286, 668–677. [Google Scholar] [CrossRef]
- Stairmand, C.J. The design and performance of cyclone separators. Ind. Eng. Chem. 1951, 29, 356–383. [Google Scholar]
- Safikhani, H.; Akhavan-Behabadi, M.A.; Shams, M.; Rahimyan, M.H. Numerical simulation of flow field in three types of standard cyclone separators. Adv. Powder Technol. 2010, 21, 435–442. [Google Scholar] [CrossRef]
- Surmen, A.; Avci, A.; Karamangil, M.I. Prediction of the maximum-efficiency cyclone length for a cyclone with a tangential entry. Powder Technol. 2011, 207, 1–8. [Google Scholar] [CrossRef]
- Bogodage, S.G.; Leung, A.J.T. CFD simulation of cyclone separators to reduce air pollution. Powder Technol. 2015, 286, 488–506. [Google Scholar] [CrossRef]
- Raoufi, A.; Shams, M.; Farzaneh, M.; Ebrahimi, R. Numerical simulation and optimization of fluid flow in cyclone vortex finder. Chem. Eng. Prog. 2008, 47, 128–137. [Google Scholar] [CrossRef]
- El-Batsh, H.M. Improving cyclone performance by proper selection of the exit pipe. Appl. Math. Model. 2013, 37, 5286–5303. [Google Scholar] [CrossRef]
- Talbi, K.; Nemouchi, Z.; Donnot, A.; Belghar, N. An experimental study and a numerical simulation of the turbulent flow under the vortex finder of a cyclone separator. J. Appl. Fluid Mech. 2011, 4, 69–75. [Google Scholar]
- Pei, B.; Yang, L.; Dong, K.; Jiang, Y.; Du, X.; Wang, B. The effect of cross-shaped vortex finder on the performance of cyclone separator. Powder Technol. 2017, 313, 135–144. [Google Scholar] [CrossRef]
- Su, Y.; Zhao, B.; Zheng, A. Simulation of turbulent flow in square cyclone separator with different gas exhaust. Ind. Eng. Chem. Res. 2011, 50, 12162–12169. [Google Scholar] [CrossRef]
- Houben, J.J.H.; Weiss, C.H.; Brunnmair, E.; Pirker, S. CFD simulations of pressure drop and velocity field in a cyclone separator with central vortex stabilization rod. J. Appl. Fluid Mech. 2016, 9, 487–499. [Google Scholar] [CrossRef]
- Misiulia, D.; Andersson, A.G.; Lundström, T.S. Computational investigation of an industrial cyclone separator with helical-roof inlet. Chem. Eng. Technol. 2015, 38, 1425–1434. [Google Scholar] [CrossRef]
- Misiulia, D.; Andersson, A.G.; Lundström, T.S. Effect of the inlet angle on the flow pattern and pressure drop of a cyclone with helical-roof inlet. Chem. Eng. Res. Des. 2015, 102, 307–321. [Google Scholar] [CrossRef]
- Fu, P.-B.; Wang, F.; Yang, X.-J.; Ma, L.; Cui, X.; Wang, H.-L. Inlet particle-sorting cyclone for the enhancement of PM2.5 separation. Environ. Sci. Technol. 2017, 51, 1587–1594. [Google Scholar] [CrossRef]
- Fu, P.; Jiang, X.; Ma, L.; Yang, Q.; Bai, Z.; Yang, X.; Chen, J.; Yuan, W.; Wang, H.; Lv, W. Enhancement of PM2.5 cyclone separation by droplet capture and particle sorting. Environ. Sci. Technol. 2018, 52, 11652–11659. [Google Scholar] [CrossRef]
- Qiu, Y.; Deng, B.; Kim, C.N. Numerical study of the flow field and separation efficiency of a divergent cyclone. Powder Technol. 2012, 217, 231–237. [Google Scholar] [CrossRef]
- Li, Q.; Xu, W.; Wang, J.; Jin, Y. Performance evaluation of a new cyclone separator – Part I experimental results. Sep. Purif. Technol. 2015, 141, 53–58. [Google Scholar] [CrossRef]
- Xu, W.; Li, Q.; Wang, J.; Jin, Y. Performance evaluation of a new cyclone separator – Part II simulation results. Sep. Purif. Technol. 2016, 160, 112–116. [Google Scholar] [CrossRef]
- Xiong, Z.; Ji, Z.; Wu, X. Development of a cyclone separator with high efficiency and low pressure drop in axial inlet cyclones. Powder Technol. 2014, 253, 644–649. [Google Scholar] [CrossRef]
- Luan, Y.; Sun, H. Experimental and numerical study on the resistance performance of an axial flow cyclone separator. Math. Probl. Eng. 2015, 2015, 1–9. [Google Scholar] [CrossRef]
- Avagianos, I.; Vounatsos, P.; Papandreou, I.; Maier, J.; Grammelis, P.; Kakaras, E. Nanoparticle Emission and Characterization from Pre-Dried Lignite and Bituminous Coal Co-Combustion. Energies 2020, 13, 2373. [Google Scholar] [CrossRef]
- Liu, X.; Chang, P.; Wang, E.; Zhang, Z.; Yang, S. Numerical Study of the Respirable Coal Dust Removal Performance of a Vortex Ventilation System at an Excavation Face. Energies 2018, 11, 2449. [Google Scholar] [CrossRef]
- Tang, C.; Kim, Y.-J. CFD-DEMSimulation for the Distribution and Motion Feature of Solid Particles in Single-Channel Pump. Energies 2020, 13, 4988. [Google Scholar] [CrossRef]
- Lipin, A.A.; Lipin, A.G.; Wójtowicz, R. On the possibility of using combined polymerization and drying in synthesis of polyacrylamide. Chem. Eng. Commun. 2019, 206, 754–760. [Google Scholar] [CrossRef]
- Orazbayev, B.; Kozhakhmetova, B.; Wójtowicz, R.; Krawczyk, J. Modeling of a Catalytic Cracking in the Gasoline Production Installation with a Fuzzy Environment. Energies 2020, 13, 4736. [Google Scholar] [CrossRef]
- Wójtowicz, R. Flow pattern and power consumption in a vibromix-er. Chem. Eng. Sci. 2017, 172, 622–635. [Google Scholar] [CrossRef]
- Wójtowicz, R. Choice of an optimal agitated vessel for the draw-down of floating solids. Ind. Eng. Chem. Res. 2014, 53, 13989–14001. [Google Scholar] [CrossRef]
- Wójtowicz, R. Numerical and Experimental Analysis of Vibromixing Selected Issues (Monograph); Cracow University of Technology Publ.: Cracow, Poland, 2019. (In Polish) [Google Scholar]
- Prikhodko, A.A. Kinetostatics of rotationally reciprocating stirred tank planetary actuator. In Proceedings of the 5th International Conference on Industrial Engineering (ICIE 2019), 12–14 December 2019; Springer AG: Berlin/Heidelberg, Germany, 2020; Volume 1, pp. 359–366. [Google Scholar] [CrossRef]
- Wójtowicz, R.; Wolak, P. An example of the use of Computational-Fluid-Dynamics analysis for simulation of two-phase flow in a cyclone with tangential inlet. Environ. Prot. Eng. 2016, 42, 109–123. [Google Scholar] [CrossRef]
- Krawczyk, J.; Szatko, W.; Postnikova, I.; Blinichev, V. Influence of the main factors on the efficiency of wet vortex dust collectors. Izv. Vyss. Uchebnykh Zaved. Khimiyai Khimicheskaya Tekhnologiy 2019, 62, 98–105. [Google Scholar] [CrossRef]
- Krawczyk, J.; Kocewiak, K.; Talaga, J.; Postnikova, I. Mechanisms of trapping fine dust in wet dust collecting apparatus. Izv. Vyss. Uchebnykh Zaved. Khimiyai Khimicheskaya Tekhnologiy 2019, 62, 97–101. [Google Scholar] [CrossRef]
- Ngo, S.I.; Lim, Y.-I. Multiscale Eulerian CFD of chemical process: A review. ChemEngineering 2020, 4, 23. [Google Scholar] [CrossRef]
- Jaworski, Z. Computational Fluid Dynamics; Exit: Warsaw, Poland, 2005. (In Polish) [Google Scholar]
- Gambit 2.4—Documentation; Fluent Inc.: New York, NY, USA, 2006.
- Meshing-User’s Guide; Ansys Inc.: Canonsburg, PA, USA, 2013.
- Ansys Fluent 14.0—Theory Guide; Ansys Inc.: Canonsburg, PA, USA, 2011.
- Ansys Fluent 14.0—User’s Guide; Ansys Inc.: Canonsburg, PA, USA, 2011.
- Pope, S.B. Turbulent Flows; Cambridge University Press: Cambridge, UK, 2000. [Google Scholar]
- Wójtowicz, R.; Lipin, A.A.; Talaga, J. On the possibility of using of different turbulence models for modeling flow hydrodynamics and power consumptionin mixing vessels with turbine impellers. Theor. Found. Chem. Eng. 2014, 48, 386–402. [Google Scholar] [CrossRef]
- Yakhot, V.; Orszag, S.A. Renormalization group analysis of turbulence. J. Sci. Comput. 1986, 1, 3–51. [Google Scholar] [CrossRef]
- Andersson, B.; Andersson, R.; Hakansson, L.; Mortensen, M.; Sudiyo, R.; van Wachem, B. Computational Fluid Dynamics for Engineers; Cambridge University Press: Cambridge, UK, 2012. [Google Scholar]
- Fitouri, A.; Khan, M.K.; Bruun, H.H. A multiposition hot-wire technique for the study of swirling flows in vortex chambers. Exp. Therm. Fluid Sci. 1995, 10, 142–151. [Google Scholar] [CrossRef]
- Vatistas, G.H.; Kowk, C.K.; Lin, S. The reduction of pressure drop across a vortex chamber. AIAA J. 1984, 23, 974–975. [Google Scholar] [CrossRef]
- Flow Field Diagnostics Constant Temperature Anemometry Solutions; Dantec Dynamics Ltd.: Portbury, UK, 2019.
- Jørgensen, F.E. How to Measure Turbulence with Hot-Wire Anemometers—A Practical Guide; Dantec Dynamics Ltd.: Skovlunde, Denmark, 2002. [Google Scholar]
- Hunt, J.C.R.; Wray, A.A.; Moin, P. Eddies, streams and convergence zones in turbulent flow. In Proceedings of the Summer Program 1988 (CTR-S88); Center for Turbulence Research, Stanfod Univesity: Stanford, CA, USA, 1988; pp. 193–208. [Google Scholar]
- Brauer, H. Air Protection Engineering; Cracow University of Technology Press: Cracow, Poland, 2010; Volume 27. [Google Scholar]
- Coker, A.K. Understand cyclone design. Chem. Eng. Progr. 1993, 28, 51–55. [Google Scholar]


| Vortex Finder | Model | s [m] | D [m] |
|---|---|---|---|
| basic model | I | 0.140 | 0.090 |
| maximum length | II | 0.220 | 0.090 |
| minimum length | III | 0.060 | 0.090 |
| maximum diameter | IV | 0.140 | 0.105 |
| minimum diameter | V | 0.140 | 0.075 |
| Quantity | Value |
|---|---|
| Minimum diameter d | 2 µm |
| Maximum diameter d | 100 µm |
| Mean diameter d | 24.7 µm |
| Sauter mean diameter d | 51.5 µm |
| Standard deviation | 17.3 µm |
| Spread parameter | 2.537 |
| Total number of particles used for simulations n | 5.321 × 10 |
| Grid Symbol | Number of Cells | Modal Value | Maximum Value | Mean Difference | Mean Difference |
|---|---|---|---|---|---|
| (QEAS) (QESS) | (QEAS) (QESS) | (Velocity) [%] | (Pressure) [%] | ||
| Grid 1 | 157,144 | 0.3 ÷ 0.4 (41.8%) | 0.7 ÷ 0.75 (0.17%) | 23.7 ÷ 32.1 | 18.4 ÷ 28.9 |
| 0.3 ÷ 0.4 (36.3%) | 0.7 ÷ 0.75 (0.24%) | ||||
| Grid 2 | 309,258 | 0.3 ÷ 0.4 (40.5%) | 0.7 ÷ 0.75 (0.19%) | - | - |
| 0.3 ÷ 0.4 (34.7%) | 0.7 ÷ 0.75 (0.26%) | ||||
| Grid 3 | 626,750 | 0.3 ÷ 0.4 (38.4%) | 0.7 ÷ 0.75 (0.22%) | 6.7 ÷ 9.3 | 5.5 ÷ 7.3 |
| 0.3 ÷ 0.4 (33.1%) | 0.7 ÷ 0.75 (0.27%) |
| Point Number | Radial Coordinate [m] | Tangential Velocity Simulated [m/s] | Tangential Velocity Measured [m/s] | Relative Error [%] |
|---|---|---|---|---|
| 1 | 0.075 | 9.47 | 11.13 | 14.9 |
| 2 | 0.080 | 12.15 | 11.46 | 5.7 |
| 3 | 0.085 | 14.79 | 12.92 | 14.4 |
| 4 | −0.075 | 19.16 | 17.11 | 11.9 |
| 5 | 0.045 | 10.43 | 11.75 | 11.2 |
| 6 | 0.055 | 10.93 | 12.15 | 10.1 |
| 7 | 0.075 | 11.64 | 11.39 | 2.1 |
| 8 | 0.085 | 11.14 | 12.03 | 7.4 |
| 9 | −0.045 | 10.72 | 12.27 | 12.6 |
| 10 | −0.055 | 11.40 | 13.33 | 14.5 |
| 11 | −0.075 | 12.72 | 12.84 | 0.9 |
| 12 | −0.085 | 12.51 | 12.95 | 3.3 |
| 13 | 0.040 | 9.84 | 13.82 | 28.7 |
| 14 | 0.050 | 10.21 | 12.93 | 21.1 |
| 15 | −0.040 | 10.54 | 13.43 | 21.5 |
| 16 | −0.050 | 8.92 | 12.11 | 26.4 |
| Cyclone Model | Pressure Drop, Pa | |||
|---|---|---|---|---|
| CFD Simulation | Coker Eq. [59] | Measurement | Relative Error, % | |
| Cyclone I | 341 | 284 | 340 | 16.7 |
| basic model | 0.3 * | |||
| Cyclone II | 347 | 284 | - | 18.1 |
| maximum length | ||||
| Cyclone III | 340 | 284 | - | 16.4 |
| minimum length | ||||
| Cyclone IV | 305 | 209 | - | 31.5 |
| maximum diameter | ||||
| Cyclone V | 358 | 409 | - | 14.3 |
| minimum diameter | ||||
| Cyclone Model | Collection Efficiency, % | ||
|---|---|---|---|
| CFD Simulation | Measurement | Relative Error,% | |
| Cyclone I | 86.3 | 87.8 | 1.7 |
| basic model | |||
| Cyclone II | 85.5 | - | - |
| maximum length | |||
| Cyclone III | 89.5 | - | - |
| minimum length | |||
| Cyclone IV | 86.6 | - | - |
| maximum diameter | |||
| Cyclone V | 87.7 | - | - |
| minimum diameter | |||
Publisher’s Note: MDPI stays neutral with regard to jurisdictional claims in published maps and institutional affiliations. |
© 2020 by the authors. Licensee MDPI, Basel, Switzerland. This article is an open access article distributed under the terms and conditions of the Creative Commons Attribution (CC BY) license (http://creativecommons.org/licenses/by/4.0/).
Share and Cite
Wójtowicz, R.; Wolak, P.; Wójtowicz-Wróbel, A. Numerical and Experimental Analysis of Flow Pattern, Pressure Drop and Collection Efficiency in a Cyclone with a Square Inlet and Different Dimensions of a Vortex Finder. Energies 2021, 14, 111. https://doi.org/10.3390/en14010111
Wójtowicz R, Wolak P, Wójtowicz-Wróbel A. Numerical and Experimental Analysis of Flow Pattern, Pressure Drop and Collection Efficiency in a Cyclone with a Square Inlet and Different Dimensions of a Vortex Finder. Energies. 2021; 14(1):111. https://doi.org/10.3390/en14010111
Chicago/Turabian StyleWójtowicz, Ryszard, Paweł Wolak, and Agnieszka Wójtowicz-Wróbel. 2021. "Numerical and Experimental Analysis of Flow Pattern, Pressure Drop and Collection Efficiency in a Cyclone with a Square Inlet and Different Dimensions of a Vortex Finder" Energies 14, no. 1: 111. https://doi.org/10.3390/en14010111
APA StyleWójtowicz, R., Wolak, P., & Wójtowicz-Wróbel, A. (2021). Numerical and Experimental Analysis of Flow Pattern, Pressure Drop and Collection Efficiency in a Cyclone with a Square Inlet and Different Dimensions of a Vortex Finder. Energies, 14(1), 111. https://doi.org/10.3390/en14010111