Article

Transient Behavior of Vertical Commingled Well in Vertical Non-Uniform Boundary Radii Reservoir

1
SINOPEC Petroleum Exploration and Production Research Institute, Beijing 100083, China
2
State Key Laboratory of Petroleum Resources and Prospecting, China University of Petroleum, Beijing 102249, China
3
School of Chemical and Process Engineering, University of Leeds, Leeds LS2 9JT, UK
4
School of Geography, University of Leeds, Leeds LS2 9JT, UK
*
Authors to whom correspondence should be addressed.
Energies 2020, 13(9), 2305; https://doi.org/10.3390/en13092305
Submission received: 26 March 2020 / Revised: 26 April 2020 / Accepted: 1 May 2020 / Published: 6 May 2020
(This article belongs to the Section H: Geo-Energy)

Abstract

:
Transient behavior analysis, including rate transient analysis (RTA) and pressure transient analysis (PTA), is a powerful tool to investigate the production performance of the vertical commingled well from long-term production data and capture the formation parameters of the multilayer reservoir from transient well testing data. Current transient behavior analysis models hardly consider the effect of vertical non-uniform boundary radii (VNBR) on transient performances (rate decline and pressure response). The VNBR may cause an obvious novel radial flow regime and rate decline type, which can easily be mistaken as a radial composite reservoir. In this paper, we present a VNBR transient behavior analysis model, the extended vertical uniform boundary radii (VUBR), to investigate the rate decline behavior and pressure response characteristics through diagnostic type curves. Results indicate that the dimensionless production integral derivative curve or pressure derivative curve can magnify the differences so that we can diagnose the outer-convex shape and size of the VNBR. Therefore, it is significant to incorporate the effects of VNBR into the transient behavior analysis models of the vertical commingled well, and the model proposed in this paper enables us to better evaluate well performance, capture formation characteristics and diagnose flow regimes based on rate/pressure transient data.

1. Introduction

With the depletion of conventional oil and gas resources, more and more complex, multilayer oil and gas reservoirs have been discovered with the improvement of exploration technology. The well production performance and reservoir evaluation are of great significance for enhancing recovery in multilayer oil and gas field development [1,2,3]. Both production decline analysis and well testing analysis are important dynamic technologies for petroleum engineers to evaluate well performance [4,5,6]. During the past years, many researchers have investigated the production decline behavior and pressure response characteristics of the vertical commingled well. Their main focus was four types of analysis: transient behavior analysis (including pressure transient analysis (PTA) [7,8,9,10,11,12] and rate transient analysis (RTA) [12,13,14,15]), vertical-heterogeneity analysis [16,17,18] and boundary effect analysis [19,20,21], for a commingled well in a multilayer reservoir.
For the PTA and RTA for the vertical commingled production well, Satman used the discontinuous inner boundary radii to characterize the front of the displacement fluid during the enhanced recovery processes, such as steam flooding and gravity override effect [7,8]. Tariq and Ramey presented a PTA model considering the wellbore storage and skin factor in the multilayer reservoir [9]. Anbarci et al. presented a PTA model to determine the front location in a multilayer reservoir [10]. Ehlig-Economides and Joseph validated a general analytical solution of PTA for an n-layer, composite, crossflow reservoir system [11]. Fetkovich et al. conducted studies on the RTA and PTA for a two-layer non-communicating reservoir, and the pressure response curves showed that these layers can be combined into one layer if the layers have the same physical properties [12]. El-Banbi and Wattenbarger developed an RTA model to match the gas well production data for a three-layer tight gas reservoir [13]. Villanueva-Triana and Civan developed an RTA model for three-layer commingled reservoirs involving formation crossflow and general external flow boundaries [14]. Milad simulated a commingled well RTA model for multilayer shale gas reservoirs, in which the pressures and flow rates are not constant in various zones [15].
For the vertical-heterogeneity of the multilayer reservoir, Aly et al. examined the effect of unequal initial layer pressure on RTA and PTA models [16]. However, their objective was the permeability and skin factor rather than boundary radii of an individual layer. Jordan and Mattar compared the PTA curves of the composite reservoir with that of the multilayer reservoir [17]. His modified composite reservoir demonstrated that the composite reservoir pressure behavior would be like that of a multilayer reservoir if the vertical permeability is very small. Lodon et al. provided a two-layer semi-analytical PTA model of a commingled reservoir with different boundary distances of each layer, and their model shows that the PTA curve of the two-layer reservoir is located between that of the two-layer reservoir with the same minimum and maximum boundary distance [18]. However, their research is limited to the two-layer reservoir and cannot provide a quantitative relation of pressure behavior between the total reservoir and individual layers.
For the boundary effect of the reservoir, Larsen generated an exact Laplace-transformed solution including a great variety of boundary configurations. Results show the PTA of a square boundary reservoir is the same as that of a circle boundary reservoir [19]. For a well near a liner leaky boundary in the two-layer reservoir, Boussila et al. revealed that there is a quantitative relationship between the pressure derivative and the mobility ratio during the boundary flow stage [20]. For the tidal flat layered carbonate reservoir in Sichuan Basin, Shi et al. characterized the pressure transient behavior by a layered reservoir with the vertical inhomogeneous closed boundary [21]. Their results showed that the shape of the closed boundary has an intuitive inverse proportional relationship on the pressure derivative curve during the radial flow regime.
The existing research mainly focuses on the analysis and acquisition of the parameters of layered reservoirs from the production data, and few works discuss the equivalence and substitutability of the boundary effect of multilayer reservoirs [22]. The objective of this paper is to investigate the influence of vertical non-uniform boundary radii (VNBR) on transient behavior and explore the corresponding relation between them. This paper extends the boundaries issues of the multilayer reservoir by a VNBR transient behavior analysis method. Some interesting and valuable phenomena, such as the “equivalent seepage volume effect” and the “equivalent composite zone effect”, are identified, which give a new perspective on the flow regimes of the vertical commingled well in a VNBR reservoir and provide a quick approach to capturing the formation parameters from transient well test data. The transient behavior analysis model presented in this paper provides a tool to characterize the production performance and rate decline type from the long-term production data.

2. Methodology

2.1. Physical Model

Figure 1a shows a vertical commingled well in the VNBR reservoir. The following assumptions are considered to yield the mathematical model:
  • A vertical production well is located at the center of a multilayer reservoir formation with constant initial reservoir pressure (pi) in any layer (j). The formation has a circular-closed boundary with non-uniform boundary radii in the vertical direction, but any layer j has an individual constant thickness (hj) and boundary radius (rej).
  • The formation is considered to be isotropic and homogeneous. Any layer has individual physical parameters, including the permeability (kj), porosity (φj) and total compressibility (ctj).
  • The formation is fully penetrated by the vertical production well with height (ht) and radius (rw). During the production stage, both the pressure (pj) and rate (qj) of any layer are different. The bottom-hole pressure (pw) and wellbore rate (q) are variable with the production time.
  • The porosity of the formation is filled with a single-phase fluid with constant viscosity (μ). Radial flow regime is assumed in any layer (see Figure 1b,c). The isothermal volume factor (B) is descript the volume change of the natural gas from the wellbore to the wellhead.
  • The gravity and temperature effects are ignored.

2.2. Mathematical Model

The dimensionless flow equations of any layer j in Laplace domain are (see the detailed derivation in Appendix A):
1 r D r D ( r D 2 p ¯ j D r D 2 ) = σ j p ¯ j D
The definition of the parameters is provided in Table A1, and the boundary conditions are presented in Appendix A.
Substituting Aj & Bj, obtained by solving Equation (A11) into Equation (A12), the dimensionless rate solution of RTA model is obtained as:
q ¯ D ( u ) = j = 1 n { χ j σ j [ A j I 1 ( σ j ) B j K 1 ( σ j ) ] }
where the parameters are presented in Appendix B.
Stehfest provides the mathematical relationship of a dimensionless solution between Laplace domain and real-time domain [23]. Blasingame et al. defined three parameters to characterize dimensionless transient rate as follows [24]:
{ q D d = q D b D p s s q D d i = 1 t D d 0 t D d q D d ( τ ) d τ q D d i d = t D d d q D d i d t D d
where qDd denotes the normalized dimensionless decline rate, qDdi represents the normalized dimensionless decline rate integral and qDdid is the normalized dimensionless decline rate integral derivative. tDd is the normalized dimensionless decline time, which can be calculated by:
t D d = α b D p s s t D
where
{ α = 2 ω j r e D j 2 b D p s s = α 2 4 [ ω j χ j r e D j 4 ( ln r e j D 0.75 ) ]
According to the research results of Van-Everdingen and Hurst, the dimensionless pressure solution of PTA mode can be obtained through the dimensionless rate solution of the RTA model in Laplace domain [25]:
p ¯ w D ( u ) = 1 u 2 q ¯ D ( u )
Based on Duhamel’s superposition principle, the dimensionless pressure solution of the PTA model in Laplace domain with the effects of skin factor and wellbore storage is [25]:
p ¯ w D ( u , S , C D ) = u p ¯ w D ( u ) + S u + C D u 2 [ u p ¯ w D ( u ) + S ]
The dimensionless pressure solution of the PTA model can be obtained in the real-time domain by Stehfest inversion [23]. In the double logarithmic coordinate system, the dimensionless pressure derivative can zoom the characteristics of the dimensionless pressure features, and the dimensionless pressure derivative is:
p w D ( t D ) = t D d p w D ( t D ) d t D

3. Results and Discussion

3.1. Solution Validation

The dimensionless pressure solution of the PTA model in a two-layer reservoir with the same boundary radii is [26]:
p ¯ w D ( u ) = 1 u [ u + χ 1 σ 1 K 1 ( σ 1 ) K 0 ( σ 1 ) + χ 2 σ 2 K 1 ( σ 2 ) K 0 ( σ 2 ) ]
where
σ j = ω j u χ j C D e 2 S
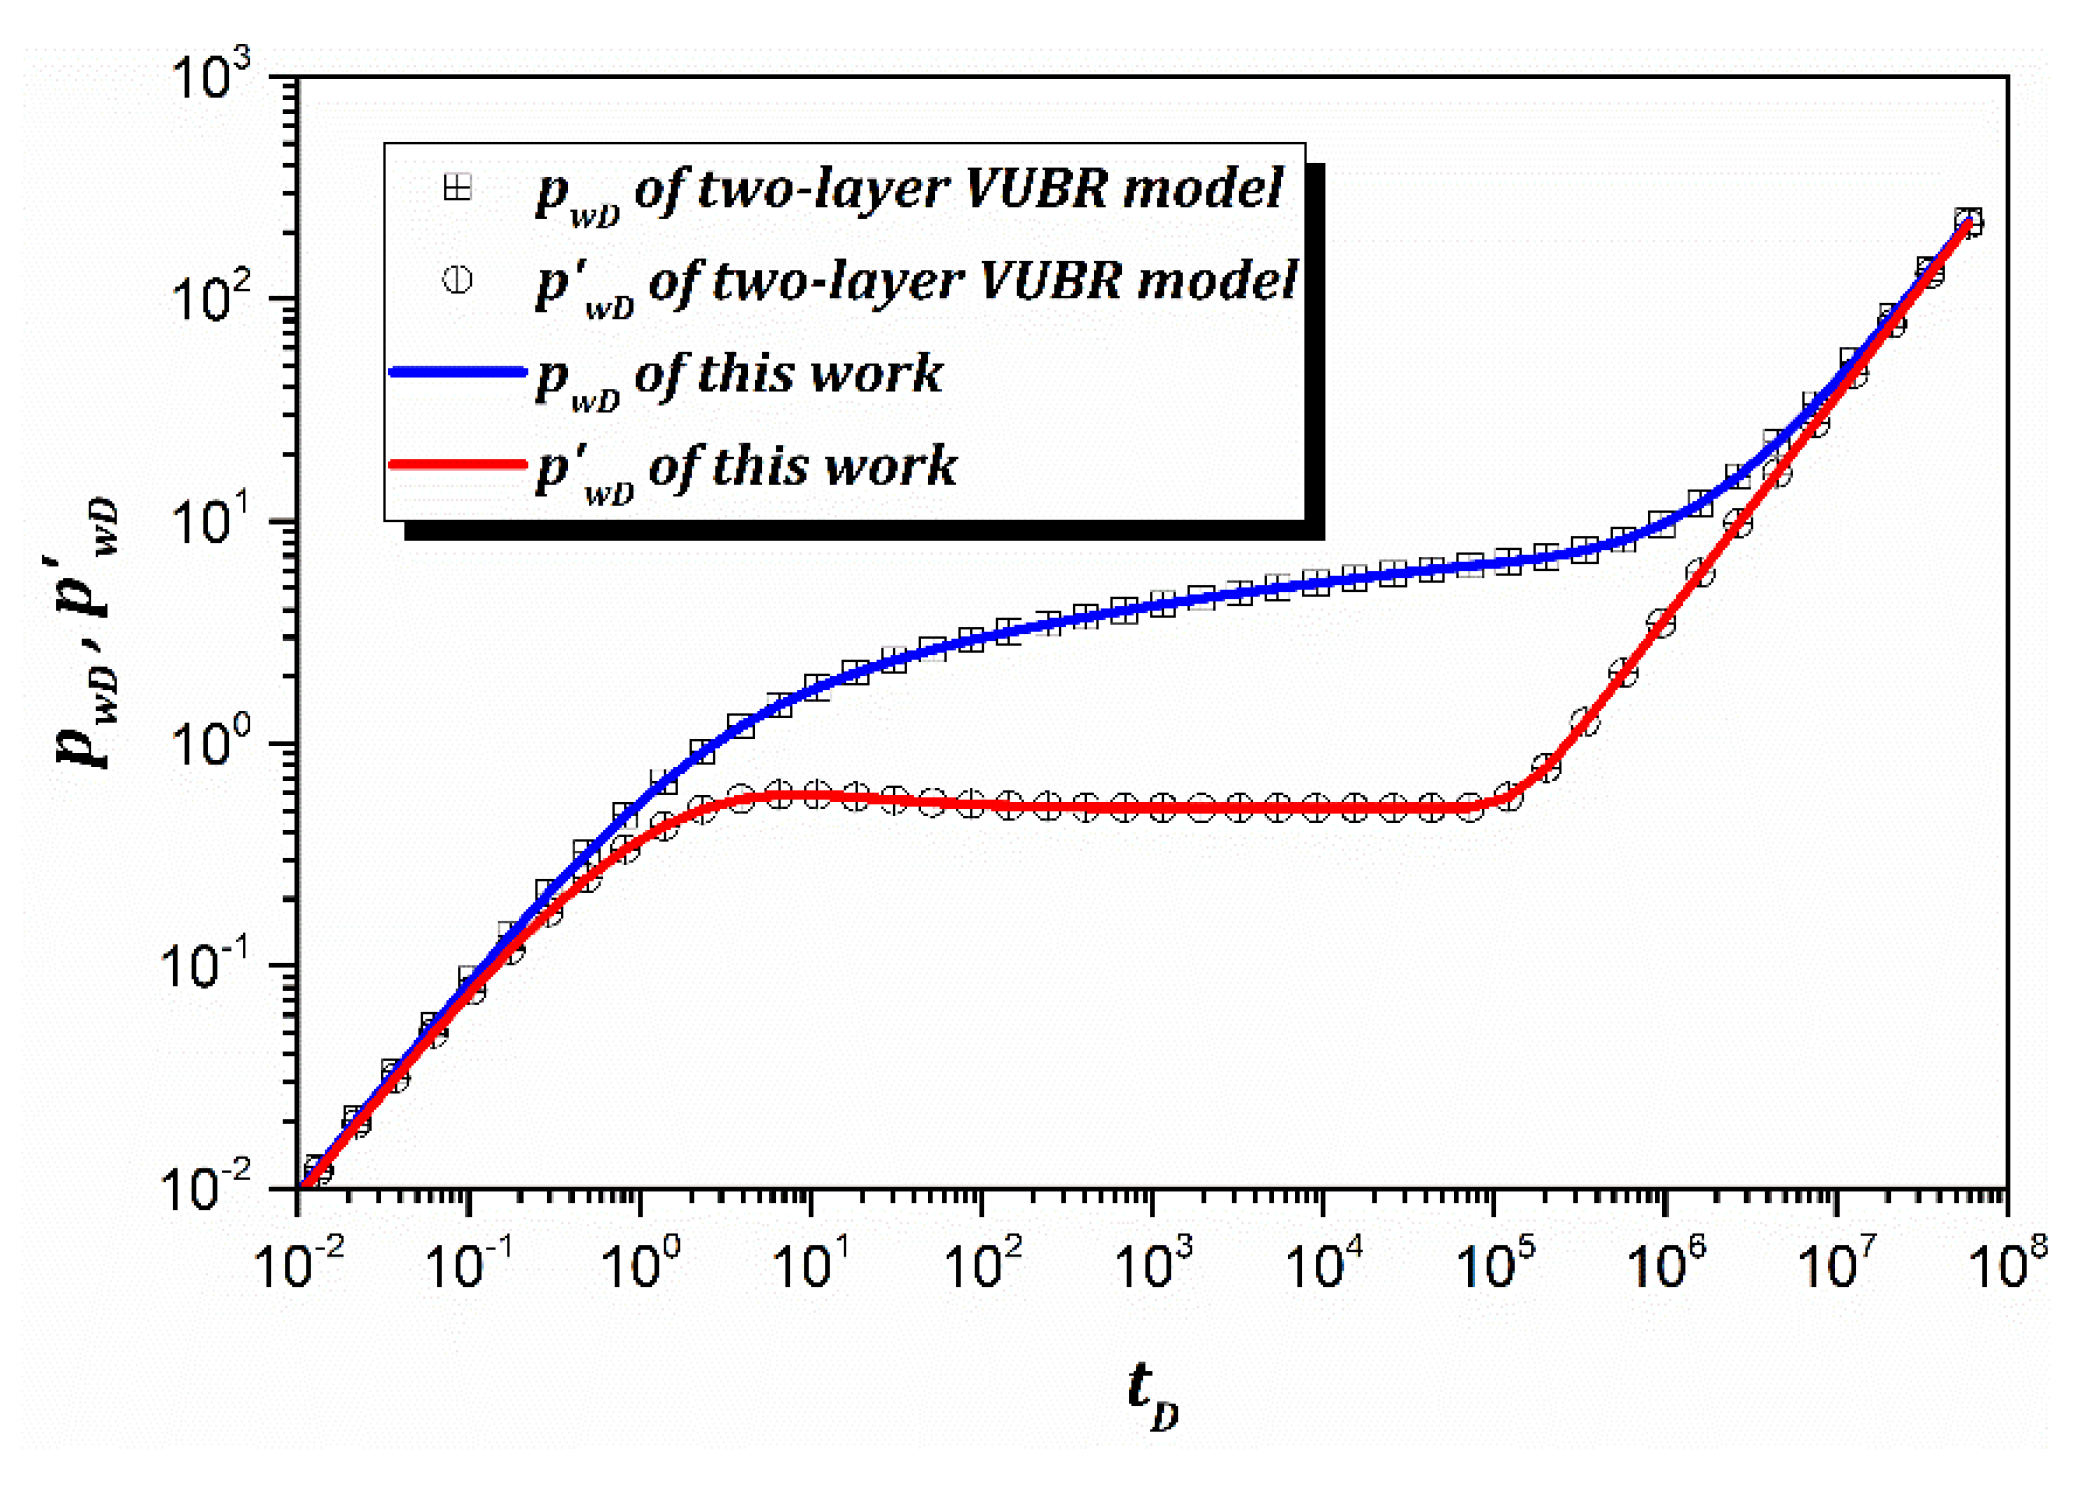
Setting n = 2 and re1D = re2D = 1000, other parameters are listed in Table 1, the n-layer VNBR reservoir becomes a two-layer vertical uniform boundary radii (VUBR) reservoir. Figure 2 shows that the simplified VNBR PTA model matches that of the two-layer VUBR reservoir perfectly, which proves our model is reliable.

3.2. Combined Type Curve

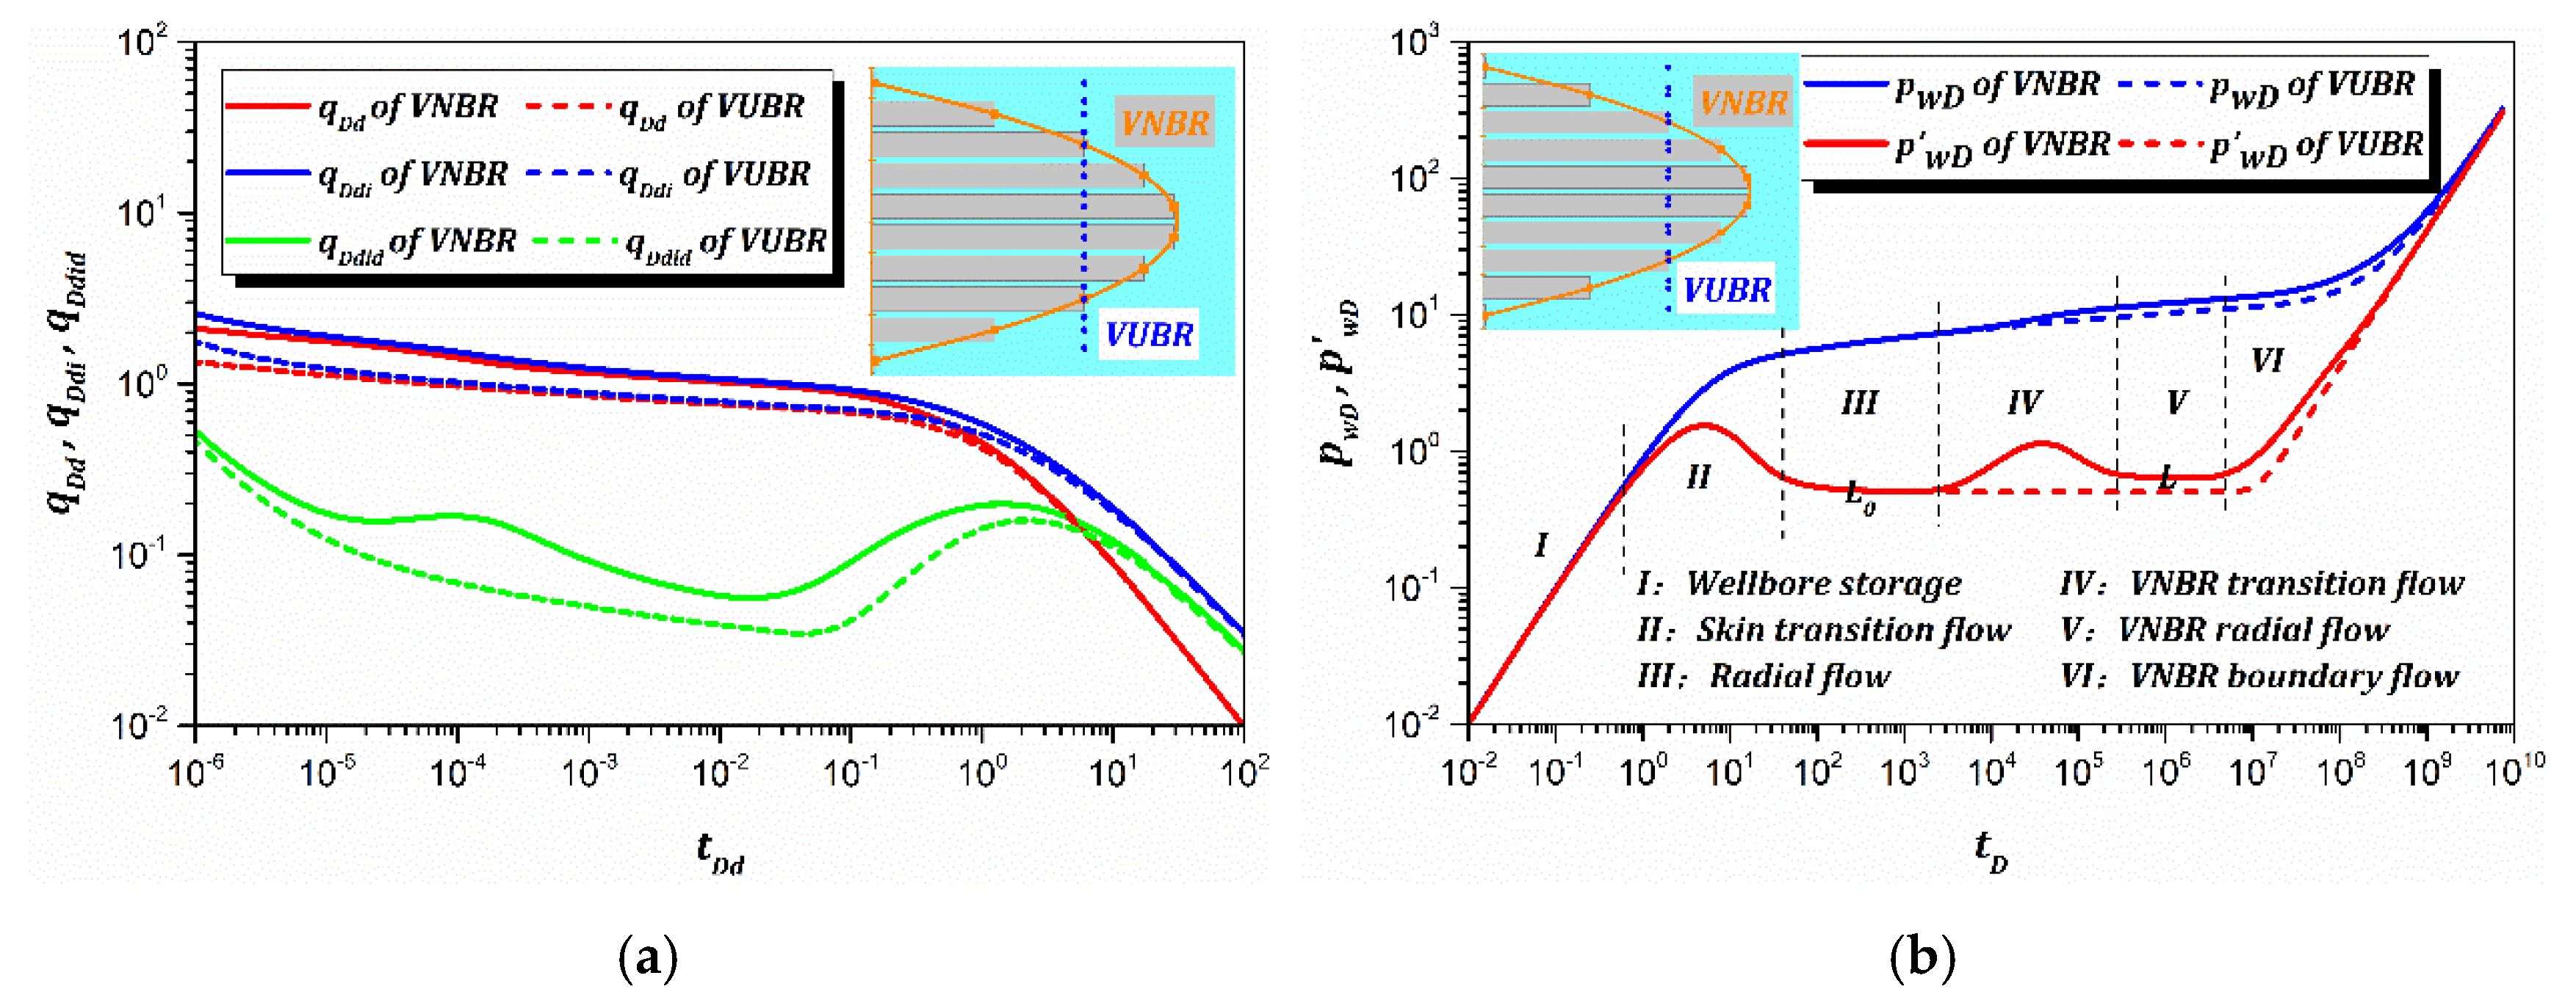
To characterize the effect of vertical non-uniform boundary radii (VNBR) on rate decline behavior and pressure response, we developed the combined type curves of VNBR and equivalent vertical uniform boundary radii (VUBR). The parameters of VNBR and equivalent VUBR for the combined type curves can be found in Table 2. The outer-convex VNBR, parabolic interpolation from 100 to 1000, is only a typical case of analysis. Based on the equivalent seepage volume (ESV) [21], the value of the equivalent VUBR can be calculated by the following equation:
r e D _ V U B R = j = 1 n ( χ j ω j h j D r e j D 2 )
As shown in Figure 3a, the RTA combined type curves (including the normalized dimensionless decline rate curve (qDd), the normalized dimensionless decline rate integral curve (qDdi) and the normalized dimensionless decline rate integral derivative curve (qDdid)) show the PTA combined type curves of VNBR and VUBR are different, especially before the boundary-dominated flow. The RTA combined curves are much higher than the VUBR case even if the parameters are the same. The deployment of the dimensionless production integral derivative curve magnifies the differences so that we can capture the effect of VUBR. As shown in Figure 3b, the PTA combined type curves (including the dimensionless pressure curve (pwD) and dimensionless pressure derivative curve (p’wD)) show the flow of the VNBR reservoir can be divided into six flow regimes. Flow regime I is caused by wellbore storage. Flow regime II is induced by the skin effect near the wellbore. The pressure derivative is constant (L0 = 0.5) in flow regime III. In the early stage of flow regime IV, the pressure derivative begins to increase due to the pressure drop having reached the closest boundary. In the late stage of flow regime IV, the pressure derivative begins to decrease as the pressure drop propagates far through other layers. The pressure derivative curve appears a second constant value (L) during flow stage V. The pressure and its derivative increase and eventually coincide into the unit-slope line in flow regime VI.

3.3. Sensitivity Analysis

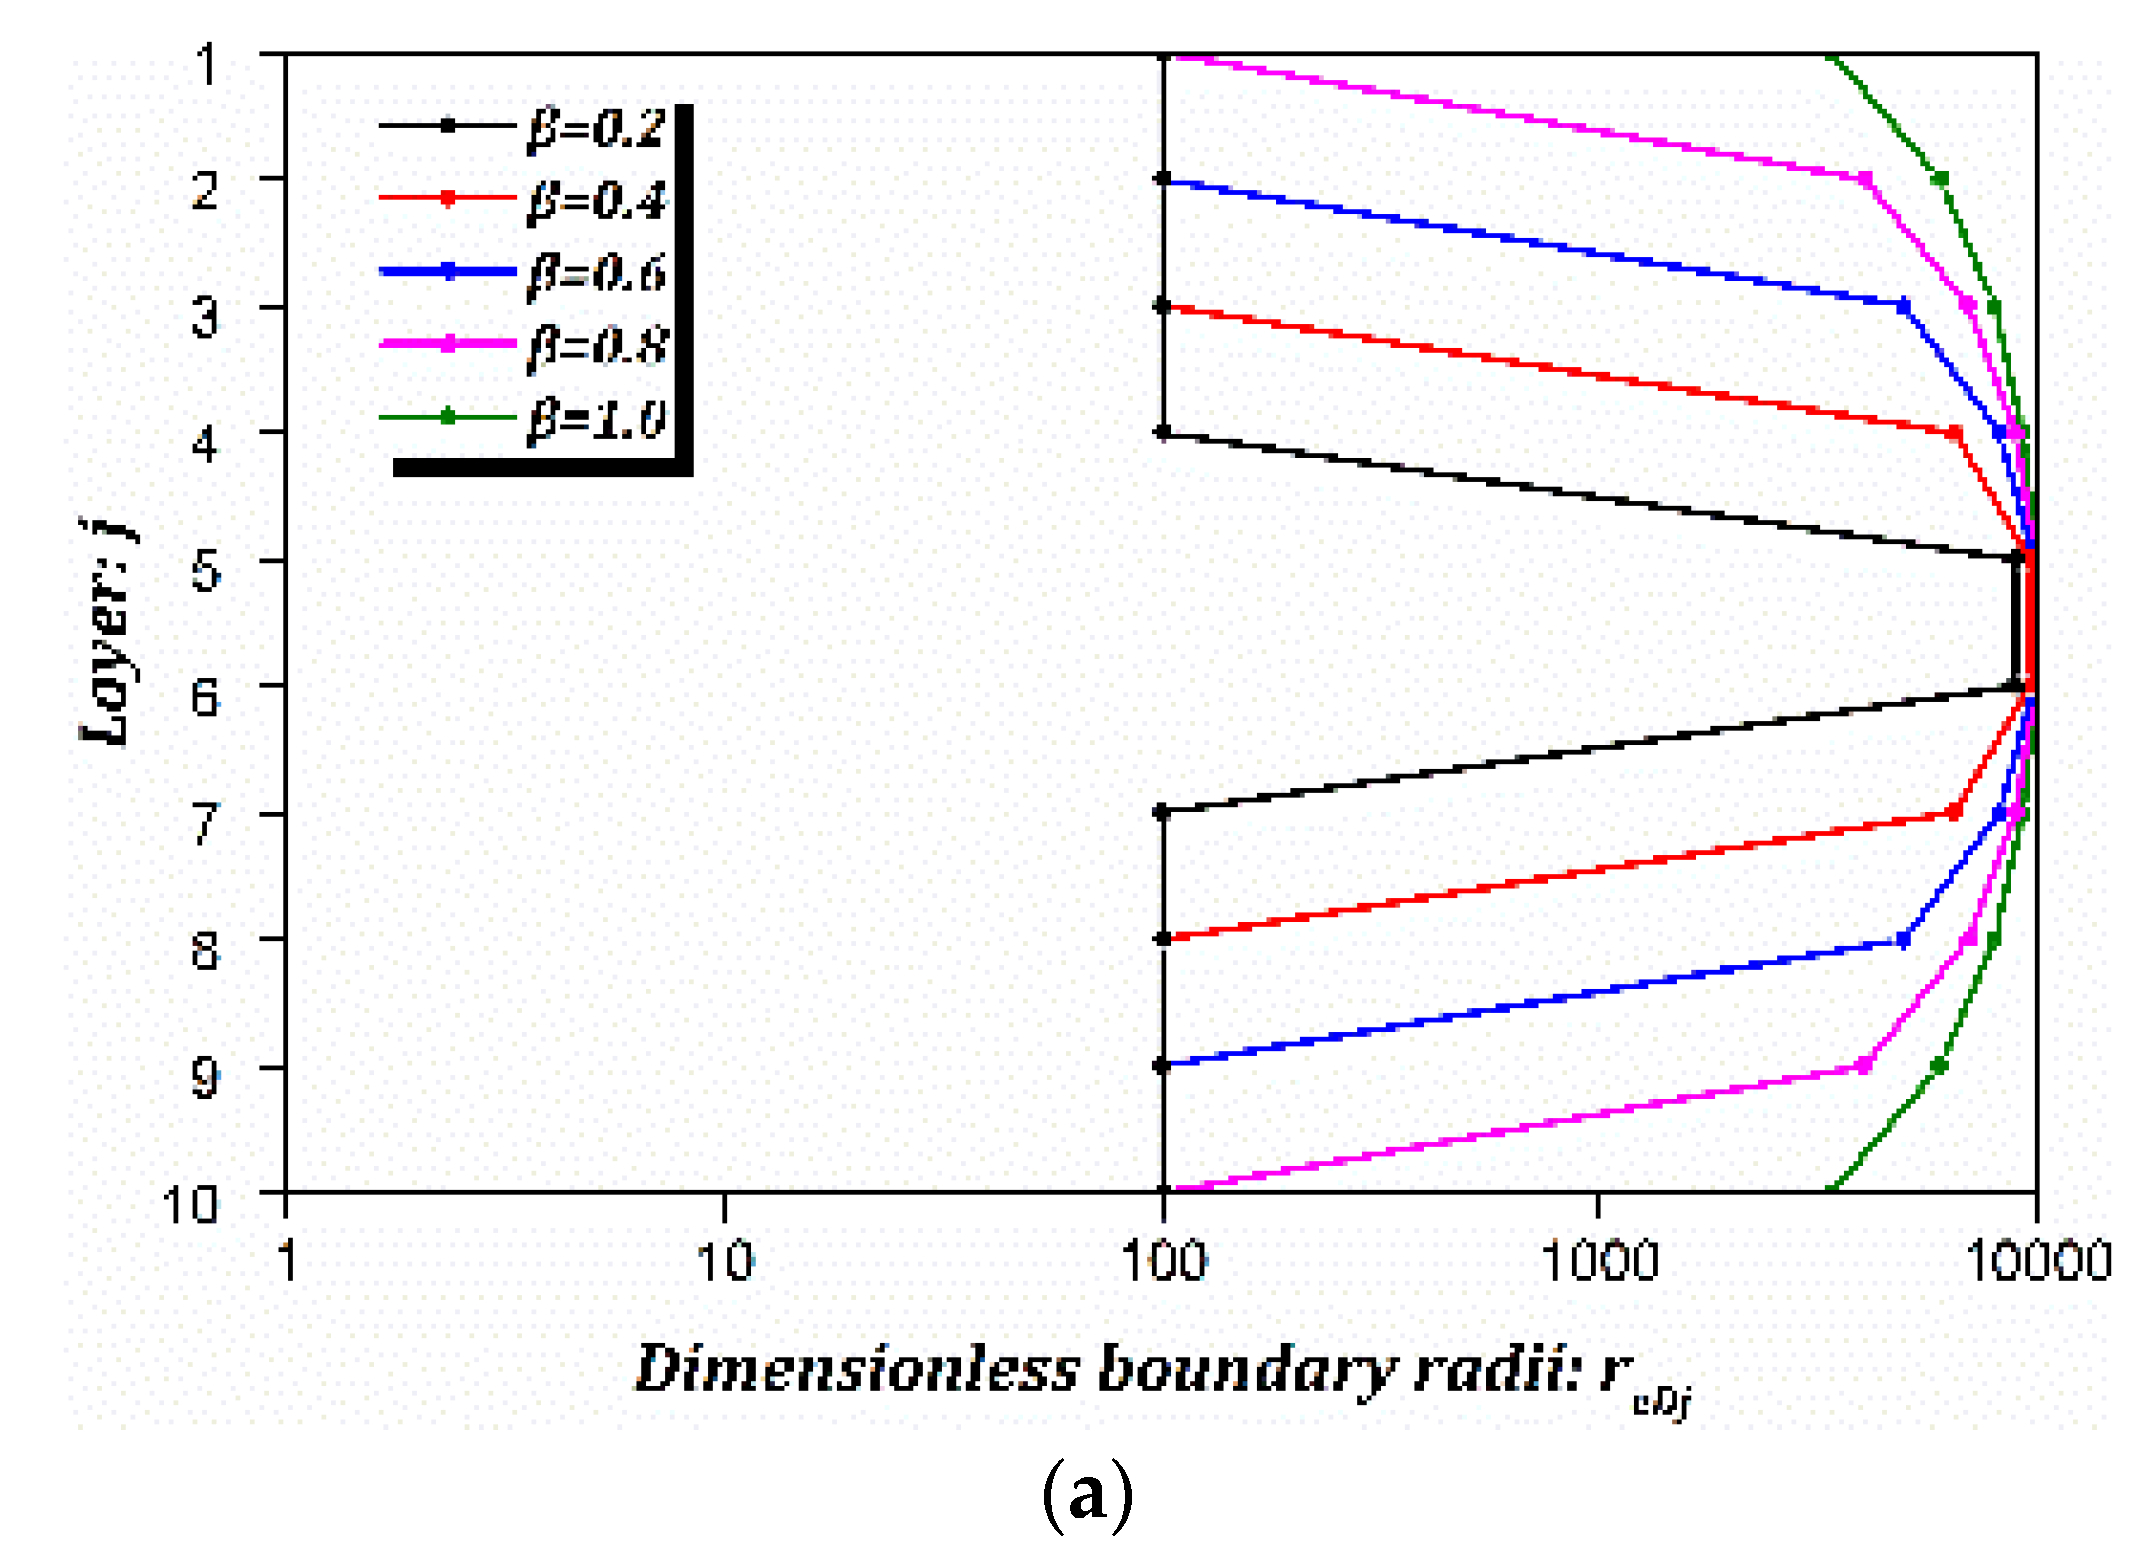
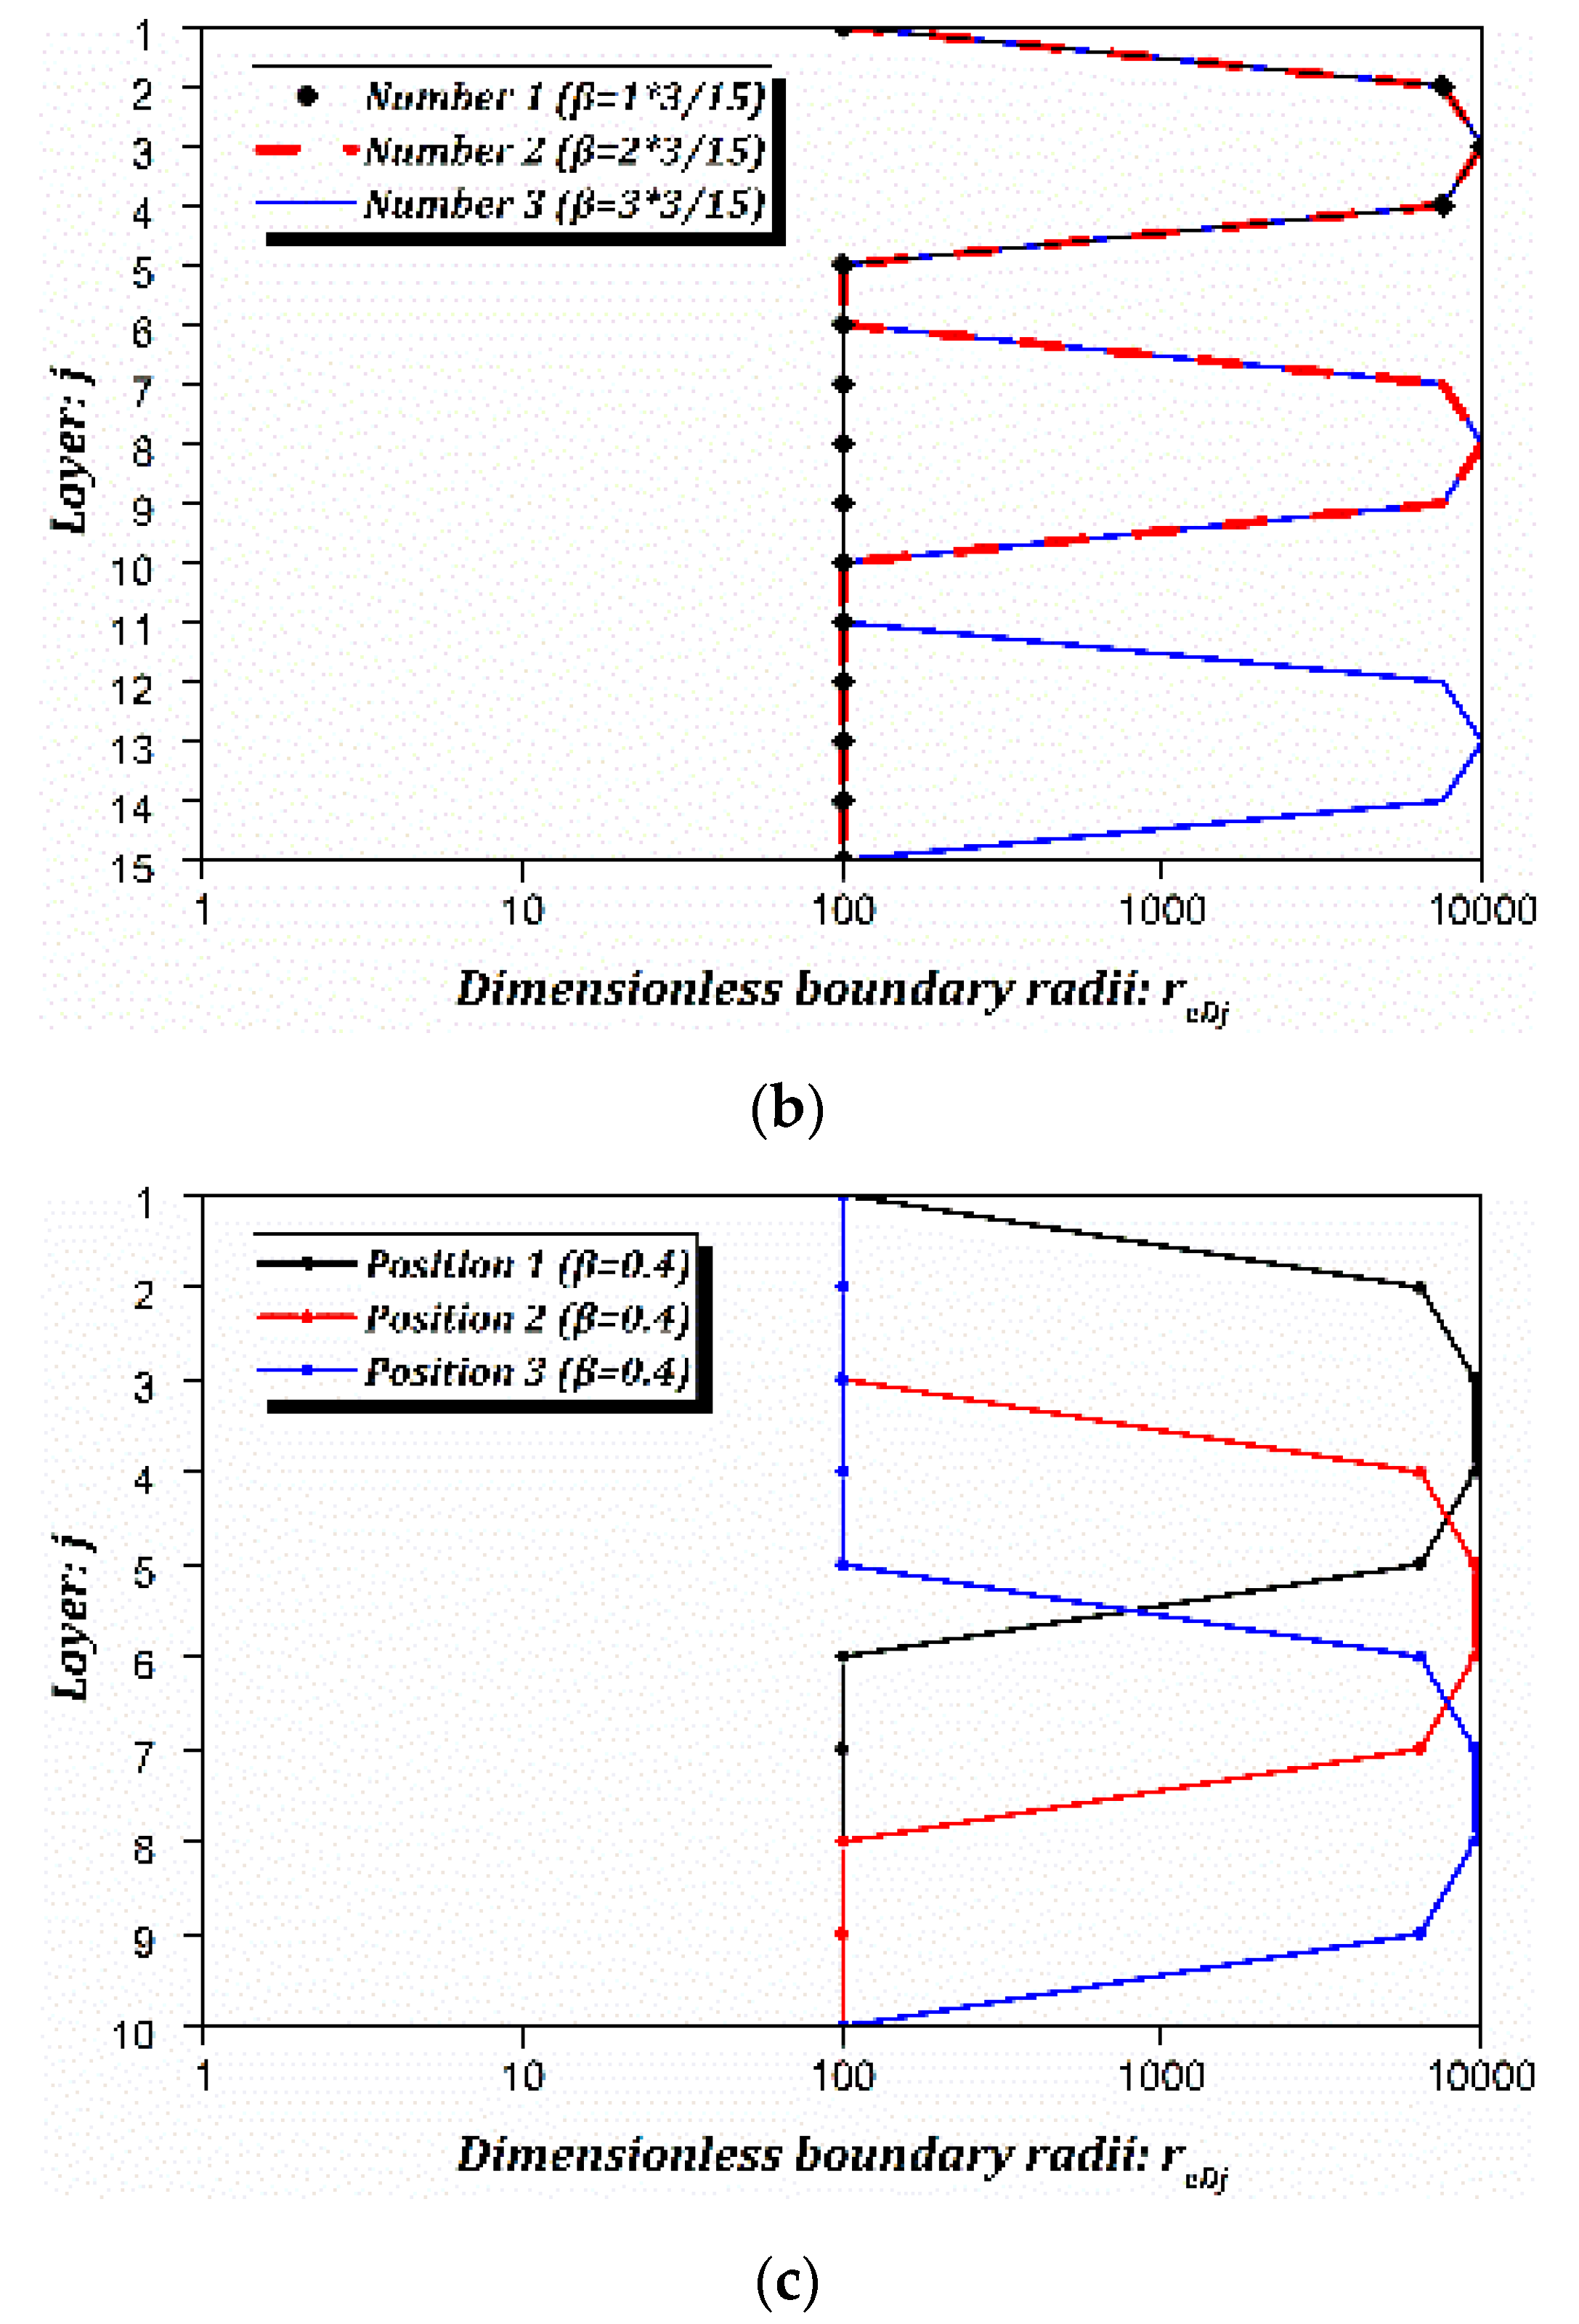
The β is introduced to represent the outer-convex relative thickness. In Case 1 (see Figure 4a), the outer-convex thickness is increasing but the maximum radius is constant. In Case 2 (see Figure 4b), the outer-convex number increases but each outer-convex thickness is the same. In Case 3 (see Figure 4c), the outer-convex positions are different but the each outer-convex is the same.

3.3.1. Outer-Convex Thickness

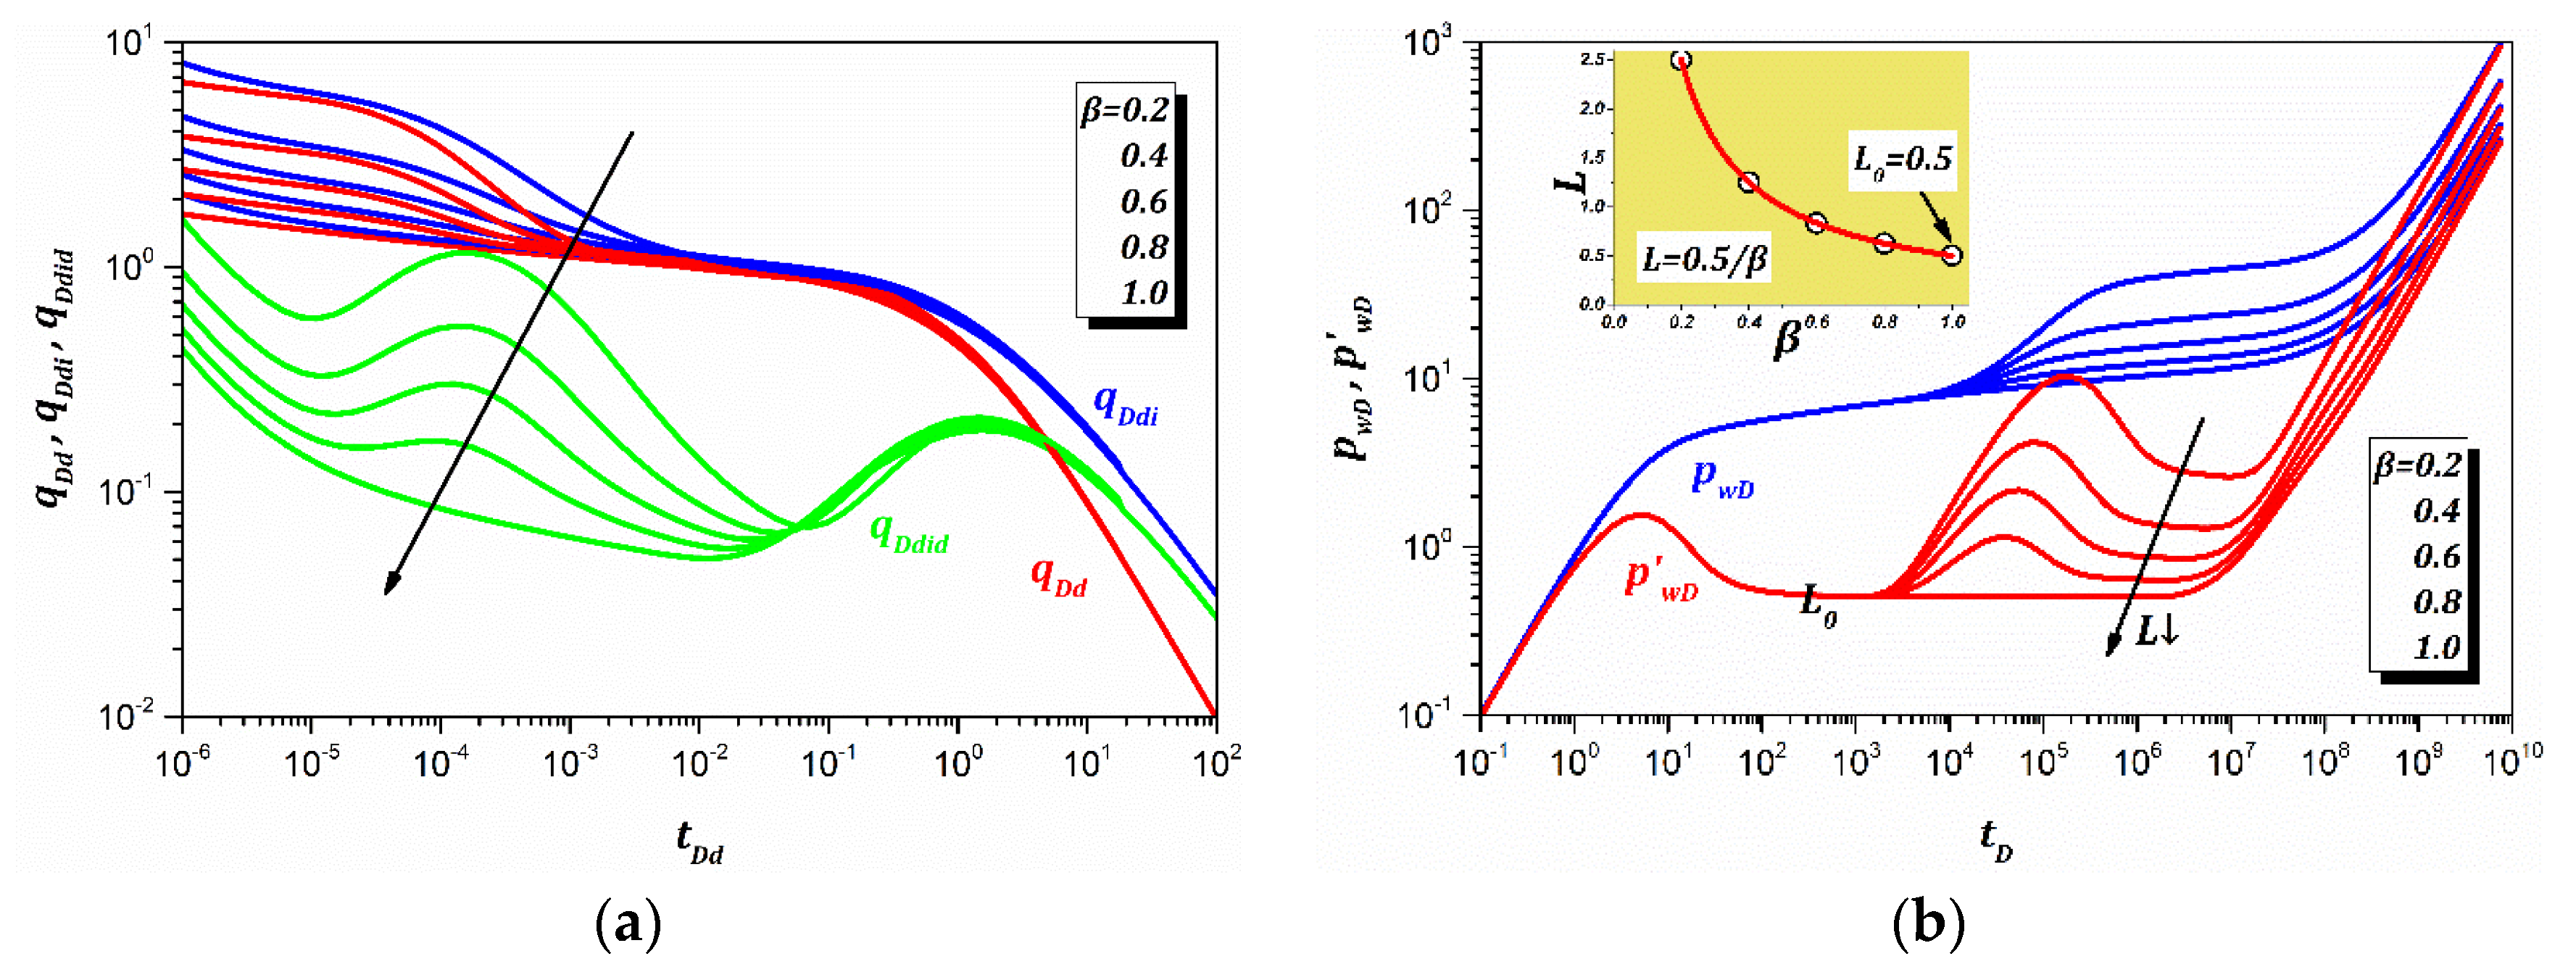
As shown in Figure 5a, the RTA combined type curves of the VNBR move down and closer to that of the VUBR as the β increases. Therefore, the outer-convex thickness can be captured through the combined type curves. As shown in Figure 5b, L approaches L0 as the β increases, and the mathematical relationship is L = L0. This mathematical relationship clarifies the seepage physical meanings of β and provides a fast way to obtain the outer-convex thickness just from the pressure derivative curve.

3.3.2. Outer-Convex Number

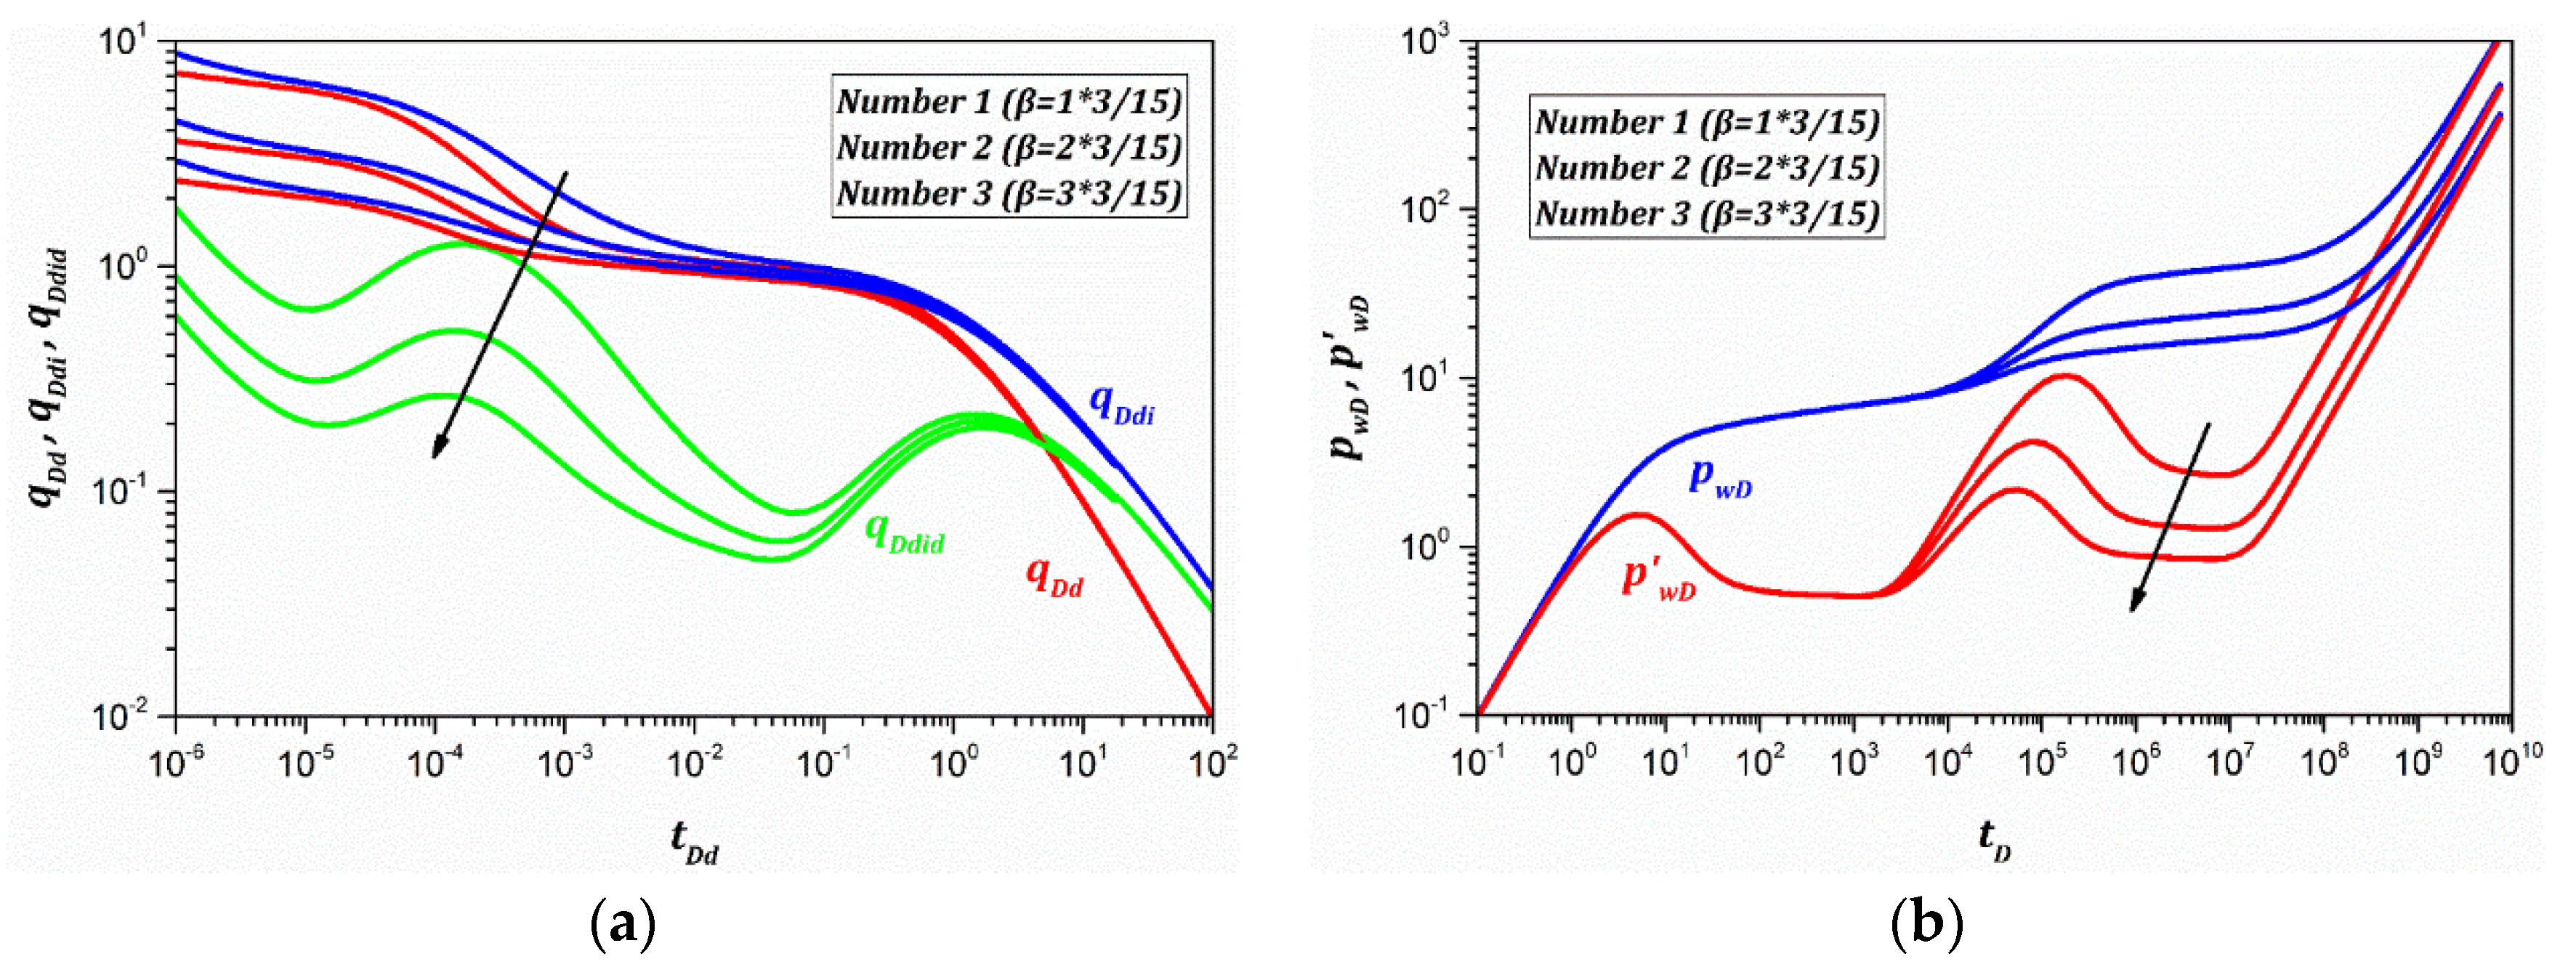
As shown in Figure 4b, the β is 3/15 when a single outer-convex is located at the top, the β is 6/15 when the double outer-convex is distributed in the top and middle and the β is 9/15 when the triple outer-convex is distributed in the top, middle and bottom. As shown in Figure 6a, the RTA combined curves move down due to the total thickness of outer-convex increasing from single to triple outer-convex as the outer-convex number is increasing. As shown in Figure 6b, the PTA combined type curves move down due to the outer-convex total thicknesses increasing. On the one hand, the start time of the VNBR transition flow regime is the same, as the minimum VNBR is unchanged. On the other hand, the start time of the VNBR boundary flow regime is later, since the equivalent VUBR becomes larger.

3.3.3. Outer-Convex Position

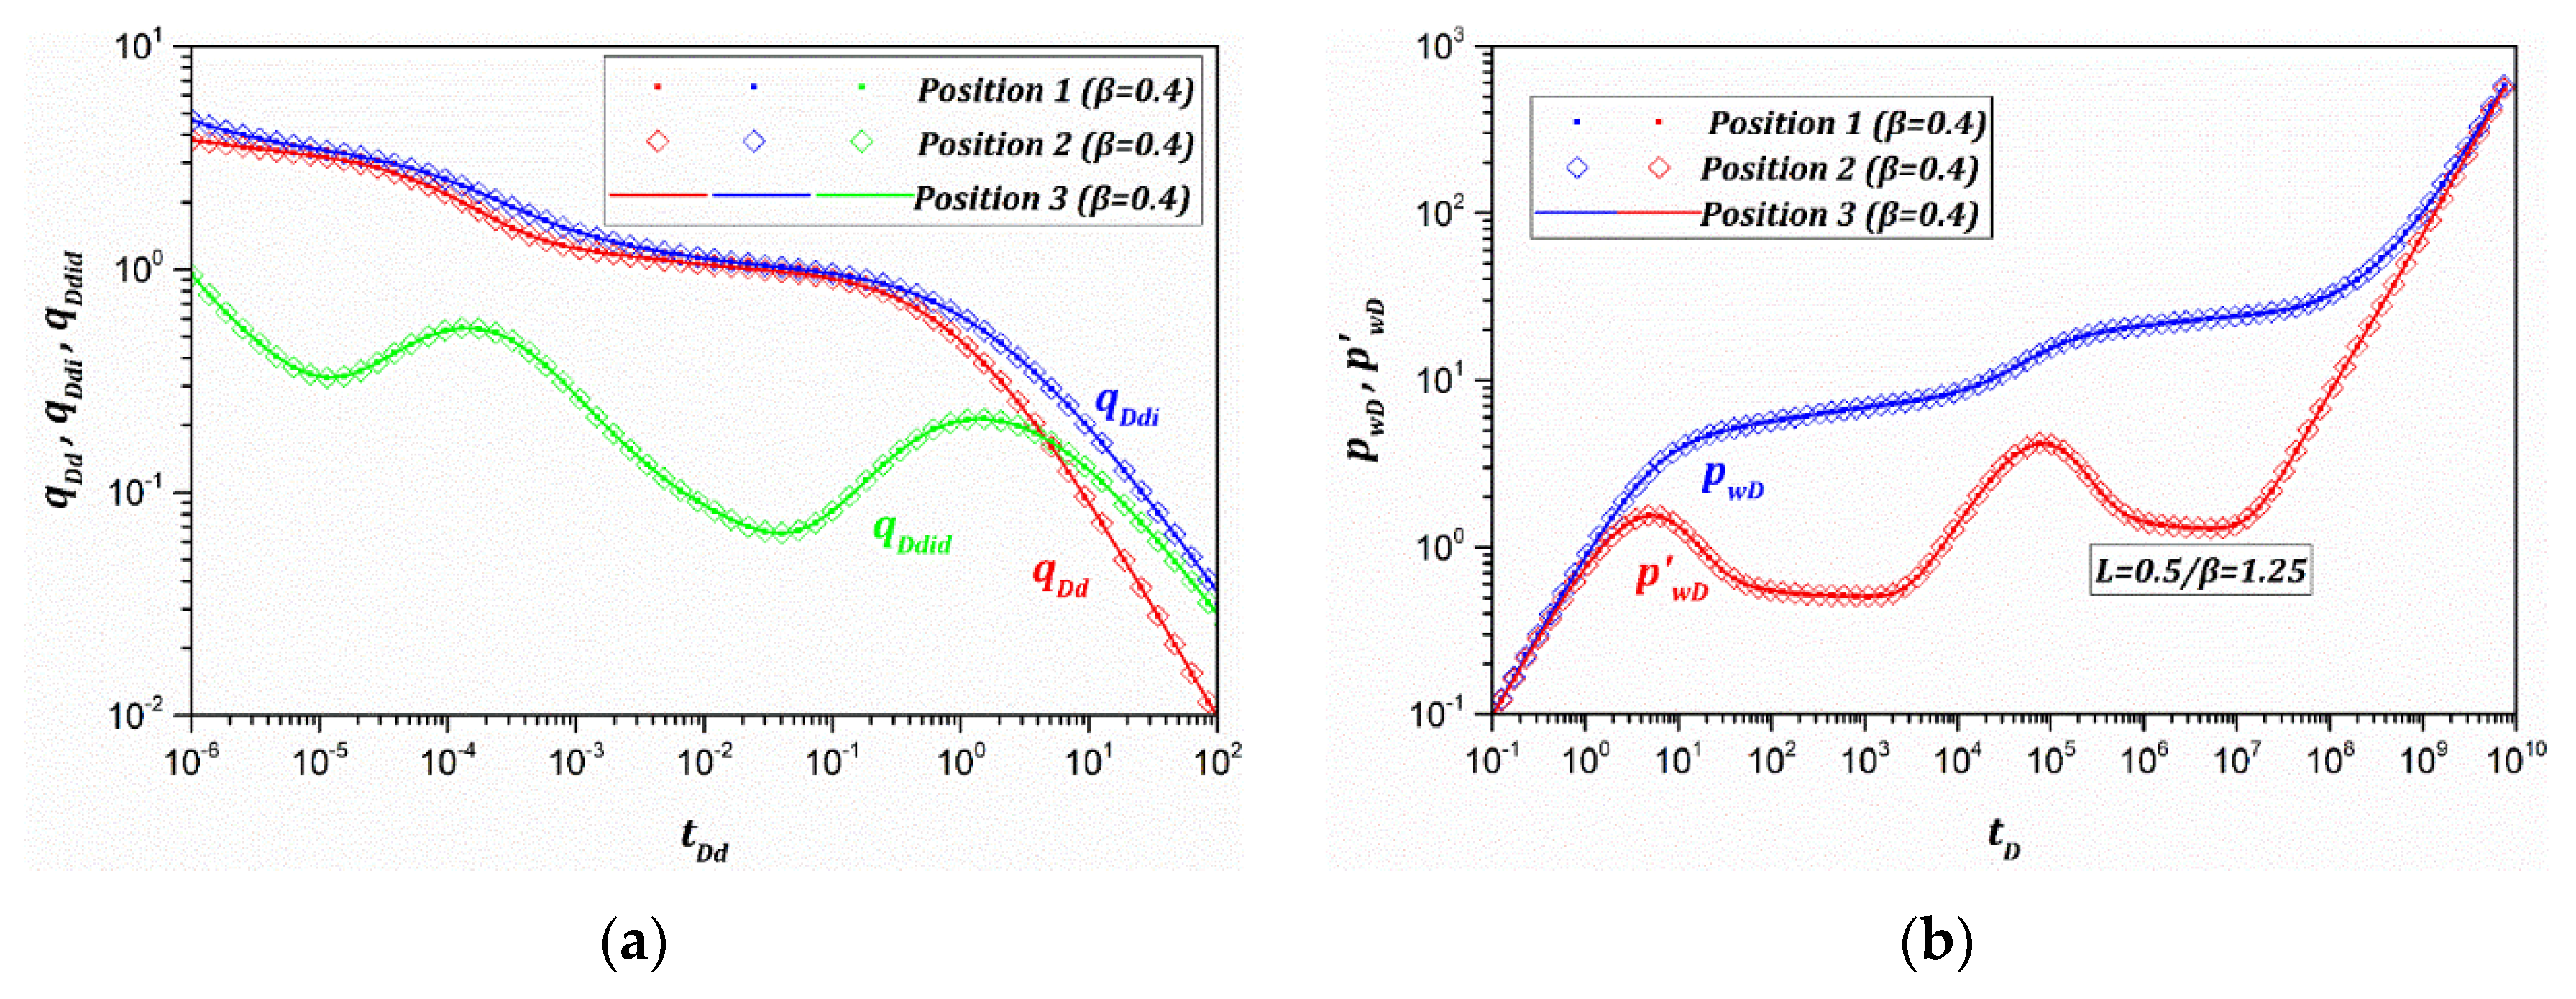
The outer-convex position refers to the outer-convex located at the top, middle and bottom of the reservoir (see Figure 4c). The ESV and β are unchanged due to the outer-convex thickness and outer-convex number being constant. Therefore, the rate decline curves (see Figure 7a) or pressure response curves (see Figure 7b) are completely coincident, regardless of the outer-convex position. The phenomenon indicates that the outer-convex position cannot be captured only from long-term production data or transient well test data.

4. Conclusions

This paper presents the extended RTA and PTA models of a vertical well in the VNBR reservoir by Laplace transform, Shehfest inverse and Duhamel’s superposition principles, and further develops the rate and pressure combined type curves to capture the production decline behavior and flow regimes’ characteristics. Several conclusions and suggestions are obtained from this work.
(1)
The production decline behavior of the VNBR reservoir is different from that of the VUBR reservoir, and the normalized dimensionless decline rate integral derivative can magnify the differences in the RTA combined type curves.
(2)
A new radial flow regime is identified in the VNBR reservoir that is captured by the PTA combined type curves. This behavior can be easily misinterpreted by a radial composite model as it has two stabilizations of the pressure derivative. Thus, the well testing analyst should be aware of the “equivalent composite zone effect”.
(3)
The outer-convex thickness and outer-convex number of the VNBR can be quickly obtained from the second level of pressure derivative in the PTA combined type curve. The equivalent VUBR can be obtained from the boundary radius corresponding to the boundary flow regime based on the “equivalent seepage volume effect”.
(4)
The actual exact outer-convex position of the VNBR, especially the VNBR with multiple outer-convexes, can neither be identified by RTA nor PTA combined type curves when the outer-convex total thickness and equivalent distance of the VNBR are unchanged.
In conclusion, the proposed RTA model enables petroleum engineers to better evaluate the production performance of a vertical well in the VNBR reservoir and interpret reservoir and well parameters more accurately based on the long-term production data. The PTA model can be used to analyze the pressure response of the VNBR reservoir, and quickly capture the flow regime characteristics from transient well test data.

Author Contributions

B.S. provided funding support and supervised this research. W.S. established the model. R.Z. wrote the manuscript. S.C. supervised this research. C.Z. developed the type curves and draw the graphs. S.D. conducted sensitivity analysis. N.C. edited and revised the manuscript. All authors have read and agreed to the published version of the manuscript.

Funding

This research was funded by [Sinopec’s “Shitiaolong” special project] grant number [P18062].

Acknowledgments

The achievements of this paper are supported by Sinopec’s “Shitiaolong” special project (P18062). The corresponding author (CSC NO. 201906440196) would like to thank the China Scholarship Council for supporting this research at the University of Leeds, UK.

Conflicts of Interest

The authors declare no conflict of interest.

Nomenclature

PTAPressure transient analysis, abbreviation
RTARate transient analysis, abbreviation
VNBRVertical non-uniform boundary radii, abbreviation
VUBRVertical uniform boundary radii, abbreviation
ΔThe thickness of the inner zone, m
ΔpThe pressure difference between initial formation and any position, Pa
ΔpwThe pressure difference between initial formation and wellbore, Pa
Aj, BjUnknown coefficients of pressure solution equation of layer j, real number
BIsothermal volume factor, m3/m3
CWellbore storage factor, m3/Pa
CDDimensionless wellbore storage factor, real number
ctjTotal compressibility of layer j, Pa−1
hjThe thickness of layer j, m
htThe thickness of formation, m
Ia, Kaa-order Bessel function, real number function
kjPermeability of layer j, m2
LThe value of pressure derivative in VNBR radial flow stage, real number
L0The value of pressure derivative in radial flow, real number
MeEquivalent mobility ratio, real number
nThe number of layers, positive integer
piInitial formation pressure, Pa
pjThe pressure of layer j, Pa
pjDDimensionless pressure of layer j, real number
pwBottom-hole pressure, Pa
p′wBottom-hole pressure derivative, Pa
pwDDimensionless bottom-hole pressure, real number
p′wDDimensionless bottom-hole pressure derivative, real number
qRate of production well, m3/s
qDDimensionless wellbore flow rate, real number
qDdNormalized dimensionless rate, real number
qDdiNormalized dimensionless rate integral, real number
qDdidNormalized dimensionless rate integral derivative, real number
qjRate of layer j, m3/s
qjDDimensionless rate of layer j, real number
rRadial distance, m
rDDimensionless radial distance, real number
re_VUBREquivalent vertical uniform boundary radii, m
reDDimensionless boundary radii, real number
reD_VUBRDimensionless equivalent vertical uniform boundary radii, real number
rejBoundary radius of layer j, m
rejDDimensionless boundary radius of layer j, real number
rwThe radius of the wellbore, m
SSkin factor, real number
tReal production time, s
tDDimensionless time, real number
tDdNormalized dimensionless time, real number
uLaplace variable, real number
χjMobility thickness product ratio of layer, fraction
βOuter flow-layer ratio, fraction
δThe thickness of the outer-convex zone, m
μThe viscosity of fluid, Pa·
σjKernel function of layer j in the Laplace domain, real number function
φjThe porosity of layer j, fraction
ωjStorability ratio of layer j, fraction

Appendix A

For any horizontal layer j, the flow equation in a radial coordinate system is [7,8]:
1 r r ( r p j r ) = μ φ j c t j k j p j t
Before production (t = 0), the pressure of any layer j is uniform and equals the initial formation pressure, which can be written as:
p j | t = 0 = p i
At the wellbore position (r = rw), the pressure of layer j is the same and equal to the bottom hole pressure. Therefore, the pressure at the inner boundary is:
p j | r = r w = p w
At the wellbore position (r = rw), the wellbore rate is the summation of all the layers. Hence, the rate at the inner boundary is expressed as:
{ 2 π k j h j μ B ( r p j r ) | r = r w = q j j = 1 n q j = q
There is no flow at the reservoir circle–closed boundary position (r = rej), which can be expressed as:
p j r | r = r e j = 0
To obtain the dimensionless mathematical model, first, define the following variables as shown in Table A1.
Table A1. Summary of the dimensionless variables in the model.
Defined ParametersExpressions
Constant Production Pressure
(RTA Model)
Constant Production Rata
(PTA Model)
Dimensionless pressurepD = 2πkaht(pi − p)/(qμB)pD = (pi − p)/(pi − pw)
Dimensionless wellbore flow rateqD = 1qD = qμB/[2πkaht(pi − pw)]
Dimensionless bottom-hole pressurepWd = 2πkaht(pi − pw)/(qμB)pwD = 1
Dimensionless thickness of layer jhjD = hj/ht
Average reservoir permeabilityka = ∑(kjhjD)
Average reservoir storability coefficient(φct)a = ∑[(φct)jhjD]
Dimensionless radial distancerD = r/rw
Dimensionless timetD = kat/[μct)arw2]
Dimensionless wellbore storage coefficientCD = C/[2πht(φct)arw2]
Mobility thickness product ratios in layer jχj = kjhjD/ka
Storability ratios in layer jωj = hjD(φct)j/(φct)a
Based on the dimensionless parameters and dimensionless variables, the dimensionless equations of the RTA mathematical model in the real-time domain are:
{ 1 r D r D ( r D 2 p j D r D 2 ) = ω j χ j p j D p j D | t D = 0 = 0 p j D | r D = 1 = 1 p j D r D | r D = r e j D = 0
Taking Laplace transformation to tD, Equation (A6) in the Laplace domain can be written as:
{ 1 r D r D ( r D 2 p ¯ j D r D 2 ) = σ j p ¯ j D p ¯ j D | u = 0 = 0 p ¯ j D | r D = 1 = 1 u p ¯ j D r D | r D = r e j D = 0
where σ j = u ω j / χ j .

Appendix B

In the Laplace domain, the pressure solution of layer j in Equations (A1) and (A2) can be written as [7,9]:
p ¯ j D ( r D , u ) = A j I 0 ( r D σ j ) + B j K 0 ( r D σ j )
For any layer j, there are four unknown coefficients (Aj, Bj) in Equation (A8). Since the range of j is from 1 to n, the number of unknown coefficients in the PTA model is 2n. Substituting Equation (8) and its derivative into the boundary conditions of Equation (7) yields:
[ a 1 b 1 a j b j a n b n c 1 d 1 c j d j c n d n ] [ A 1 B 1 A j B j A n B n ] = [ 1 u 1 u 0 0 ]
where the elements of Equation (A9) are:
{ a j = I 0 ( σ j ) b j = K 0 ( σ j ) c j = σ j I 1 ( σ j r e j D ) d j = σ j K 1 ( σ j r e j D )
The Aj and Bj are obtained by solving Equation (9). Substituting Aj and Bj into Equation (8), the dimensionless pressure solution of any layer j can be obtained. Likewise, the dimensionless rate of layer j is obtained from Equation (A4) as follows:
q ¯ j D ( u ) = χ j p ¯ j D r D | r D = 1 = χ j σ j [ A j I 1 ( σ j ) B j K 1 ( σ j ) ]
From Equation (A4) and Equation (A11), the dimensionless rate solution is obtained as:
q ¯ D ( u ) = j = 1 n q ¯ j D ( u )

References

  1. Sarisittitham, S.; Jamiolahmady, M. Decline Curve Analysis for Tight Gas and Gas Condensate Reservoirs. In Proceedings of the International Petroleum Technology Conference, Kuala Lumpur, Malaysia, 10–12 December 2014; IPTC-18188-MS. International Petroleum Technology Conference: Richardson, TX, USA, 2014. [Google Scholar] [CrossRef]
  2. Zuo, L.; Yu, W.; Wu, K. A fractional decline curve analysis model for shale gas reservoirs. Int. J. Coal Geol. 2016, 163, 140–148. [Google Scholar] [CrossRef]
  3. Wang, M.; Fan, Z.; Xing, G.; Zhao, W.; Song, H.; Su, P. Rate Decline Analysis for Modeling Volume Fractured Well Production in Naturally Fractured Reservoirs. Energies 2018, 11, 43. [Google Scholar] [CrossRef] [Green Version]
  4. He, Y.; Cheng, S.; Qin, J.; Wang, Y.; Feng, N.; Hu, L.; Huang, Y.; Fang, R.; Yu, H. A semi-analytical approach to estimate the locations of malfunctioning horizontal wellbore through bottom-hole pressure and its application in Hudson oilfield. In Proceedings of the SPE Middle East Oil & Gas Show and Conference, Manama, UK, 6–9 March 2017. [Google Scholar] [CrossRef]
  5. Wang, Y.; Ayala, L.F. Explicit Determination of Reserves for Variable-Bottomhole-Pressure Conditions in Gas Rate-Transient Analysis. SPE J. 2019, 25, 369–390. [Google Scholar] [CrossRef]
  6. Zhang, X.; Wang, X.; Hou, X.; Xu, W. Rate Decline Analysis of Vertically Fractured Wells in Shale Gas Reservoirs. Energies 2017, 10, 1602. [Google Scholar] [CrossRef] [Green Version]
  7. Satman, A. An Analytical Study of Transient Flow in Stratified Systems with Fluid Banks. Society of Petroleum Engineers. In Proceedings of the SPE Annual Technical Conference and Exhibition, San Antonio, TX, USA, 4–7 October 1981. [Google Scholar] [CrossRef]
  8. Satman, A.; Oskay, M. Effect of A Tilted Front on Well Test Analysis; Society of Petroleum Engineers: Richardson, TX, USA, 1985. [Google Scholar]
  9. Tariq, S.; Ramey, H. Drawdown Behavior of a Well with Storage and Skin Effect Communicating with Layers of Different Radii and Other Characteristics. In Proceedings of the SPE Annual Fall Technical Conference and Exhibition, Houston, TX, USA, 1–3 October 1978. [Google Scholar] [CrossRef]
  10. Anbarci, K.; Grader, A.; Ertekin, T. Determination of Front Locations in a Multilayer Composite Reservoir. In Proceedings of the SPE Annual Technical Conference and Exhibition, San Antonio, TX, USA, 8–11 October 1989. [Google Scholar] [CrossRef]
  11. Ehlig Economides, C.; Joseph, J. A New Test for Determination of Individual Layer Properties in a Multilayered Reservoir. SPE Form. Eval. 1987, 2, 261–283. [Google Scholar] [CrossRef]
  12. Fetkovich, M.J.; Bradley, M.D.; Works, A.M.; Thrasher, T.S. Depletion Performance of Layered Reservoirs Without Crossflow. SPE Form. Eval. 1990, 5, 310–318. [Google Scholar] [CrossRef]
  13. El Banbi, A.H.; Wattenbarger, R.A. Analysis of Commingled Tight Gas Reservoirs. In Proceedings of the SPE Annual Technical Conference and Exhibition, Denver, CO, USA, 6–9 October 1996. [Google Scholar] [CrossRef]
  14. Villanueva Triana, B.; Civan, F. Rigorous Simulation of Production from Commingled Multilayer. Reservoirs under Various Crossflow and Boundary Conditions. In Proceedings of the SPE Production and Operations Symposium, Oklahoma City, OK, USA, 23–26 March 2013. [Google Scholar] [CrossRef]
  15. Milad, B. Modeling and Simulation of Production from Commingled Multilayer Zones and Hydraulically Fractured Horizontal Wells in Unconventional Gas Reservoirs. Master’s Thesis, University of Oklahoma, Norman, OK, USA, 2013. [Google Scholar]
  16. Aly, A.; Chen, H.; Lee, W. Pre-Production Pressure Analysis of Commingled Reservoir with Unequal Initial Pressures. In Proceedings of the Permian Basin Oil and Gas Recovery Conference, Midland, TX, USA, 16–18 March 1994. [Google Scholar] [CrossRef]
  17. Jordan, C.; Mattar, L. Comparison of Pressure Transient Behavior of Composite and Multi-Layer Reservoirs. In Proceedings of the SPE Canadian International Petroleum Conference, Calgary, AB, Canada, 4–8 June 2000. [Google Scholar] [CrossRef]
  18. Lolon, E.; Archer, R.A.; Ilk, D.; Blasingame, T.A. New Semi-analytical Solutions for Multilayer Reservoirs. In Proceedings of the CIPC/SPE Gas Technology Symposium 2008 Joint Conference, Calgary, AB, Canada, 16–19 June 2008. [Google Scholar] [CrossRef] [Green Version]
  19. Larsen, L. Boundary Effects in Pressure-Transient Data from Layered Reservoirs. In Proceedings of the SPE Latin America and Caribbean Mature Fields Symposium, Salvador, Bahia, Brazil, 15–16 March 1989. [Google Scholar] [CrossRef]
  20. Boussila, A.K.; Tiab, D.; Owayed, J. Pressure Behavior of Well Near a Leaky Boundary in Heterogeneous Reservoirs. In Proceedings of the SPE Production and Operations Symposium, Oklahoma City, OK, USA, 23–26 March 2003. [Google Scholar] [CrossRef]
  21. Shi, W.; Cheng, S.; Meng, L.; Gao, M.; Zhang, J.; Shi, Z.; Wang, F.; Duan, L. Pressure transient behavior of layered commingled reservoir with vertical inhomogeneous closed boundary. J. Petrol. Sci. Eng. 2020, 189, 106995. [Google Scholar] [CrossRef]
  22. Gomes, E.; Ambastha, A.K. An Analytical Pressure-Transient Model for Multilayered, Composite Reservoirs with Pseudosteady-State Formation Crossflow; Society of Petroleum Engineers: Richardson, TX, USA, 1993. [Google Scholar] [CrossRef]
  23. Stehfest, H. Numerical inversion of Laplace transforms. Commun. ACM 1970, 13, 624. [Google Scholar] [CrossRef]
  24. Blasingame, T.A.; McCray, T.L.; Lee, W.J. Decline curve analysis for variable pressure drop/variable flowrate systems. In Proceedings of the SPE Gas Technology Symposium, Houston, TX, USA, 22–24 January 1991; SPE-21513-MS. Society of Petroleum Engineers: Richardson, TX, USA, 1991. [Google Scholar] [CrossRef]
  25. Van Everdingen, A.F.; Hurst, W. The Application of the Laplace Transformation to Flow Problems in Reservoirs. J. Pet. Technol. 1949, 1, 305–324. [Google Scholar] [CrossRef]
  26. Lefkovits, H.C.; Hazebroek, P.; Allen, E.E.; Matthews, C.S. A Study of the Behavior of Bounded Reservoirs Composed of Stratified Layers. Soc. Petrol. Eng. J. 1961, 1, 43–58. [Google Scholar] [CrossRef]
Figure 1. (a) The physical model of a vertical well in the vertical non-uniform boundary radii (VNBR) reservoir (compiled according to Shi et al. [21]). (b) The flow of layer j in the horizontal direction. (c) The flow of layer j in the vertical direction.
Energies 13 02305 g001
Figure 2. Solution validation of PTA model of the VNBR reservoir.
Energies 13 02305 g002
Figure 3. The combined type curves of VNBR and VUBR. (a) rate transient analysis (RTA), (b) pressure transient analysis (PTA).
Energies 13 02305 g003
Figure 4. The VNBR of three type cases. (a) Case 1. (b) Case 2. (c) Case 3.
Energies 13 02305 g004aEnergies 13 02305 g004b
Figure 5. The combined type curves of Case 1. (a) RTA, (b) PTA.
Energies 13 02305 g005
Figure 6. The combined type curves of Case 2. (a) RTA, (b) PTA.
Energies 13 02305 g006
Figure 7. The combined type curves of Case 3. (a) RTA, (b) PTA.
Energies 13 02305 g007
Table 1. The input parameters of validation cases (constant for Figure 2, Figure 3, Figure 4, Figure 5, Figure 6 and Figure 7).
ParametersValue
VNBRVUBR
Dimensionless wellbore storage (CD)1.01.0
skin factor (S)0.30.3
Mobility thickness product ratio (χ1)1/n0.5
Storability ratio (ω1)1/n0.5
Table 2. The parameters of the combined type curve of VNBR and equivalent VUBR.
ParametersValue
VNBRVUBR
Number of layers (n)1010
Dimensionless thickness of any layer (hjD)1/n1/n
Dimensionless boundary radii (reD)(100,10,000)7030.0