Abstract
This paper deals with the problem of optimal location and reallocation of battery energy storage systems (BESS) in direct current (dc) microgrids with constant power loads. The optimization model that represents this problem is formulated with two objective functions. The first model corresponds to the minimization of the total daily cost of buying energy in the spot market by conventional generators and the second to the minimization of the costs of the daily energy losses in all branches of the network. Both the models are constrained by classical nonlinear power flow equations, distributed generation capabilities, and voltage regulation, among others. These formulations generate a nonlinear mixed-integer programming (MINLP) model that requires special methods to be solved. A dc microgrid composed of 21-nodes with existing BESS is used for validating the proposed mathematical formula. This system allows to identify the optimal location or reallocation points for these batteries by improving the daily operative costs regarding the base cases. All the simulations are conducted via the general algebraic modeling system, widely known as the General Algebraic Modeling System (GAMS).
1. Introduction
Electrical networks have progressively transformed from thermal dependent systems to networks with high penetration of renewable energy resources [1,2]. This transformation is promoted to the Paris agreement, where many countries around the world have signed compromises regarding the minimization of greenhouse emissions [3]. This agreement forces conventional power systems to change their fossil fuel-based energy matrices (i.e., coal, natural gas, or diesel) by inserting renewable energy sources [4]. These sources are mainly photovoltaic and wind power plants, since their construction and production costs have decreased significantly in the last years [5]. Nevertheless, the inclusion of renewable energy sources is not a perfect solution since power systems must deal with uncertainties produced by weather variations (solar radiance or wind speed uncertainties). These uncertainties depend on the geographical location of the power system as well as the period of the year (winter or summer seasons). To tackle these uncertainties in renewable power generation, we have developed large-scale energy storage systems that allow to reduce the energy oscillations in the power system by compensating these in a dynamical form. Some of these energy storage devices can be: supercapacitors [6], fly-wheels [7], superconductors [8], compressed air systems [9], pumped-hydro systems [10], or batteries [11], among others. The selection of the energy storage depends on the application, i.e., for voltage and frequency compensation, fly-wheel, supercapacitors, or superconductors are preferred [12], while long-time power supplies are preferred for pumped-hydro and battery energy storage systems [13].
The inclusion of renewable energy sources and energy storage devices in power systems is not the only paradigm shift since other remarkable transformations have occurred, especially in distribution voltage levels [14]. This change is caused by the transition from classical alternating current (ac) networks to direct current (dc) systems [15]. The main advantage of using dc grids in comparison to ac is that the reactive power and frequency concepts disappear [16], which makes dc grids easily controllable, with low energy losses and higher voltage profiles [17]. In general, dc grids are more efficient and reliable than their ac counterparts [16,17,18].
Regarding the integration of renewable energy sources and energy storage systems in dc grids, there is a clear advantage, since some of them, such as photovoltaic sources and batteries, can operate directly in dc systems, which reduces the number of power conversion stages for integrating these devices into the grids [19]. Additionally, wind turbines or superconductors are only required in dc conversion stages since the inversion ones are unnecessary. This implies fewer electronic power converters can reduce the probability of failure and the costs of investment, maintenance, and operation [20].
It is important to note that when distribution levels are highly influenced by renewable and energy storage technologies, they integrate into smart grids with the capability of self-management regarding control and optimization [21,22]. Nevertheless, in the case of DC networks, smart grids can be reduced to microgrids since dc networks are an emerging concept in distribution levels and their current size and loadability are currently constrained to small areas (i.e., buildings or data centers) [23,24]. Here, we wish to analyze the problem of battery location and reallocation in dc microgrids from the point of economical and technical goals that focus on proposing a new mathematical model for representing this problem. However, it is important to note that the proposed model will be extended to a large-scale dc distribution feeder when it becomes a reality in the near future without modifications [25].
There are three different approaches to operate dc networks with high penetration of renewable energy resources and batteries, which are condensed in hierarchical control methods. The first two approaches are related to primary and secondary control strategies, which deal with power current and voltage controls [26], and measure local state variables to maintain voltage under nominal operative conditions [27]. Some of these controllers are designed via the sliding mode control [28], passivity based control [29], model predictive approach [30], and droop control [27], which are directly applied to the power electronic converters. The third approach is related to the optimization stage, where there exists specialized literature on tertiary control methods [31]. This stage defines the set points regarding power and voltage to be assigned for all the active devices (i.e., power electronic converters that interfaces batteries and distributed generators) to minimize some objective function, such as, typically, grid energy losses or energy purchase costs [18,31,32].
This study seeks to understand the tertiary control stage regarding optimization methods for the optimal operation of battery energy storage systems in dc networks with high penetration of renewable energy resources. In specialized literature, the optimal operation of batteries in dc grids has been addressed via economic dispatch formulation in three recent references as follows: Authors of [33] present a semi-definite programming model to operate batteries and renewables in dc grids. The authors of [33] proposed a relaxation of the power balance equations via semi-definite matrices, which guarantee the uniqueness of the global solution regarding the problem. The authors of [18] proposed a second-order cone programming model to optimally dispatch renewables and batteries in dc grids. Both relaxations coincide numerically to the exact nonlinear model. The main disadvantage of this model is that the number of variables increase in square form compared to the number of nodes in the dc grid. In [11], a nonlinear non-convex model for the optimal operation of batteries and renewable energies in dc grids considering voltage-dependent load models has been presented. This mathematical model is solved using the General Algebraic Modeling System (GAMS). It should be noted that in the previous models, the location of the batteries was predefined, and the data of the network was given by the utility. Nevertheless, there is no guarantee these locations are optimal.
Regarding the optimal location and operation of batteries in an ac electrical network, different approaches have been proposed in scientific literature, some of which are described below: the authors in [32] presented a methodology based on genetic algorithms for the optimal location battery energy storage in ac microgrids considering the performance indicator, the net present value of investments, and the costs of the energy losses. Different simulation cases considering sunny, cloudy, and rainy days were included to analyze the interdependence between batteries and distributed generators. In addition, the numerical results reported allowed to identify the best set of renewables and batteries to provide high-quality service to grid users. The authors of [34] proposed a methodology to increase the flexibility of microgrids with renewables that could be affected by the winter season. The authors of this research achieved a mathematical formulation with a mixed-integer programming form that can solve the battery scheduling problem efficiently via the CPLEX solver. Numerical results in a large-scale power system demonstrate the efficiency of the proposed approach for the management of heat demands in power systems, which are drastically affected by seasons through the optimal scheduling of batteries. In [35], an optimal economic dispatch of batteries in ac distribution networks was proposed considering the minimization of the energy purchase in conventional sources. The results were obtained via GAMS implementation by considering renewables as constant inputs and batteries in fixed points. The authors of [36] presented an optimization methodology based on genetic algorithms for the optimal location of batteries in radial distribution feeders. This approach allowed to reduce the daily operation losses of the network. In the case of batteries, the authors of [36] proposed a binary strategy to dispatch them, which can make the implementation of the model in conventional solvers difficult; nevertheless, the results are interesting for utilities since the grid is absent of renewable energy resources, making it the main contributor.
Note that the previous approaches in ac and dc grids demonstrate that the problem of optimal location and reallocation needs more research since this is an important issue in power system analysis. For this purpose, this paper proposes an optimization model for the location-reallocation batteries, focusing on dc networks. This problem has not yet been reported or analyzed for dc networks. The proposed model has a mixed-integer nonlinear programming (MINLP) structure because of binary and nonlinear variables. The binary variables appear due to location and reallocation of batteries while the nonlinear variables are the products between the voltage variables in the power balance constraint. The proposed model analyzes two objective functions, where the first corresponds to the minimization of the energy purchase costs in the spot market by conventional generators and the second to the minimization of the daily energy losses. In addition, it also employs artificial neural networks to forecast the power generated by wind and solar generators to increase the effectiveness of the proposed model. The main contributions of this study are as follows:
- To propose an MINLP model for the location-reallocation batteries in dc networks, which considers two objective functions independently or a linear combination of them. This problem has not been previously proposed in the scientific literature to the best of the knowledge of the authors. In addition, the proposed model allows to understand the compromise between the location of the batteries as a function of the perforce indicator, i.e., objective function, which demonstrates the interdependence of the batteries’ location/operation regarding energy costs and renewable energy availability.
- To include in the proposed MINLP model the economic dispatch problem to maximize the use of the batteries during the day and, thus, obtain a suitable location and reallocation for them.
- Three simulation cases were analyzed for the proposed model to evaluate different objective functions according to the location-reallocation of the batteries. These simulations allow to identify the best trade-offs between the final positioning of the batteries and the daily behavior of the grid, which can help the distribution grid make the best decision as a function of its goals, i.e., technical or economic objectives.
This study is organized as follows: Section 2 presents the mathematical formulation for the optimization model, Section 3 formulates a strategy to solve the proposed optimization model, and Section 4 explains the test systems and proposed scenarios. The computational validation and results are analyzed in Section 5. Lastly, the main conclusions derived from this study and possible future works are presented in Section 6.
2. Mathematical Formulation
The problem of the optimal location-reallocation of batteries in dc microgrids with high penetration of renewable energy resources is a discrete (binary) version of the multi-period economic dispatch models for BESS proposed in [11,18,33]. The model for locating-reallocating batteries is indeed at nonlinear and strong non-convex (also integer) due to the hyperbolic relations between power and voltages in the power-balance equations. Here, we consider two possible objective functions that can be used as indicators to define the best location of the batteries: the first is related to the energy purchase costs in the spot market by the conventional generator and the second to the costs of the daily energy losses in all the branches of the network.
2.1. Objective Functions
It should be noted that the mathematical formulation of the objective functions and originate from convex functions since the energy purchase costs are a linear function, and the daily energy costs are a positive definite quadratic form based on the properties of the conductance matrix [37].
2.2. Set of Constraints
The interpretation of the complete mathematical model described from Equation (1) to (12) is the following: Expression (1) presents the objective function related to the minimization of the energy purchase cost in the spot market by conventional sources; Equation (2) defines the objective function related to the total costs of the energy losses in all the branches of the network; Equation (3) presents the power balance constraint per node associated with the combination of Kirchhoff’s first law and the first Tellegen’s theorem [38]; Expression (4) shows the linear relation between the state-of-charge of the battery and the power injection/absorption [33]; Equations (5) and (6) present the operative consigns for battery operation regarding initial and final state-of-charges, which are defined by the utility. Expressions (7)–(9) are defined as the minimum and maximum power bounds for conventional and distributed generators as well as for batteries, respectively. In Equation (10), the lower and upper bounds admissible for voltage profiles, i.e., voltage regulation limits are presented. Equation (11) shows the minimum and maximum bounds for the states-of-charge in batteries. Expression (12) presents the constraint related to the maximum number of batteries available for location or reallocation in the dc network.
In the mathematical model of Equations (1) and (12) for optimal location-reallocation of batteries, it is important to highlight the following facts:
- This formulation has a mixed-integer nonlinear programming (MINLP) structure due to the presence of binary variables regarding the location-reallocation of batteries as well as products between voltage variables in the power balance constraint, which implies robust optimization methodologies or toolboxes are required to get the optimal solution, even if it is local or global [11].
- The effectiveness of the proposed model highly depends on the weather conditions in renewable generation, since their power injections, i.e., , are conditioned to the generation technology. Here we consider these renewables are based on wind and power technologies and their outputs forecast via artificial neural networks, as recommended in [12,19,33].
- The location or reallocation of the batteries in the dc grid will depend on the performance indicator, i.e., objective functions and , even if they are used independently or as a linear combination.
- Regarding the complexity of the proposed MINLP model, the main difficulty is growing due to the solution space with the number of nodes in relation to the possibilities for locating or reallocating batteries. The size of this part of the solution space can be calculated as follows [39]:where n is the number of nodes and b the number of batteries. In this sense, if we have a dc grid with 50 nodes and batteries from 1 to 5, then the number of possibilities for their location is 50, 1225, 19,600, 230,300, and 2,118,760, respectively, which demonstrate that the problem of optimal location-reallocation of batteries is highly complex. Note that each possible combination of batteries is needed to solve the resulting economic dispatch problem, which is also nonlinear and strong non-convex.
In this paper, the main interest is regarding the formulation of the MINLP formulation presented from Equation (1) to (12) since, for dc grids, after a careful revision has not found evidence of previous formulations, as most of the works are related with economic dispatch analysis considering the fixed location of the batteries, as reported in [11,12,18,33]. For this reason, we have employed the General Algebraic Modeling System (GAMS) for reaching the solution of the proposed model, since it has previously been used in [11] for battery dispatch in dc grids considering voltage-dependent load models. The next section presents the main characteristics of the GAMS software as a solution methodology.
It is important to mention that the optimization model proposed in this research (see Equations (1)–(12)) considers the basic relation between state-of-charge in batteries and the active power injections, as reported in [40]; nevertheless, in the future, for the purpose of analysis, it is highly recommended to make additional improvements regarding batteries, such as life cost analysis, self-discharge phenomena, or efficiency in power electronic converters that interface them [26], to identify other relevant aspects that can affect the short-term economic dispatch analysis in this research.
3. Solution Strategy
To deal with the mathematical model Equations (1)–(12) that describe the optimal location-reallocation of batteries in dc networks as an MINLP model, we select the GAMS optimization package as the solution strategy. This software is selected as it has been largely used in specialized literature to address complex optimization problems with hundreds of variables. Some of the most relevant works where GAMS has been used are the optimal locations of distributed generators in ac and dc networks considering daily load behaviors [19,41], the optimal design of osmotic power plants for electricity generation and desalinization processes [42,43], the optimization of the pump and valve schedules in complex, large-scale water distribution systems [44], the optimal dispatch of batteries in dc and ac networks [11,12,18,35], the multi-objective optimization of the stack of thermoacoustic engines [45], the multi-objective optimization in power systems with renewable sources [46], and economic dispatch approaches in thermal power systems [47], etc.
3.1. Software Implementation
To illustrate an implementation of an optimization model in GAMS, let us consider the simple MINLP model that represents the line selection for a transmission system using the transportation model, as depicted in Figure 1.
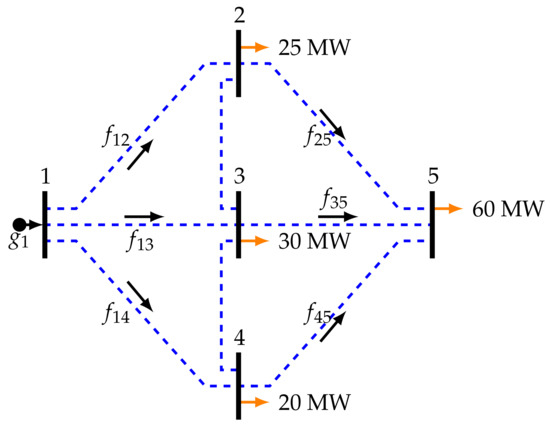
Figure 1.
Small transmission system for the illustrative example.
This problem was proposed as an illustrative example of planning distribution networks in [48]. The formulation of this problem is presented from Equation (13a) to (13g).
where is the power flow through the line that connected nodes i and j; is the total power generation at node i, is the total power consumption at node i; is a binary variable that defines the line between nodes i and j is built; z is the objective function defined as the sum of the square power flows (sensitivity index without physical interpretation). Note that is the maximum power generation at node i, is the maximum power flow through the line that connects nodes i and j, and n is the number of nodes.
It is important to note that the main idea of this optimization problem is to determine the set of lines that need to be built to supply power to all the nodes. An important aspect in this formulation is that it is not unique since [48] has used a set of lines to reach the solution.
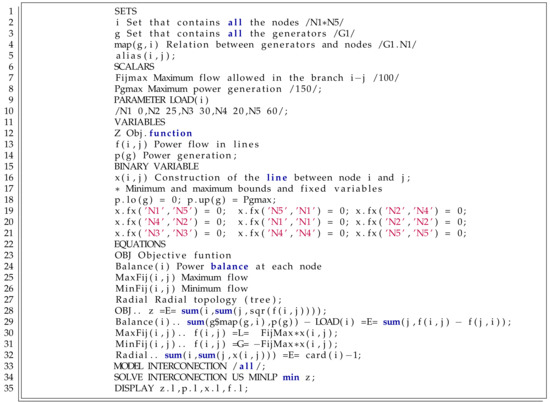
Figure 2.
Example of the implementation of a nonlinear mixed-integer programming (MINLP) model by General Algebraic Modeling System (GAMS).
Some important aspects about GAMS implementation can be extracted from this interface.
- It works with plain text using five main steps: (i) definition of all the sets related to the variables domain; (ii) definition of scalars (constant numbers), parameters (constant vectors), and matrices (constant matrices); (iii) definition of variables and their nature, i.e., continuous, binaries, or integers; (iv) declaration of the names of equations and their mathematical structures; and (v) solution of the model with the appropriate structure, i.e., maximization or minimization.
- This is an ideal toolbox that introduces to mathematicians and engineering students mathematical optimization since it allows to concentrate on the development of well-structured mathematical models to solve physical problems without focusing on the solution techniques.
- The implementation of any mathematical model in GAMS requires only a few concepts on computer programming, which is an advantage in comparison with metaheuristic approaches in MINLP optimization.
Once the optimization is solved by GAMS, we can visualize the solution variables, as depicted in Figure 3.
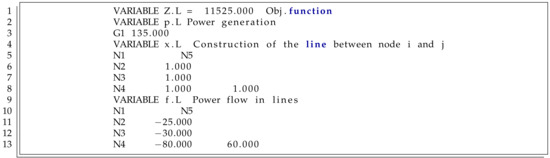
Figure 3.
Solution of the MINLP model by GAMS.
Note that the objective function reaches an optimum value of about 11525 MW, and this system has building lines , , , and with the following power flows: MW, MW, MW, and MW (this is the same solution reported in [48] using the AMPL software). In addition, the remainder of variables is zero, which implies that this is the optimal solution of the model since it fulfills all the constraints in the mathematical model Equations (13a)–(13g) used in this example to present the main characteristics of any mathematical optimization via the GAMS package. For more details about the software, please refer to [46,47].
3.2. Definition of the Renewable Generation Profiles
The forecast of the renewable generation profiles has been carried out by implementing the methodology described in [33]. This methodology works with artificial neural network (ANN) and combined receding horizon control. The receding horizon control works as a moving time horizon that calculates the economic dispatch model in each period using the forecast of the renewable generation profiles estimated by the ANN approach. The implemented methodology has the following steps:
- The ANN predicts the renewable generation profiles in periods n, where n is the prediction horizon.
- Solving the economic dispatch model with GAMS, the reallocation of battery energy storage systems is achieved.
- Employing the previous data of the renewable generation profiles from to t, the forecast of the profiles is recomputed for the period.
For more details of this methodology, see [33].
Table 1 lists the ANN settings for each type of renewable energy source, which has implemented in MATLAB using ntstool. The ANN was configured with 70%, 15%, and 15% of the data for training, adjustment, and validation processes, respectively. Figure 4 illiterates the ANN scheme for the wind power forecasting.

Table 1.
Parameters for wind and solar generation forecasting.
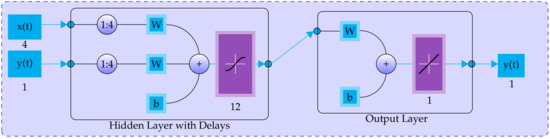
Figure 4.
Artificial neural network (ANN) scheme for wind speed prediction [49].
3.3. Flow Diagram of the Proposed Approach
To summarize the application of the proposed methodology in a dc distribution network for location-reallocation of batteries the flow chart depicted in Figure 5 was implemented.

Figure 5.
Flow chart of the proposed optimization approach for optimal location-reallocation of batteries in dc grids.
4. Test Systems
The validation of the proposed mathematical model for the optimal location-reallocation of batteries in dc distribution networks via GAMS implementation is made inside a 21-node test feeder [18]. All the information about this test feeder is presented below.
The 21-node test system is a radial test feeder composed of 21 nodes and 20 branches in radial connection, where the slack node is located at node 1. The configuration of this dc network is presented in Figure 6.
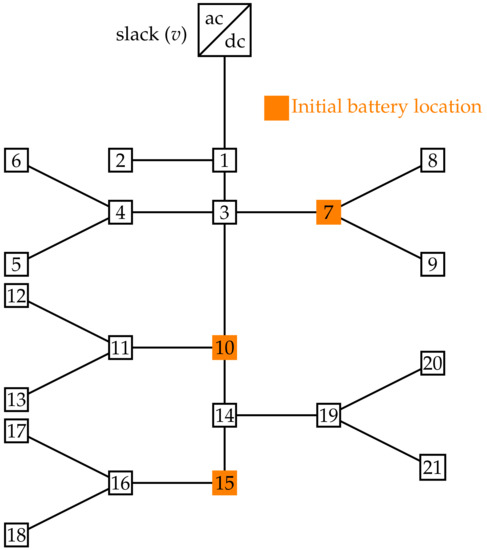
Figure 6.
Electrical configuration for the 21-nodes test system.
The information about loads, energy purchase cost, demand variation, and batteries for this test system is reported in Table 2, Table 3 and Table 4.
Table 2.
Parameters for the 21-node test feeder.
Table 3.
Energy purchasing cost and hourly demand.
Table 4.
Parameters associated with batteries and their initial locations.
In the case of renewable generation, we consider the wind power plant is connected at node 12 with a maximum power capability of about kW, and the photovoltaic source is connected at node 21 with a maximum power capability about kW. Note that these multiply the maximum capacities of the normalized generation curves reported in Table 5.
Table 5.
Normalized power generation curve.
5. Computational Validation
All simulations were carried out on a desktop computer running on INTEL(R) Core(TM) i7-7700, 3.60 GHz, 8 GB RAM with 64-bit Windows 10 Pro using GAMS 25.1.3 with the nonlinear large-scale solver BONMIN licensed by Universidad Tecnológica de Bolívar in Colombia.
5.1. Simulation Conditions and Initial Function Values
To simulate the 21-node test feeder, we considered the following facts:
- The batteries begin and end the day with a total charge of about 50%. During the day, this state-of-charge can vary between 10% and 90%, as recommended for Ion-Lithium batteries in [11].
- Both objective functions are evaluated with the initial position of the batteries reported in the previous section, to identify the base cases and the possible improvements when they are reallocated.
- A linear combination of both objective functions was made to identify the effect of adding energy purchase costs with energy losses costs.
Once the minimization of the energy purchase cost of energy and the minimization of the cost of the daily energy losses were performed, we found the objective function took COP$/day 1,139,524.00 (with ) (see Equation (1)), and the objective function took COP$/day (with ) (see Expression (2)). These values are considered the base cases for each objective function.
5.2. Optimal Reallocation of Batteries
Here, we present the optimal location-reallocation of batteries considering both objective functions. Table 6 reports each objective function and its corresponding BESS’ location.
Table 6.
Optimal location-reallocation of batteries considering different objective functions.
To understand the optimal reallocation of batteries as a function of the performance indicator, let us plot the locations of the batteries in the test feeder, as depicted in Figure 7.
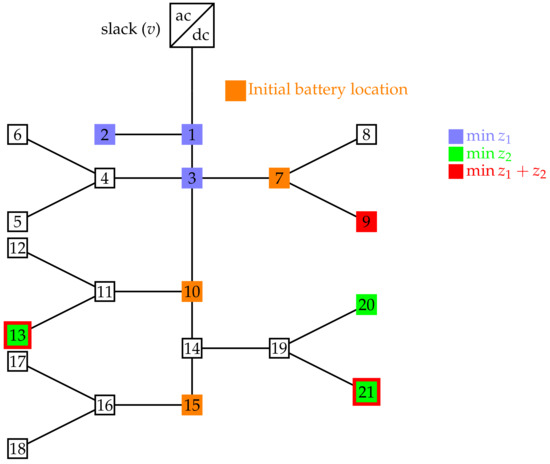
Figure 7.
Reallocation of batteries in the 21-node test feeder.
Based on the location-reallocation of the batteries in Table 6 (see Figure 7), the following facts can be highlighted:
- When the objective of the optimization is to minimize the energy purchase costs at the conventional sources, i.e., , the system reduces the daily operation cost of about passing from COP$/day 1,139,524.00 to COP$/day 1,089,974.00, which implies a reduction per day about COP$/day 49,550. In addition, when we observe the total costs of the daily losses, it passes from COP$/day 131,198.70 to COP$/day 87,426.51; which is traduced in of the energy losses reduction. These results confirm that the optimal reallocation of the batteries from nodes 7, 10, and 15 to nodes 1, 2, and 3 has a positive effect on both the objective functions.
- When the objective of the optimization model is to minimize the daily energy losses, i.e., , this function is reduced from COP$/day 52,957.92 to COP$/day 47,209.95, this corresponds a reduction about . This reduction is achieved by reallocating batteries from nodes 7, 10, and 15 to nodes 13, 20, and 21. In addition, the costs of the energy purchase pass from COP$/day 1,941,395.00 to COP$/day 1,843,467.00, which corresponds to a reduction of about
- When the objective function is the linear combination of and , i.e., , the objective function is COP$/day 1,282,580.07; this implies an increment regarding the base of the case of the energy purchase about COP$/day 11,857.37 per day of operation. In the case of daily energy losses reduction, the linear combination reaches a reduction of COP$/day 711,772.85 per day of operation.
The previous analyses regarding different objective functions allowed us to conclude that the 21-node test feeder is always positive, considering the energy purchase costs as the objective function since it has the most important effect on the daily operation cost for the test feeder. In addition, reducing also allows to reduce the daily energy losses with respect to the base case. On the other hand, when we minimize the daily energy losses, this is reduced. Nevertheless, it also produces a negative effect on the energy purchase cost with an important increment in this objective function. For this reason, here, the minimization of the daily energy loss reduction as an adequate indicator for the optimal operation of batteries in dc networks is discarded.
Regarding the reallocation of the batteries, we observe that when we reduce the energy purchase costs, all the batteries are positioned near the slack node, as these locations allow to charge all the batteries with minimum losses when the daily energy cost is lower to inject this power when this cost increases.
5.3. Complementary Analysis
To understand whether the reallocation of the batteries satisfy the operative conditions imposed on the mathematical model, i.e., begin and end the day with considering possible variations between and , Figure 8 presents the behaviors for both base cases and the three possible locations, reported in Table 6 for the battery type 1.
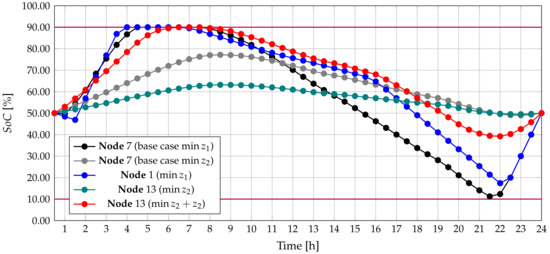
Figure 8.
Behavior of battery type 1 in its different locations.
The behavior of the battery type 1 when it is located at different nodes considering variations in the objective function allows to identify the following important facts:
- When the objective function is minimizing the total energy purchase cost, i.e., , this battery charges at its maximum admissible value (see periods comprehended between 0.5 h to 6). In addition, when energy cost is expensive, this battery begins to discharge continuously during fourteen hours (see periods comprehended between 8 h to 22). Finally, this battery recovers this charge in the final part of the time.
- Regarding the minimization of energy losses, i.e., , we observe that the batteries charge between 50% and 80% during the day. This behavior is explained by the fact that the battery works as a generator or load; it is modifying the power flowing through the lines, which implies that it is also affecting the power losses. For this reason, it has small changes in its state-of-charge to help and minimize the total power losses during the day of operation.
- In the case of combining both objective functions linearly, battery type 1 experiences both behaviors, as previously reported, at the same time, i.e., soft state-of-charge variations overpass values lower than at the end of the day.
Note that the main message of the battery behavior is regarding the different possibilities of having state-of-charges behavior as a function of the performance indicator (i.e., objective function) as well as the possible location of it. Nevertheless, in all the simulation cases, the proposed optimization model (Equations (1)–(12)) is feasible and allows to determine the best operation practice for batteries depending on the operative consigns imposed by the utility, which becomes the proposed optimization model the main contribution of this research.
Figure 9 reports the power generation in the slack node for the base cases as well as for the different battery locations. From this plot, we can observe that:
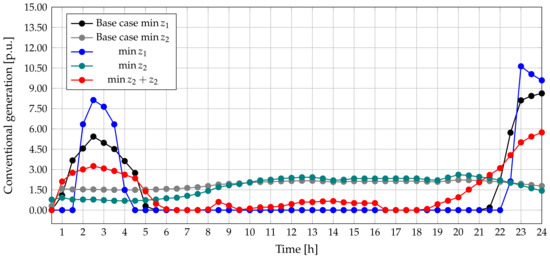
Figure 9.
Behavior of the conventional generation (e.g., slack node) for all the cases studied.
- When the objective function is minimizing , the conventional generator is used to charge all the batteries to reach their maximum admissible values at the beginning of the day. This conventional generator is also used to recover the final state of the charge imposed, i.e., 50% at the end of the day. In the rest of the periods, the energy provided by the conventional generator is zero, which minimizes the total purchase costs in the spot market and also allows to maximize the use of renewable sources.
- In the case of minimization of , we can see that the conventional source generates during all the periods since this generation allows redistributing line power flows, which helps minimize the total cost of the energy losses.
- Regarding the linear combination of the objective functions, it is possible to observe that at the beginning and the end of the day, the conventional generator is used for charging all the batteries while in the intermediate times, it is used for redistributing power flows; in other words, the behavior of the conventional generator is a linear combination of both analyses mentioned above.
- The behavior of the conventional generators shows that in relation to the energy purchase cost minimization, its generation appears mainly in periods of time where solar energy is absent, which can be considered as an indicator for the utility to introduce additional renewable energy resources (i.e., small-hydro power [50]) to complement solar and wind sources in order to reduce to zero the conventional generation in normal operating conditions. This also can help to indirectly reduce greenhouse emissions in isolated grids power supply by diesel or in predominantly thermal interconnected systems.
In conclusion, it is important to keep in mind that the behavior of all the variables in the proposed mathematical MINLP model highly depends on the objective function selected since it guides them to minimize or maximize the benefit established by the electricity company. In addition, all the solutions reported in this research can be taken as indicators of the grid performance; nevertheless, these are not taken as absolute results, since they also depend on the renewable generation availability, grid operative conditions, and demand behavior.
Regarding the computational effort of the proposed approach for optimal locating-reallocating batteries in dc grids, it is important to highlight that the GAMS and its SCIP solver takes about 10 min to define the optimal position of the batteries, which can be considered as a pretty small time considering the complexity of the problem (3 batteries in 21-nodes generates 1330 possible locations). In addition, if the batteries are considered in fixed locations, then, the optimization problem is transformed from an MINLP into a nonlinear programming one, reducing the processing times to 2 s for knowing the economic dispatch output, which allows access to the utilities having multiple scenarios of simulation before defining the final day-ahead economic dispatch.
5.4. Scalability of the Proposed Model
To demonstrate the scalability of the proposed approach, we present an additional simulation case regarding batteries’ location and reallocation in dc grids by using the 30-node test feeder reported in [11]. In this test system, there are three batteries in nodes 3, 15, and 22. In addition, the objective function reported in that paper corresponds to the daily energy losses cost, which takes a value of COP$/day 254,539.39. Once we apply our proposed reallocation approach, this cost moves to COP$/day 244,595.39 by reallocating these batteries to nodes 18, 23, and 24, respectively, which implies a daily reduction of about regarding power loss minimization, demonstrating that the proposed optimization approach is applicable to dc grids with a different number of nodes, i.e., it is scalable.
It is important to point out that the computational cost of the proposed approach for this test feeder is 14 and takes minutes to decide where the batteries must be reallocated; nevertheless, when the batteries are fixed, this time is reduced to 3 s, which implies that this methodology is perfectly for day-ahead analysis for dc grids with batteries, since it allows to create multiple simulation scenarios in less time.
6. Conclusions and Future Works
The problem of the optimal location-reallocation of batteries in dc distribution networks has been analyzed in this paper through an MINLP formulation. This mathematical model has binary variables associated with the position of the batteries that are modified as a function of the performance indicator, i.e., minimization of the energy purchase costs in the conventional generators or minimization of the total costs of the daily energy losses. Numerical results confirm that in all the analyzed scenarios, the re-positioning of batteries allows to achieve better objective function values by modifying the daily state-of-charge performances on them. In addition, the behavior of the conventional power generator is highly conditioned by the performance indicator since this variable defines the total energy purchase costs in the spot market and also has an influence over the power flow redistribution in lines regarding power loss minimization. This means that this variable is highly sensitive to the proposed MINLP model.
For future works, we state the following: (i) to propose a mixed-integer convex optimization model to deal with the non-linearities of the power balance equations to guarantee the uniqueness of the global optimum solution via branch and bound methods added with a second-order cone or semi-definite programming methods, (ii) to employ heuristic methods to avoid the usage of specialized software in the solution of the MINLP model to develop free applications for engineering students and small electricity companies, (iii) to extend the proposed MINLP formulation to alternating current networks considering active and reactive power capabilities in batteries via optimal control of power electronic converters that interface them, (iv) to consider different battery’s aspects in the model such as lifecycle, self-discharge phenomenon, or power losses analysis to have more realistic models that can affect the grid behavior in the short-term horizon, and (v) to propose a hybrid optimization problem based on the convex optimization for the nonlinear optimization part of the MINLP model (economic dispatch problem) and metaheuristics that can help address the integer part (location of batteries and renewables) by conforming a master-slave optimization methodology.
Author Contributions
Conceptualization, O.D.M. and W.G.-G.; Methodology, O.D.M. and W.G.-G.; Investigation, O.D.M. and W.G.-G.; Writing—review and editing, O.D.M., W.G.-G., and E.R.-T. All authors have read and agreed to the published version of the manuscript.
Funding
This work was partially supported by the Universidad Tecnológica de Bolívar under grant CP2019P011 associated with the project: “Operación eficiente de redes eléctricas con alta penetración de recursos energéticos distribuidos considerando variaciones en el recurso energético primario”.
Conflicts of Interest
The authors declare no conflicts of interest.
Abbreviations
The following abbreviations and nomenclature are used in this manuscript:
| Acronyms | |
| AC | Alternating current. |
| COP | Colombian pesos. |
| ANN | Artificial neural network. |
| BESS | Battery energy storage system. |
| DC | Direct current. |
| GAMS | General algebraic modeling system. |
| MINLP | Mixed-integer nonlinear programming. |
| MCOP | Millions of Colombian pesos. |
| PV | Photovoltaic. |
| WT | Wind turbine. |
| Sets and subscripts | |
| Set of batteries. | |
| Set of nodes. | |
| Set of periods of time. | |
| b | Type of batteries. |
| t | Periods of time. |
| Nodes. | |
| Parameters | |
| Energy purchase cost in the conventional source in the node i at the period of time t. | |
| Conductance value that relates nodes i and j. | |
| Maximum number of batteries available. | |
| Maximum power generation in the conventional source in the i at the period of time t. | |
| Minimum power generation in the conventional source in the i at the period of time t. | |
| Minimum power in the battery b connected at i at the period of time t. | |
| Maximum power in the battery b connected at i at the period of time t. | |
| Minimum power generation in the distributed generator in the i at the period of time t. | |
| Maximum power generation in the distributed generator in the i at the period of time t. | |
| Power consumption in the i at the period of time t. | |
| Final state of charge in the battery b connected to the node i. | |
| Initial state of charge in the battery b connected to the node i. | |
| Maximum voltage bound at node i. | |
| Minimum voltage bound at node i. | |
| Charge coefficient of the battery b connected at node i. | |
| Length of the period of time. | |
| Variables | |
| Power generation in the conventional source at node i in the period of time t. | |
| Power input/output in battery b connected at node i in the period of time t. | |
| Renewable power generation at node i in the period of time t. | |
| State of charge in battery b connected at node i in the period of time t. | |
| State of charge in battery b connected at node i in the period of time . | |
| Voltage profile in the node i at the period of time t. | |
| Binary decision variable regarding the installation of the battery b at node i. | |
| z | Objective function. |
| Objective function related to the energy purchase costs in conventional sources. | |
| Objective function related to the cost of the daily energy losses. | |
References
- Council, G.W.E. Global Status of Wind Power. 2018. Available online: http://gwec.net/global-figures/windenergy-global-status (accessed on 20 March 2020).
- Strunz, K.; Abbasi, E.; Huu, D.N. DC microgrid for wind and solar power integration. IEEE Trans. Emerg. Sel. Top. Power Electron. 2013, 2, 115–126. [Google Scholar] [CrossRef]
- United Nations Framework Convention on Climate Change (UNFCCC). Adoption of the Paris Agreement; I: Proposal by the President (Draft Decision); United Nations Office: Geneva, Switzerland, 2015. [Google Scholar]
- Mahabir, R.; Shrestha, R.M. Climate change and forest management: Adaptation of geospatial technologies. In Proceedings of the 2015 Fourth International Conference on Agro-Geoinformatics (Agro-geoinformatics), Istanbul, Turkey, 20–24 July 2015; pp. 209–214. [Google Scholar]
- Ray, S. Construction Cost Data for Electric Generators Installed in 2013; US Energy Information Administration (EIA): Washington, DC, USA, 2016. Available online: http://www.eia.gov/electricity/generatorcosts (accessed on 22 March 2020).
- De Carvalho, W.C.; Bataglioli, R.P.; Fernandes, R.A.; Coury, D.V. Fuzzy-based approach for power smoothing of a full-converter wind turbine generator using a supercapacitor energy storage. Electr. Power Syst. Res. 2020, 184, 106287. [Google Scholar] [CrossRef]
- Elbouchikhi, E.; Amirat, Y.; Feld, G.; Benbouzid, M.; Zhou, Z. A Lab-scale Flywheel Energy Storage System: Control Strategy and Domestic Applications. Energies 2020, 13, 653. [Google Scholar] [CrossRef]
- Gil, W.; Montoya, O.D.; Garces, A. Direct power control of electrical energy storage systems: A passivity-based PI approach. Electr. Power Syst. Res. 2019, 175, 105885. [Google Scholar]
- Zhao, P.; Xu, W.; Zhang, S.; Wang, J.; Dai, Y. Technical feasibility assessment of a standalone photovoltaic/wind/adiabatic compressed air energy storage based hybrid energy supply system for rural mobile base station. Energy Convers. Manag. 2020, 206, 112486. [Google Scholar] [CrossRef]
- Javed, M.S.; Zhong, D.; Ma, T.; Song, A.; Ahmed, S. Hybrid pumped hydro and battery storage for renewable energy based power supply system. Appl. Energy 2020, 257, 114026. [Google Scholar] [CrossRef]
- Montoya, O.D.; Gil-González, W.; Grisales-Noreña, L.; Orozco-Henao, C.; Serra, F. Economic Dispatch of BESS and Renewable Generators in DC Microgrids Using Voltage-Dependent Load Models. Energies 2019, 12, 4494. [Google Scholar] [CrossRef]
- Gil-González, W.; Montoya, O.D.; Garces, A. Control of a SMES for mitigating subsynchronous oscillations in power systems: A PBC-PI approach. J. Energy Storage 2018, 20, 163–172. [Google Scholar] [CrossRef]
- Essallah, S.; Khedher, A.; Bouallegue, A. Integration of distributed generation in electrical grid: Optimal placement and sizing under different load conditions. Comput. Electr. Eng. 2019, 79, 106461. [Google Scholar] [CrossRef]
- Montoya, O.D.; Gil-González, W.; Garrido, V. Voltage Stability Margin in DC Grids with CPLs: A Recursive Newton–Raphson Approximation. IEEE Trans. Circuits Syst. II Express Briefs 2020, 67, 300–304. [Google Scholar] [CrossRef]
- Garces, A. Uniqueness of the power flow solutions in low voltage direct current grids. Electr. Power Syst. Res. 2017, 151, 149–153. [Google Scholar] [CrossRef]
- Lotfi, H.; Khodaei, A. AC versus DC microgrid planning. IEEE Trans. Smart Grid 2015, 8, 296–304. [Google Scholar] [CrossRef]
- Nojavan, S.; Pashaei-Didani, H.; Mohammadi, A.; Ahmadi-Nezamabad, H. Energy management concept of AC, DC, and hybrid AC/DC microgrids. In Risk-Based Energy Management; Elsevier: Amsterdam, The Netherlands, 2020; pp. 1–10. [Google Scholar]
- Gil-González, W.; Montoya, O.D.; Grisales-Noreña, L.F.; Cruz-Peragón, F.; Alcalá, G. Economic Dispatch of Renewable Generators and BESS in DC Microgrids Using Second-Order Cone Optimization. Energies 2020, 13, 1703. [Google Scholar] [CrossRef]
- Montoya, O.D.; Grisales-Noreña, L.F.; Gil-González, W.; Alcalá, G.; Hernandez-Escobedo, Q. Optimal Location and Sizing of PV Sources in DC Networks for Minimizing Greenhouse Emissions in Diesel Generators. Symmetry 2020, 12, 322. [Google Scholar] [CrossRef]
- Hu, J.; Shan, Y.; Xu, Y.; Guerrero, J.M. A coordinated control of hybrid ac/dc microgrids with PV-wind-battery under variable generation and load conditions. Int. J. Elec. Power 2019, 104, 583–592. [Google Scholar] [CrossRef]
- Kazmi, S.A.A.; Shahzad, M.K.; Khan, A.Z.; Shin, D.R. Smart Distribution Networks: A Review of Modern Distribution Concepts from a Planning Perspective. Energies 2017, 10, 501. [Google Scholar] [CrossRef]
- Siano, P.; Rigatos, G.; Piccolo, A. Active Distribution Networks and Smart Grids: Optimal Allocation of Wind Turbines by Using Hybrid GA and Multi-Period OPF. In Atlantis Computational Intelligence Systems; Atlantis Press: Paris, France, 2012; pp. 579–599. [Google Scholar] [CrossRef]
- Becker, D.J.; Sonnenberg, B.J. DC microgrids in buildings and data centers. In Proceedings of the 2011 IEEE 33rd International Telecommunications Energy Conference (INTELEC), Amsterdam, The Netherlands, 9–13 October 2011; pp. 1–7. [Google Scholar]
- Noritake, M.; Yuasa, K.; Takeda, T.; Hoshi, H.; Hirose, K. Demonstrative research on DC microgrids for office buildings. In Proceedings of the 2014 IEEE 36th International Telecommunications Energy Conference (INTELEC), Vancouver, BC, Canada, 28 September–2 October 2014; pp. 1–5. [Google Scholar]
- Mackay, L.; van der Blij, N.H.; Ramirez-Elizondo, L.; Bauer, P. Toward the Universal DC Distribution System. Electr. Power Compon. Syst. 2017, 45, 1032–1042. [Google Scholar] [CrossRef]
- Jing, W.; Lai, C.H.; Wong, S.H.W.; Wong, M.L.D. Battery-supercapacitor hybrid energy storage system in standalone DC microgrids: A review. IET Renew. Power Gener. 2017, 11, 461–469. [Google Scholar] [CrossRef]
- Weaver, W.W.; Robinett, R.D.; Parker, G.G.; Wilson, D.G. Energy storage requirements of dc microgrids with high penetration renewables under droop control. Int. J. Electr. Power Energy Syst. 2015, 68, 203–209. [Google Scholar] [CrossRef]
- Li, Y.; Meng, K.; Dong, Z.Y.; Zhang, W. Sliding Framework for Inverter-Based Microgrid Control. IEEE Trans. Power Syst. 2020, 35, 1657–1660. [Google Scholar] [CrossRef]
- Azimi, S.M.; Hamzeh, M. Adaptive Interconnection and Damping Assignment Passivity-Based Control of Interlinking Converter in Hybrid AC/DC Grids. IEEE Syst. J. 2020. [Google Scholar] [CrossRef]
- Guo, Z.; Li, S.; Zheng, Y. Feedback linearization based distributed model predictive control for secondary control of islanded microgrid. Asian J. Control 2020. [Google Scholar] [CrossRef]
- Garcés, A. Convex Optimization for the Optimal Power Flow on DC Distribution Systems. In Handbook of Optimization in Electric Power Distribution Systems; Springer: Cham, Switzerland, 2020; pp. 121–137. [Google Scholar]
- Chen, C.; Duan, S.; Cai, T.; Liu, B.; Hu, G. Optimal Allocation and Economic Analysis of Energy Storage System in Microgrids. IEEE Trans. Power Electron. 2011, 26, 2762–2773. [Google Scholar] [CrossRef]
- Gil-González, W.; Montoya, O.D.; Holguín, E.; Garces, A.; Grisales-Noreña, L.F. Economic dispatch of energy storage systems in dc microgrids employing a semidefinite programming model. J. Energy Storage 2019, 21, 1–8. [Google Scholar] [CrossRef]
- Li, Y.; Wang, C.; Li, G.; Wang, J.; Zhao, D.; Chen, C. Improving operational flexibility of integrated energy system with uncertain renewable generations considering thermal inertia of buildings. Energy Convers. Manag. 2020, 207, 112526. [Google Scholar] [CrossRef]
- Montoya, O.D.; Grajales, A.; Garces, A.; Castro, C.A. Distribution Systems Operation Considering Energy Storage Devices and Distributed Generation. IEEE Latin Am. Trans. 2017, 15, 890–900. [Google Scholar] [CrossRef]
- Grisales-Noreña, L.; Montoya, O.D.; Gil-González, W. Integration of energy storage systems in AC distribution networks: Optimal location, selecting, and operation approach based on genetic algorithms. J. Energy Storage 2019, 25, 100891. [Google Scholar] [CrossRef]
- Garcés, A.; Montoya, O.D. A Potential Function for the Power Flow in DC Microgrids: An Analysis of the Uniqueness and Existence of the Solution and Convergence of the Algorithms. J. Control. Autom. Electr. Syst. 2019, 30, 794–801. [Google Scholar] [CrossRef]
- Zia, M.F.; Elbouchikhi, E.; Benbouzid, M.; Guerrero, J.M. Energy management system for an islanded microgrid with convex relaxation. IEEE Trans. Ind. Appl. 2019, 55, 7175–7185. [Google Scholar] [CrossRef]
- Montoya, O.D.; Gil-González, W.; Grisales-Noreña, L. Relaxed convex model for optimal location and sizing of DGs in DC grids using sequential quadratic programming and random hyperplane approaches. Int. J. Electr. Power Energy Syst. 2020, 115, 105442. [Google Scholar] [CrossRef]
- Luna, A.C.; Diaz, N.L.; Andrade, F.; Graells, M.; Guerrero, J.M.; Vasquez, J.C. Economic power dispatch of distributed generators in a grid-connected microgrid. In Proceedings of the 2015 9th International Conference on Power Electronics and ECCE Asia (ICPE-ECCE Asia), Seoul, Korea, 1–5 June 2015; pp. 1161–1168. [Google Scholar]
- Montoya, O.D.; Gil-González, W.; Grisales-Noreña, L. An exact MINLP model for optimal location and sizing of DGs in distribution networks: A general algebraic modeling system approach. Ain Shams Eng. J. 2019. [Google Scholar] [CrossRef]
- Naghiloo, A.; Abbaspour, M.; Mohammadi-Ivatloo, B.; Bakhtari, K. GAMS based approach for optimal design and sizing of a pressure retarded osmosis power plant in Bahmanshir river of Iran. Renew. Sustain. Energy Rev. 2015, 52, 1559–1565. [Google Scholar] [CrossRef]
- Du, Y.; Liang, X.; Liu, Y.; Xie, L.; Zhang, S. Exergo-economic analysis and multi-objective optimization of seawater reverse osmosis desalination networks. Desalination 2019, 466, 1–15. [Google Scholar] [CrossRef]
- Skworcow, P.; Paluszczyszyn, D.; Ulanicki, B.; Rudek, R.; Belrain, T. Optimisation of Pump and Valve Schedules in Complex Large-scale Water Distribution Systems Using GAMS Modelling Language. Procedia Eng. 2014, 70, 1566–1574. [Google Scholar] [CrossRef]
- Tartibu, L.; Sun, B.; Kaunda, M. Multi-objective optimization of the stack of a thermoacoustic engine using GAMS. Appl. Soft Comput. 2015, 28, 30–43. [Google Scholar] [CrossRef]
- Soroudi, A. Power System Optimization Modeling in GAMS, 1st ed.; Springer International Publishing: Cham, Switzerland, 2017. [Google Scholar] [CrossRef]
- Montoya, O.D. Solving a Classical Optimization Problem Using GAMS Optimizer Package: Economic Dispatch Problem Implementation. Ingeniería y Ciencia 2017, 13, 39–63. [Google Scholar] [CrossRef]
- Lavorato, M.; Franco, J.F.; Rider, M.J.; Romero, R. Imposing Radiality Constraints in Distribution System Optimization Problems. IEEE Trans. Power Syst. 2012, 27, 172–180. [Google Scholar] [CrossRef]
- Gil-González, W.; Montoya, O.D.; Grisales-Noreña, L.F.; Perea-Moreno, A.J.; Hernandez-Escobedo, Q. Optimal Placement and Sizing of Wind Generators in AC Grids Considering Reactive Power Capability and Wind Speed Curves. Sustainability 2020, 12, 2983. [Google Scholar] [CrossRef]
- Gil-González, W.; Montoya, O.D.; Garces, A. Modeling and control of a small hydro-power plant for a DC microgrid. Electr. Power Syst. Res. 2020, 180, 106104. [Google Scholar] [CrossRef]
© 2020 by the authors. Licensee MDPI, Basel, Switzerland. This article is an open access article distributed under the terms and conditions of the Creative Commons Attribution (CC BY) license (http://creativecommons.org/licenses/by/4.0/).