A Comparative Techno-Economic Analysis of Different Desalination Technologies in Off-Grid Islands †


Abstract
:
1. Introduction
2. Materials and Methods
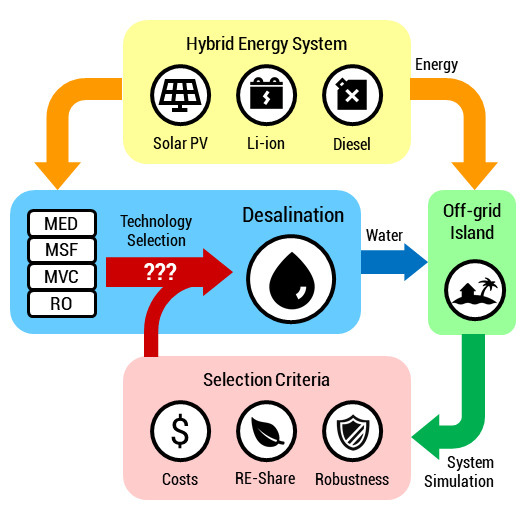
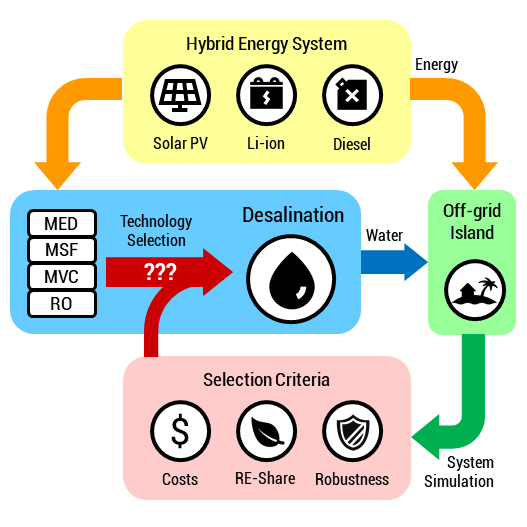
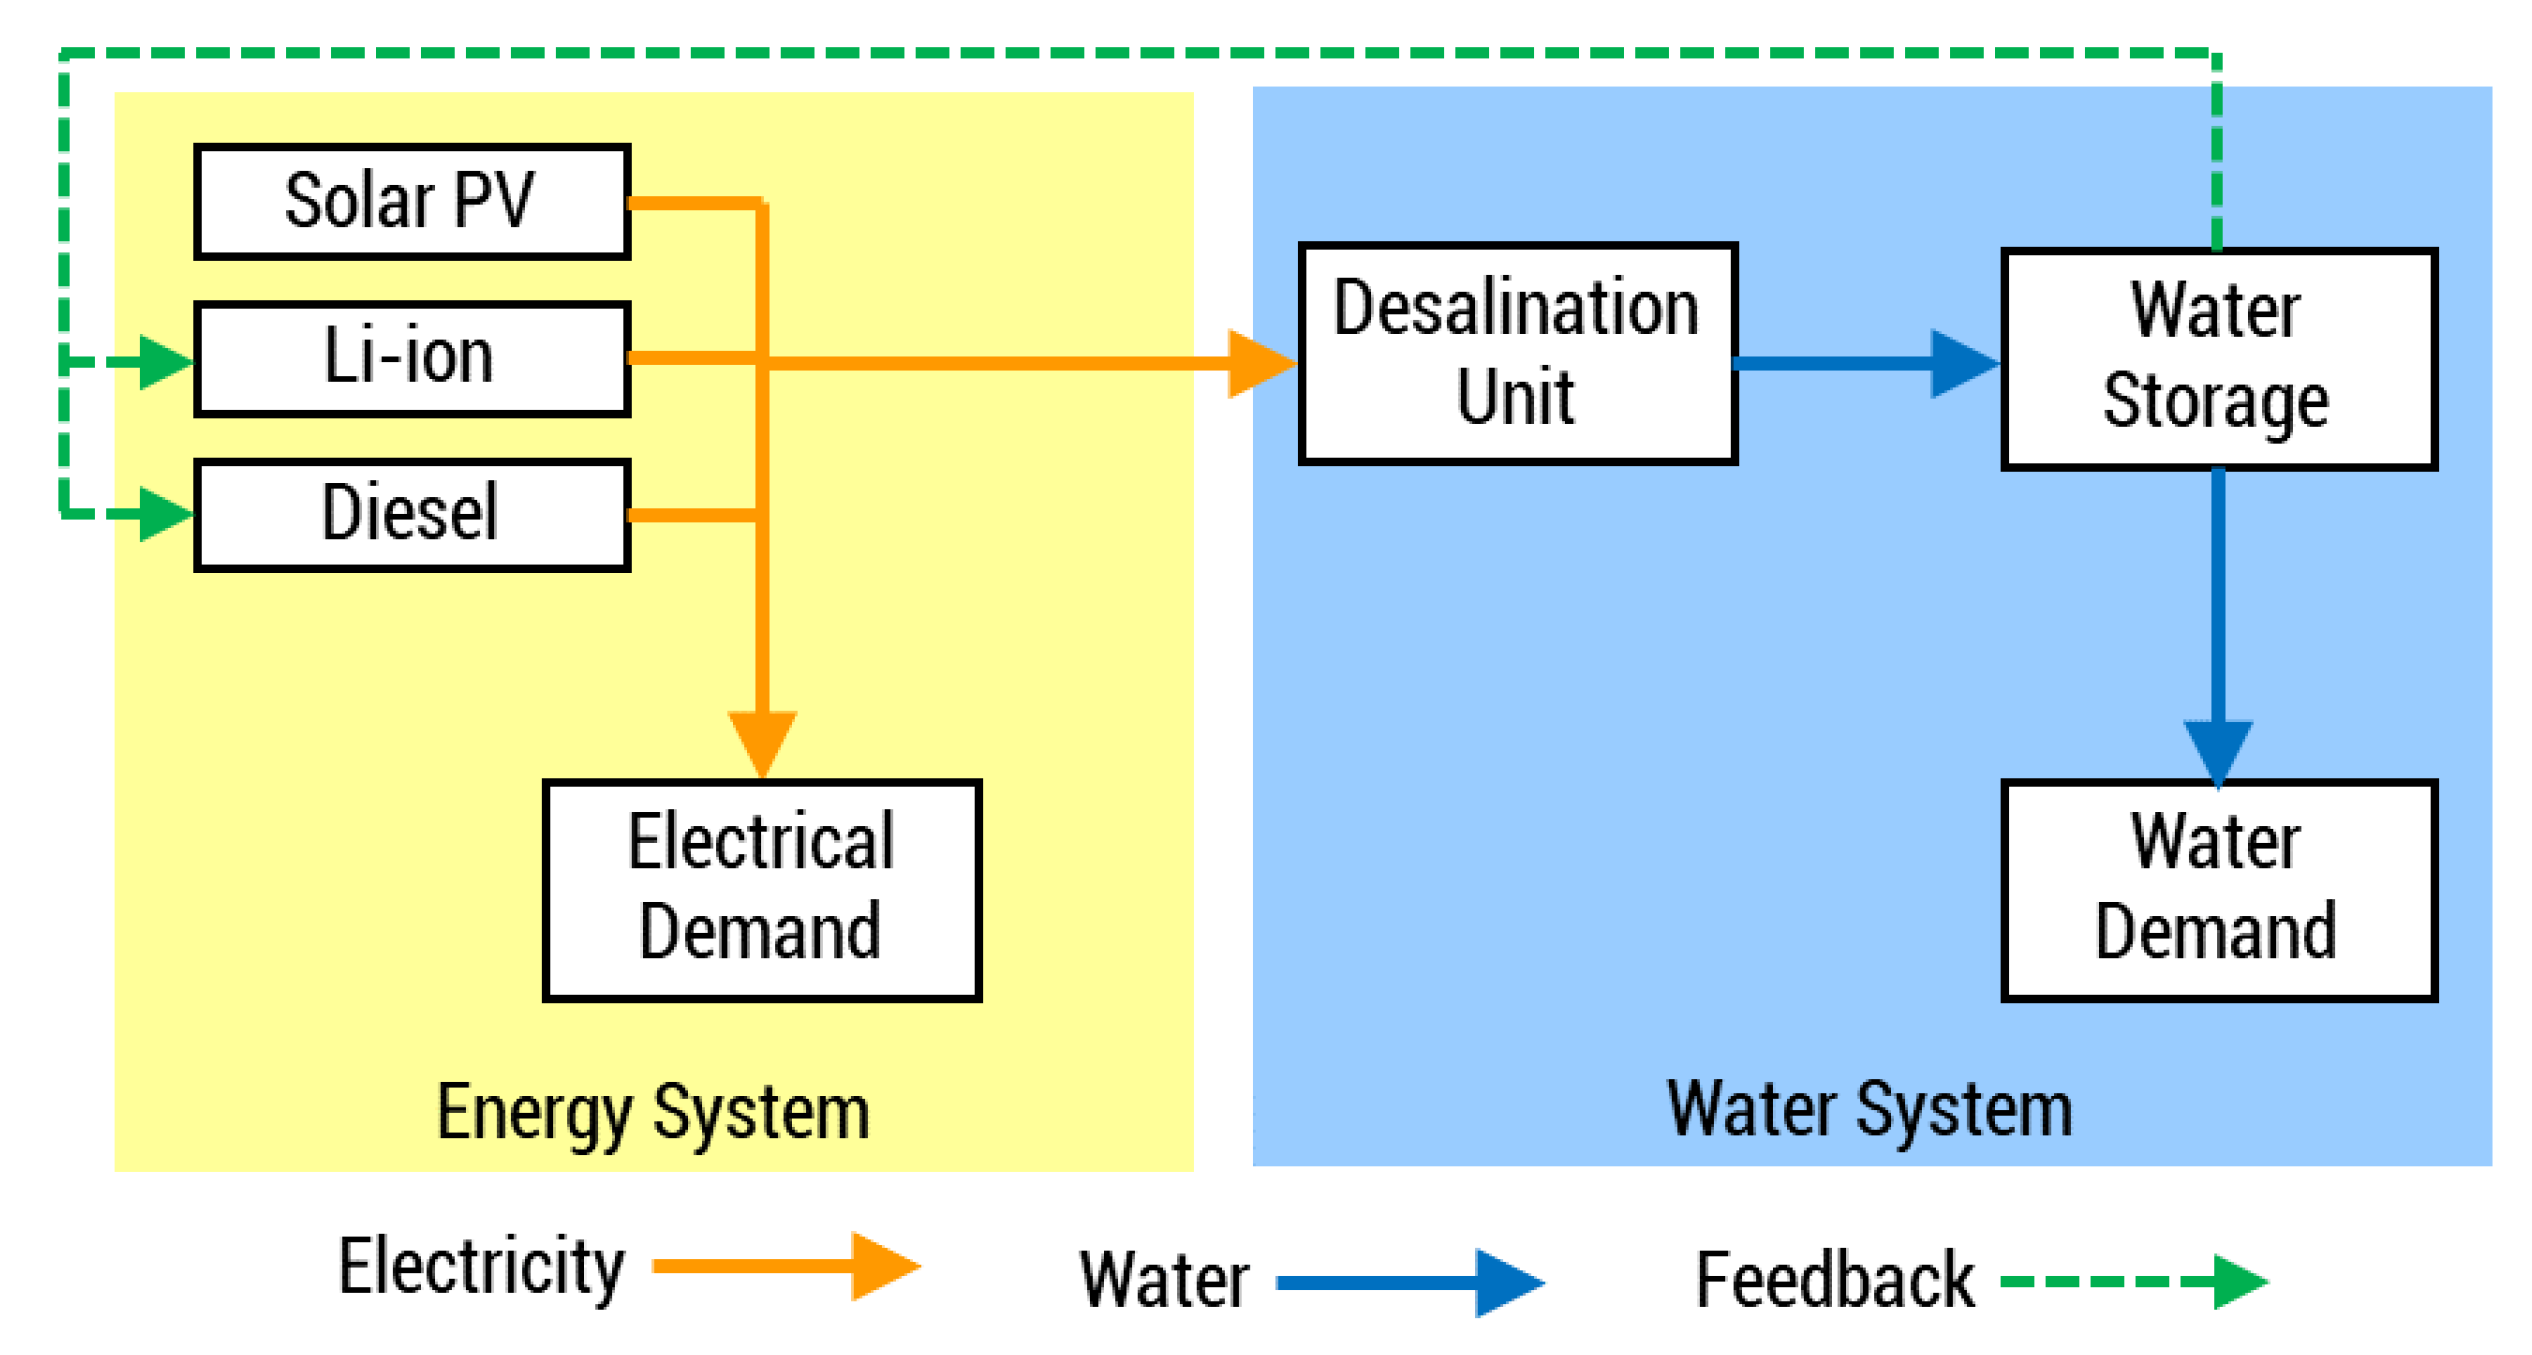
2.1. System Architecture
2.2. Modelling Approach
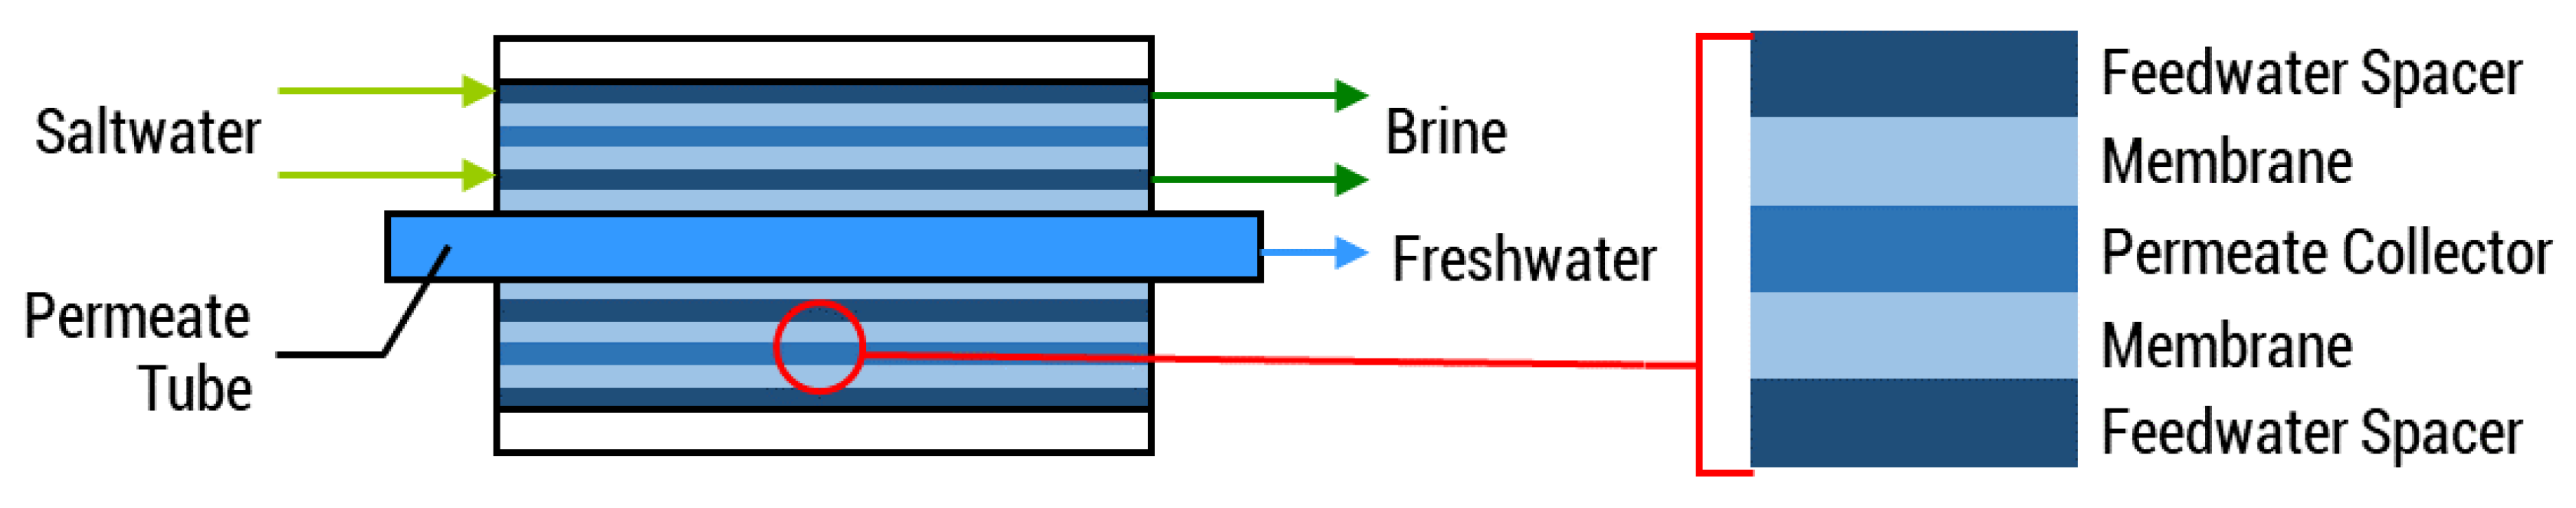
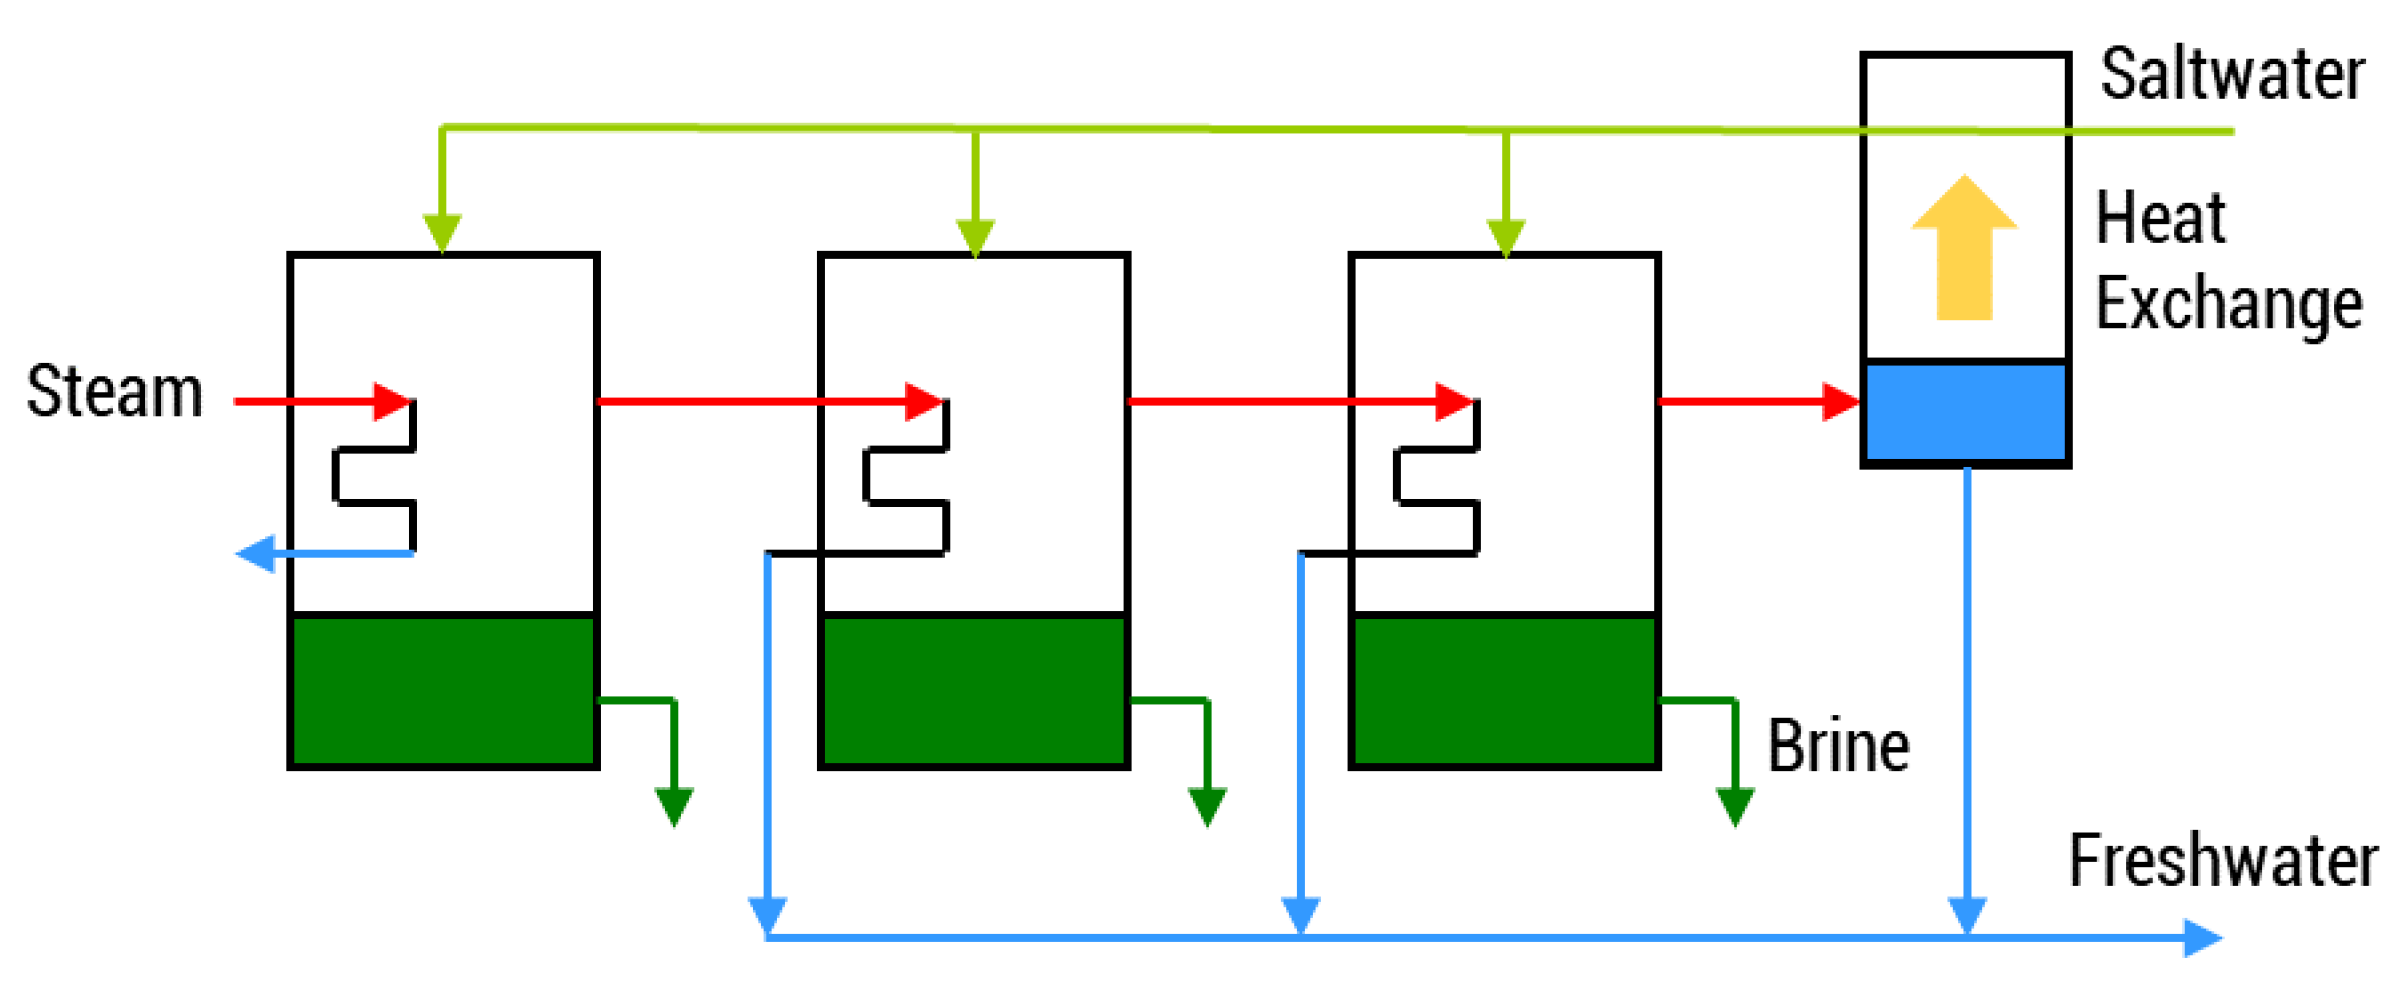
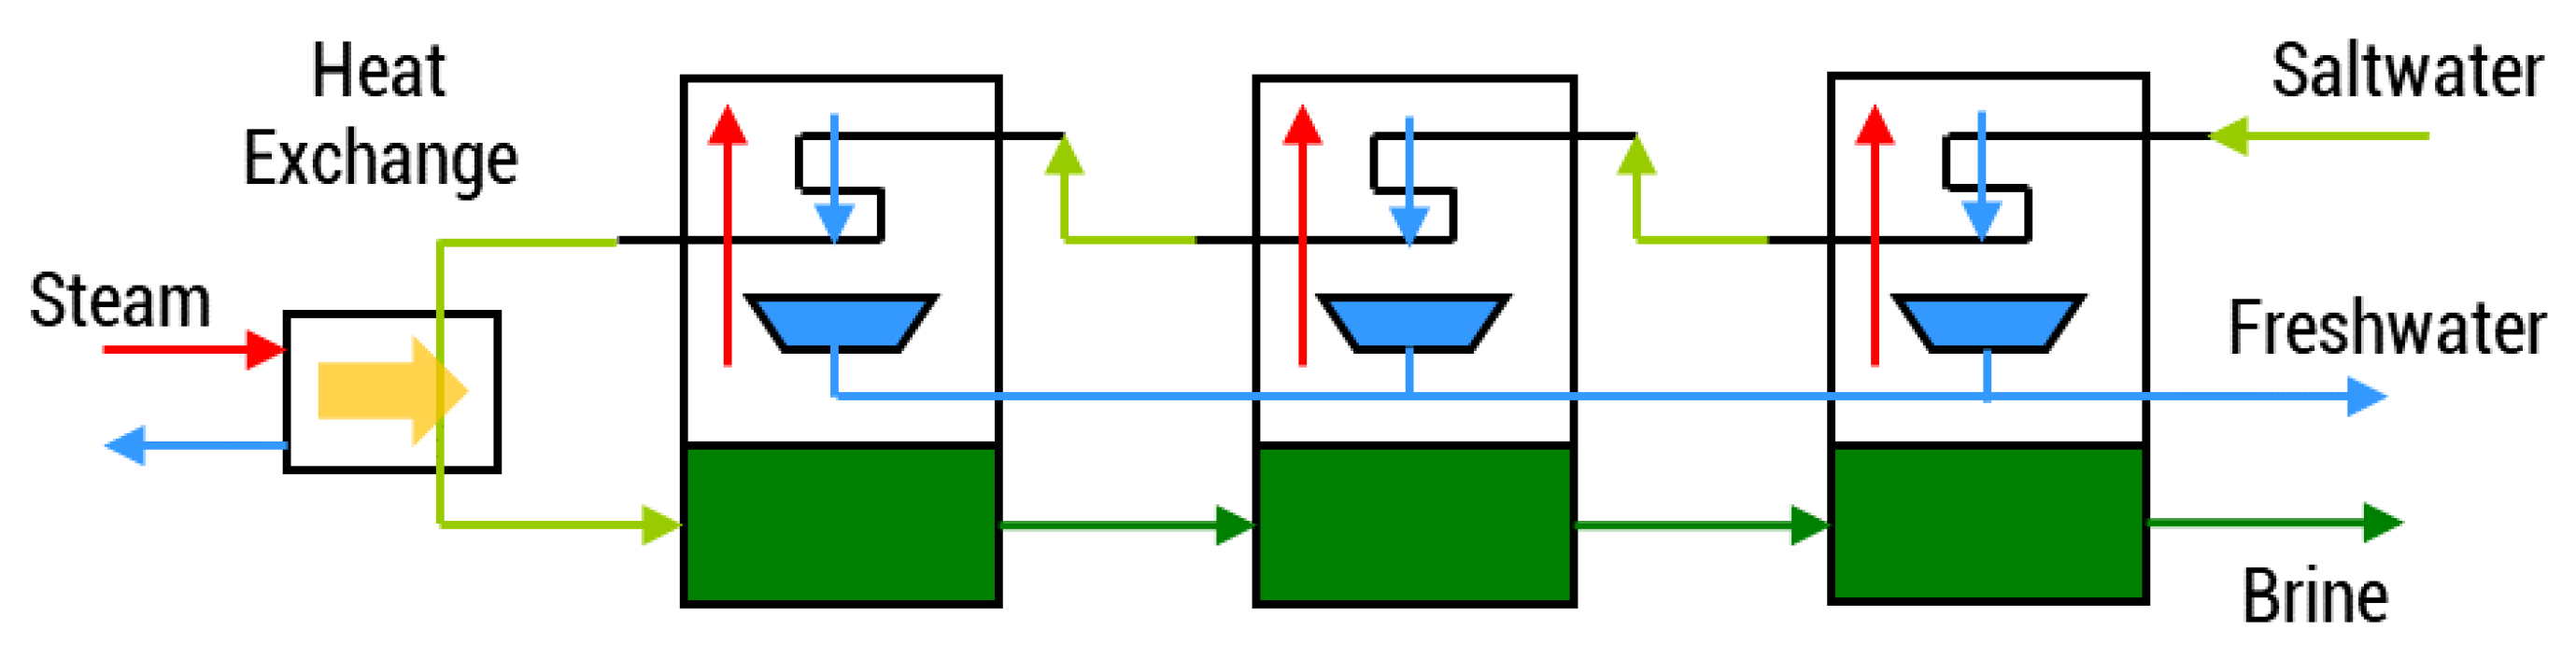
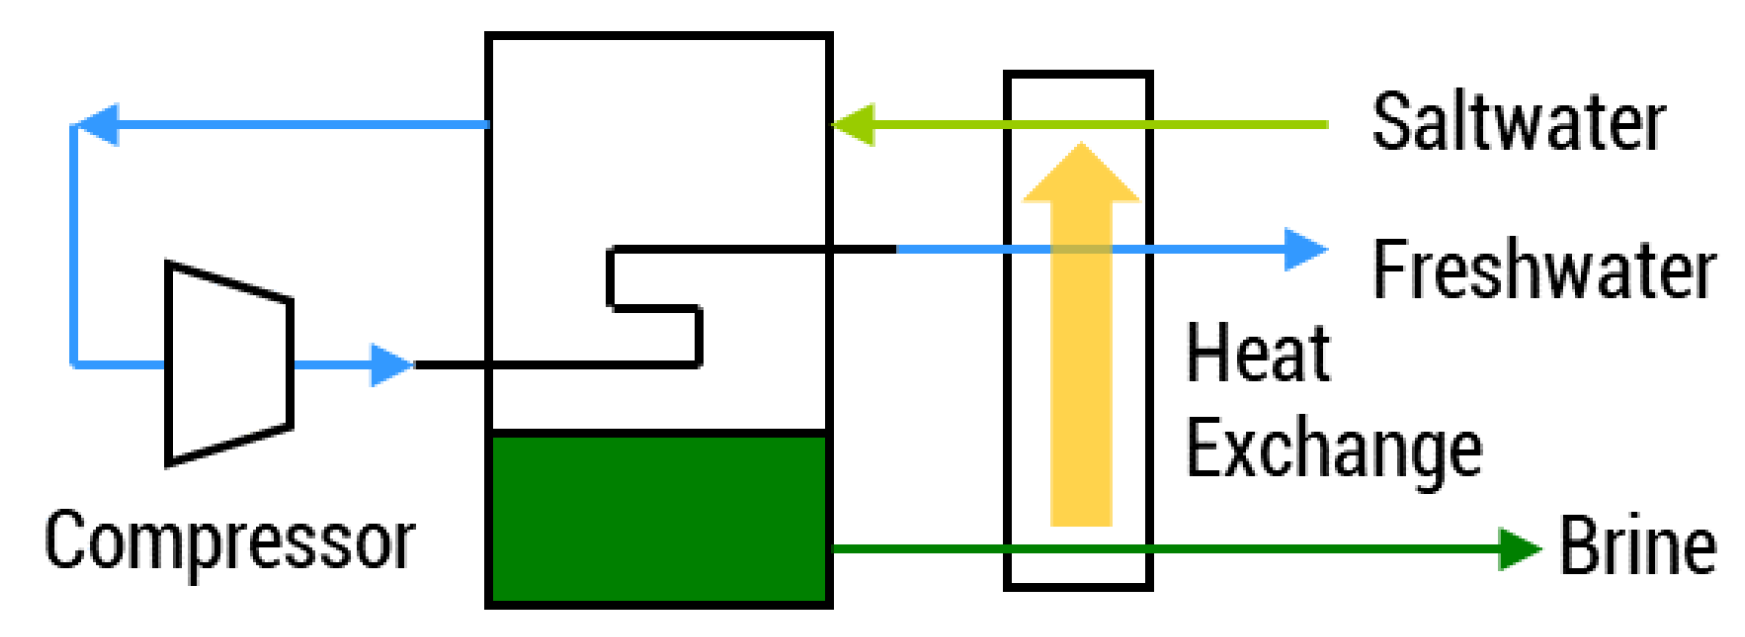
2.3. Desalination Model
2.4. Techno-Economic Assumptions
2.5. Future Costs
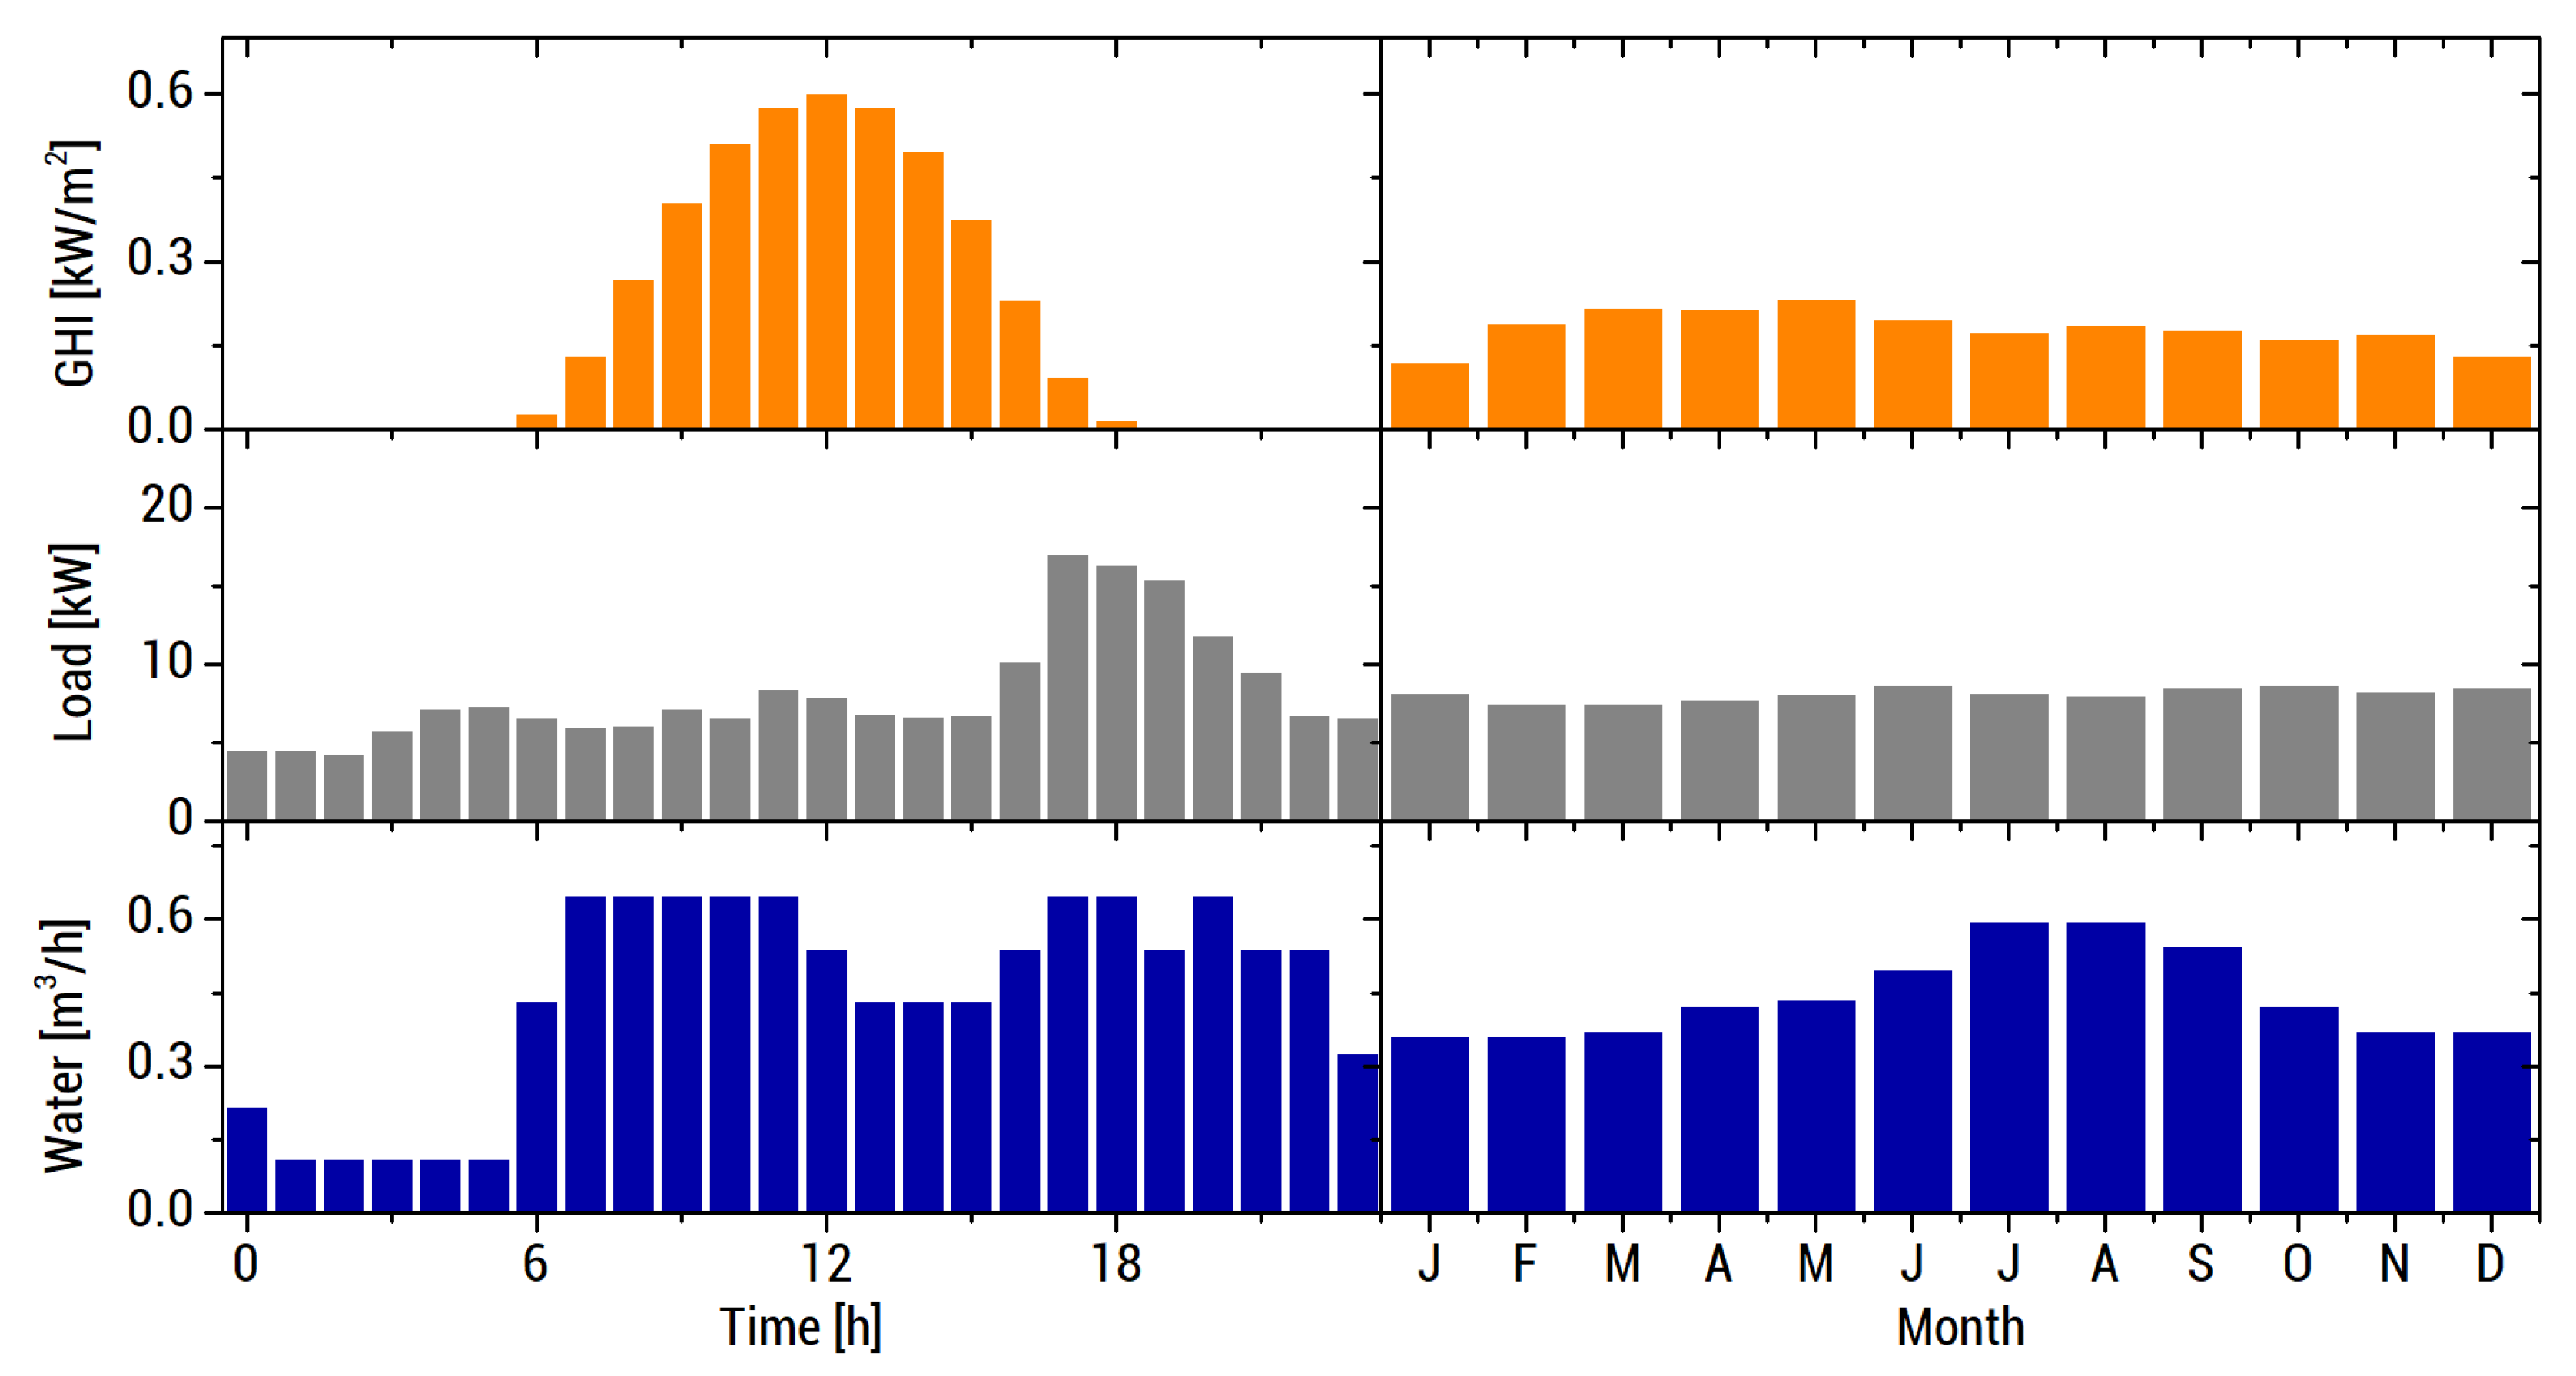
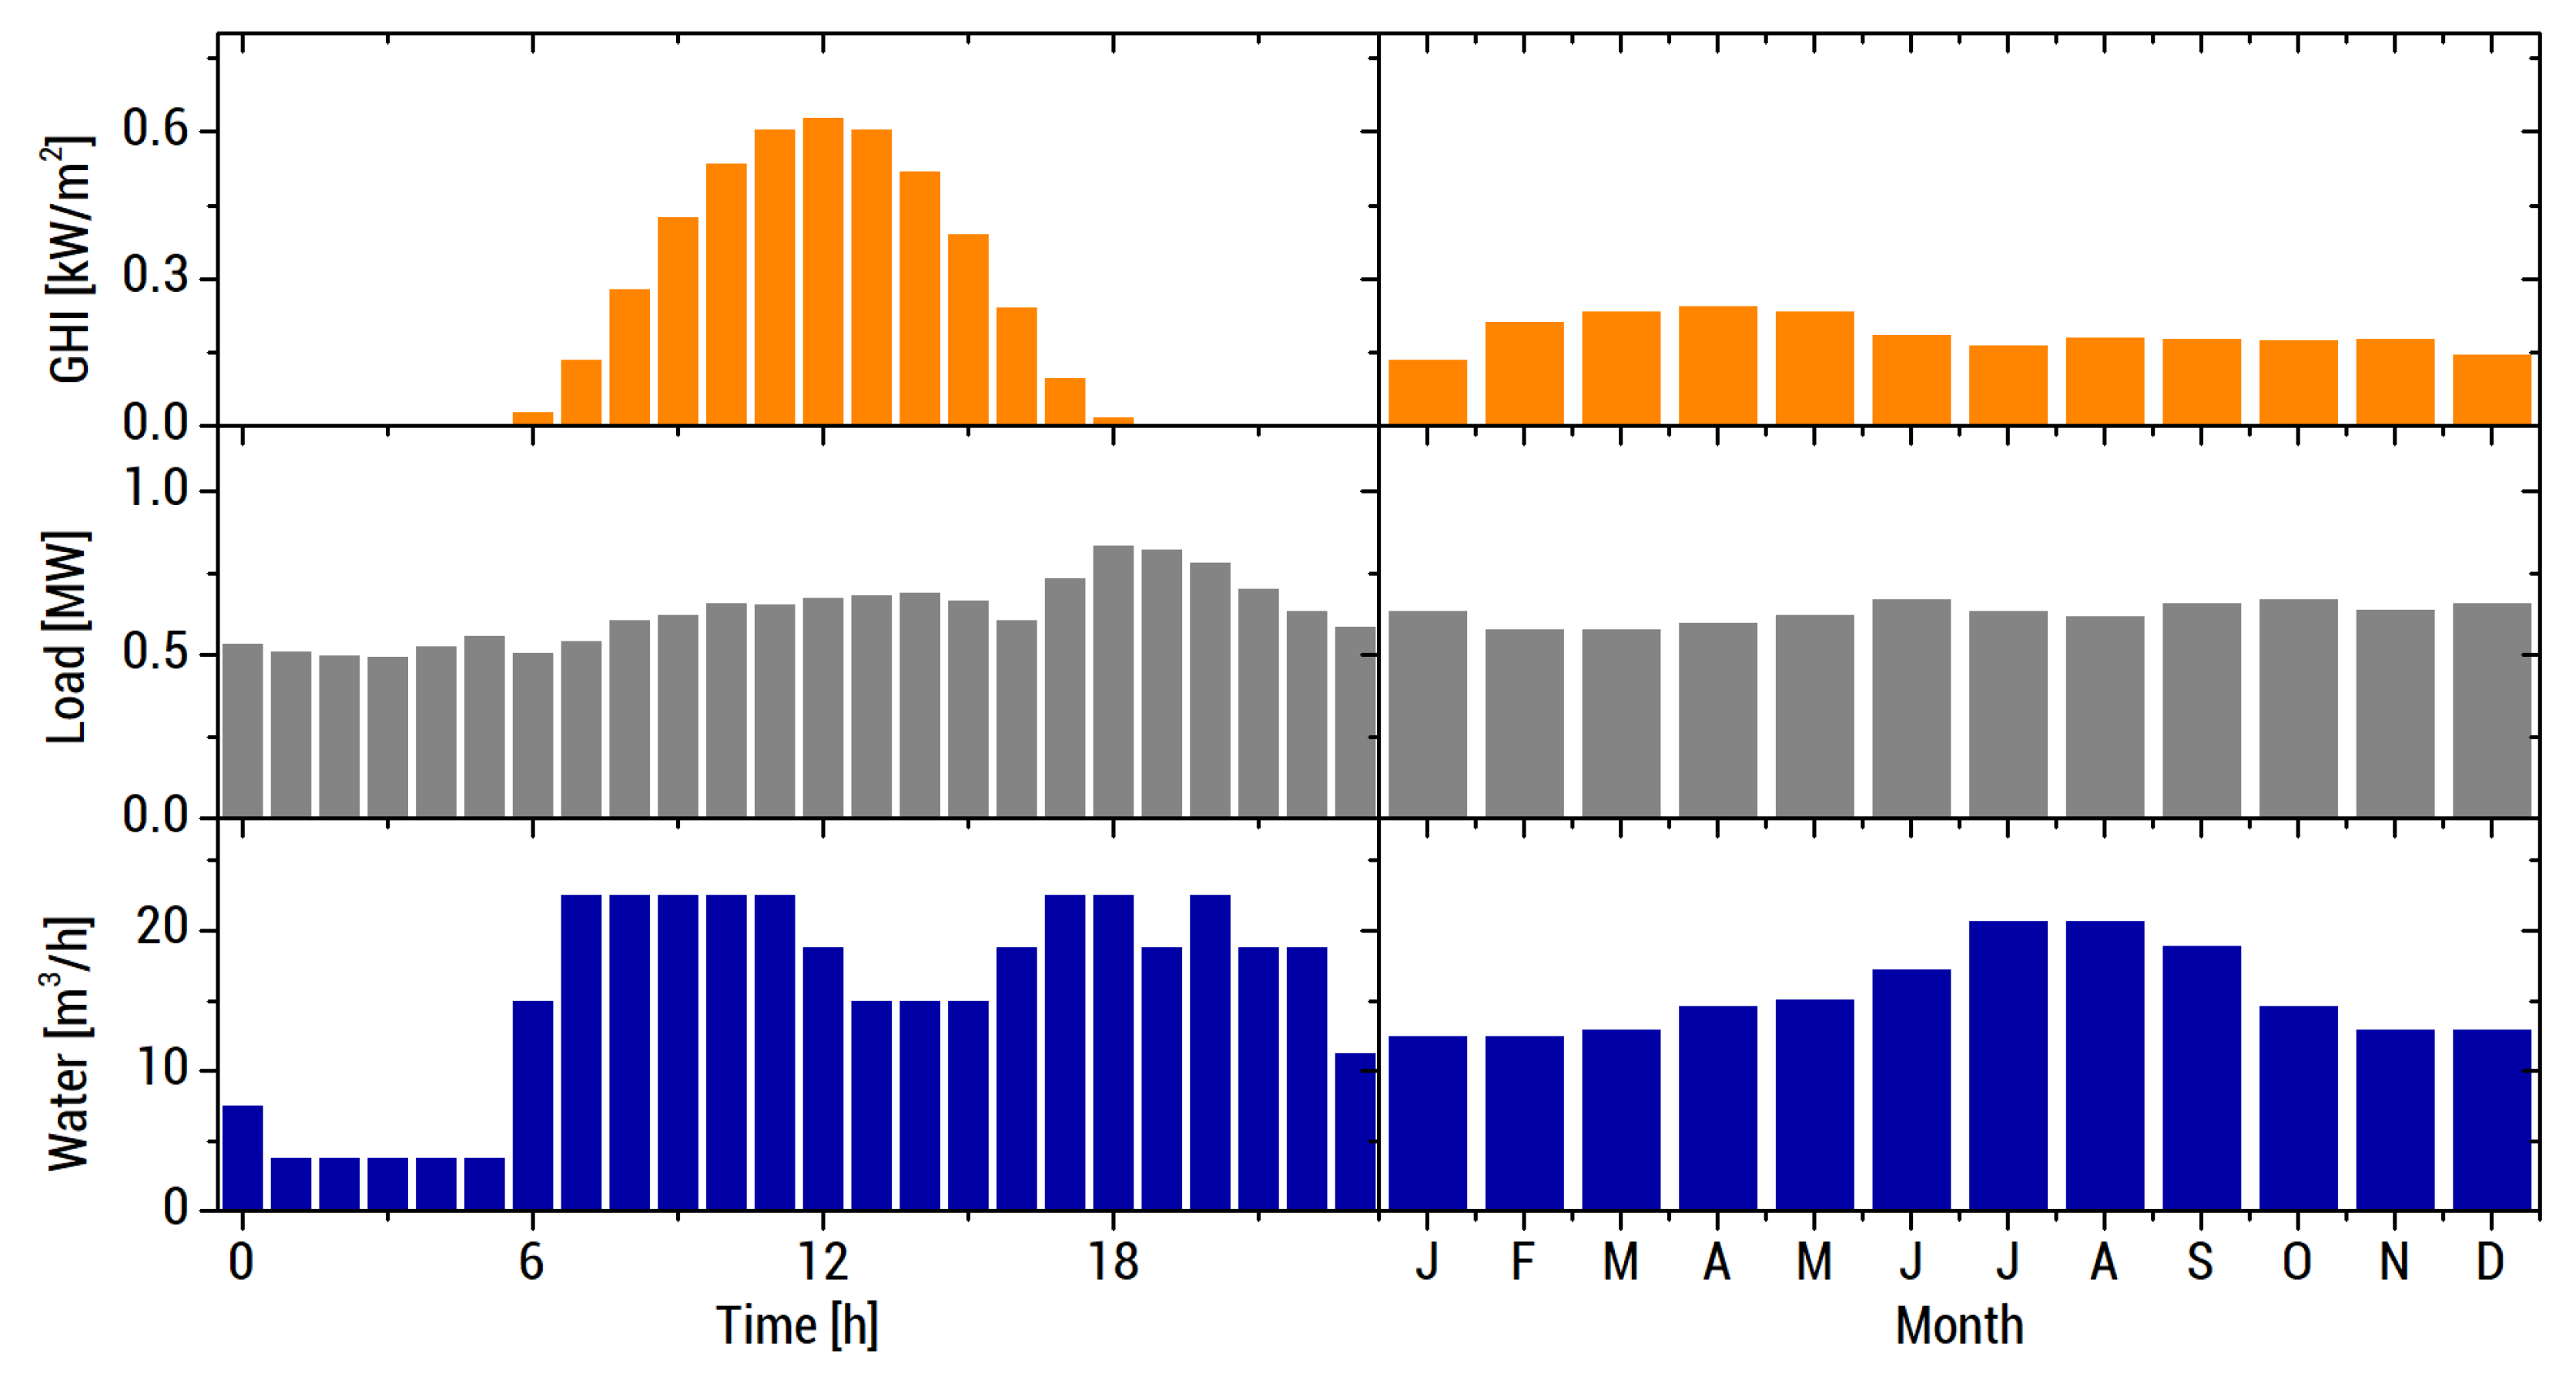
2.6. Case Study
2.7. Stochastic Profile Generation
3. Results
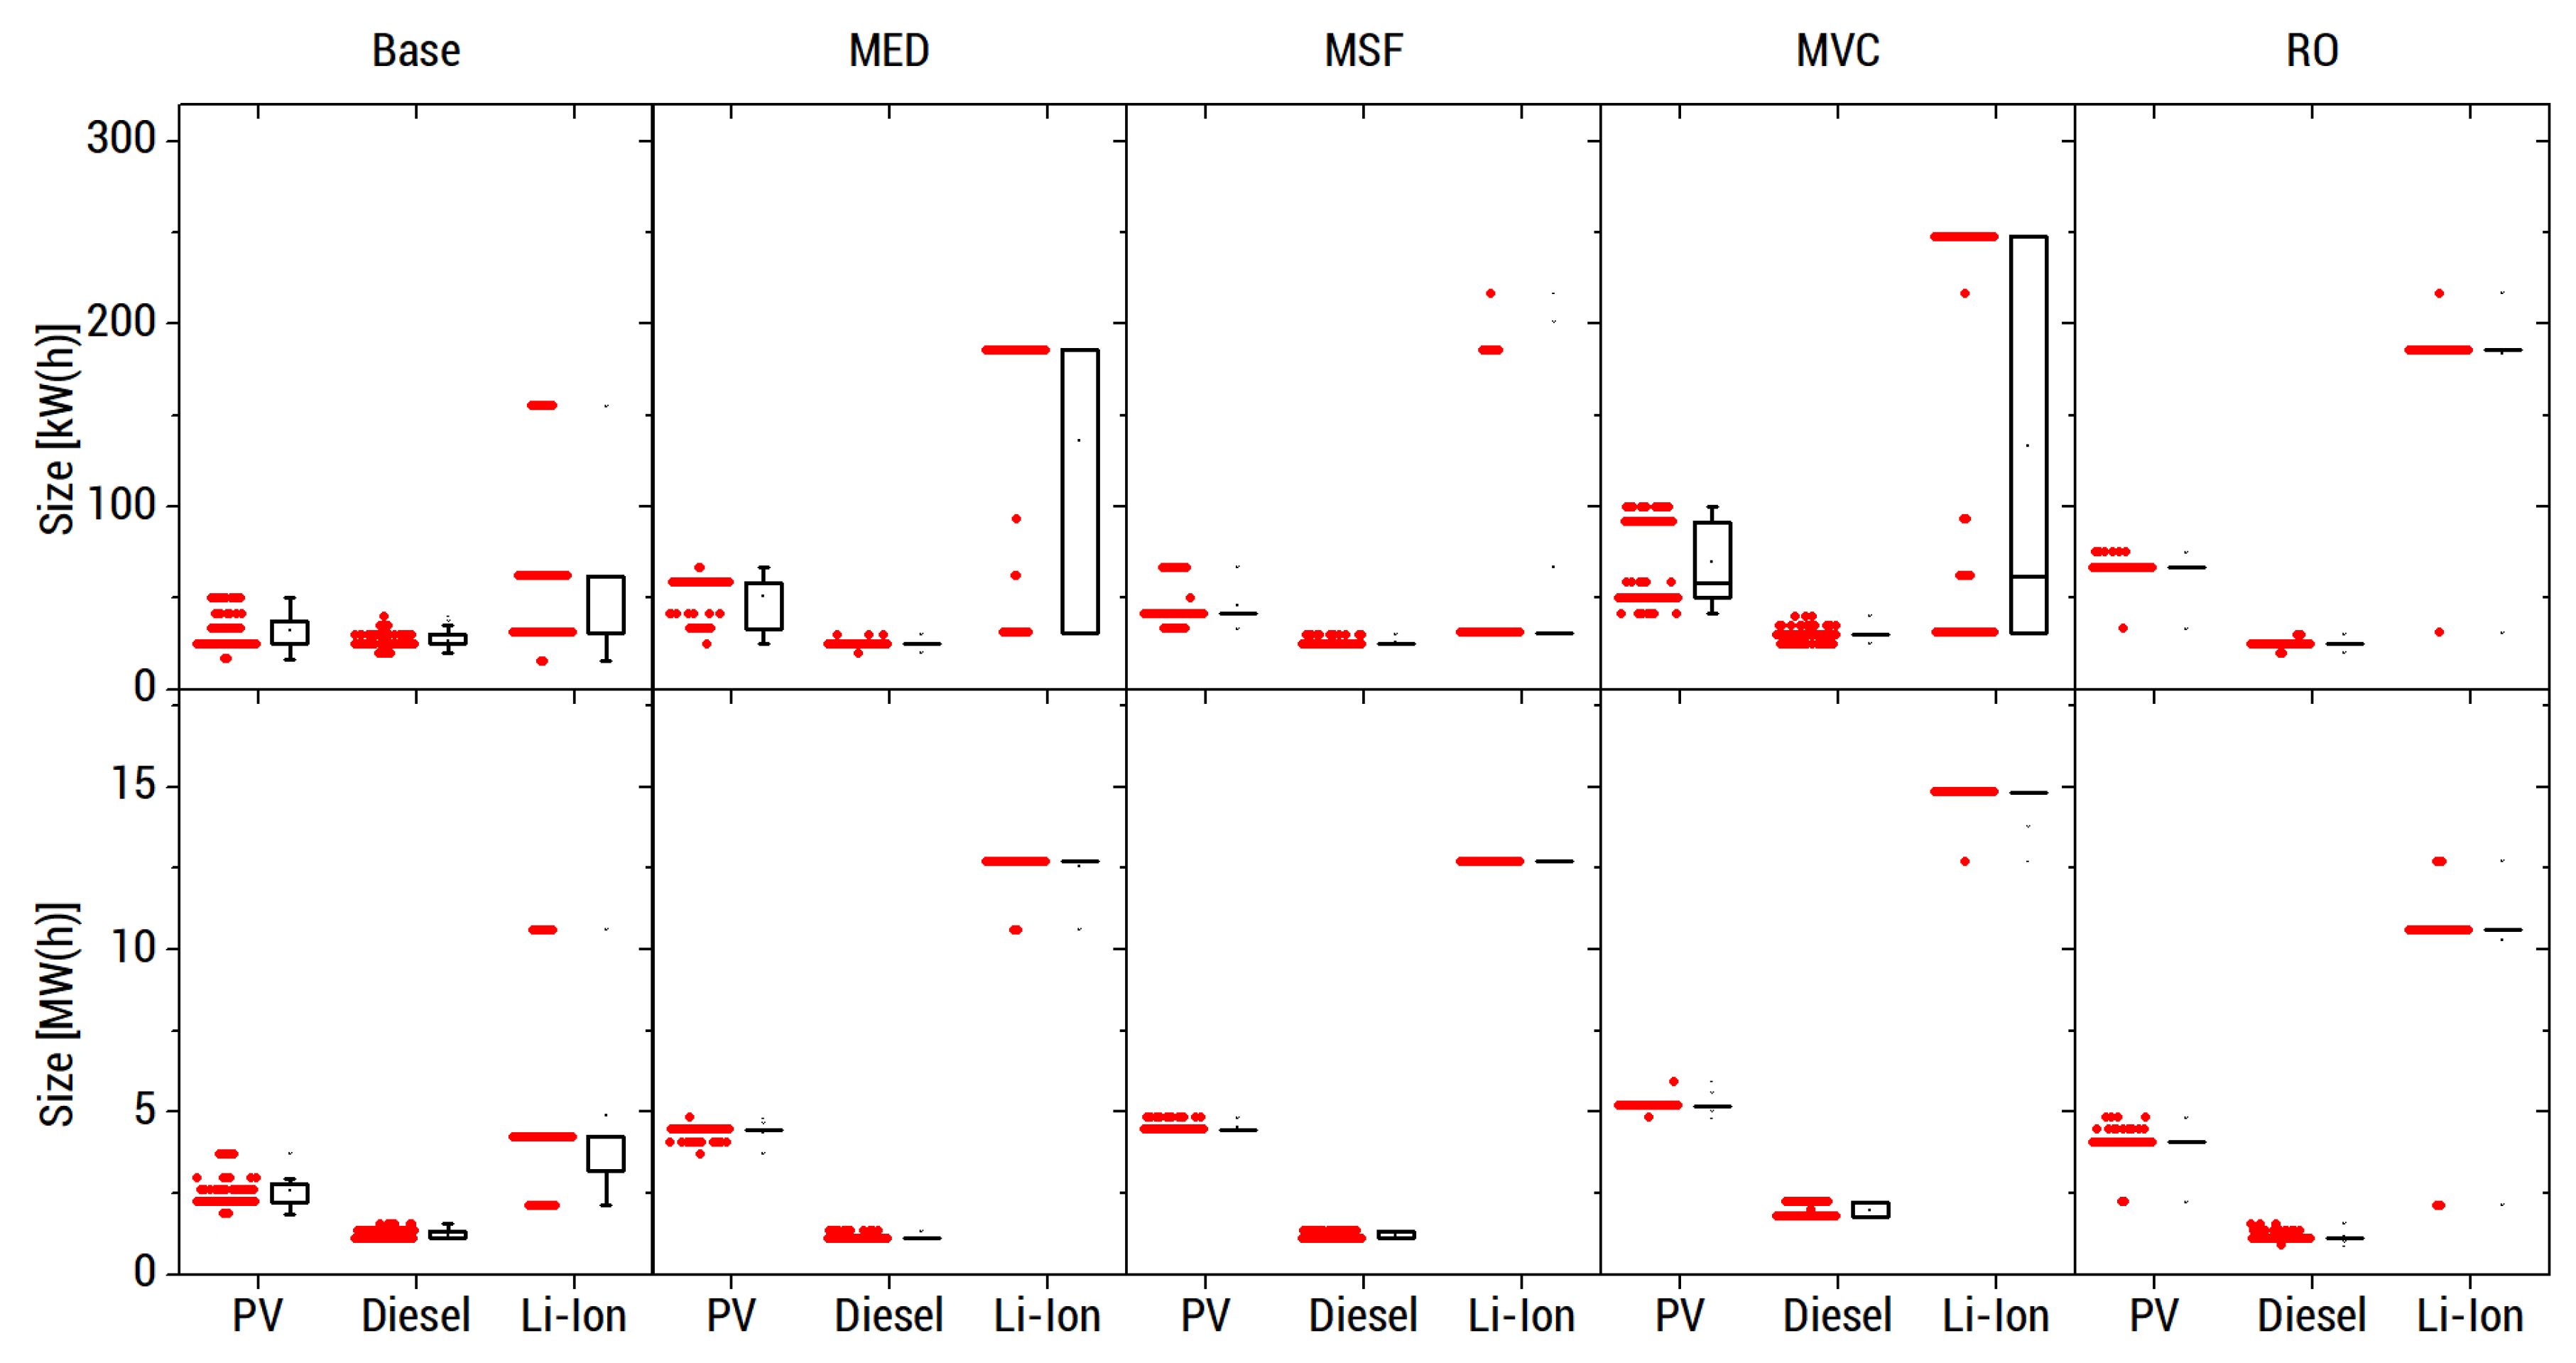
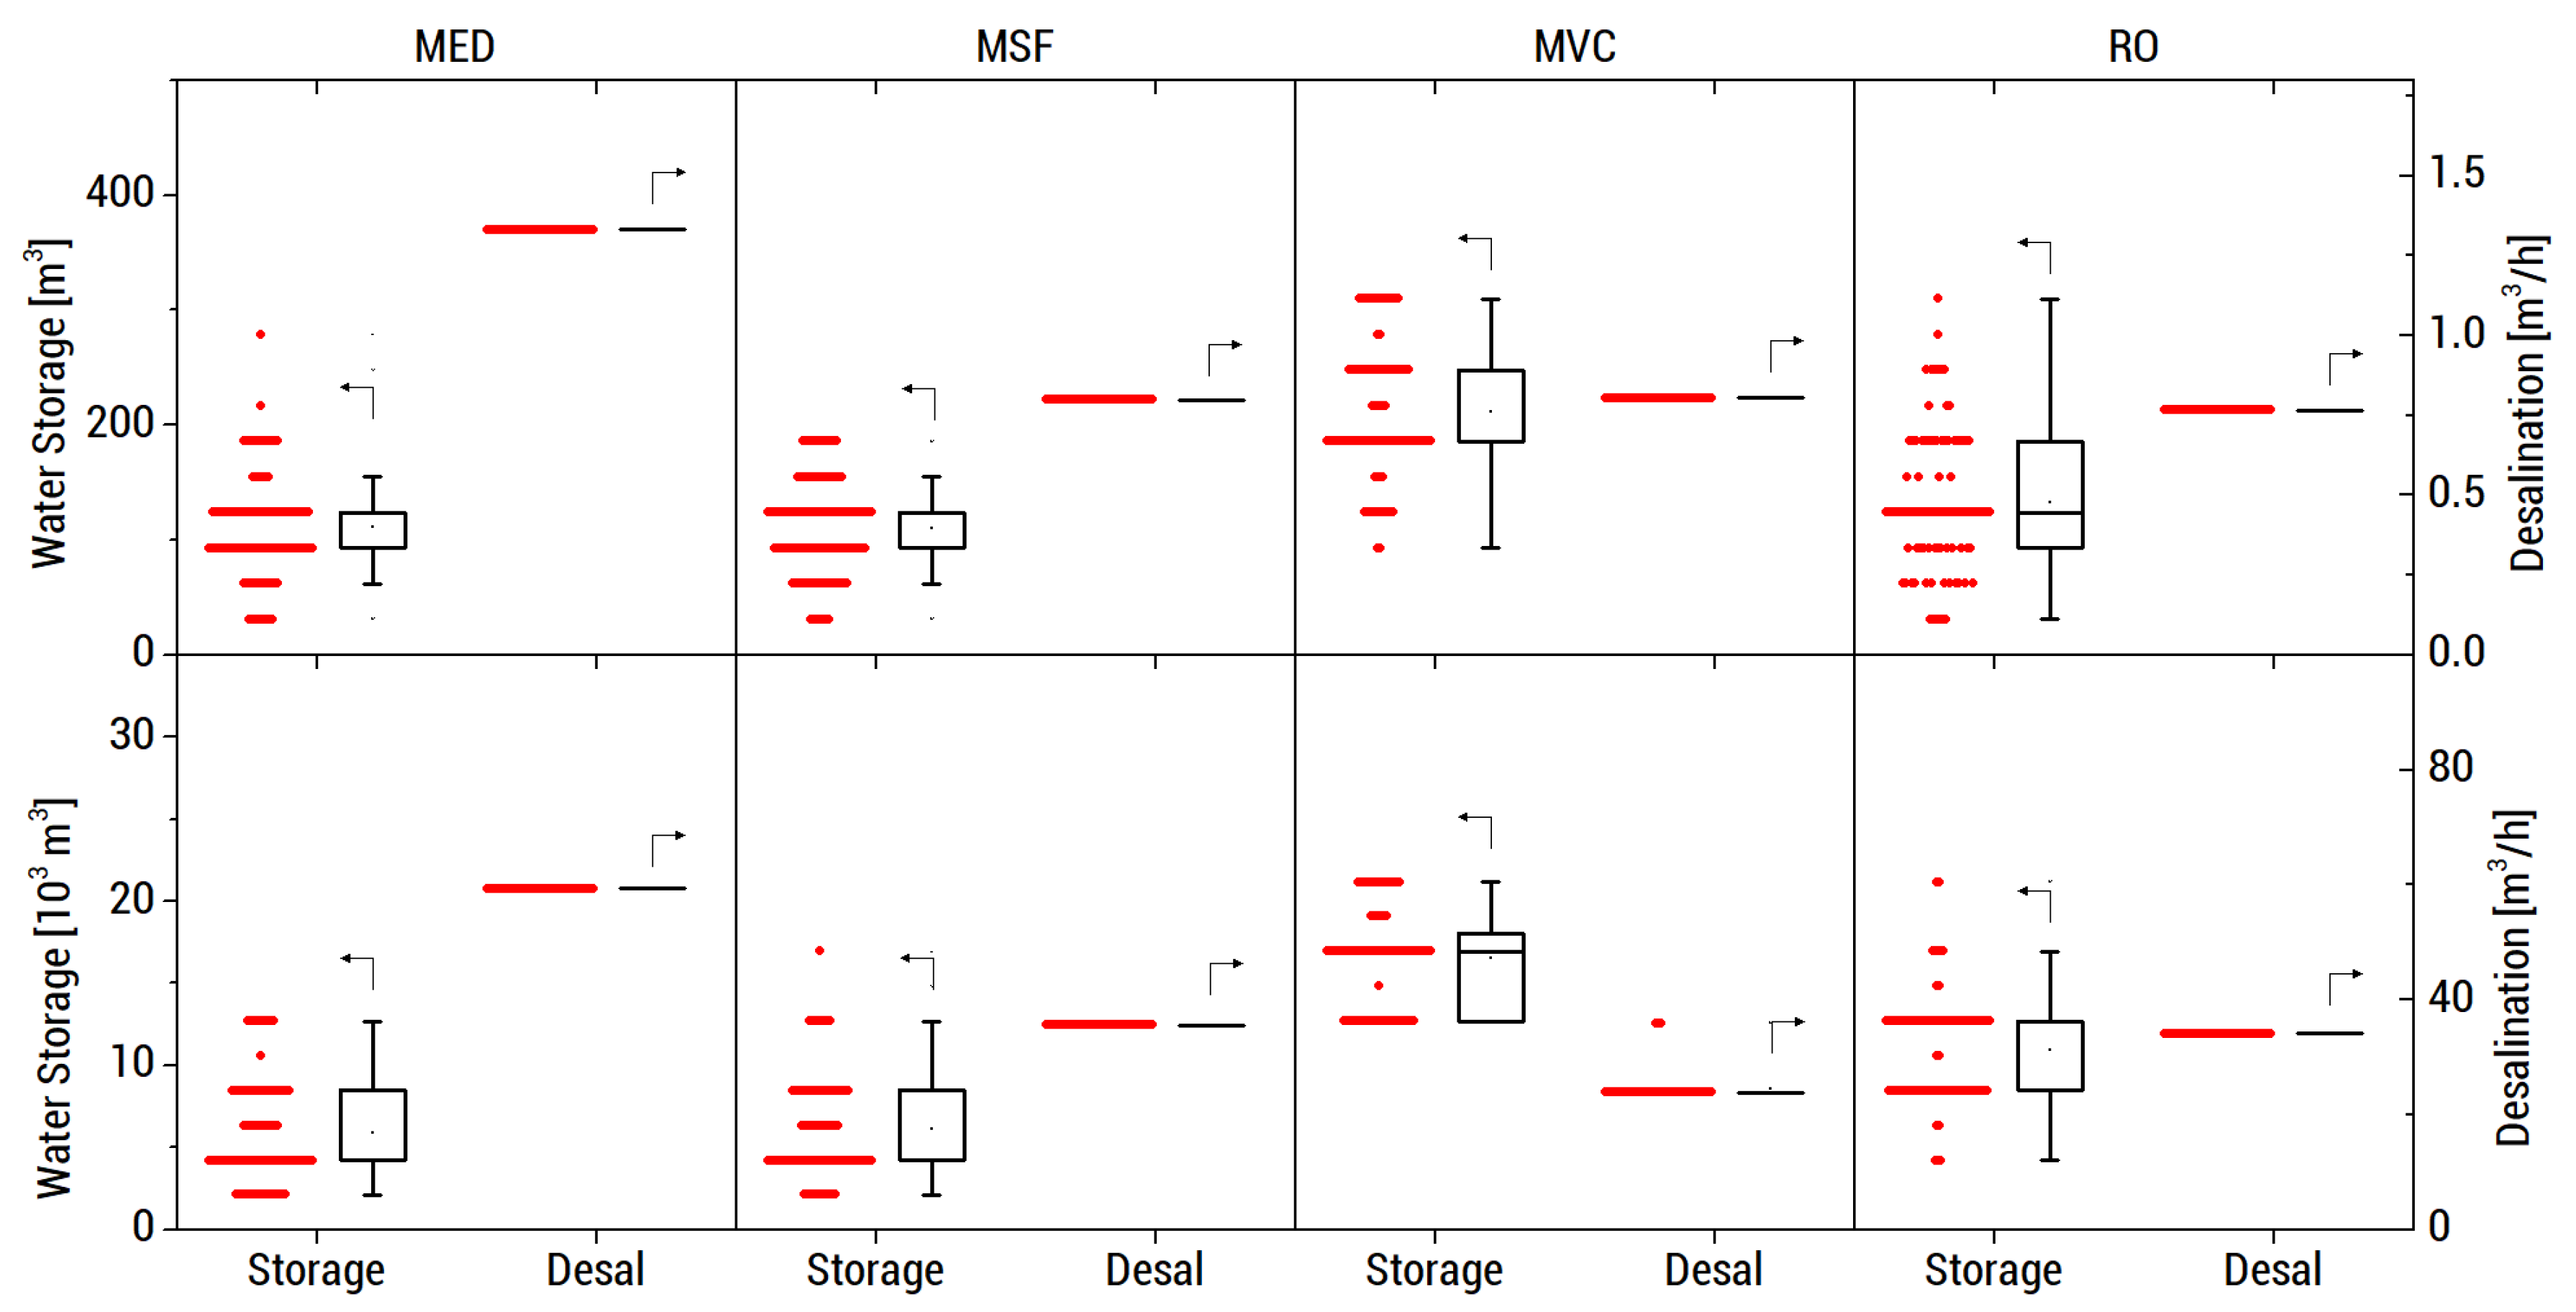
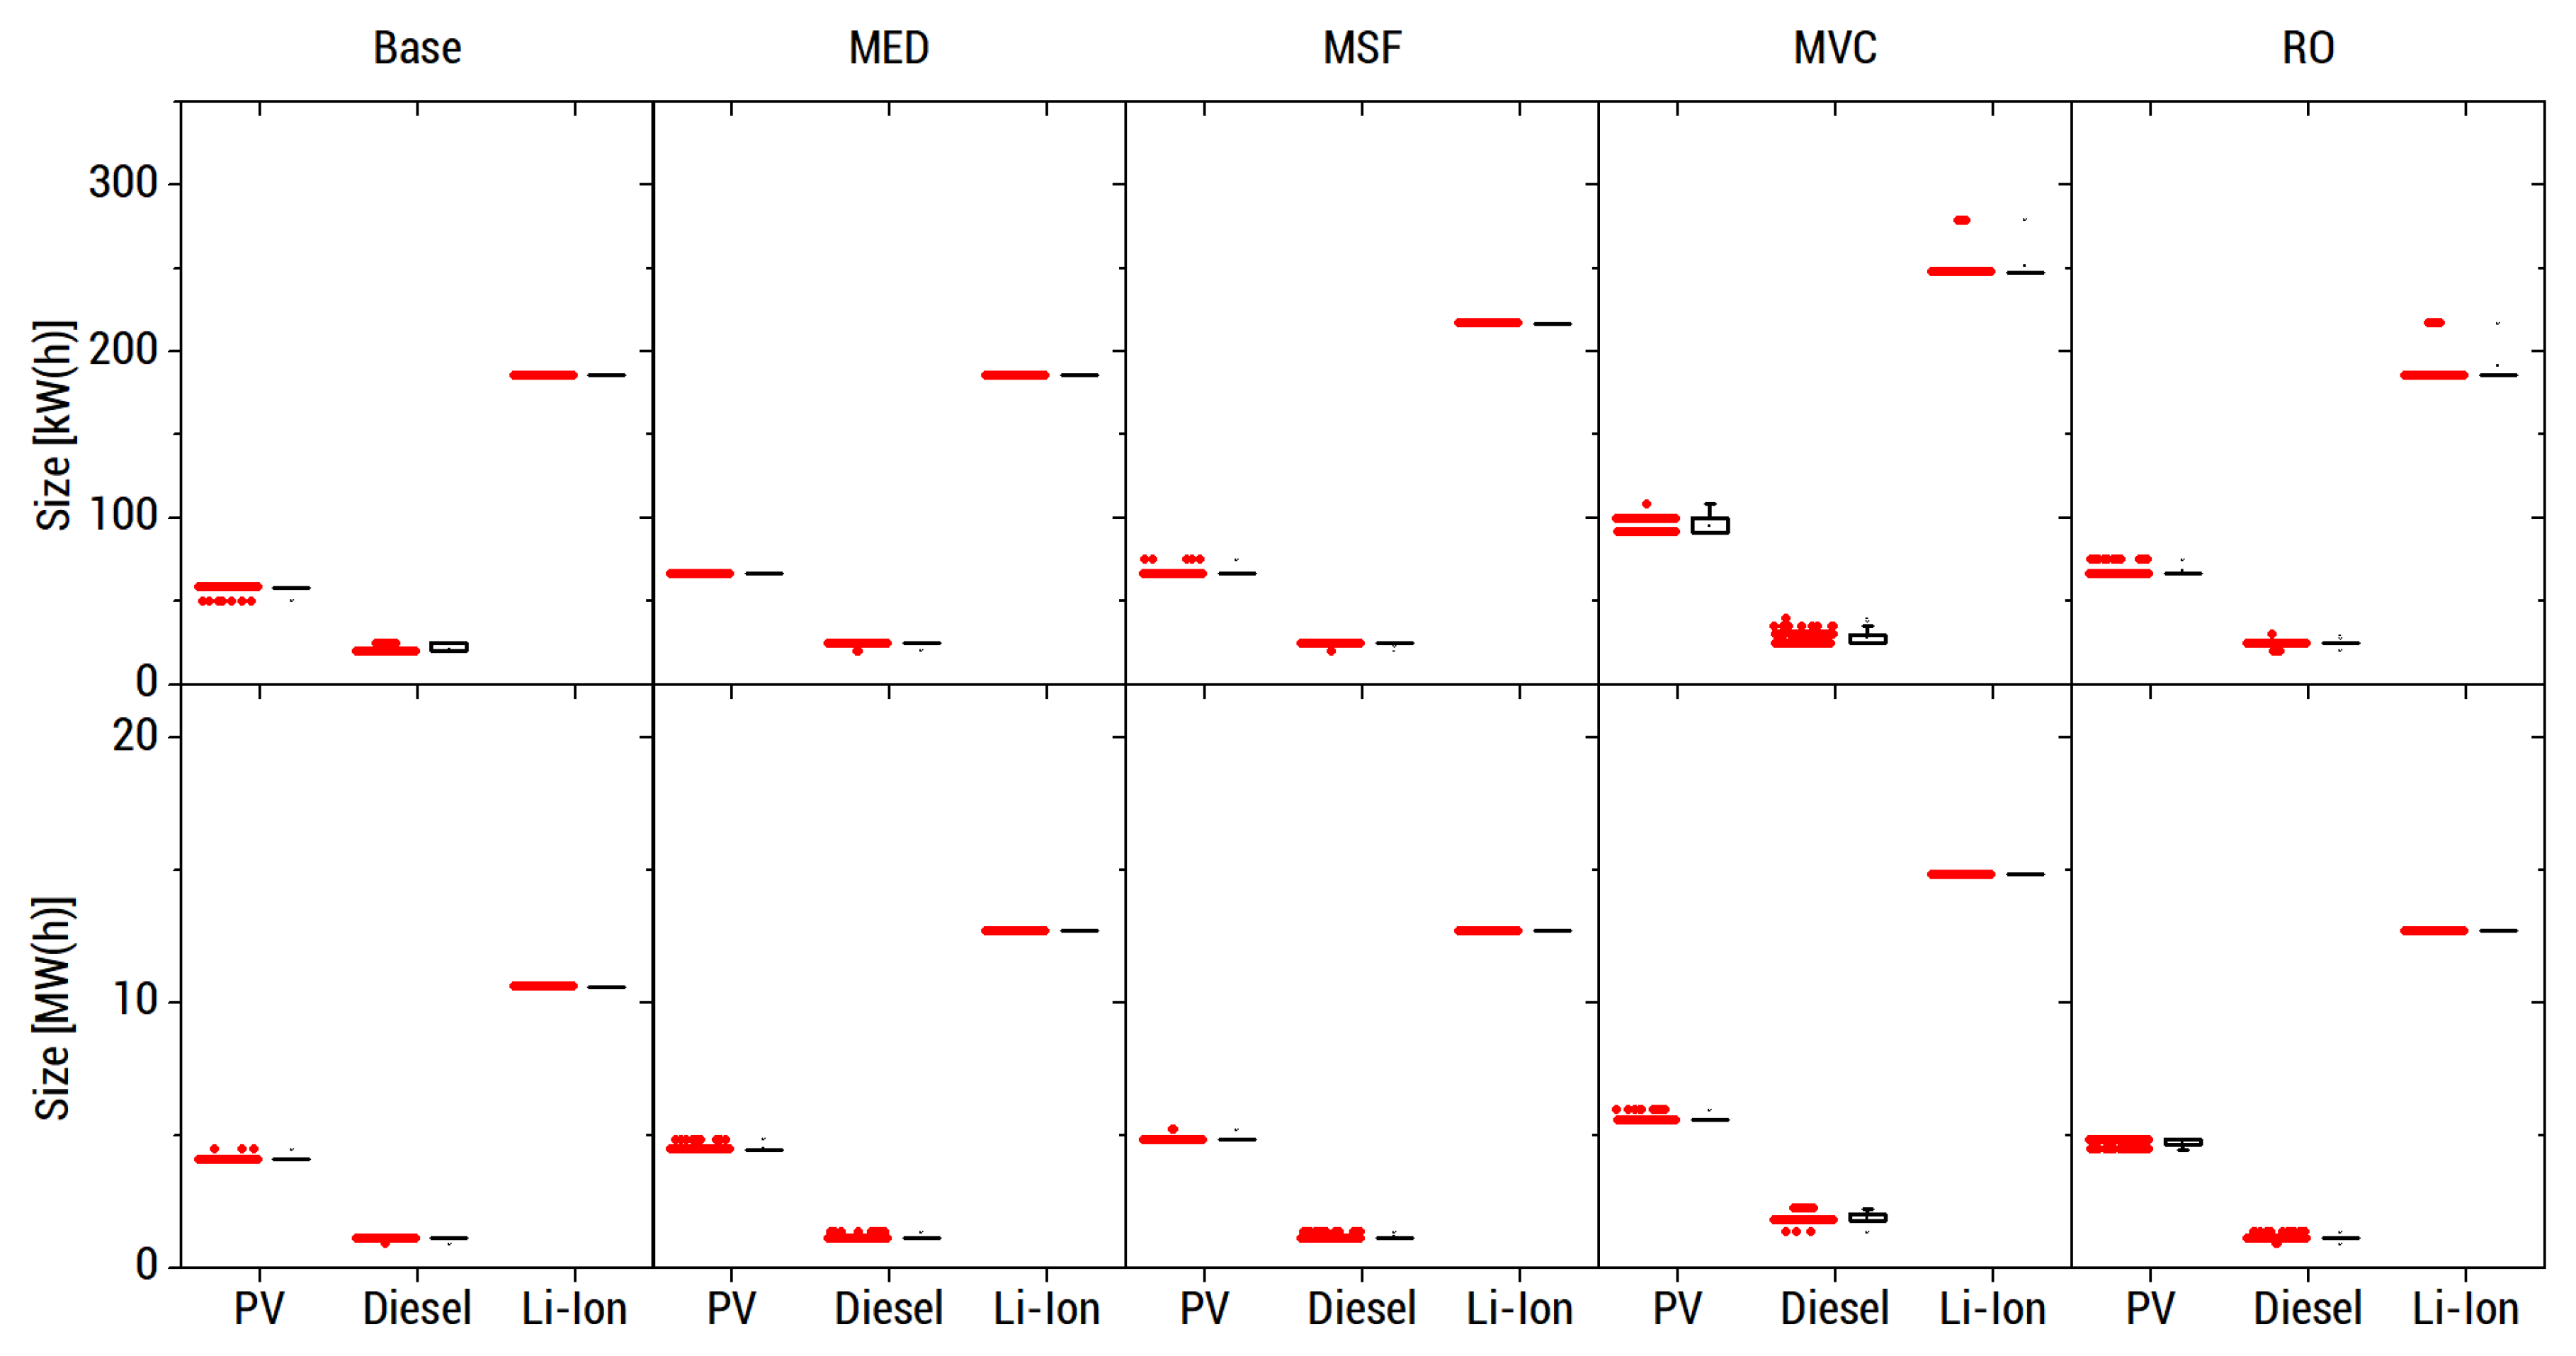
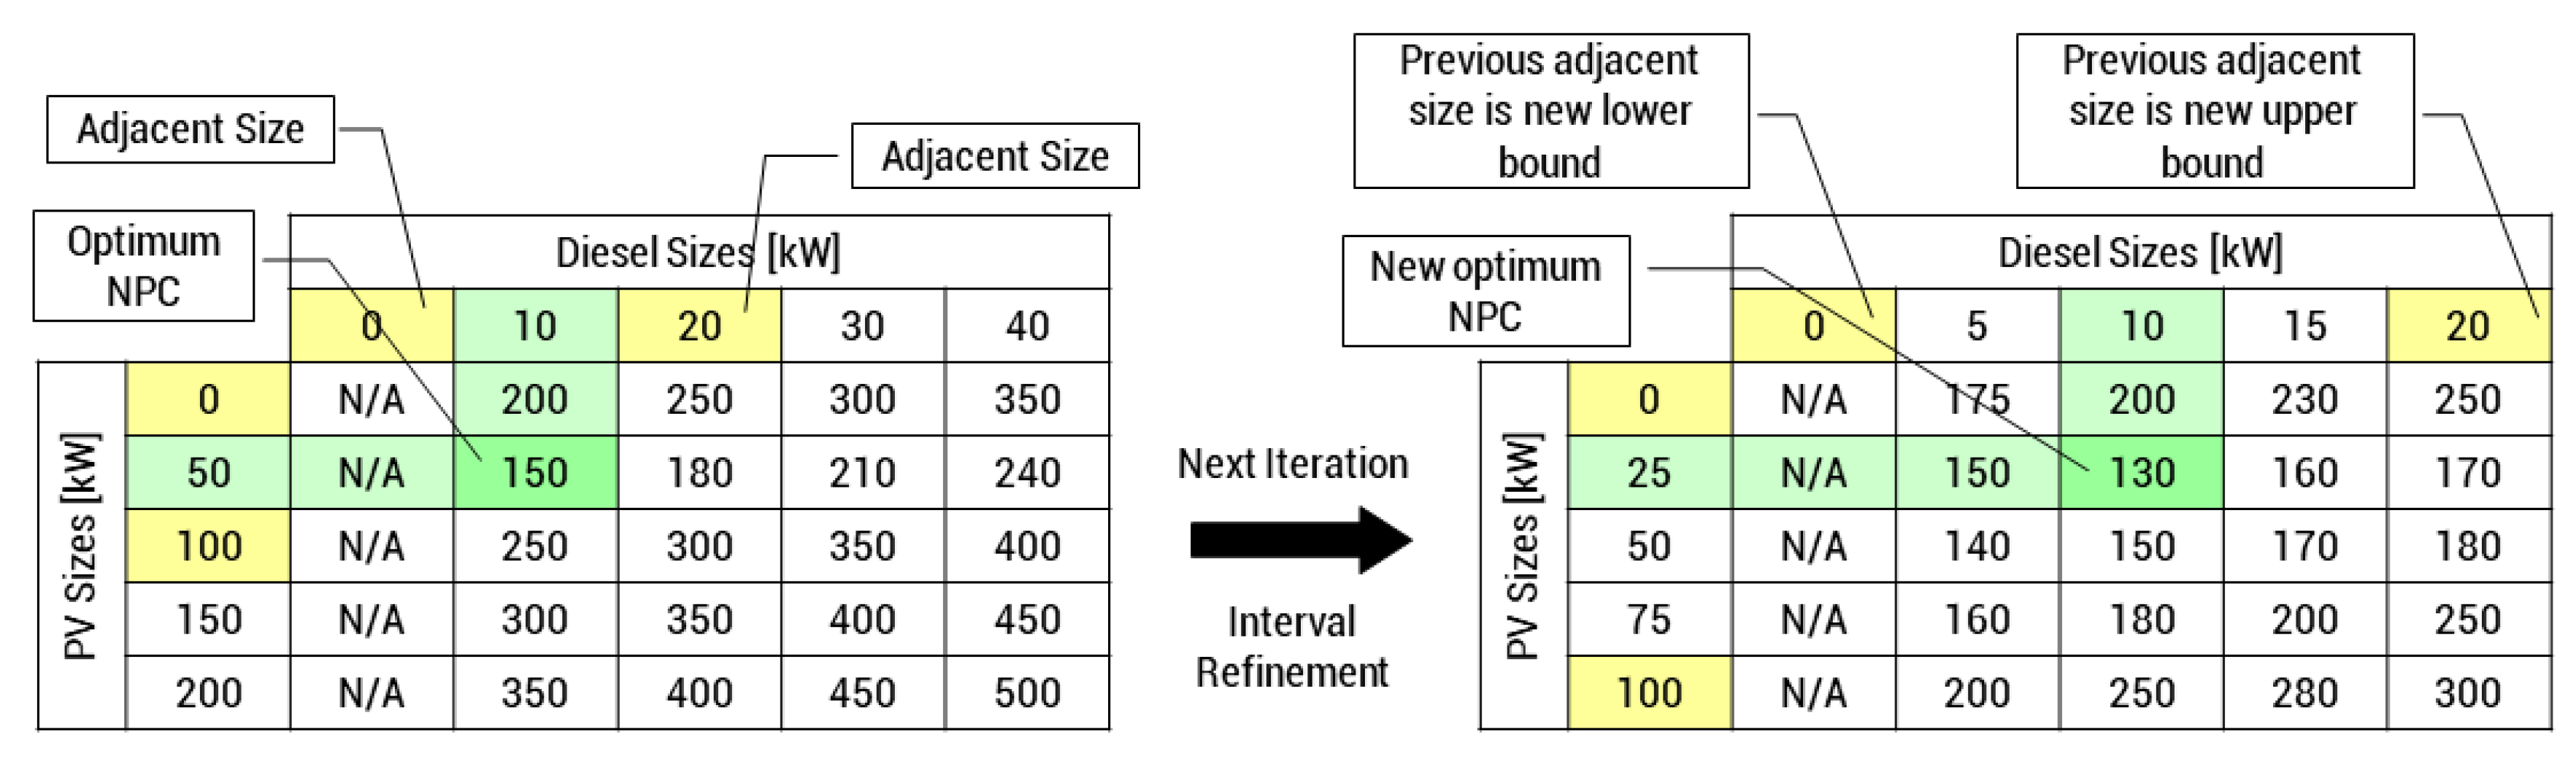
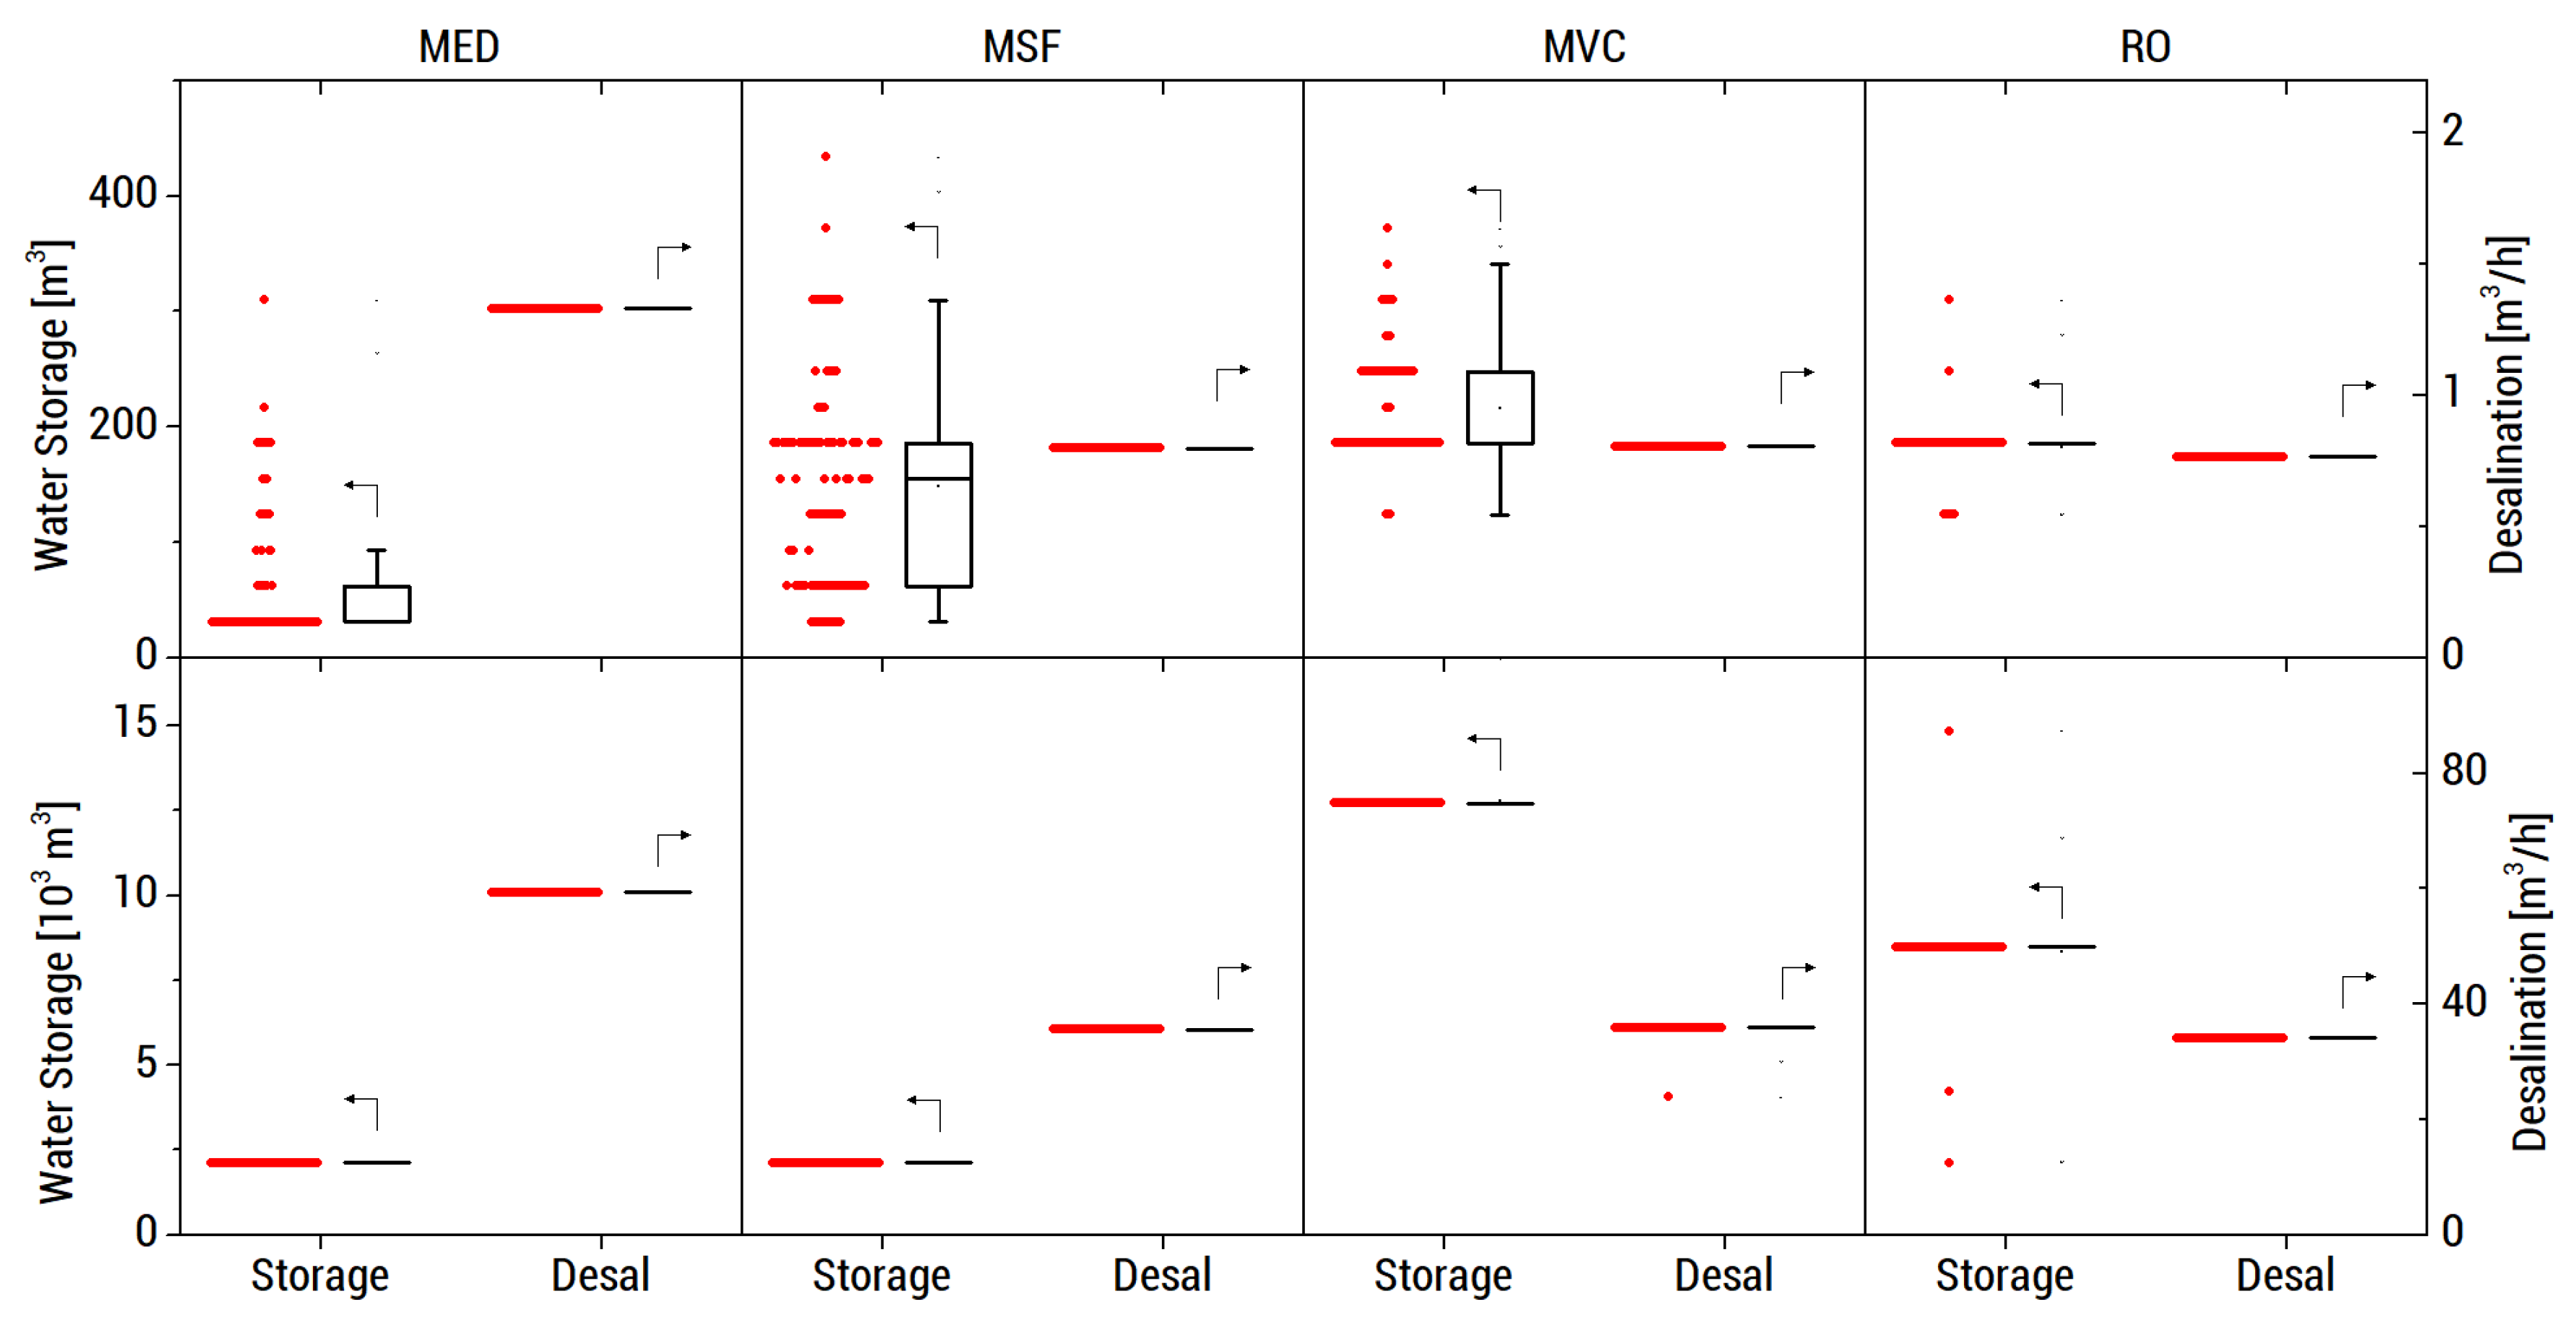
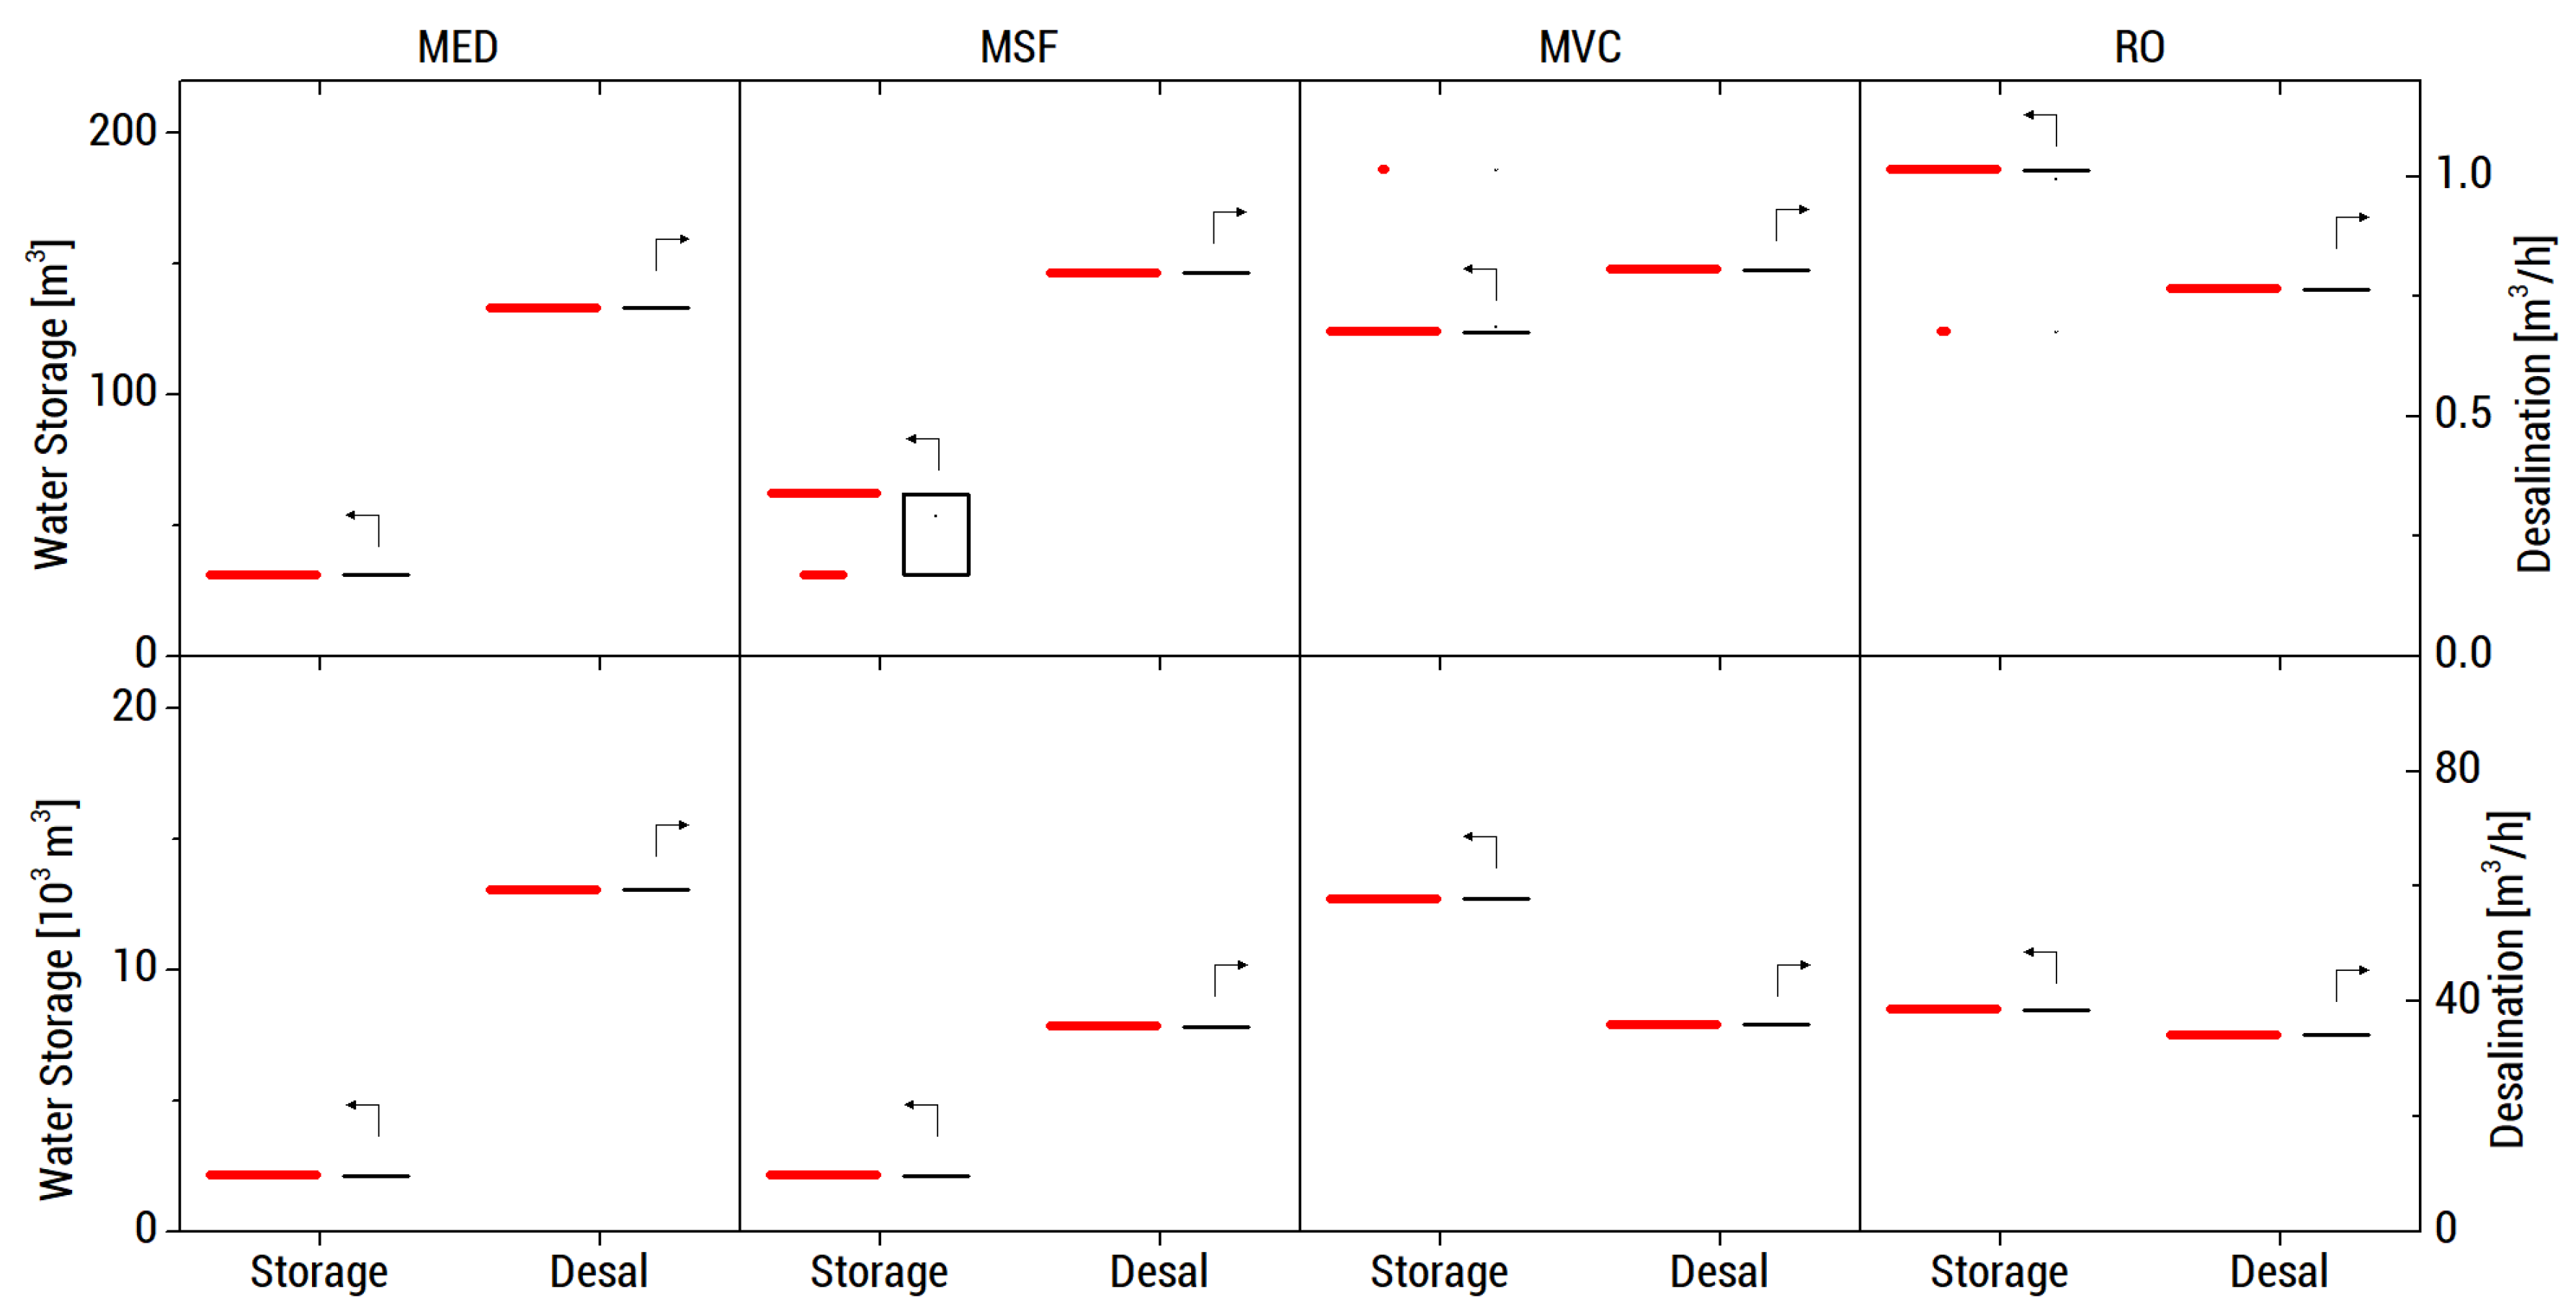
3.1. Optimum Sizes
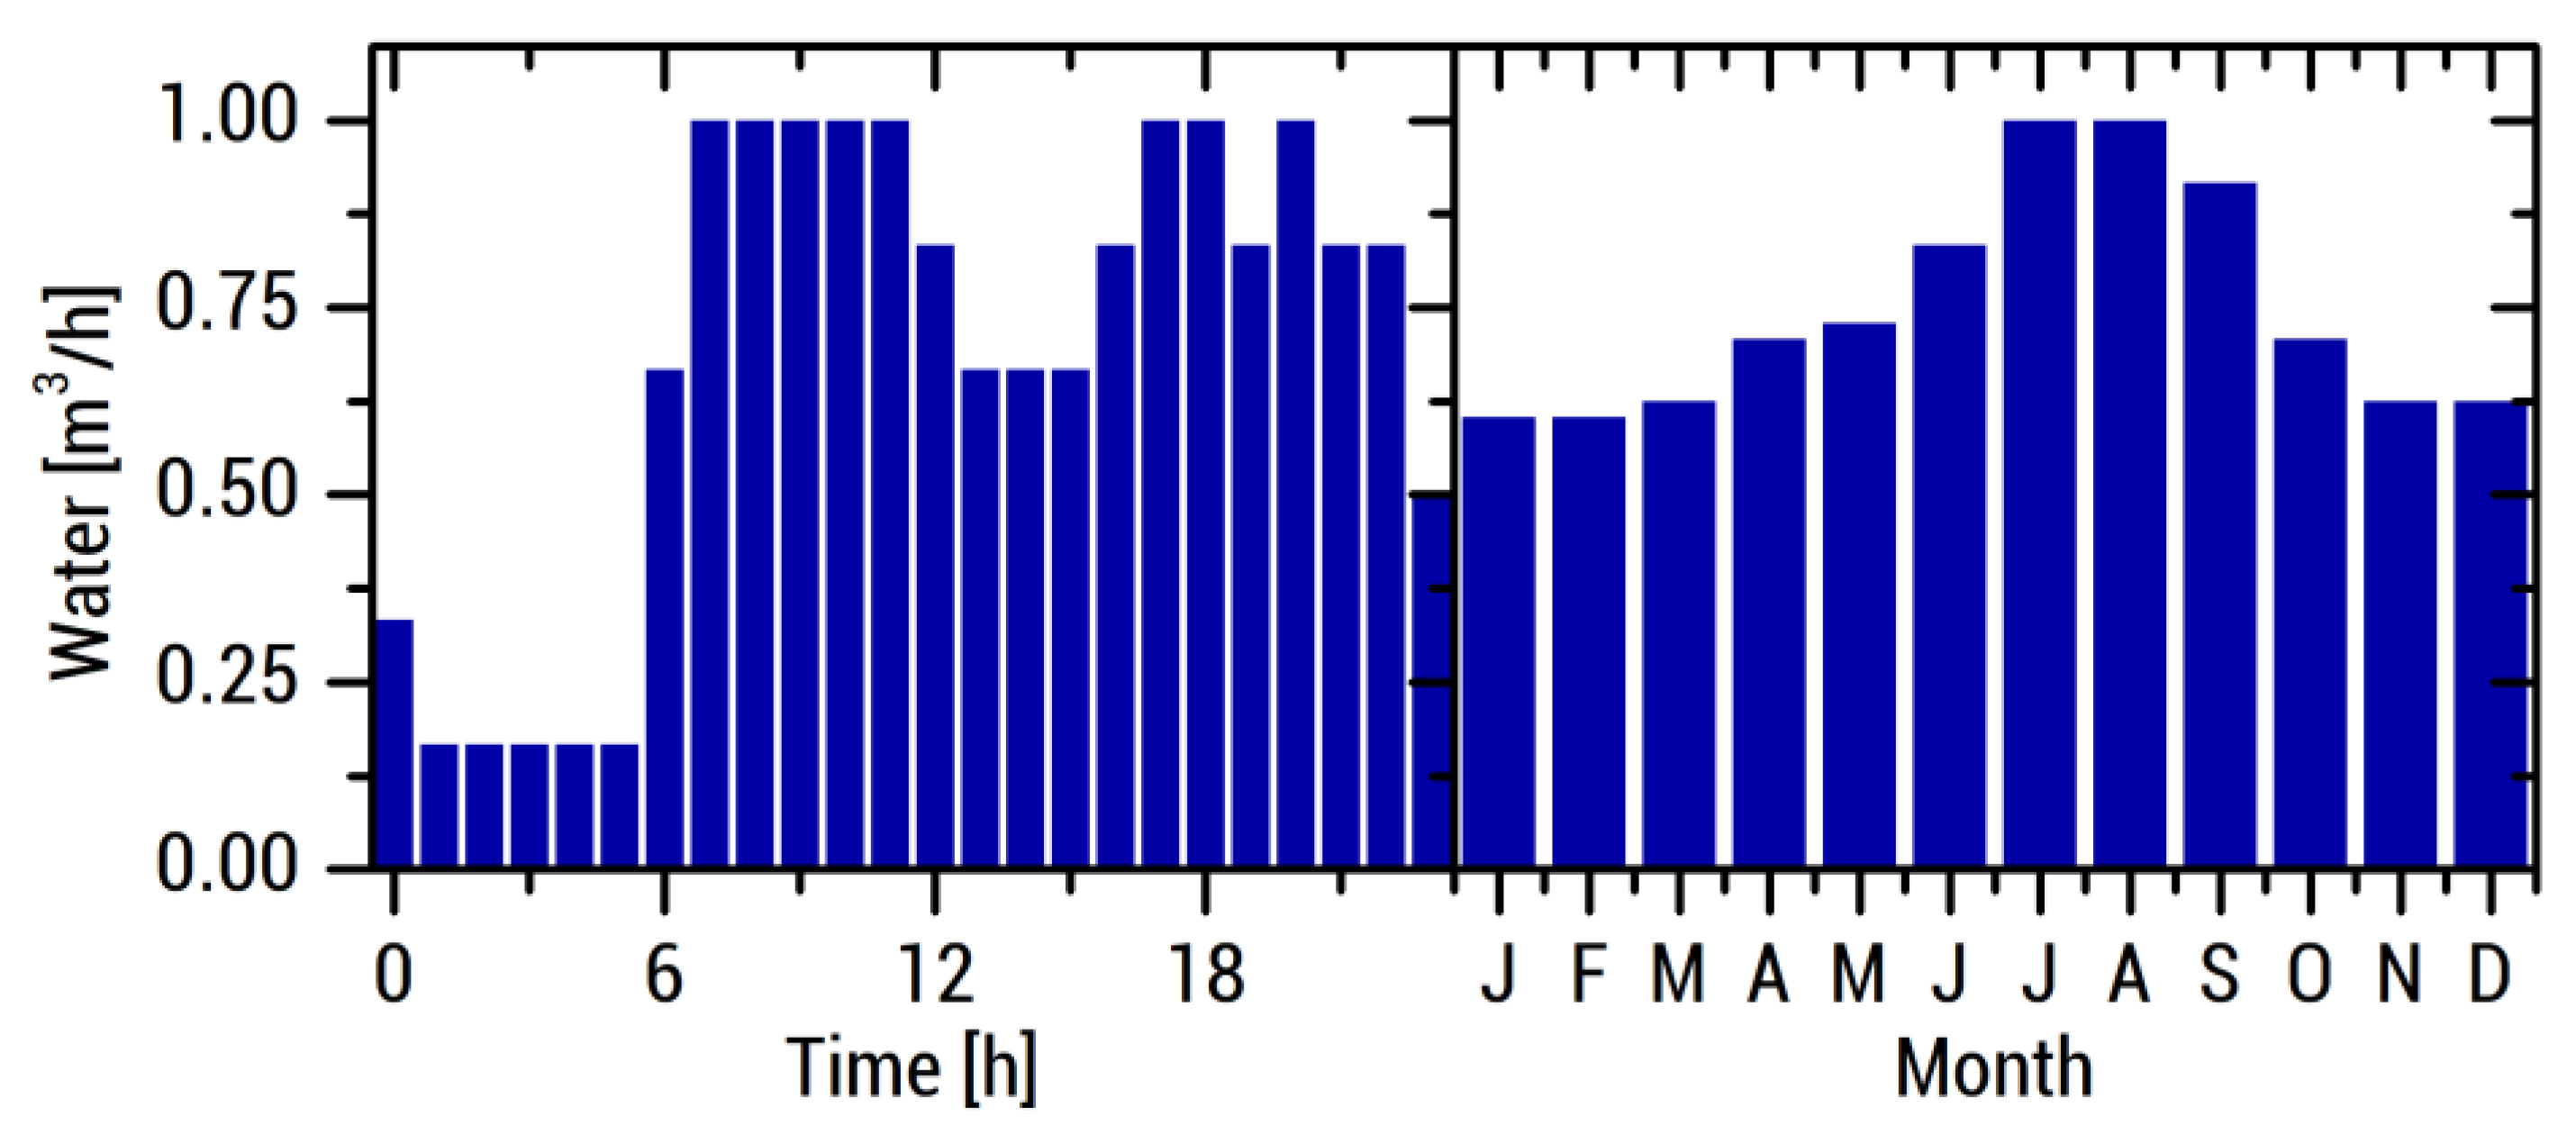
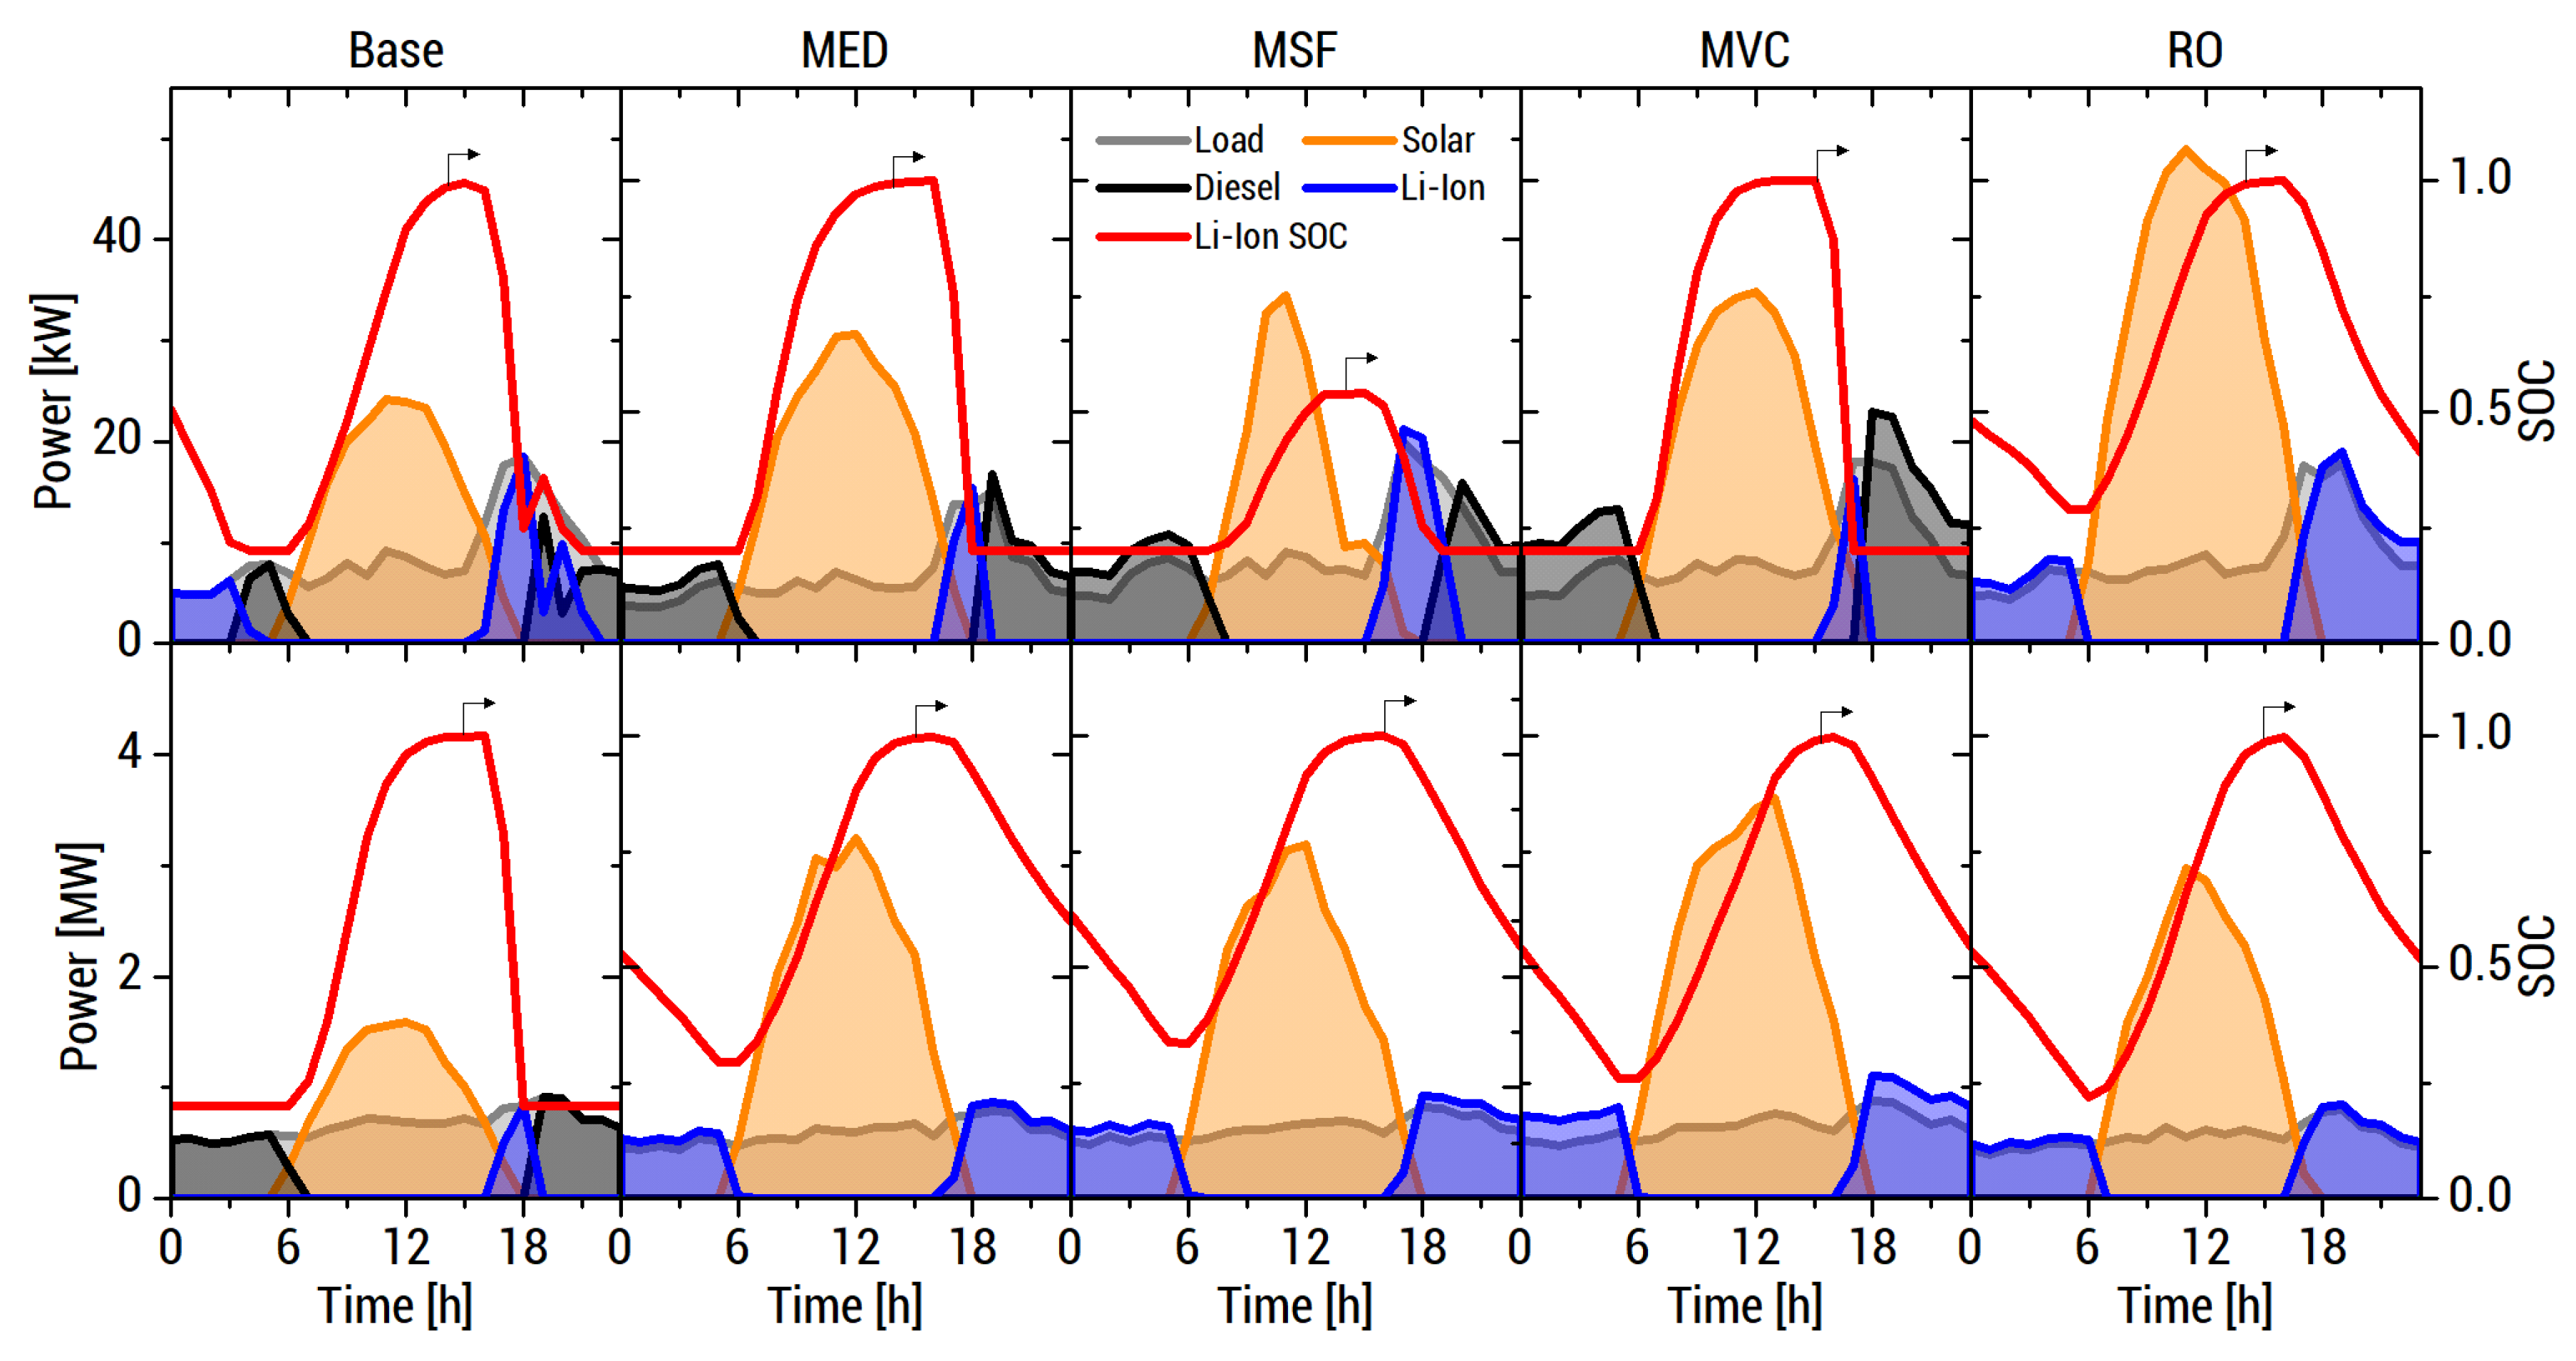
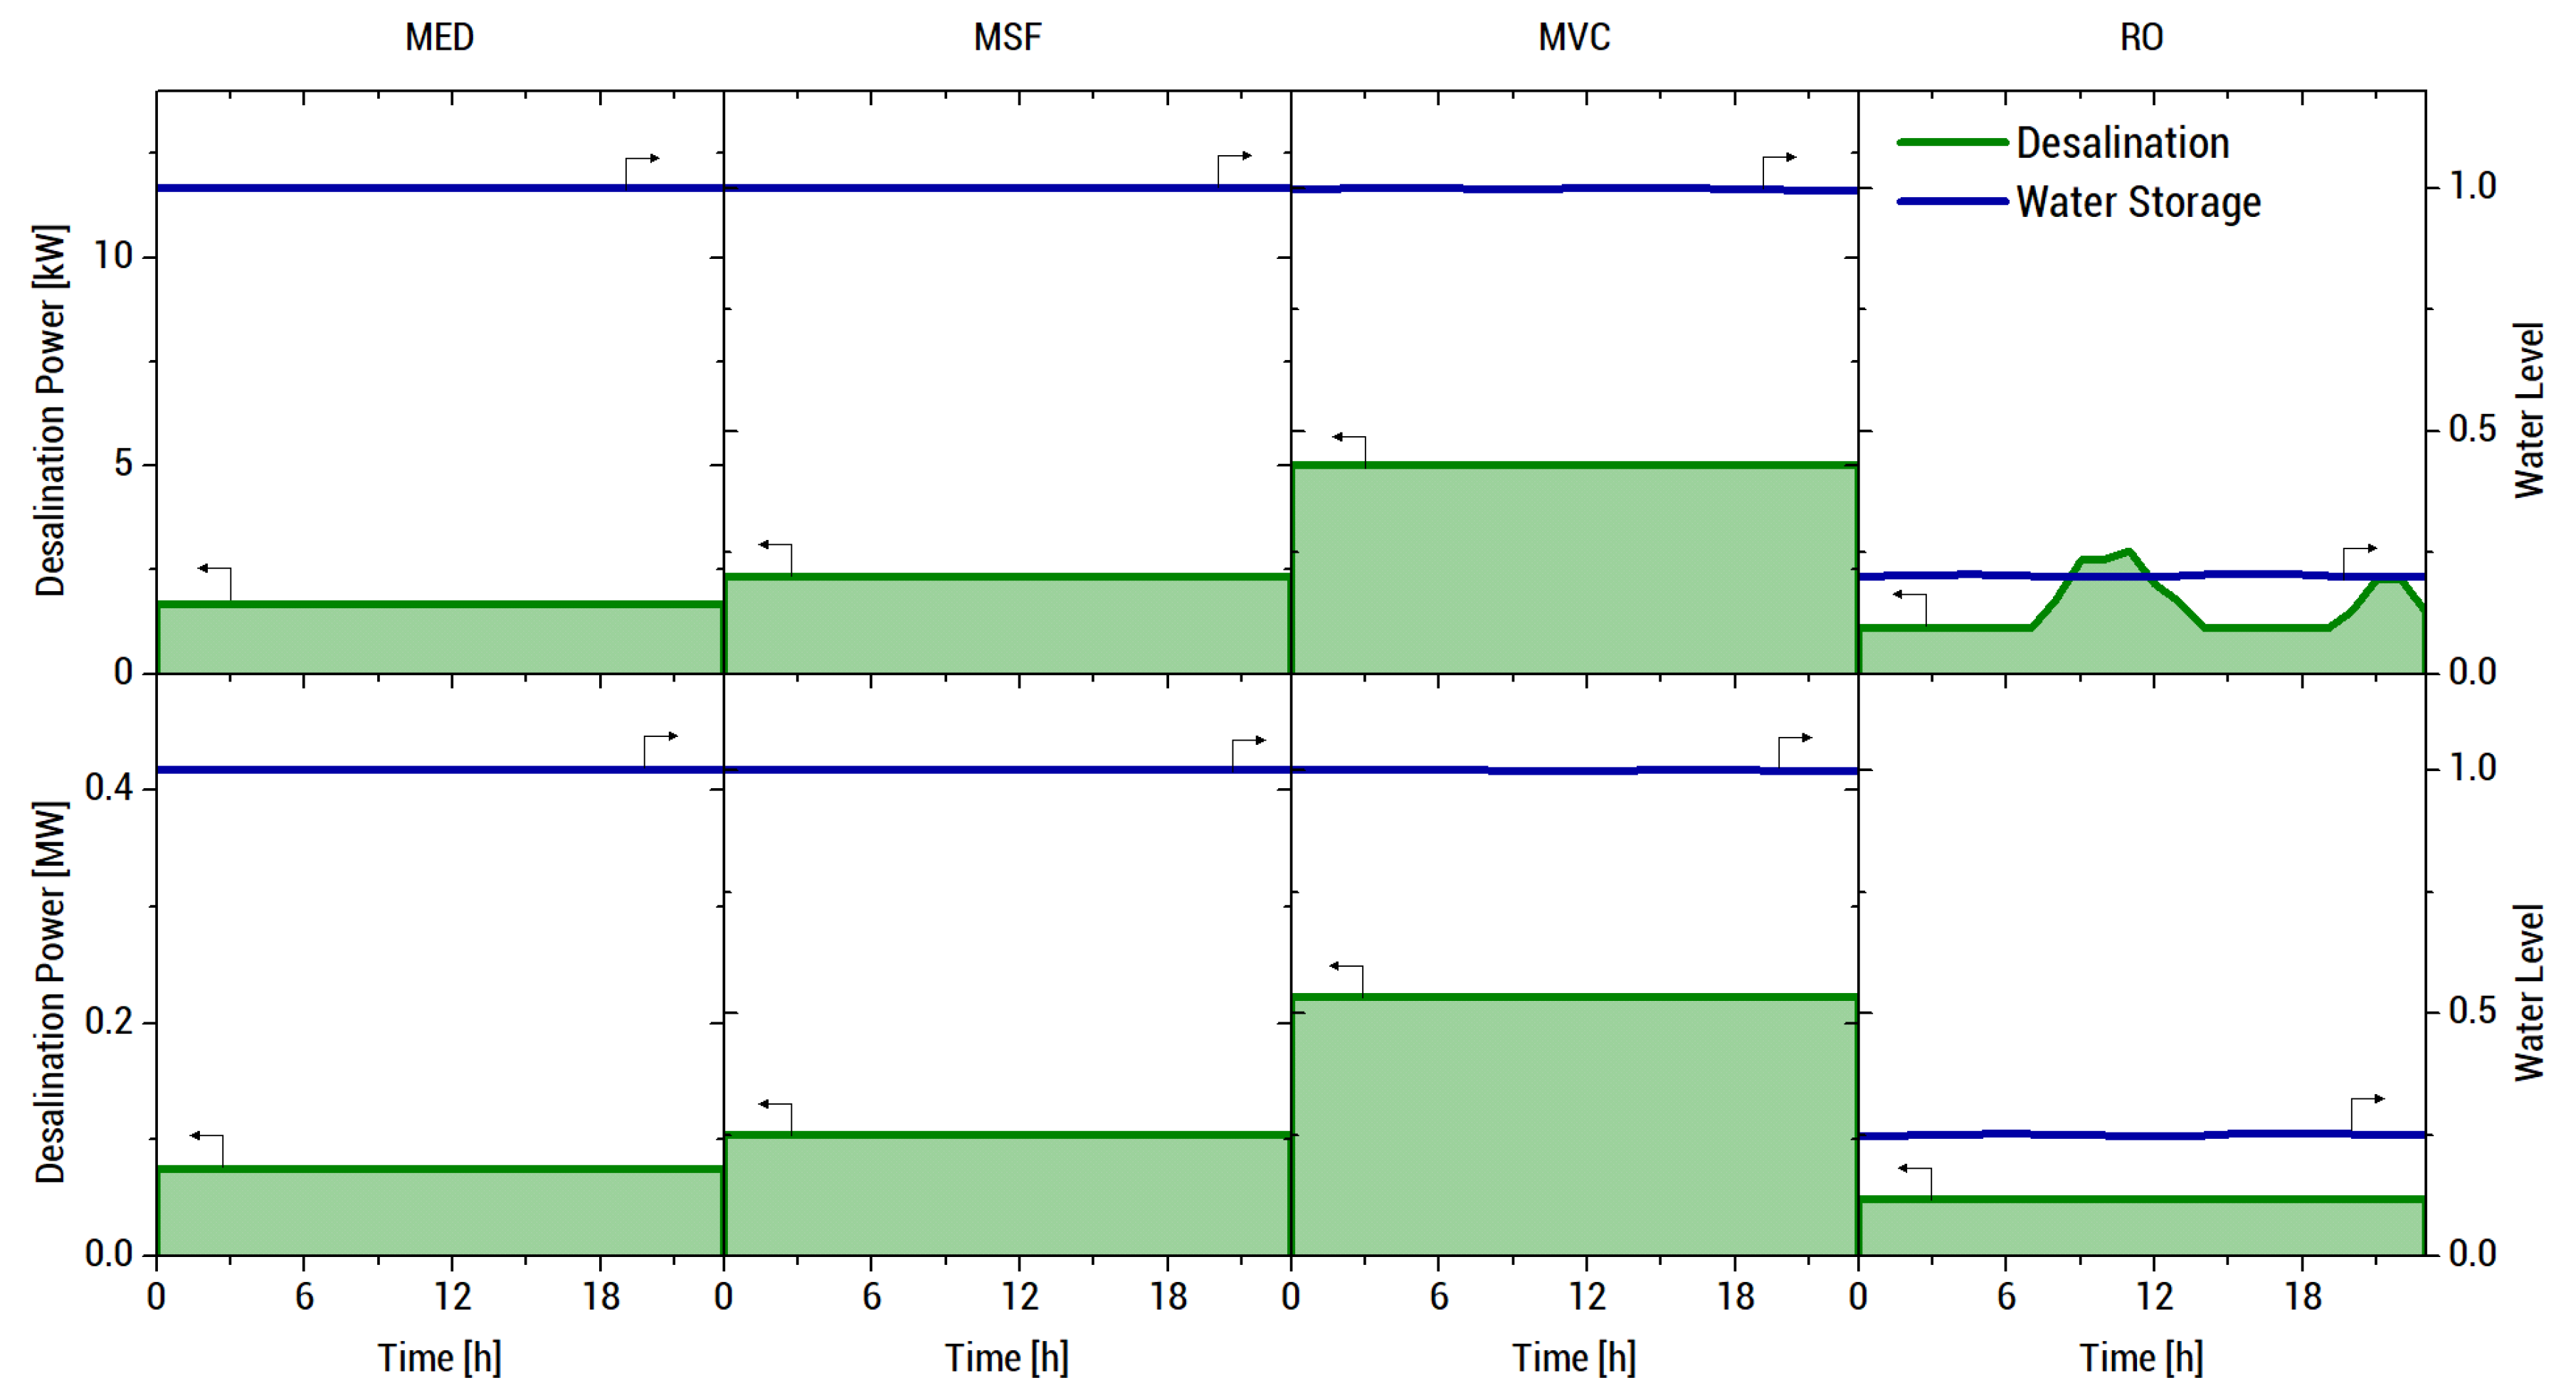
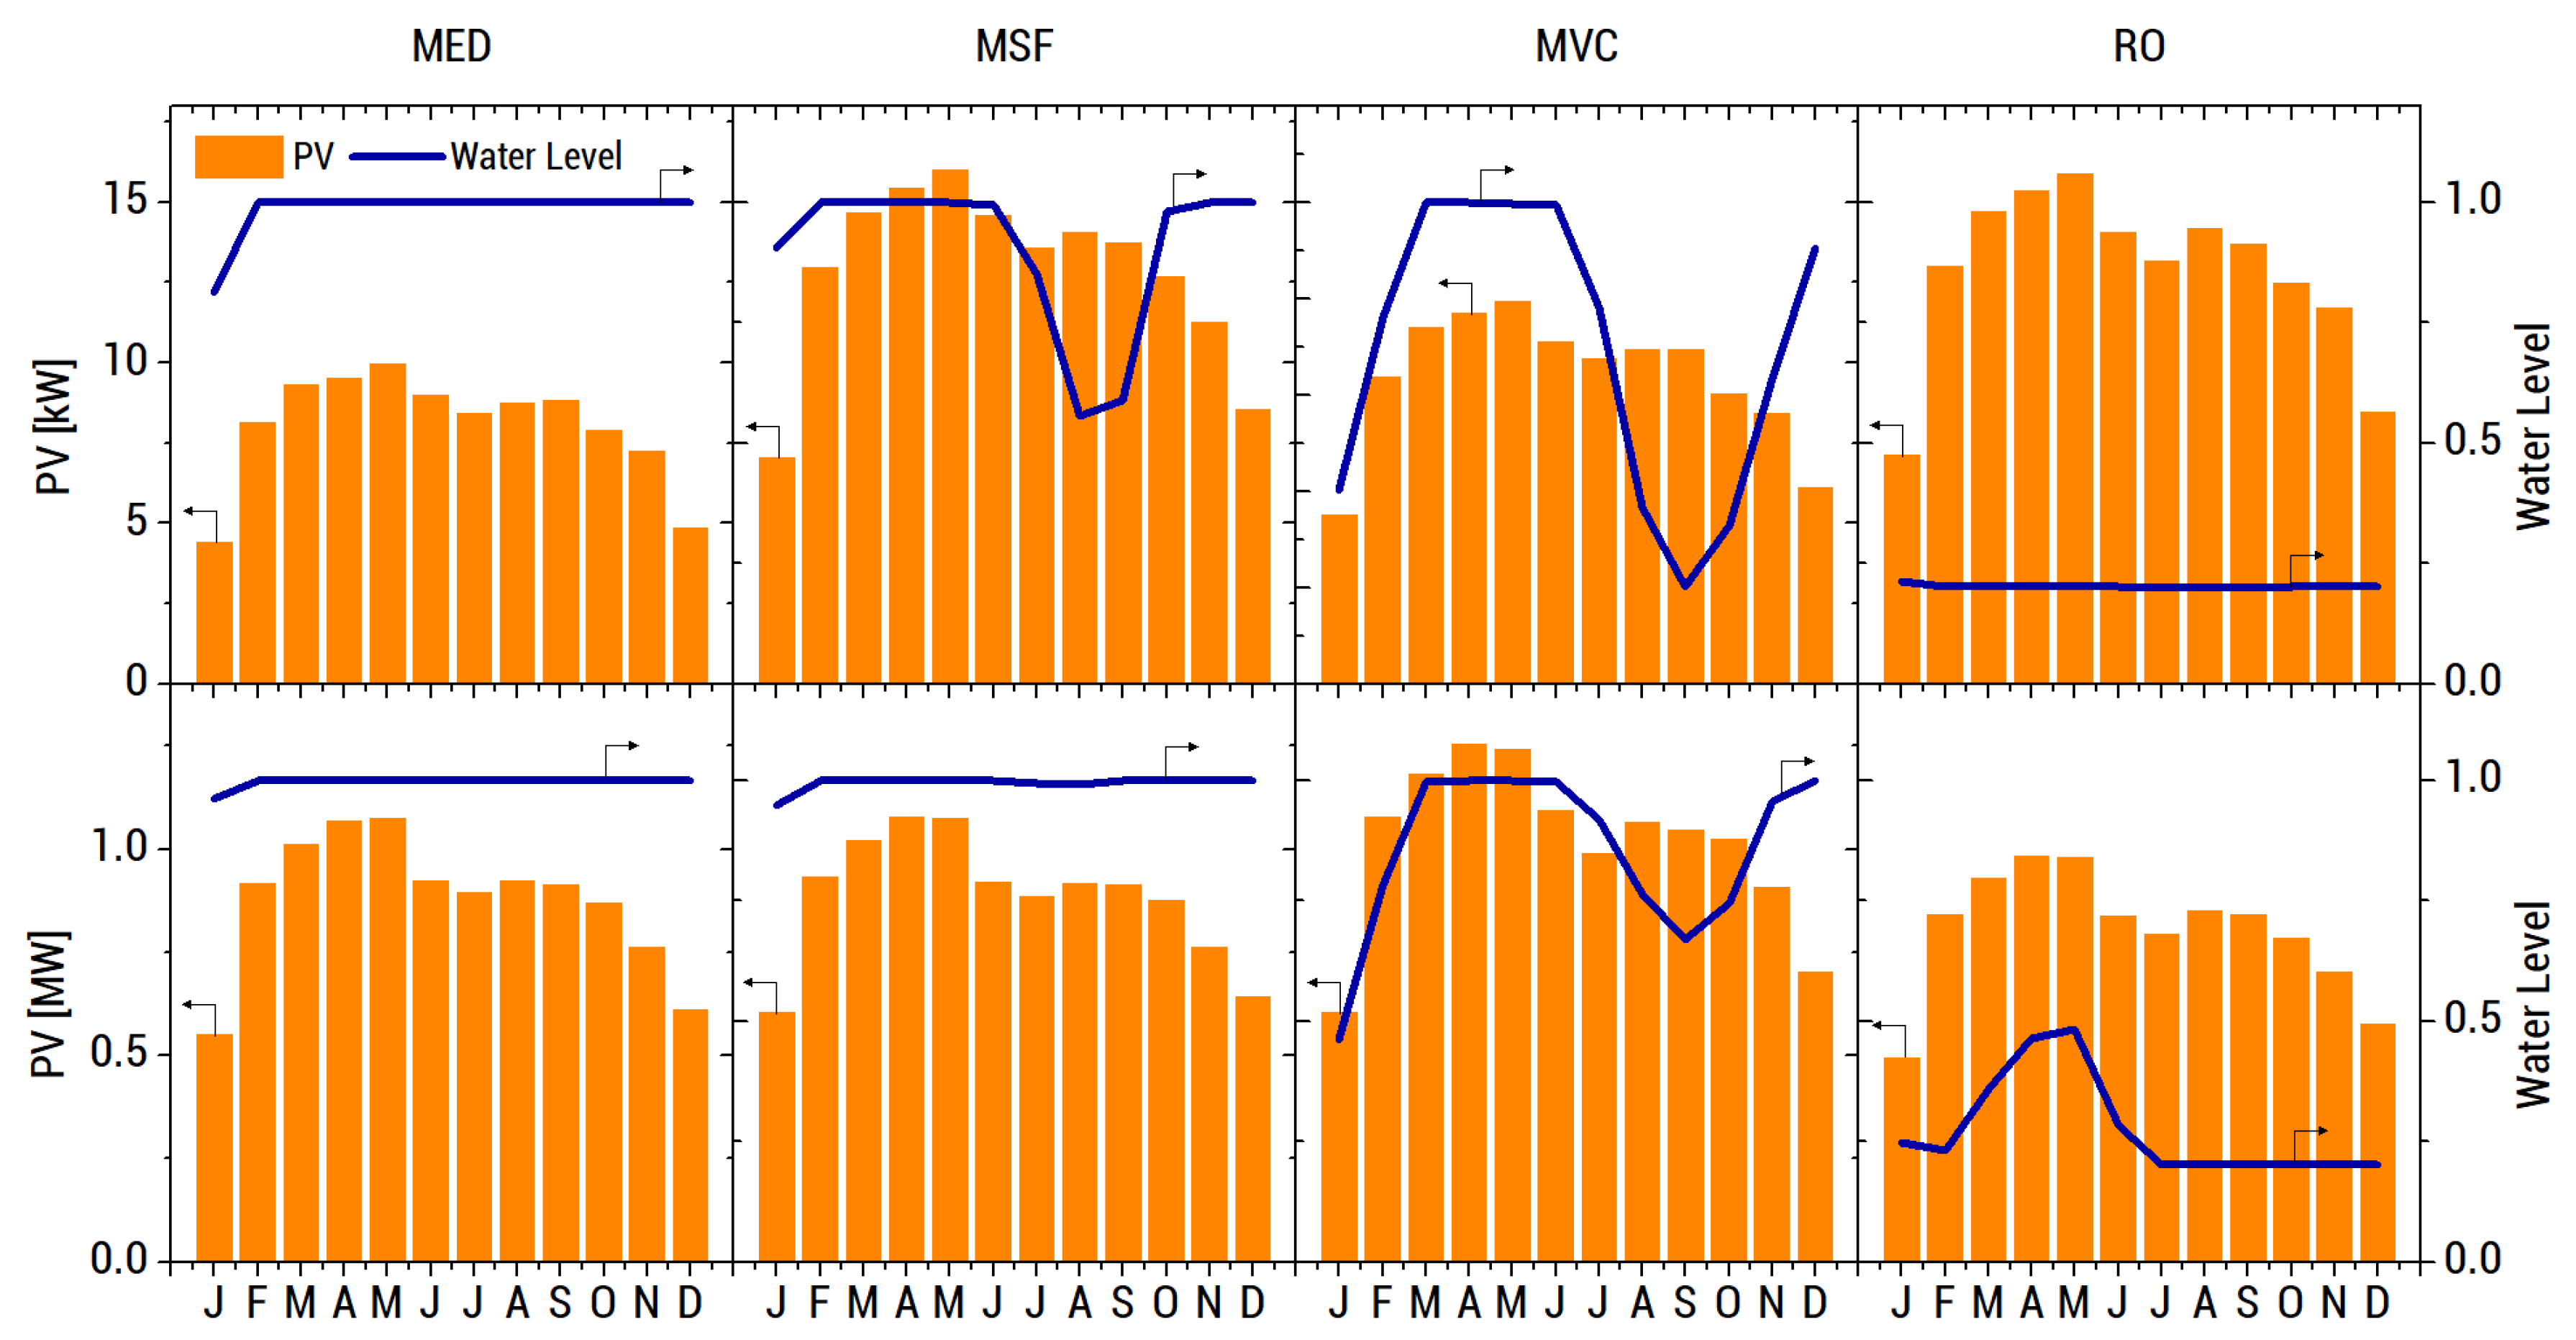
3.2. Hourly Power and Water Flows
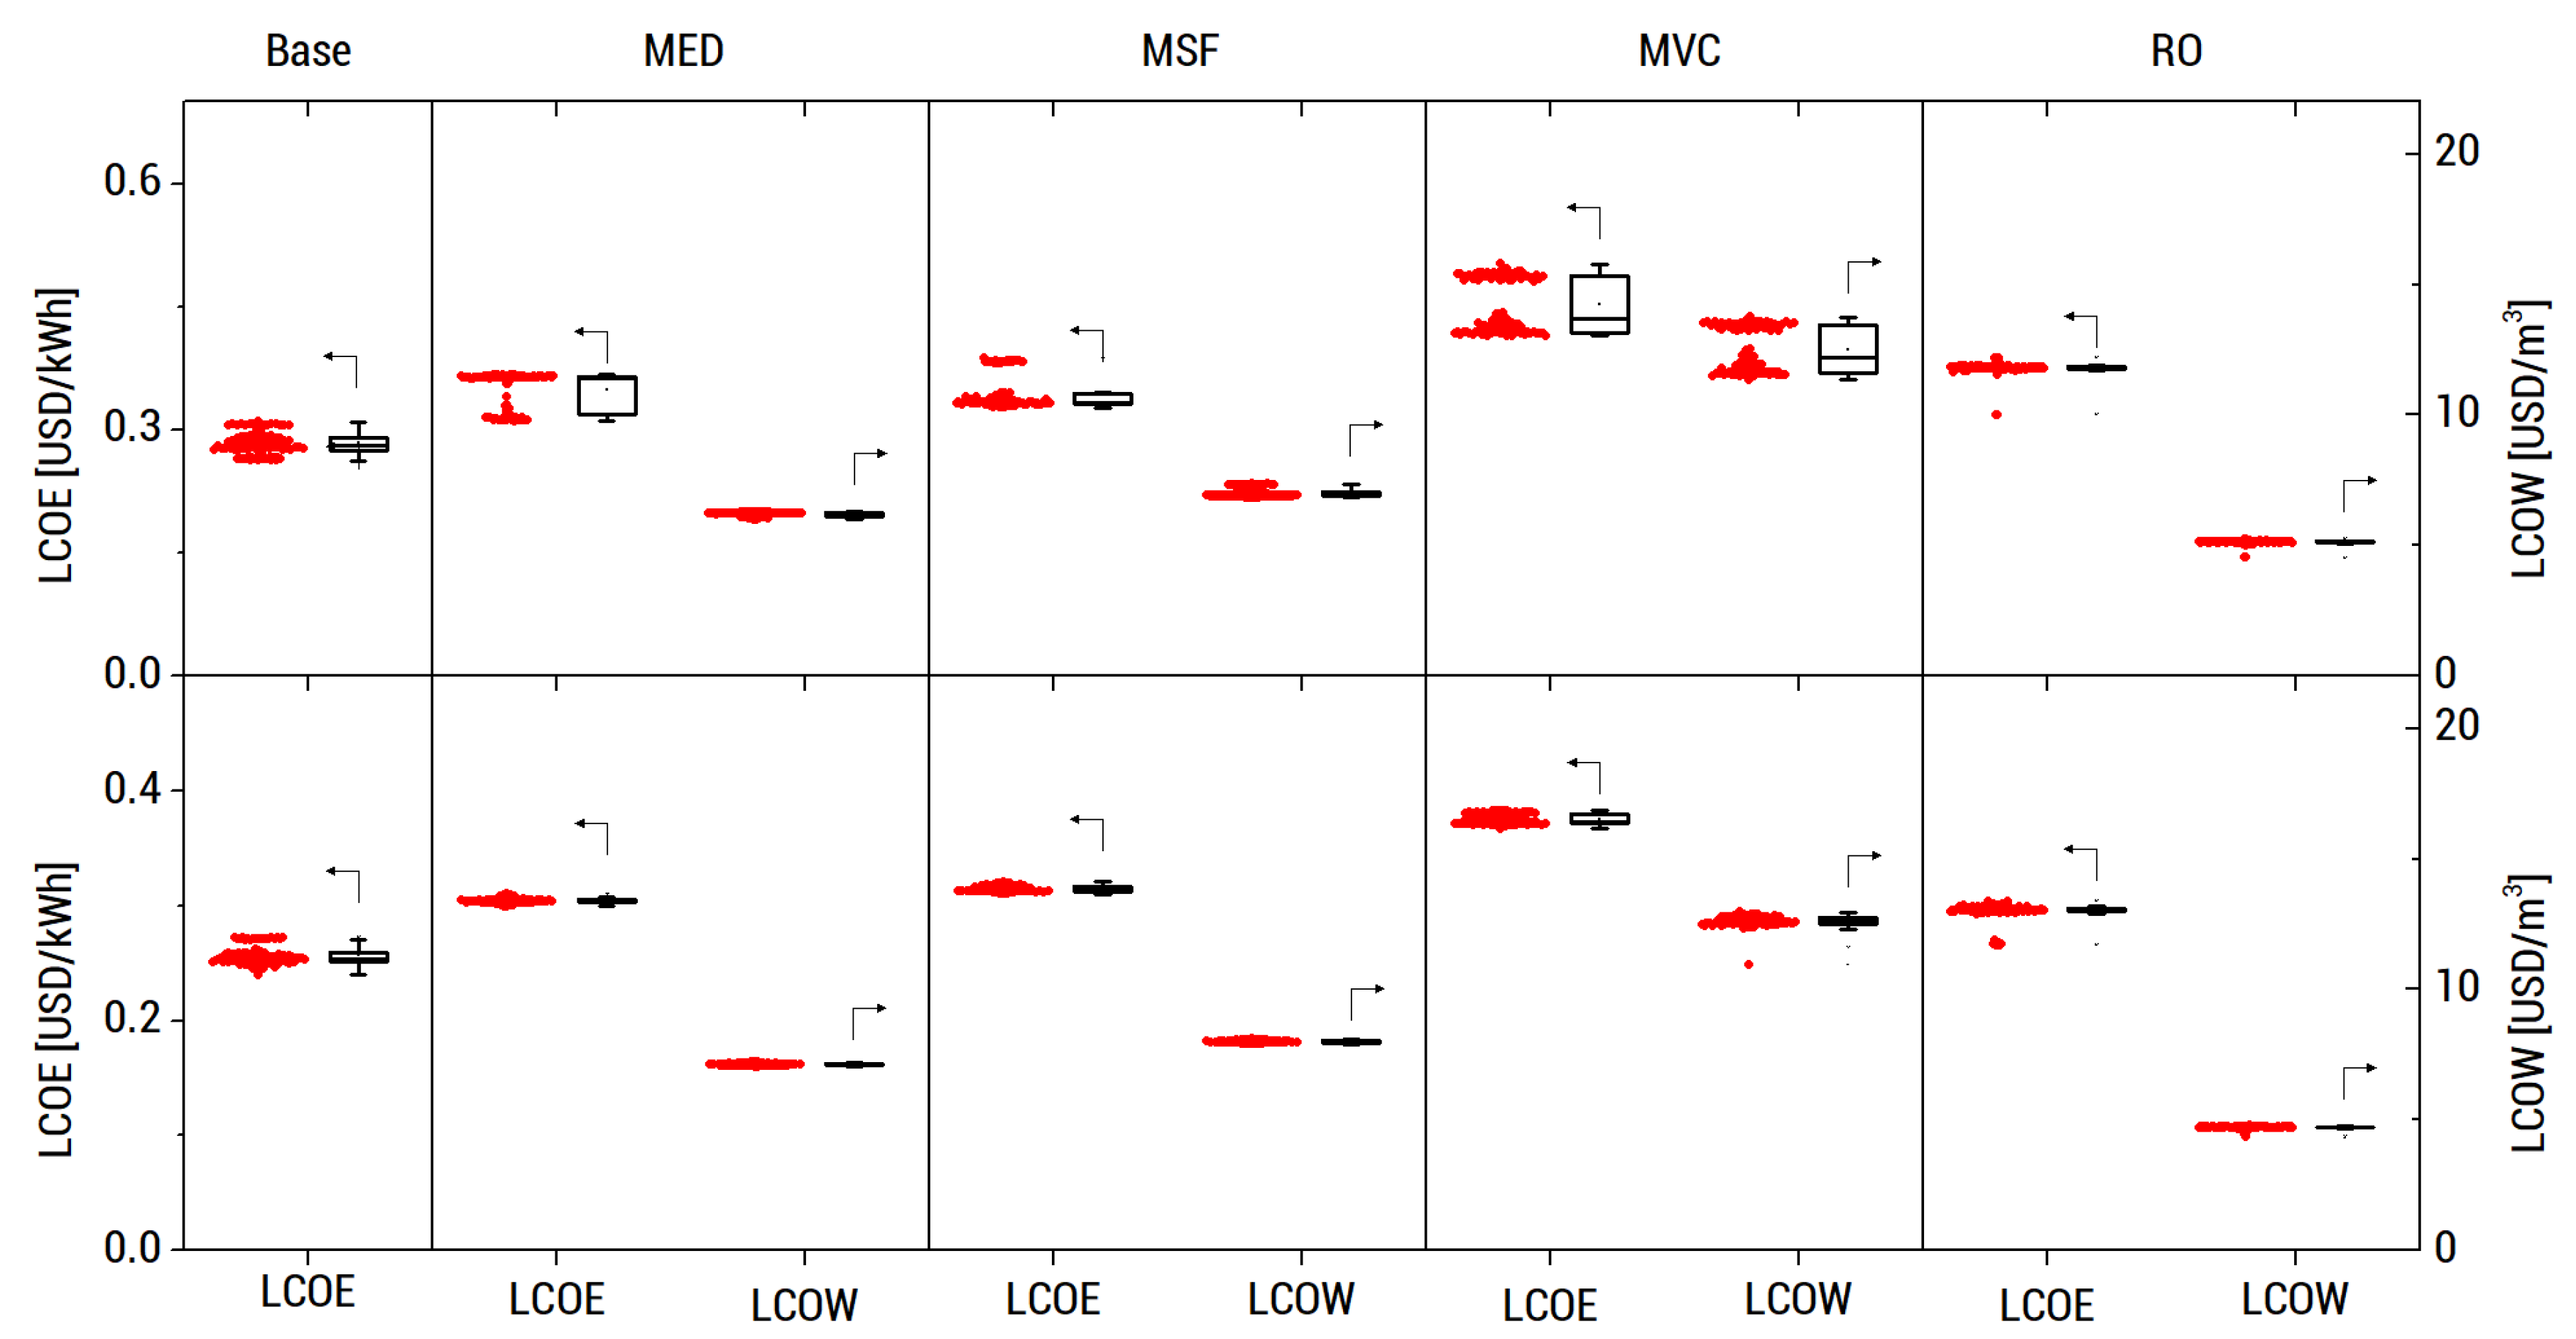
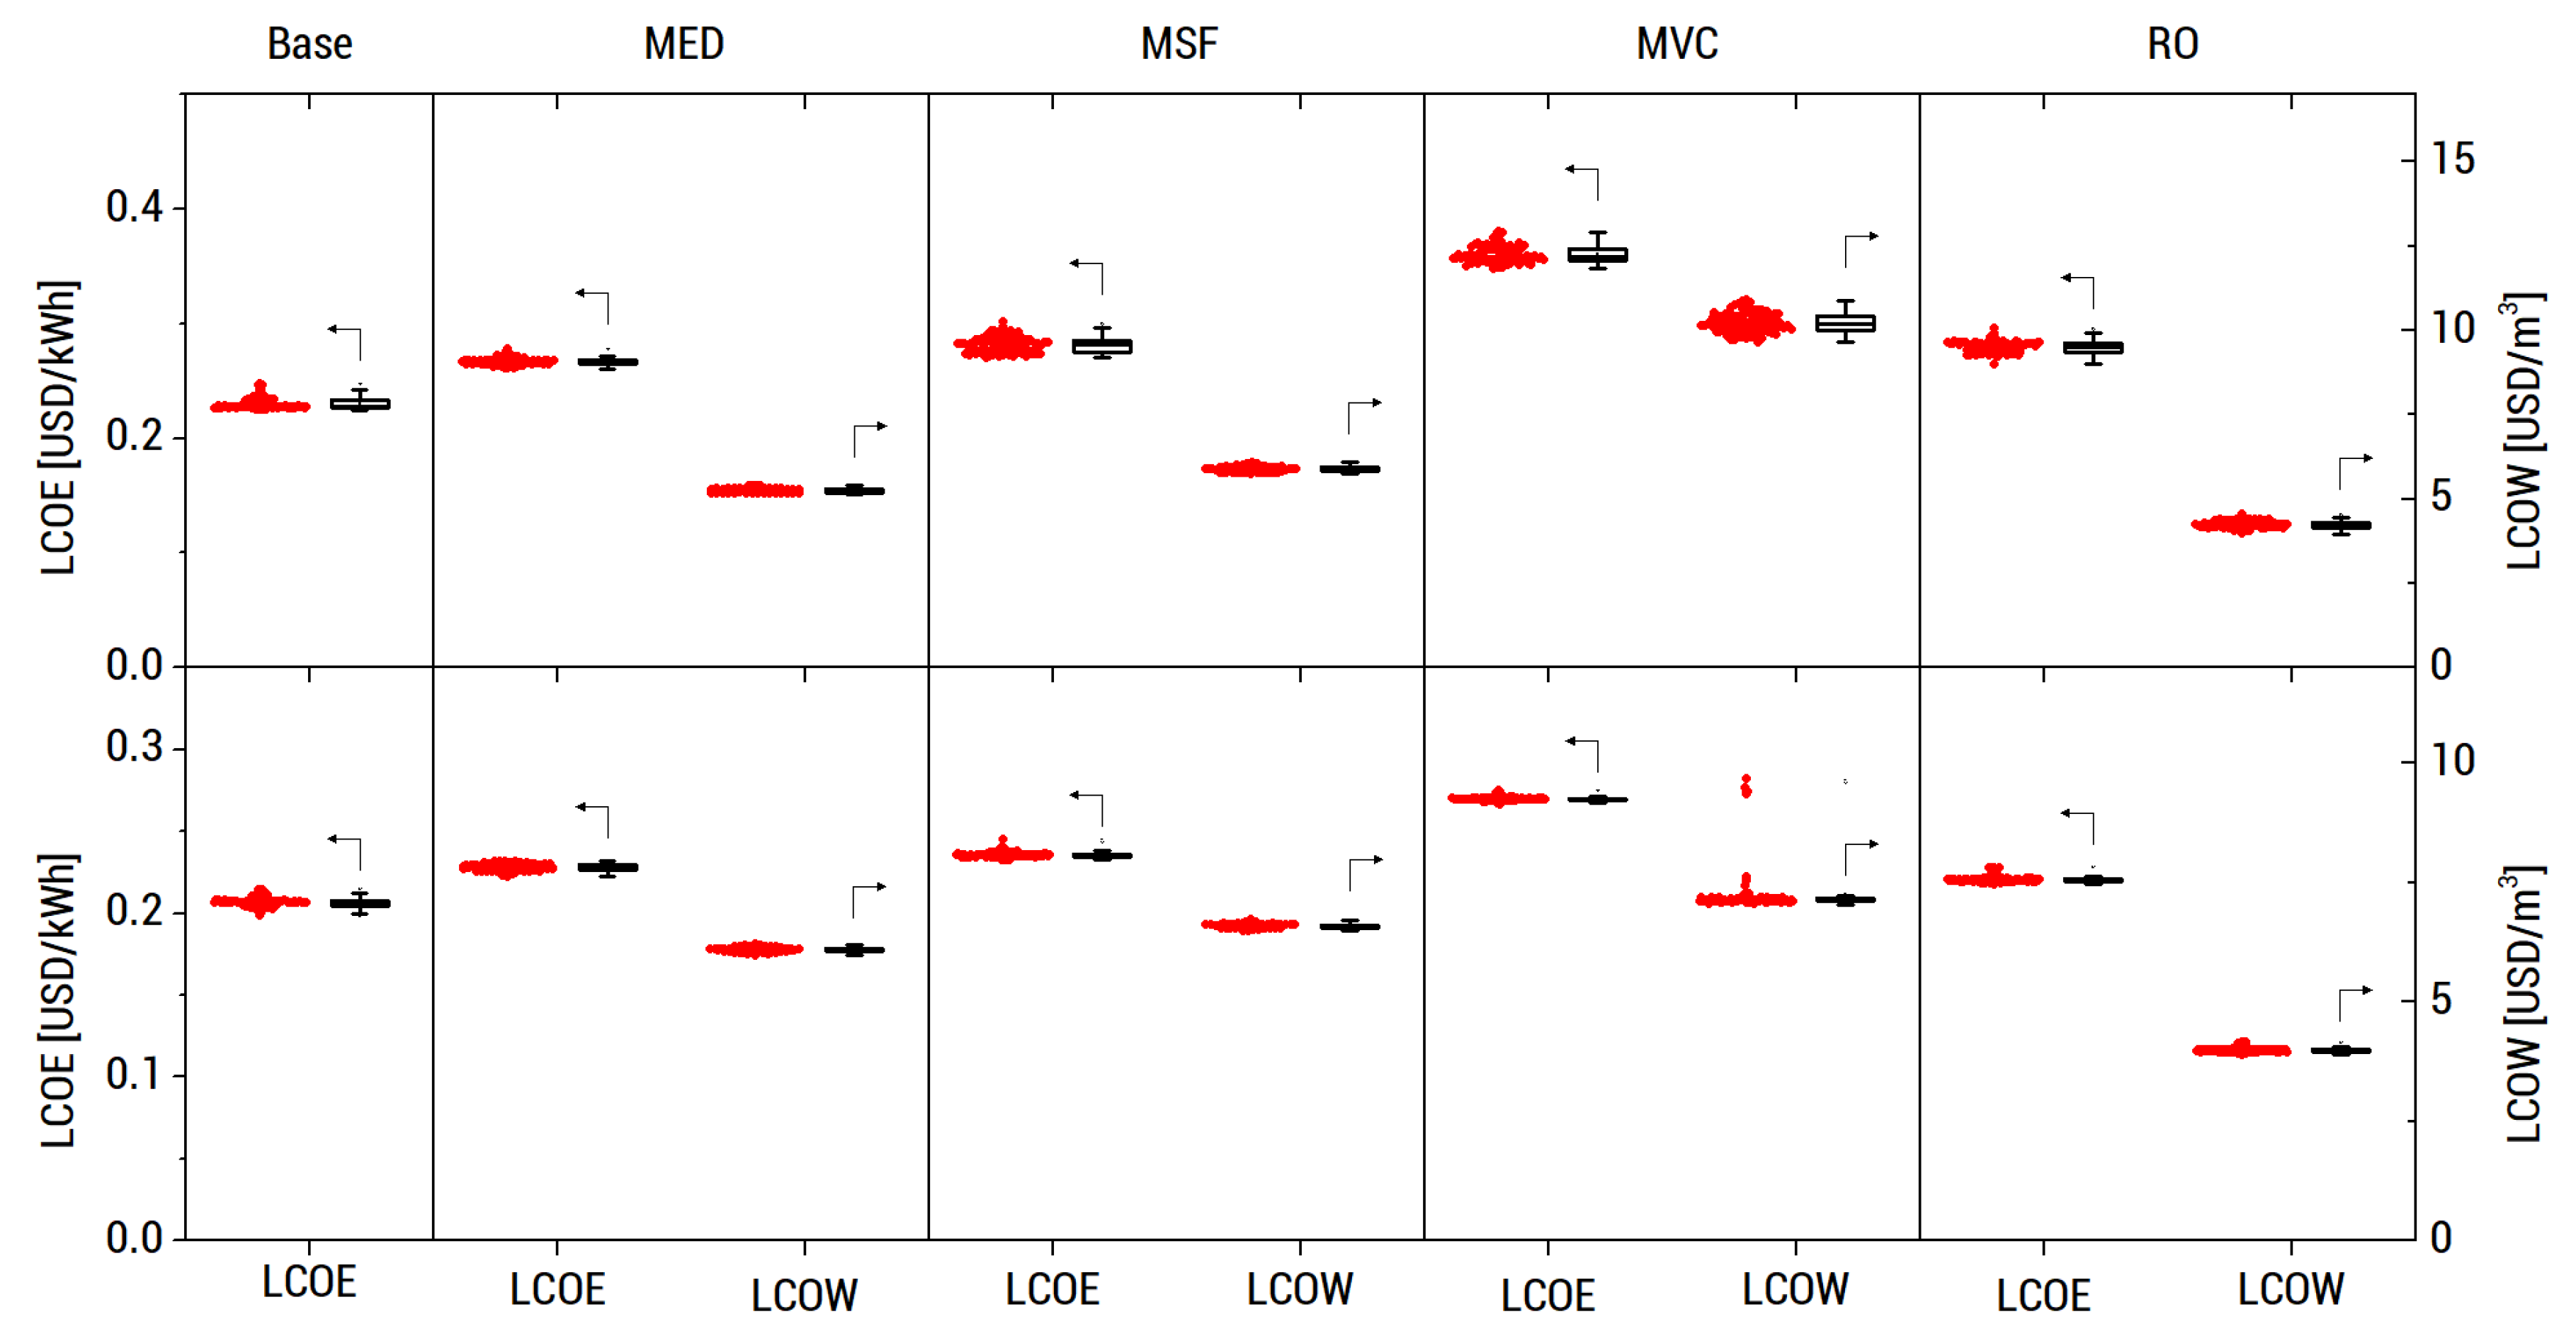
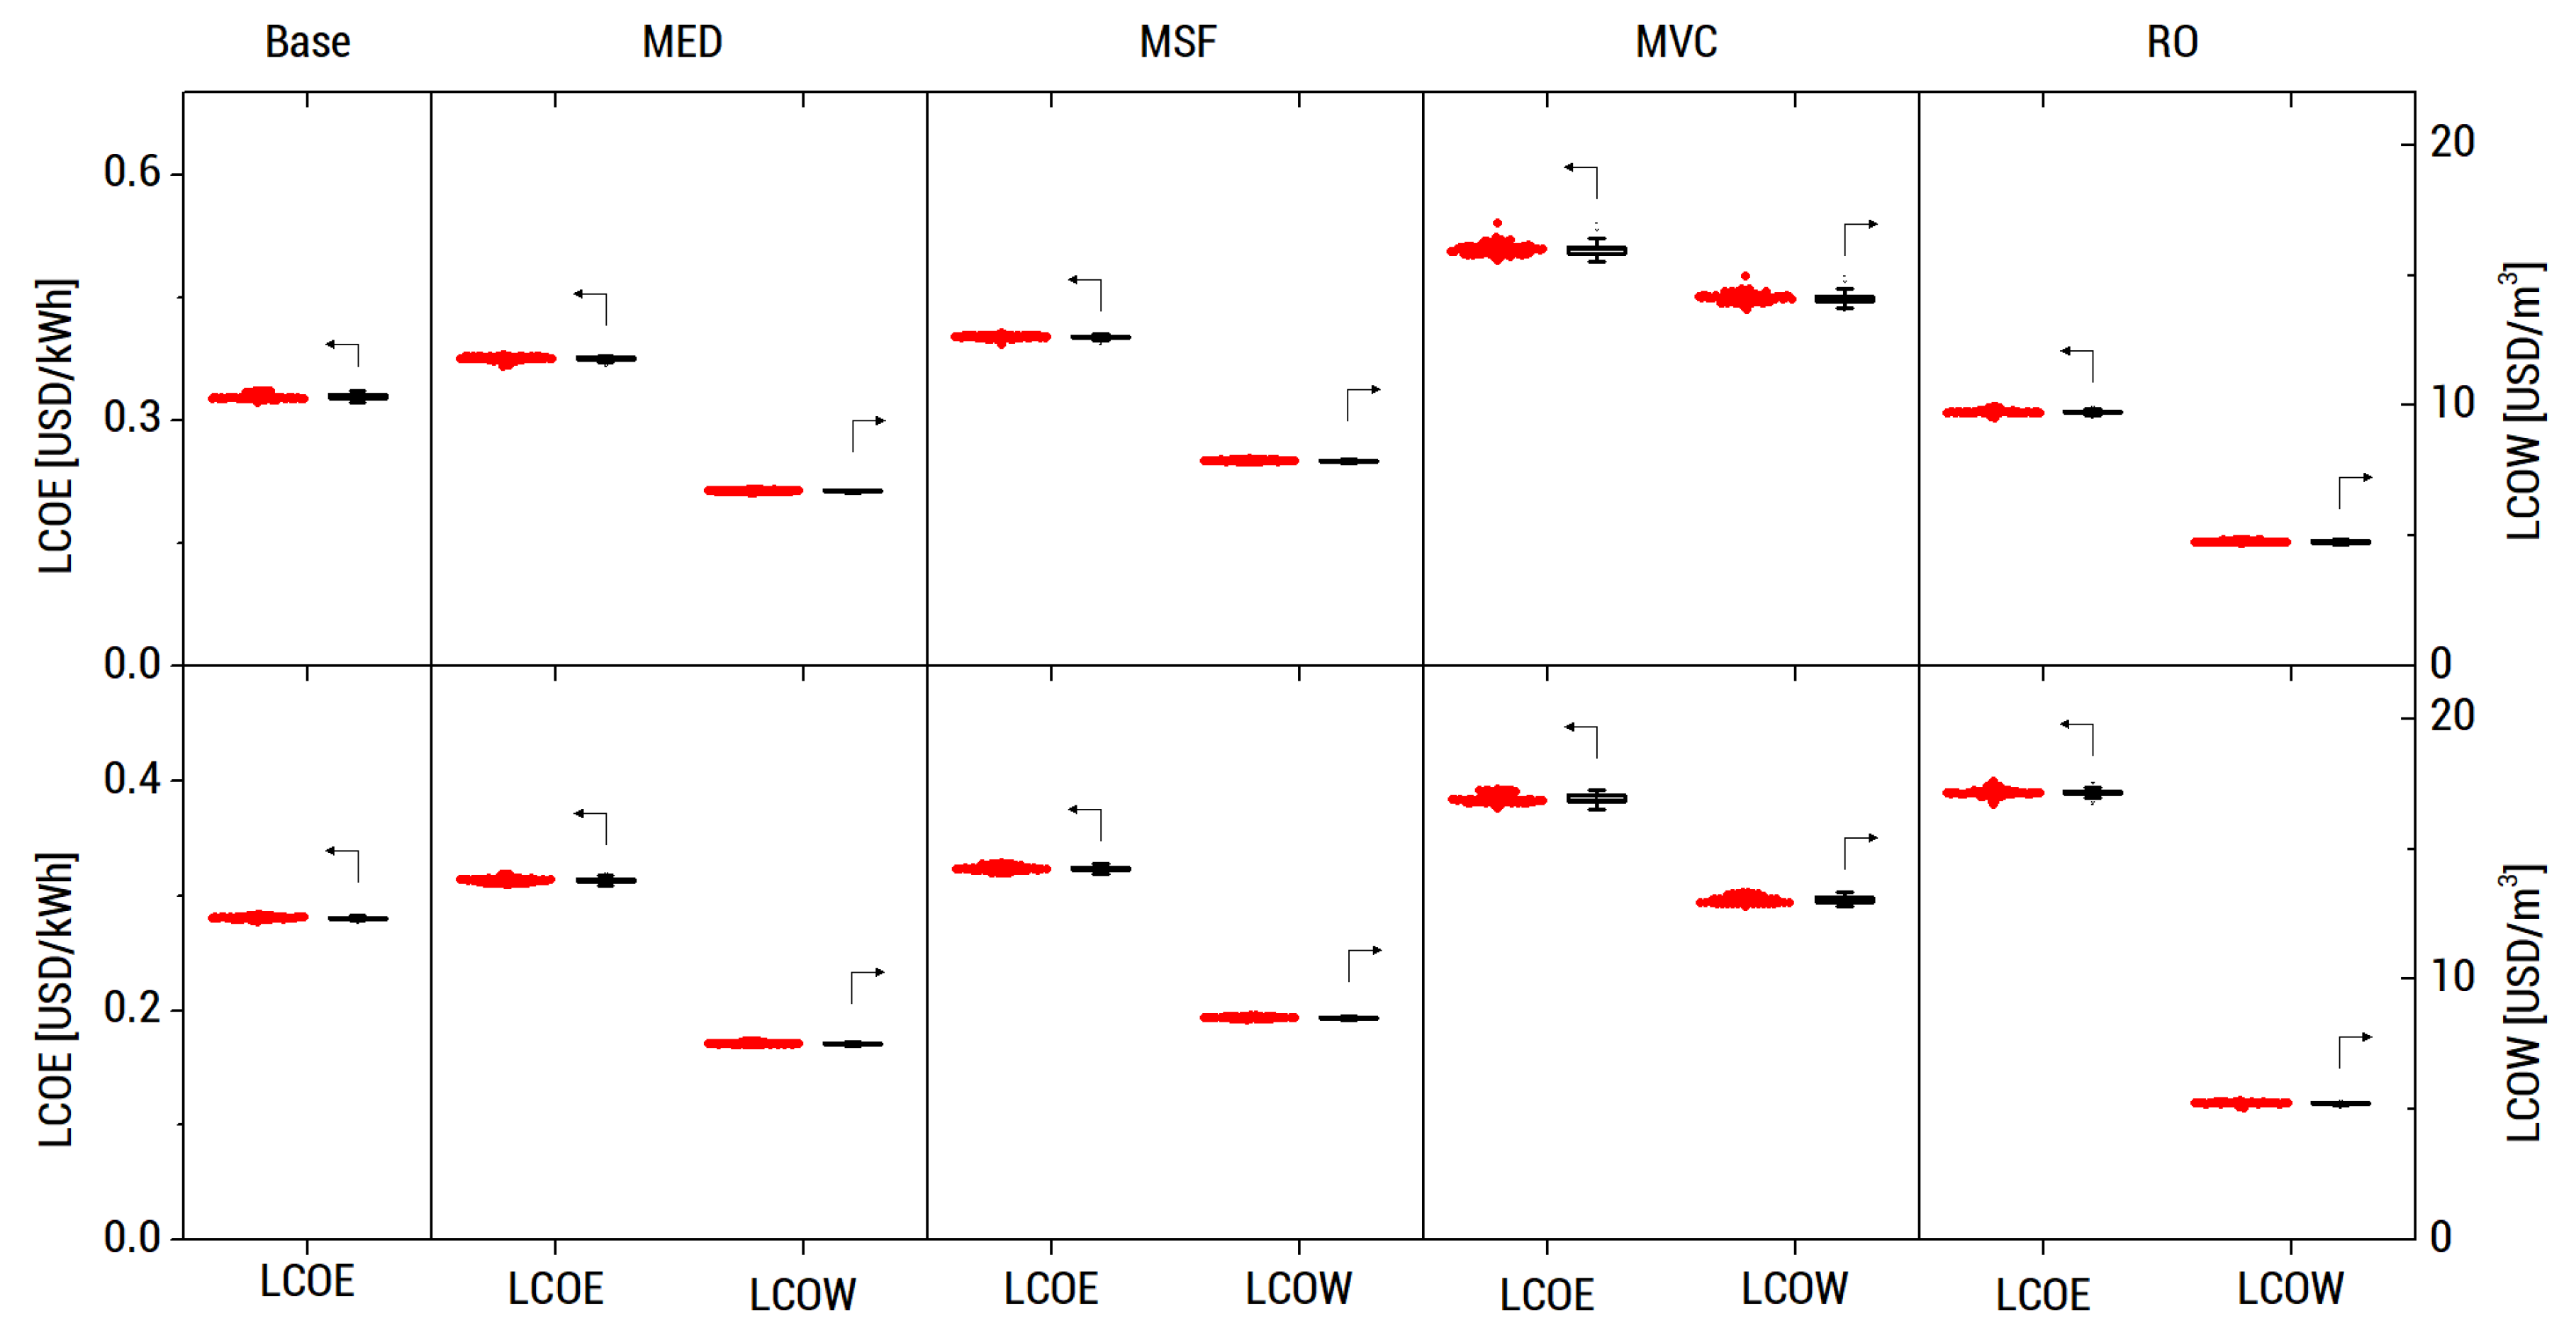
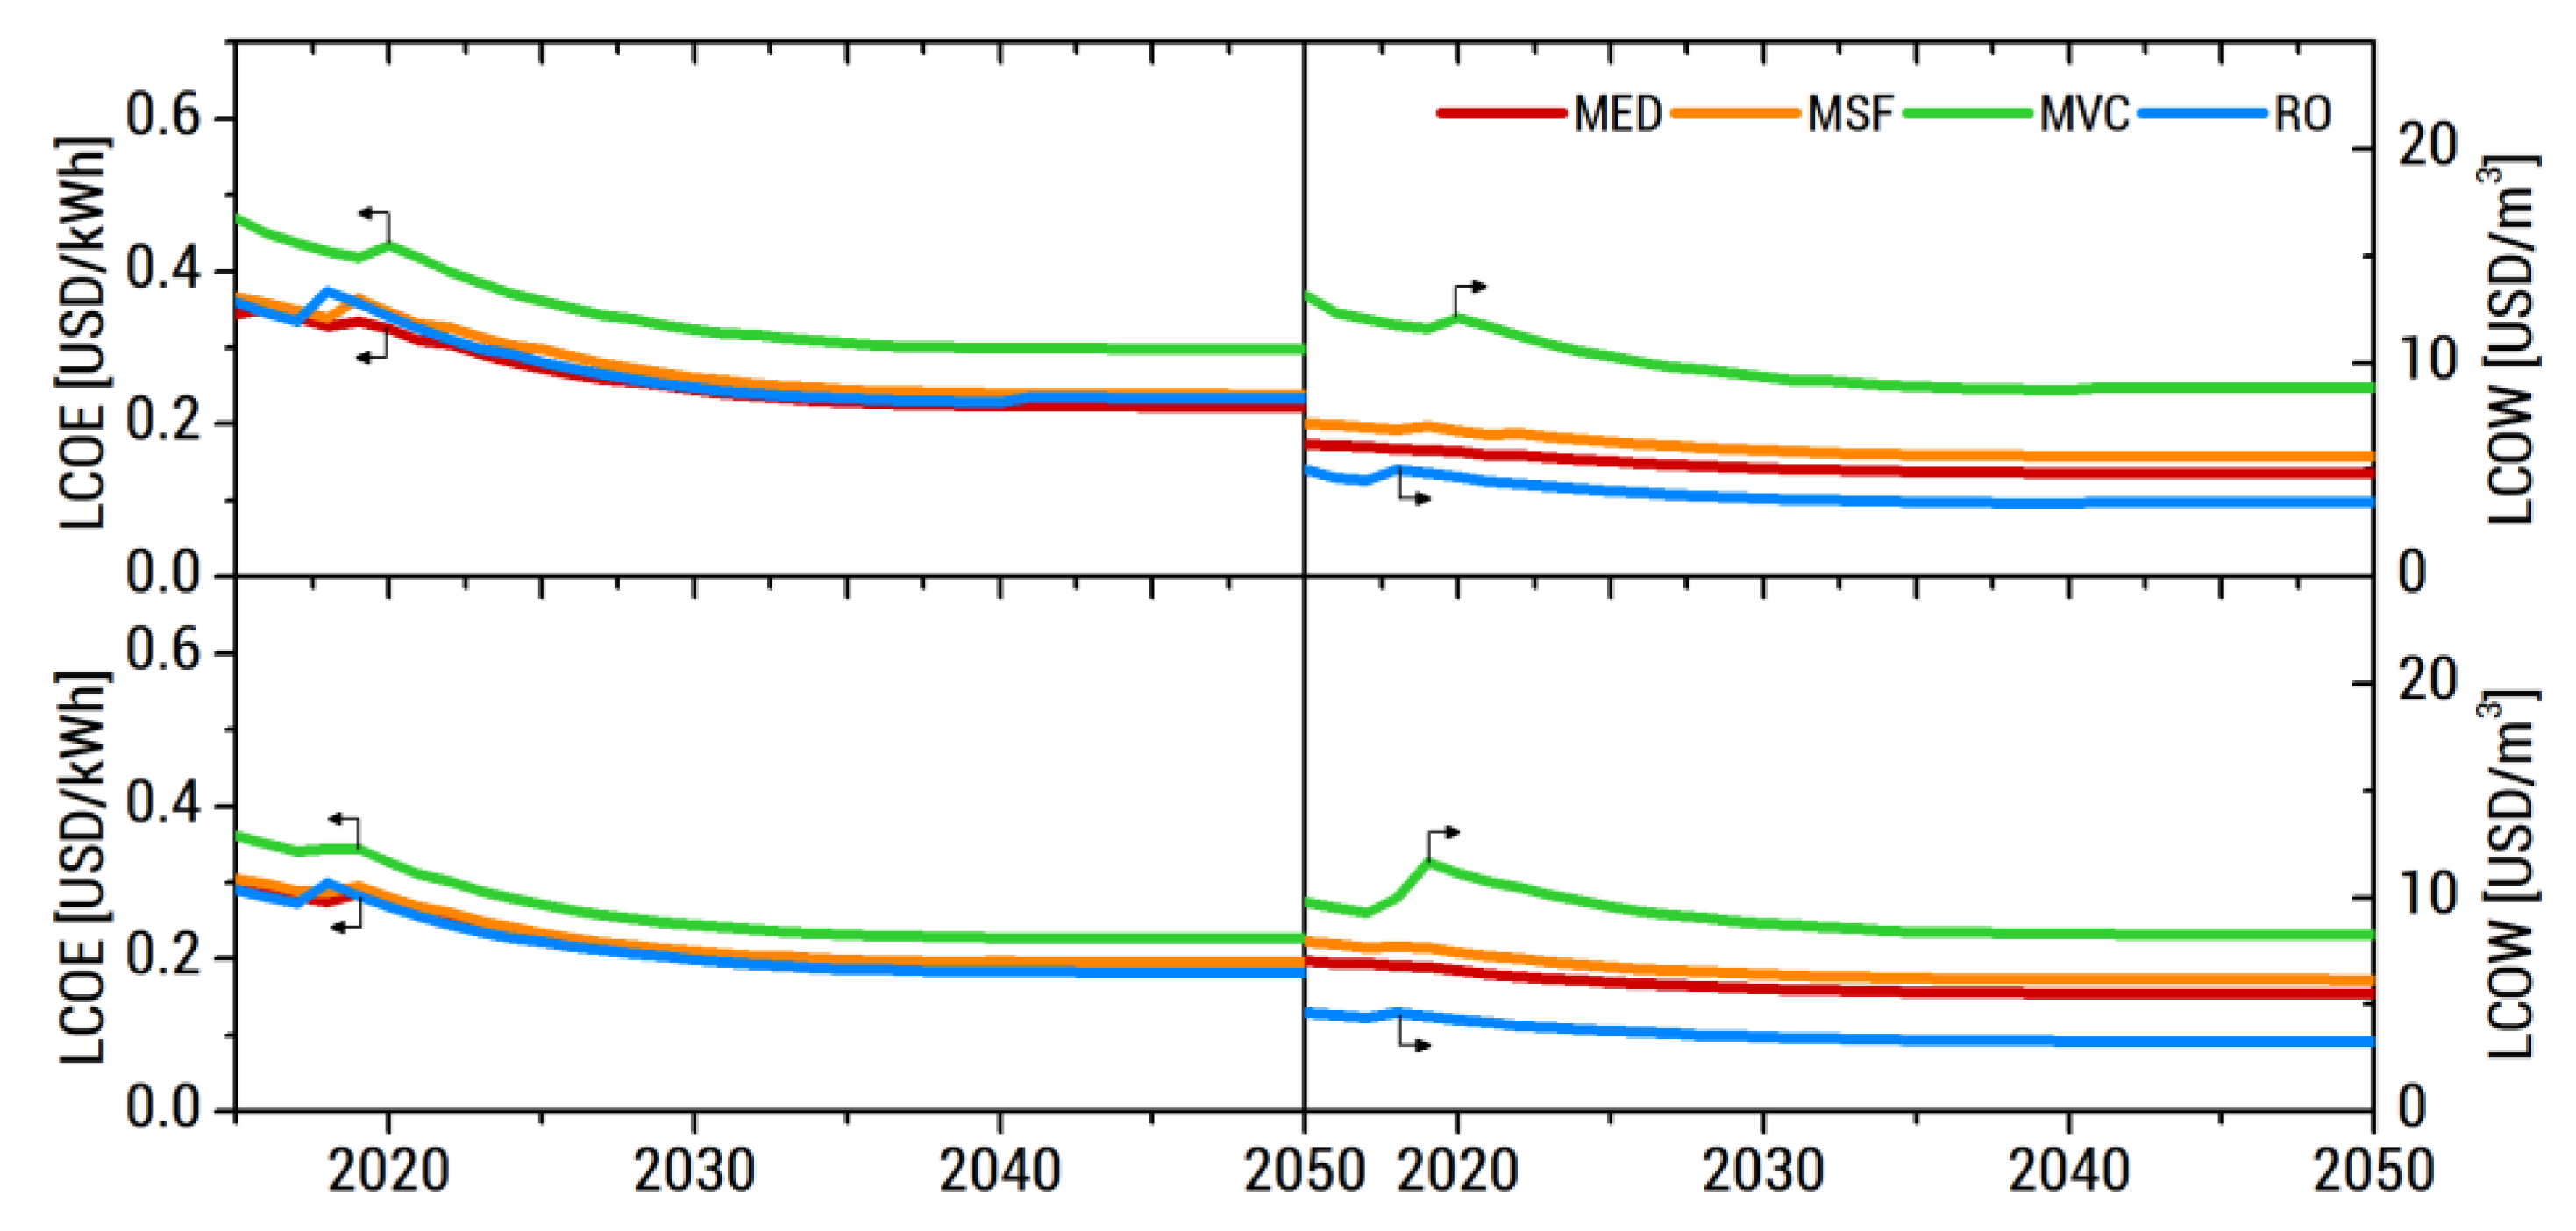
3.3. Future LCOE and LCOW
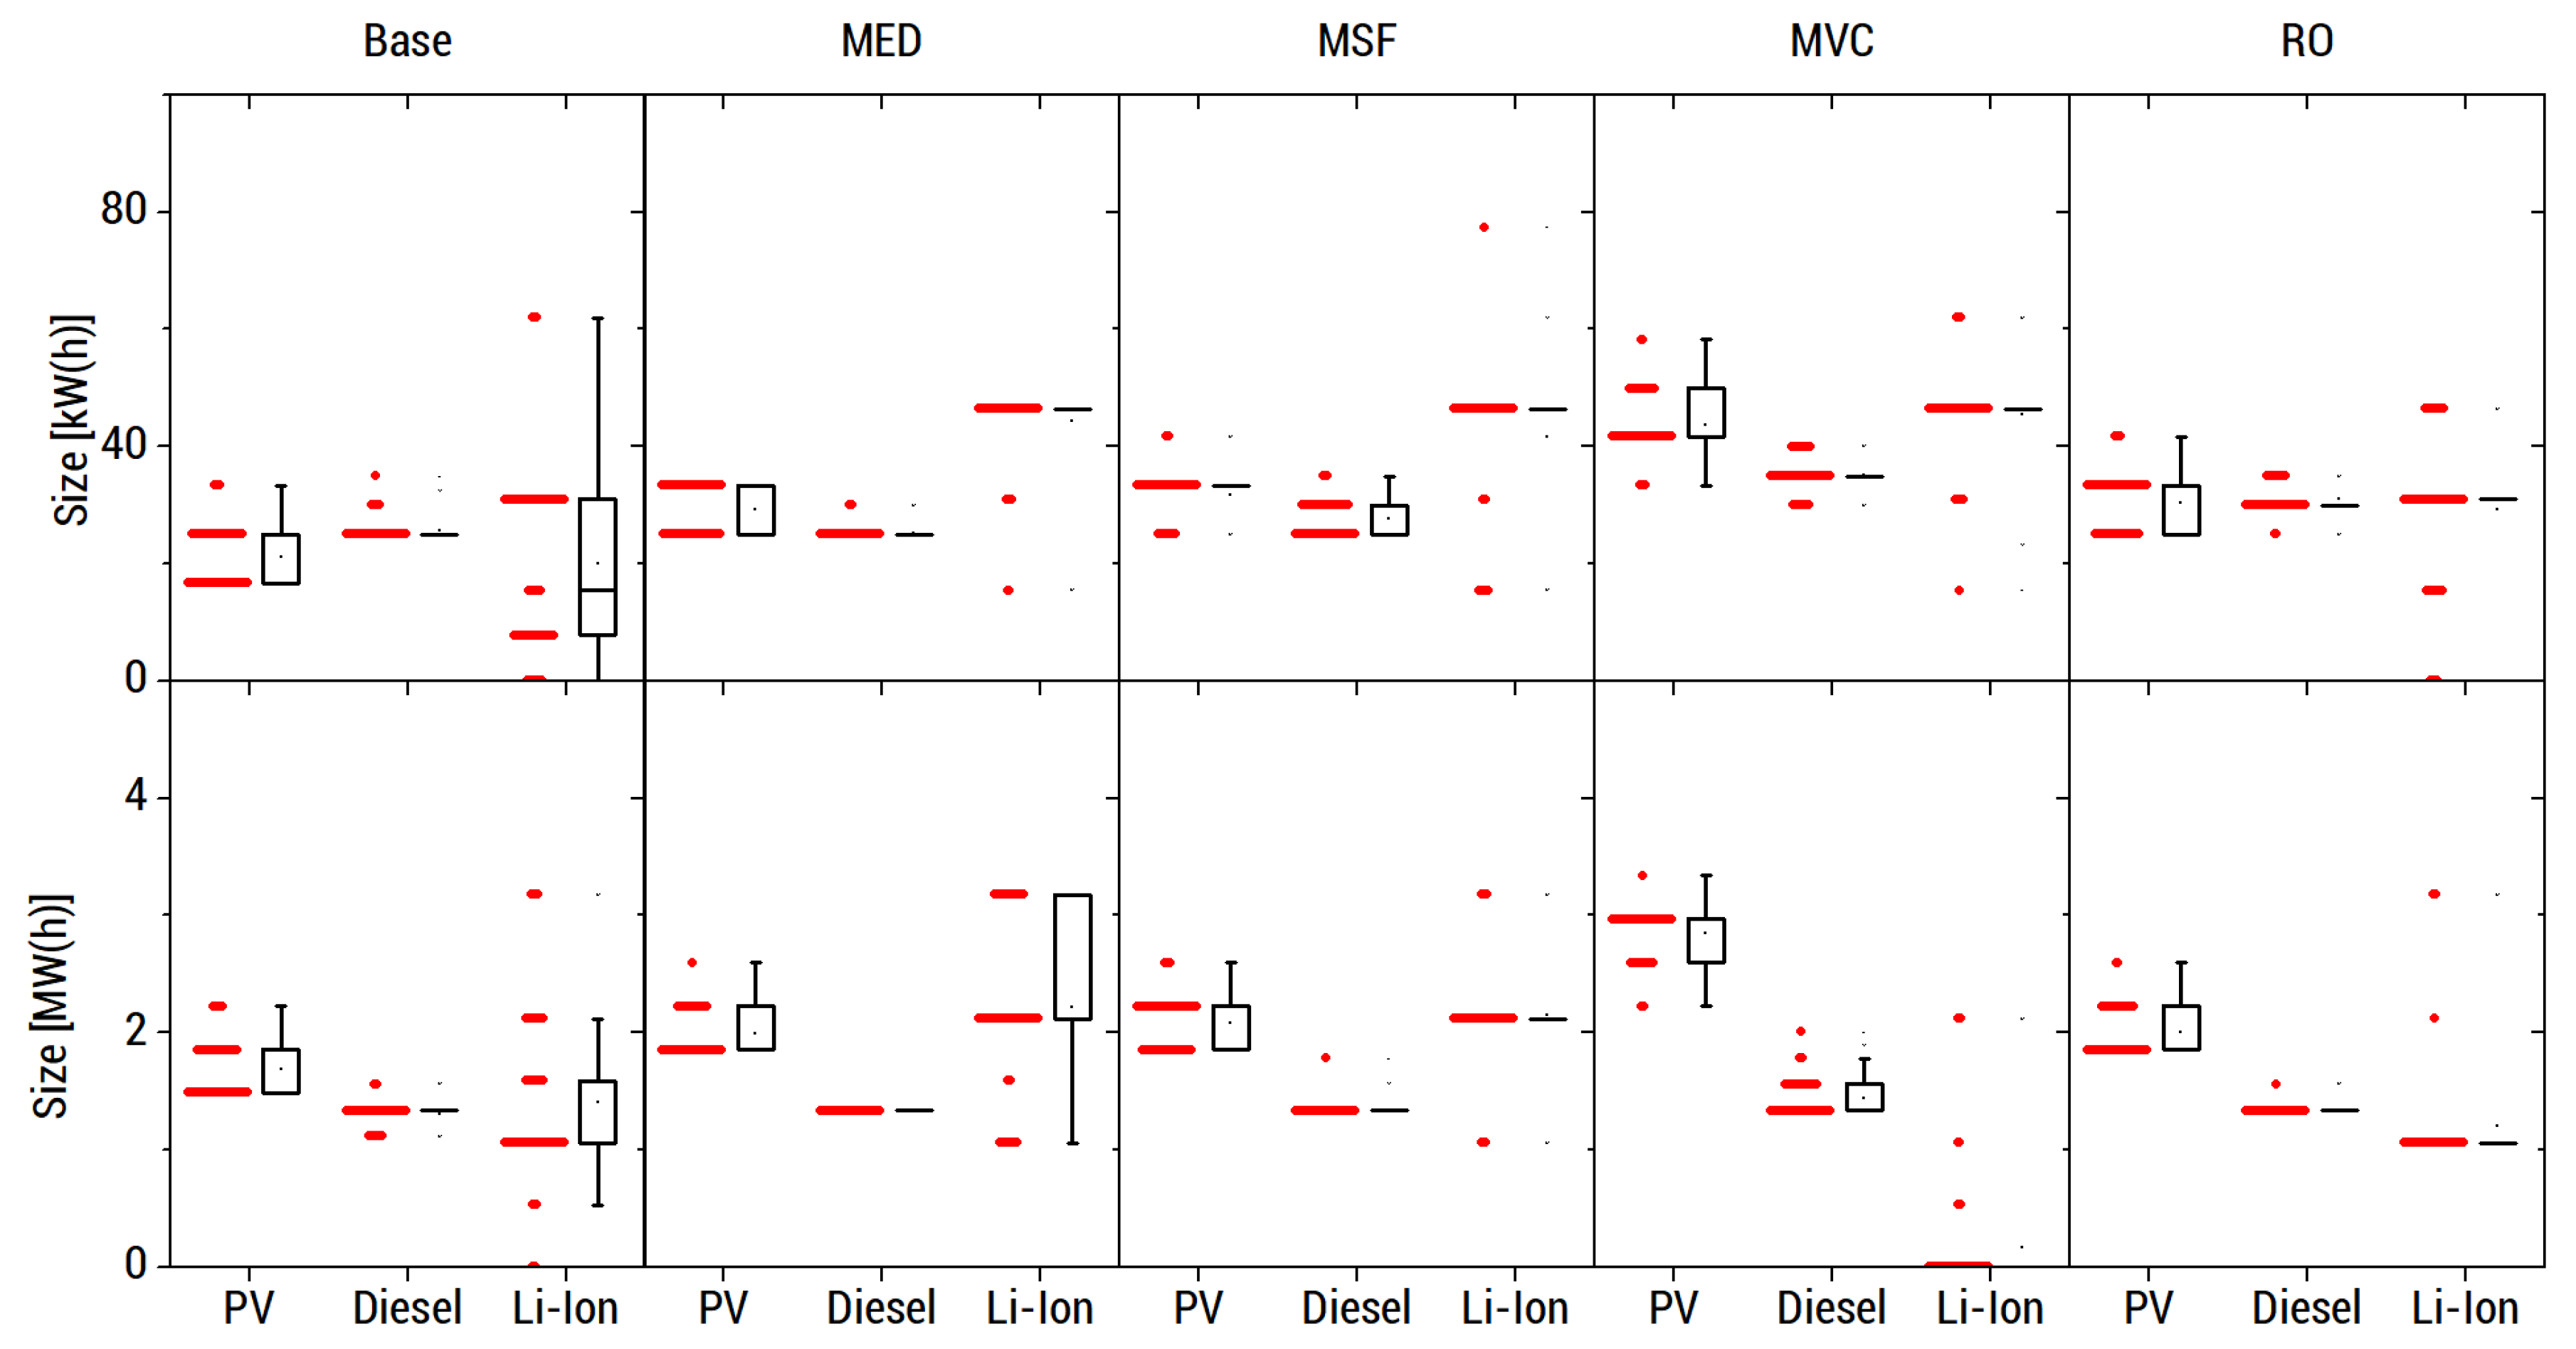
3.4. Sensitivity Analysis
3.4.1. −25% Overnight Fuel Cost
3.4.2. +25% Overnight Fuel Cost
4. Discussion
5. Conclusions
Author Contributions
Funding
Acknowledgments
Conflicts of Interest
Appendix A
A.1. Energy System Models
A.1.1. Solar PV
A.1.2. Diesel
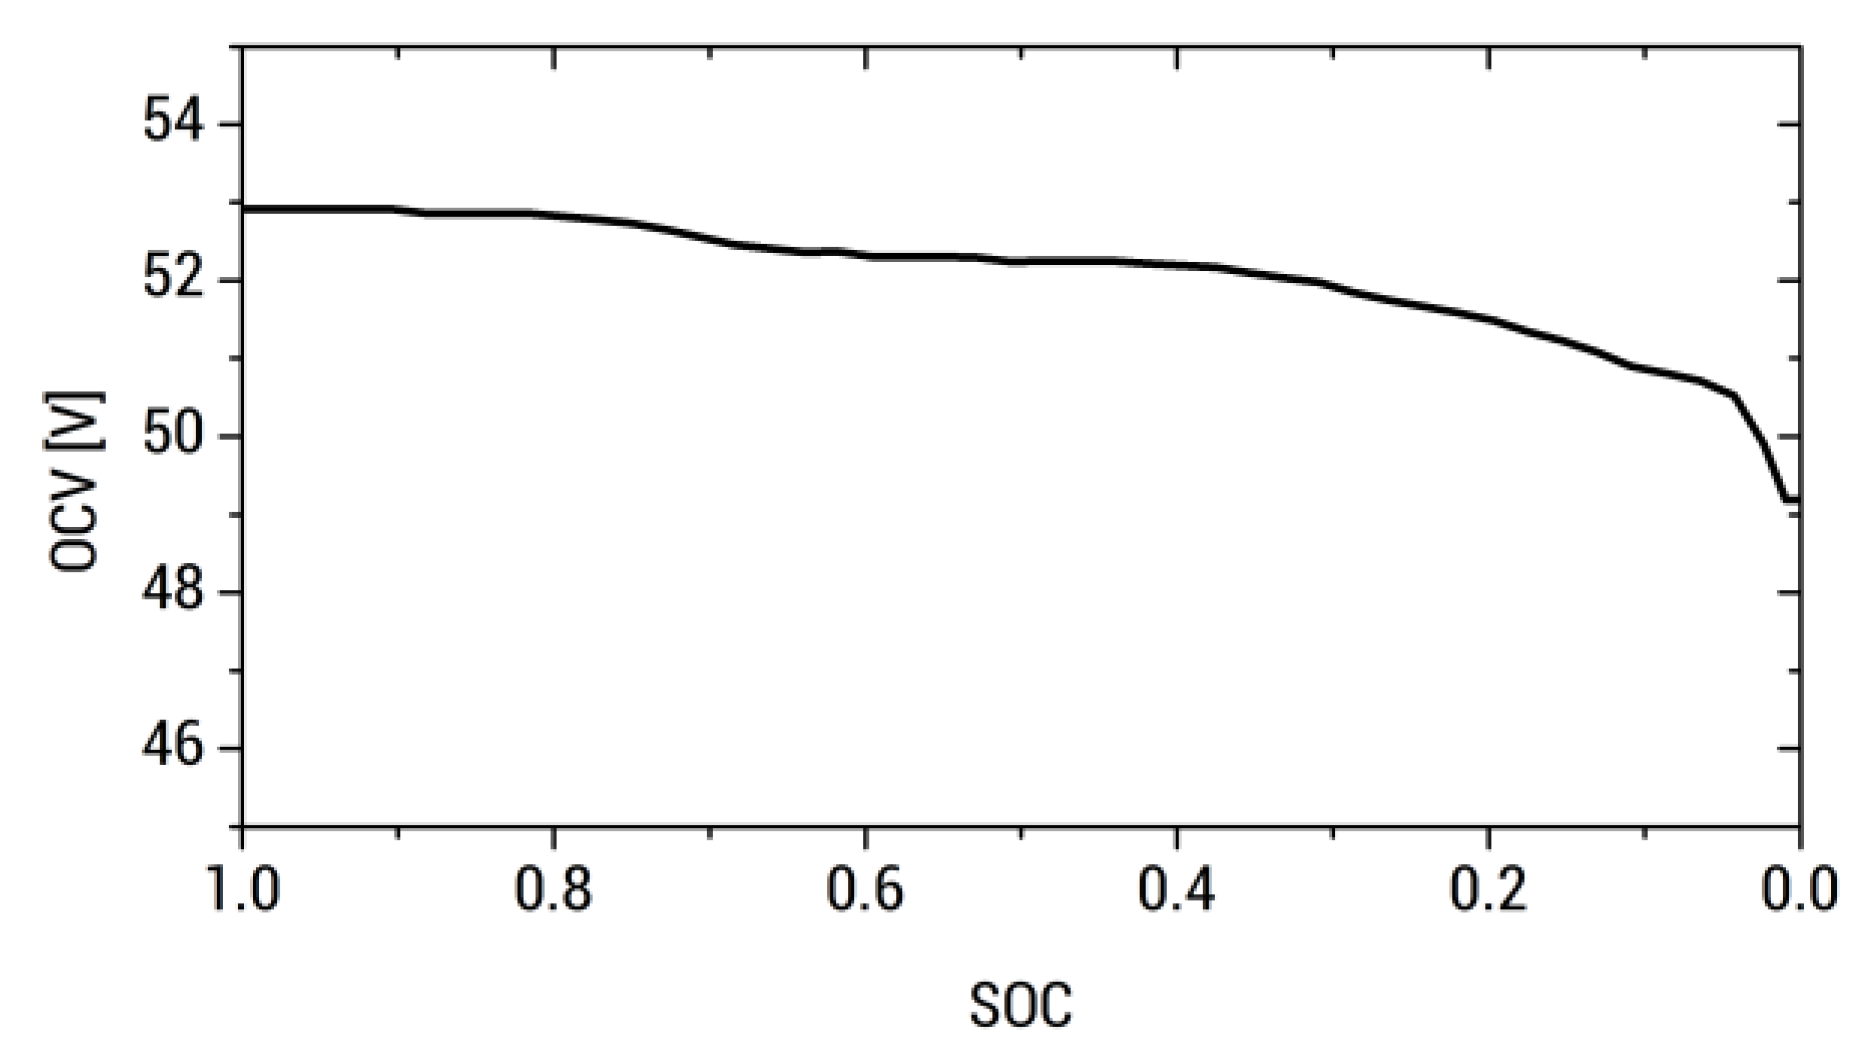
A.1.3. Li-Ion BESS


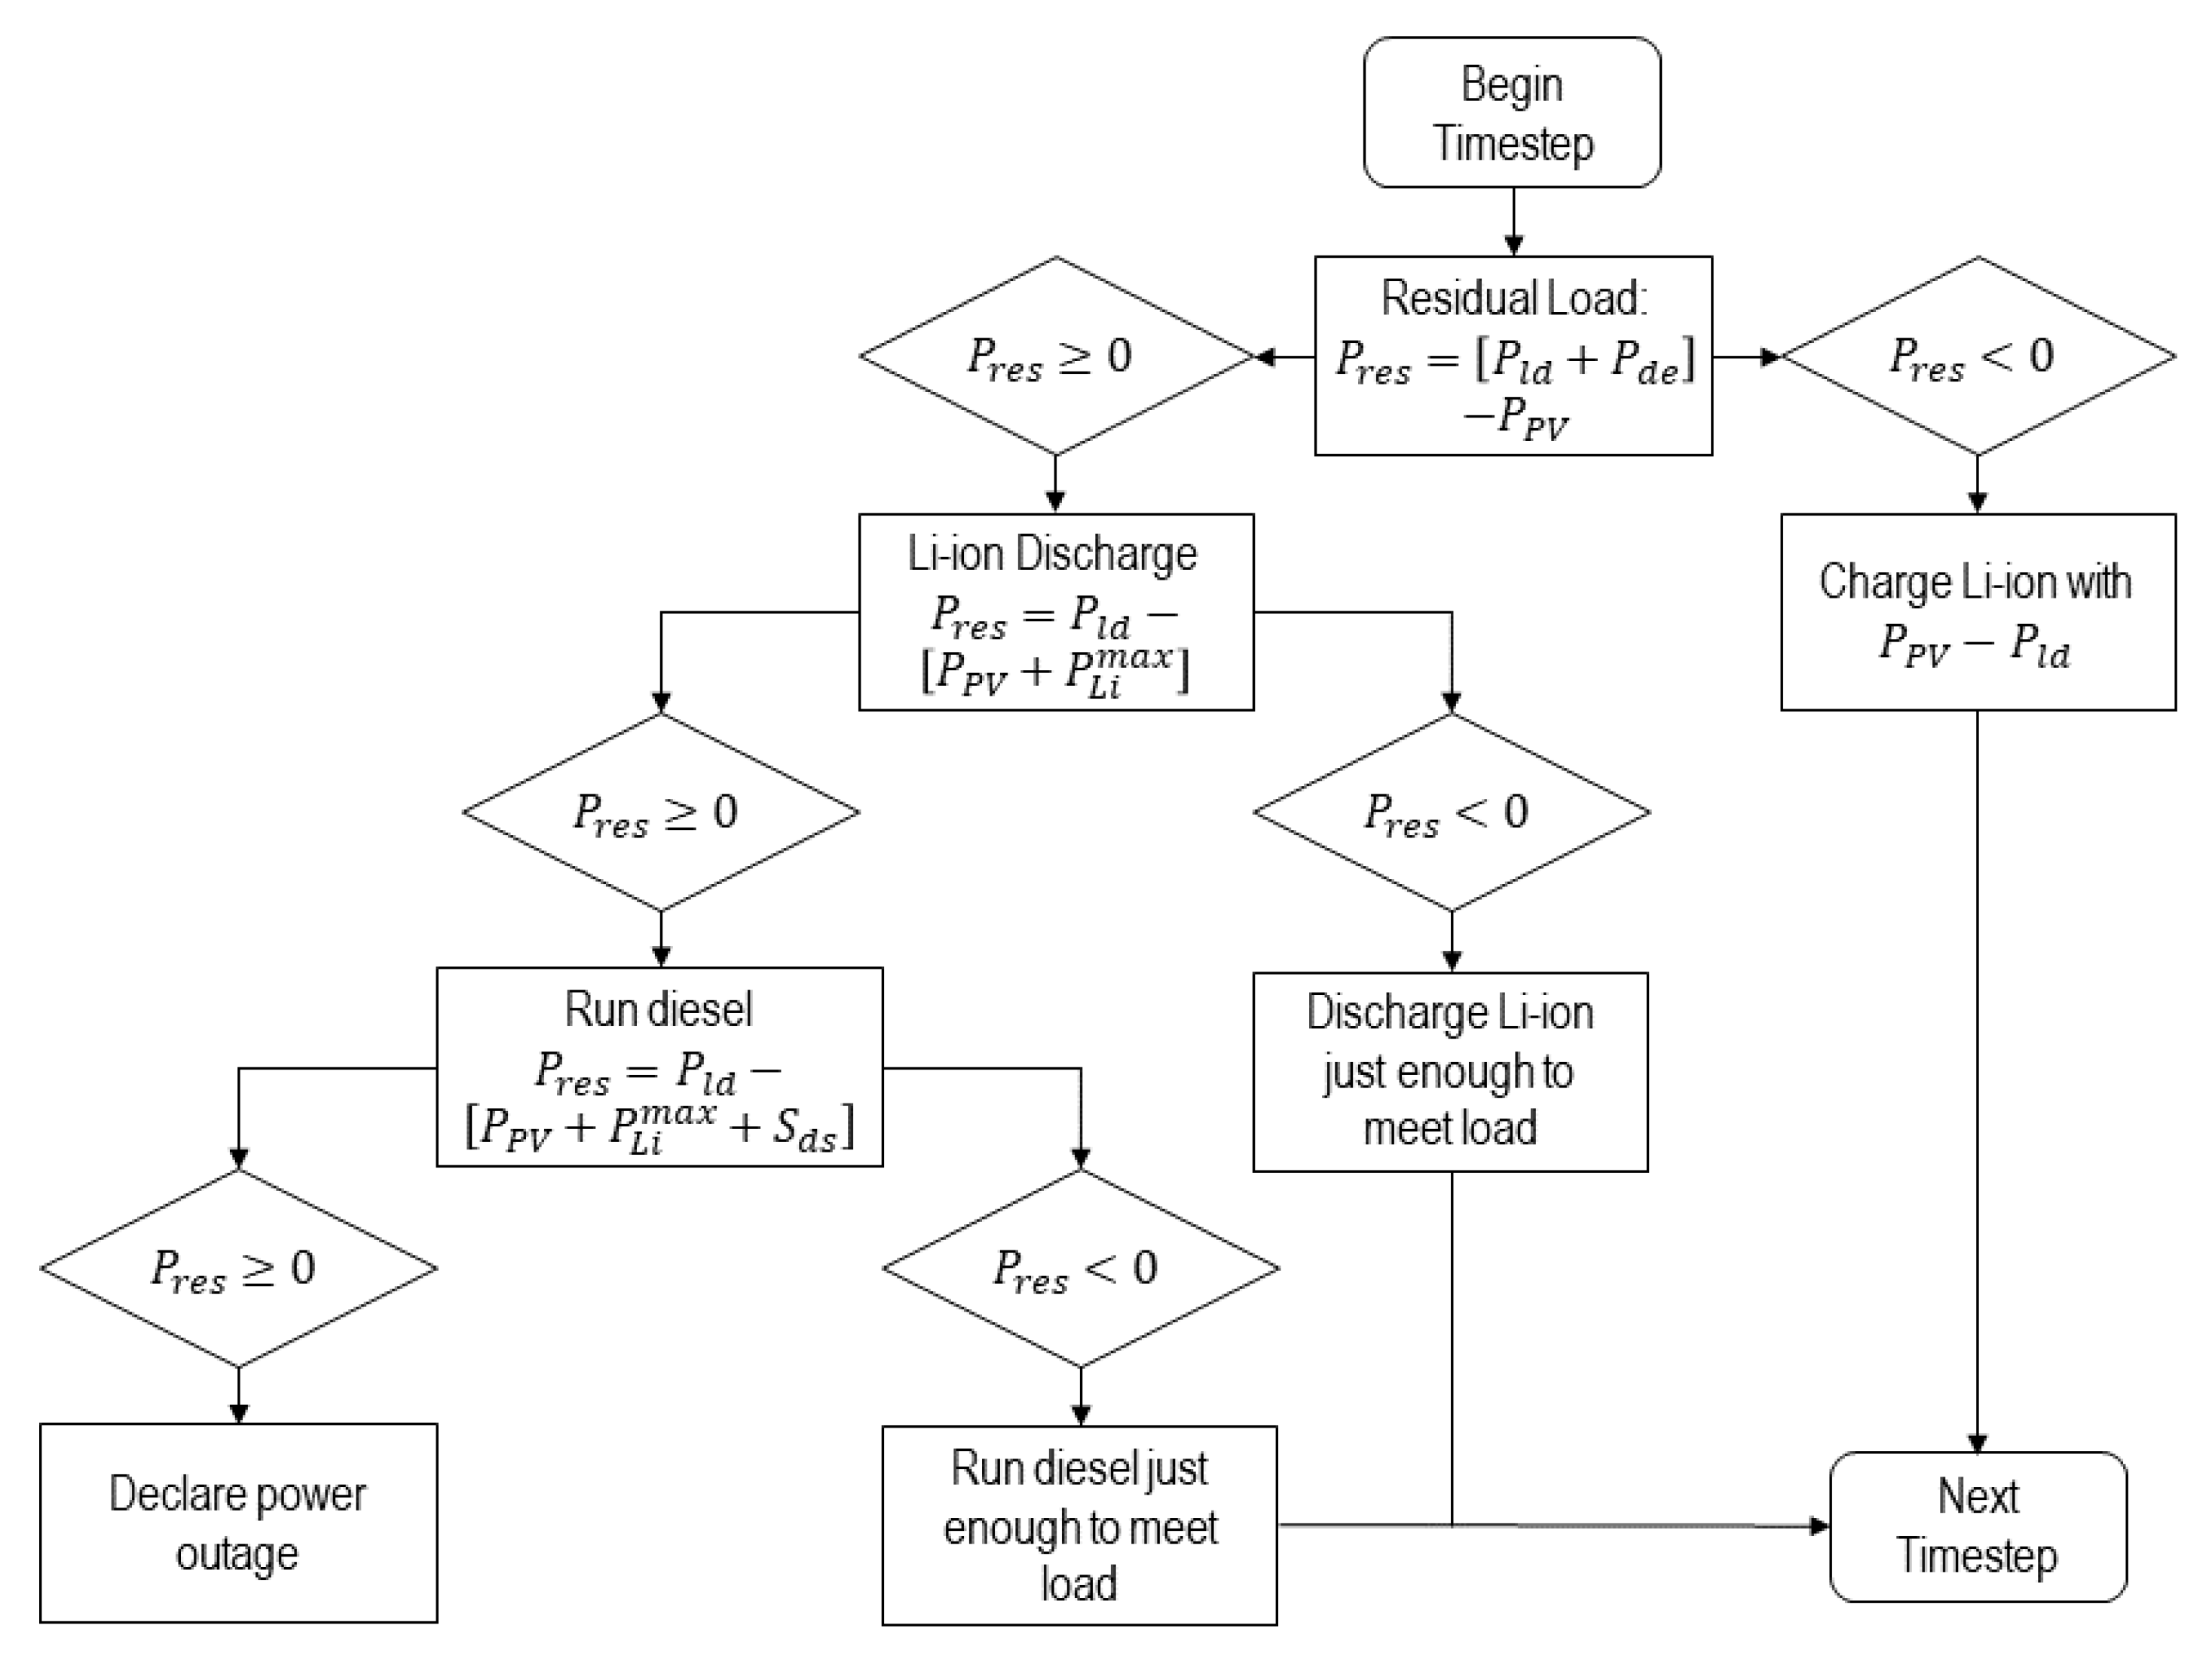
A.2. Dispatch Algorithm
Appendix B
Appendix C

| Component | Parameter | Unit | Value | Ref. |
|---|---|---|---|---|
| PV | CapEx | USD/kW | 1200 | [67] |
| OpEx | USD/kW/y | 25 | ||
| Lifetime | y | 20 | [68] | |
| Li-ion BESS | CapEx | USD/kWh | 300 | [69] |
| OpEx | USD/kWh/y | 3 | ||
| Lifetime | y | 10 | ||
| RT Efficiency | % | 90 | ||
| Diesel | CapEx | USD/kW | 500 | |
| Generator | OpEx | USD/kWh | 0.03 | |
| Lifetime | h | 15,000 | ||
| Diesel | Cost | USD/L | 0.9 | |
| Inflation Rate | % | 3 | ||
| Project | CapEx | USD | 0 | |
| OpEx | USD/y | 0 | ||
| Discount Rate | % | 10 | ||
| Lifetime | y | 20 |
Appendix D
Appendix E


References
- Ocon, J.D.; Bertheau, P. Energy Transition from Diesel-based to Solar Photovoltaics-Battery-Diesel Hybrid System-based Island Grids in the Philippines—Techno-Economic Potential and Policy Implication on Missionary Electrification. J. Sustain. Dev. Energy Water Environ. Syst. 2019, 7, 139–154. [Google Scholar] [CrossRef]
- Holding, S.; Allen, D.M.; Foster, S.; Hsieh, A.; Larocque, I.; Klassen, J.; Van Pelt, S.C. Groundwater vulnerability on small islands. Nat. Clim. Chang. 2016, 6, 1100–1103. [Google Scholar] [CrossRef]
- NEA to Give Romblons Cobrador Island Potable Water Thru Hydropanels. Available online: https://www.ikot.ph/nea-to-give-romblons-cobrador-island-potable-water-thru-hydropanels (accessed on 24 April 2020).
- International Labor Organization. Report V: Sustainable Development, Decent Work and Green Jobs; International Labor Organization: Geneva, Switzerland, 2013. [Google Scholar]
- Lilane, A.; Saifaoui, D.; Hariss, S.; Jenkal, H.; Chouiekh, M. Modeling and simulation of the performances of the reverse osmosis membrane. Mater. Today Proc. 2019, 24, 114–118. [Google Scholar] [CrossRef]
- Schmidt, O.; Hawkes, A.; Gambhir, A.; Staffell, I. The future cost of electrical energy storage based on experience rates. Nat. Energy 2017, 2, 1–8. [Google Scholar] [CrossRef]
- Schmidt, O.; Melchior, S.; Hawkes, A.; Staffell, I. Projecting the Future Levelized Cost of Electricity Storage Technologies. Joule 2019, 3, 81–100. [Google Scholar] [CrossRef] [Green Version]
- Bajpai, P.; Dash, V. Hybrid renewable energy systems for power generation in stand-alone applications: A review. Renew. Sustain. Energy Rev. 2012, 16, 2926–2939. [Google Scholar] [CrossRef]
- Bertheau, P.; Blechinger, P. Resilient solar energy island supply to support SDG7 on the Philippines: Techno-economic optimized electrification strategy for small islands. Util. Policy 2018, 54, 55–77. [Google Scholar] [CrossRef]
- Fernández-Gil, G.; Petrakopoulou, F. Sustainable water generation on a mediterranean island in Greece. Energies 2019, 12, 4247. [Google Scholar] [CrossRef] [Green Version]
- Tafech, A.; Milani, D.; Abbas, A. Water storage instead of energy storage for desalination powered by renewable energy—King Island case study. Energies 2016, 9, 839. [Google Scholar] [CrossRef] [Green Version]
- Philstar Global Water Rates up in July 2018. Available online: https://www.philstar.com/headlines/2018/06/15/1824833/water-rates-july-2018 (accessed on 24 April 2020).
- Gökçek, M. Integration of hybrid power (wind-photovoltaic-diesel-battery) and seawater reverse osmosis systems for small-scale desalination applications. Desalination 2018, 435, 210–220. [Google Scholar] [CrossRef]
- Corsini, A.; Tortora, E. Sea-Water Desalination for Load Levelling of Gen-Sets in Small Off-Grid Islands. Energies 2018, 11, 2068. [Google Scholar] [CrossRef] [Green Version]
- Bognar, K.; Pohl, R.; Behrendt, F. Seawater reverse osmosis (SWRO) as deferrable load in micro grids. Desalin. Water Treat. 2013, 51, 1190–1199. [Google Scholar] [CrossRef]
- International Atomic Energy Agency. Use of Nuclear Reactors for Seawater Desalination; International Atomic Energy Agency: Vienna, Austria, 1990. [Google Scholar]
- Khalifa, A.J.N. Evaluation of different hybrid power scenarios to Reverse Osmosis (RO) desalination units in isolated areas in Iraq. Energy Sustain. Dev. 2011, 15, 49–54. [Google Scholar] [CrossRef]
- Azinheira, G.; Segurado, R.; Costa, M. Is renewable energy-powered desalination a viable solution for water stressed regions? A case study in Algarve, Portugal. Energies 2019, 12, 4651. [Google Scholar] [CrossRef] [Green Version]
- Rao, P.; Morrow, W.R.; Aghajanzadeh, A.; Sheaffer, P.; Dollinger, C.; Brueske, S.; Cresko, J. Energy considerations associated with increased adoption of seawater desalination in the United States. Desalination 2018, 445, 213–224. [Google Scholar] [CrossRef] [Green Version]
- Qiu, T.; Davies, P.A. Comparison of configurations for high-recovery inland desalination systems. Water 2012, 4, 690–706. [Google Scholar] [CrossRef] [Green Version]
- Monterrey-Viña, A.; Musicki-Savic, A.; Díaz-Peña, F.J.; Peñate-Suárez, B. Technical and agronomical assessment of the use of desalinated seawater for coastal irrigation in an insular context. Water 2020, 12, 272. [Google Scholar] [CrossRef] [Green Version]
- Caldera, U.; Breyer, C. Learning Curve for Seawater Reverse Osmosis Desalination Plants: Capital Cost Trend of the Past, Present, and Future. Water Resour. Res. 2017, 53, 10523–10538. [Google Scholar] [CrossRef] [Green Version]
- Jones, E.; Qadir, M.; van Vliet, M.T.H.; Smakhtin, V.; Kang, S. mu The state of desalination and brine production: A global outlook. Sci. Total Environ. 2019, 657, 1343–1356. [Google Scholar] [CrossRef]
- Ullah, I.; Rasul, M.G. Recent developments in solar thermal desalination technologies: A review. Energies 2019, 12, 119. [Google Scholar] [CrossRef] [Green Version]
- Reddy, K.V.; Ghaffour, N. Overview of the cost of desalinated water and costing methodologies. Desalination 2007, 205, 340–353. [Google Scholar] [CrossRef]
- Mayor, B. Growth patterns in mature desalination technologies and analogies with the energy field. Desalination 2019, 457, 75–84. [Google Scholar] [CrossRef]
- Sood, A.; Smakhtin, V. Can desalination and clean energy combined help to alleviate global water scarcity? J. Am. Water Resour. Assoc. 2014, 50, 1111–1123. [Google Scholar] [CrossRef]
- Ahmadvand, S.; Abbasi, B.; Azarfar, B.; Elhashimi, M.; Zhang, X.; Abbasi, B. Looking beyond energy efficiency: An applied review of water desalination technologies and an introduction to capillary-driven desalination. Water 2019, 11, 696. [Google Scholar] [CrossRef] [Green Version]
- Williams, E.; Hittinger, E.; Carvalho, R.; Williams, R. Wind power costs expected to decrease due to technological progress. Energy Policy 2017, 106, 427–435. [Google Scholar] [CrossRef] [Green Version]
- Maqbool, N.; Saleem, Z.; Jamal, Y. Open Access Journal of Waste Management & Xenobiotics A Short Review on A Short Review on Reverse Osmosis Membranes: Fouling and Control. A Short Rev. Reverse Osmosis Membr. Fouling Control 2019, 2. [Google Scholar] [CrossRef]
- Coutinho de Paula, E.; Amaral, M.C.S. Extending the life-cycle of reverse osmosis membranes: A review. Waste Manag. Res. 2017, 35, 456–470. [Google Scholar] [CrossRef]
- Yang, Z.; Zhou, Y.; Feng, Z.; Rui, X.; Zhang, T.; Zhang, Z. A review on reverse osmosis and nanofiltration membranes for water purification. Polymers 2019, 11, 1252. [Google Scholar] [CrossRef] [Green Version]
- Ruiz-García, A.; Melián-Martel, N.; Nuez, I. Short review on predicting fouling in RO desalination. Membranes 2017, 7, 62. [Google Scholar] [CrossRef] [Green Version]
- Al-Amshawee, S.; Yunus, M.Y.B.M.; Azoddein, A.A.M.; Hassell, D.G.; Dakhil, I.H.; Hasan, H.A. Electrodialysis desalination for water and wastewater: A review. Chem. Eng. J. 2020, 380, 122231. [Google Scholar] [CrossRef]
- Carballo, J.A.; Bonilla, J.; Roca, L.; De la Calle, A.; Palenzuela, P.; Alarcón-Padilla, D.C. Optimal operating conditions analysis for a multi-effect distillation plant according to energetic and exergetic criteria. Desalination 2018, 435, 70–76. [Google Scholar] [CrossRef]
- Nannarone, A.; Toro, C.; Sciubba, E. Multi-stage flash desalination process: Modeling and simulation. In Proceedings of the 30th International Conference on Efficiency, Cost, Optimization, Simulation and Environmental Impact of Energy Systems-ECOS 2017, San Diego, CA, USA, 2–6 July 2017. [Google Scholar]
- El-Feky, A.K. Mechanical Vapor Compression (MVC) Desalination System Optimal Design. Arab J. Nucl. Sci. Appl. 2016, 94, 1–13. [Google Scholar]
- Jamil, M.A.; Zubair, S.M. On thermoeconomic analysis of a single-effect mechanical vapor compression desalination system. Desalination 2017, 420, 292–307. [Google Scholar] [CrossRef]
- Namany, S.; Al-Ansari, T.; Govindan, R. Optimisation of the energy, water, and food nexus for food security scenarios. Comput. Chem. Eng. 2019, 129, 106513. [Google Scholar] [CrossRef]
- Mandelli, S.; Brivio, C.; Colombo, E.; Merlo, M. Effect of load profile uncertainty on the optimum sizing of off-grid PV systems for rural electrification. Sustain. Energy Technol. Assess. 2016, 18, 34–47. [Google Scholar] [CrossRef]
- Castro, M.T.; Esparcia, E.A.; Odulio, C.M.F.; Ocon, J.D. Technoeconomics of reverse osmosis as demand-side management for Philippine off-grid islands. Chem. Eng. Trans. 2019, 76, 1129–1134. [Google Scholar]
- Gökçek, M.; Gökçek, Ö.B. Technical and economic evaluation of freshwater production from a wind-powered small-scale seawater reverse osmosis system (WP-SWRO). Desalination 2016, 381, 47–57. [Google Scholar] [CrossRef]
- Ozonoh, M.; Aniokete, T.C.; Oboirien, B.O.; Daramola, M.O. Techno-economic analysis of electricity and heat production by co-gasification of coal, biomass and waste tyre in South Africa. J. Clean. Prod. 2018, 201, 192–206. [Google Scholar] [CrossRef]
- Abdelkareem, M.A.; El Haj Assad, M.; Sayed, E.T.; Soudan, B. Recent progress in the use of renewable energy sources to power water desalination plants. Desalination 2018, 435, 97–113. [Google Scholar] [CrossRef]
- Ghalavand, Y.; Hatamipour, M.S.; Rahimi, A. A review on energy consumption of desalination processes. Desalin. Water Treat. 2015, 54, 1526–1541. [Google Scholar] [CrossRef]
- Ghaffour, N.; Missimer, T.M.; Amy, G.L. Technical review and evaluation of the economics of water desalination: Current and future challenges for better water supply sustainability. Desalination 2013, 309, 197–207. [Google Scholar] [CrossRef] [Green Version]
- Aquatech International Corporation. Case Study: Seawater Desalination at Rabigh Refinery; Aquatech International Corporation: Canonsburg, PA, USA, 2020. [Google Scholar]
- Rahimi, B.; Chua, H. Low Grade Heat Driven Multi-effect Distillation and Desalination, 1st ed.; Elsevier: Amsterdam, The Netherlands, 2017. [Google Scholar]
- Elsayed, M.L.; Mesalhy, O.; Mohammed, R.H.; Chow, L.C. Transient and thermo-economic analysis of MED-MVC desalination system. Energy 2019, 167, 283–296. [Google Scholar] [CrossRef]
- Kim, J.S.; Garcia, H.E. Hybrid Energy: Combining Nuclear and Other Energy Sources; Idaho National Lab. (INL): Idaho Falls, ID, USA, 2015. [Google Scholar]
- Papapetrou, M.; Cipollina, A.; La Commare, U.; Micale, G.; Zaragoza, G.; Kosmadakis, G. Assessment of methodologies and data used to calculate desalination costs. Desalination 2017, 419, 8–19. [Google Scholar] [CrossRef]
- Lara, J.; Osunsan, O.; Holtzapple, M. Advanced mechanical vapor-compression desalination system. In Desalination, Trends and Technologies; Schorr, M., Ed.; IntechOpen: London, UK, 2012. [Google Scholar]
- De Andrade Cruz, M.; Araújo, O.d.Q.F.; de Medeiros, J.L.; de Castro, R.d.P.V.; Ribeiro, G.T.; de Oliveira, V.R. Impact of solid waste treatment from spray dryer absorber on the levelized cost of energy of a coal-fired power plant. J. Clean. Prod. 2017, 164, 1623–1634. [Google Scholar] [CrossRef]
- Wang, F.; Deng, S.; Zhao, J.; Zhao, J.; Yang, G.; Yan, J. Integrating geothermal into coal-fired power plant with carbon capture: A comparative study with solar energy. Energy Convers. Manag. 2017, 148, 569–582. [Google Scholar] [CrossRef]
- Mayor, B. Unraveling the Historical Economies of Scale and Learning Effects for Desalination Technologies. Water Resour. Res. 2020, 56, 1–10. [Google Scholar] [CrossRef] [Green Version]
- Cipollina, A.; Micale, G.; Rizzuti, L. Seawater Desalination: Conventional and Renewable Energy Processes; Springer: Berlin, Germany, 2012; ISBN 9781608054220. [Google Scholar]
- California Public Utilities Commission. Embedded Energy in Water Studies Study 3: End Use Water Demand Profiles; California Public Utilities Commission: San Francisco, CA, USA, 2011.
- Griffin, R.C.; Chang, C. Seasonality in Community Water Demand. West. J. Agric. Econ. 1991, 16, 207–217. [Google Scholar]
- Bendt, P.; Collares-Pereira, M.; Rabl, A. The frequency distribution of daily insolation values. Sol. Energy 1981, 27, 1–5. [Google Scholar] [CrossRef]
- Graham, V.A.; Hollands, K.G.T.; Unny, T.E. A time series model for Kt with application to global synthetic weather generation. Sol. Energy 1988, 40, 83–92. [Google Scholar] [CrossRef]
- Graham, V.A.; Hollands, K.G.T. A method to generate synthetic hourly solar radiation globally. Sol. Energy 1990, 44, 333–341. [Google Scholar] [CrossRef]
- MERALCO Local DU Rate. Available online: www.meralco.com.ph (accessed on 24 April 2020).
- National Power Corporation NPC Holds Groundbreaking of Solar Power Plant in Limasawa Island. Available online: https://www.napocor.gov.ph/index.php/news/archived-news/189-npc-holds-groundbreaking-of-solar-power-plant-in-limasawa-island (accessed on 24 April 2020).
- Duffie, J.; Beckman, W. Solar Engineering of Thermal Processes; Wiley: New York, NY, USA, 2013; ISBN 9780470873663. [Google Scholar]
- McGowan, J.G.; Manwell, J.F.; Connors, S.R. Wind/diesel energy systems: Review of design options and recent developments. Sol. Energy 1988, 41, 561–575. [Google Scholar] [CrossRef]
- He, H.; Xiong, R.; Fan, J. Evaluation of lithium-ion battery equivalent circuit models for state of charge estimation by an experimental approach. Energies 2011, 4, 582–598. [Google Scholar] [CrossRef]
- Fu, R.; Feldman, D.; Margolis, R. US Solar Photovoltaic System Cost Benchmark: Q1 2018; NREL/TP-6A20-72399; National Renewable Energy Laboratory: Golden, CO, USA, 2018. [Google Scholar]
- Blechinger, P. Barriers and Solutions to Implementing Renewable Energies on Caribbean Islands in Respect of Technical, Economic, Political, and Social Conditions, Schriftenreihe der Reiner Lemoine-Stiftung; Shaker Verlag: Herzogenrath, Germany, 2015. [Google Scholar]
- Diorio, N.; Dobos, A.; Janzou, S.; Nelson, A.; Lundstrom, B. Technoeconomic Modeling of Battery Energy Storage in SAM; NREL Technical Report; National Renewable Energy Laboratory: Golden, CO, USA, 2015. [Google Scholar]
- Navarro, S. Hybrid opportunities in SPUG areas using HOMER. In Proceedings of the Asian Clean Energy Forum, Manila, Philippines, 6–10 June 2016. [Google Scholar]


| Ref. | Energy | Desalination | Remarks | ||||
|---|---|---|---|---|---|---|---|
| PV | Wind | Diesel | Batt | RO | Other | ||
| [17] | ✓ | ✓ | ✓ | ✓ |
| ||
| [11] | ✓ | ✓ | ✓ | ✓ | ✓ |
| |
| [18] | ✓ | ✓ | ✓ |
| |||
| [19] | ✓ | ✓ |
| ||||
| [10] | ✓ | ✓ |
| ||||
| [20] | ✓ |
| |||||
| [21] | ✓ | ✓ |
| ||||
| Ref. | Desalination | Remarks | |||
|---|---|---|---|---|---|
| MED | MSF | MVC | RO | ||
| [24] | ✓ | ✓ | ✓ | ✓ |
|
| [25] | ✓ | ✓ | ✓ | ✓ |
|
| [26] | ✓ | ✓ | ✓ |
| |
| [27] |
| ||||
| [22] | ✓ |
| |||
| [28] | ✓ | ✓ |
| ||
| Desalination | EIel [kWh/m3] | Ref. | EIth [kWh/m3] | Ref. | TDR | Ref. |
|---|---|---|---|---|---|---|
| MED | 2.50 | [44,45,46] | 53.20 | [44,45] | 0.50 | [47] |
| MSF | 4.17 | [44,45,46] | 64.79 | [44,45] | 0.70 | [48] |
| MVC | 12.41 | [19,45] | - | [19,44] | 0.50 | [49] |
| RO | 4.35 | [19,44,45] | - | [19,44] | 0.33 | [50] |
| Component | Parameter | Unit | Value | Ref. |
|---|---|---|---|---|
| MED | CapEx | USD/(m3/d) | 1150 | [25,46] |
| OpEx | USD/m3 | 0.232 | [25] | |
| Lifetime | y | 6 | [31] | |
| MSF | CapEx | USD/(m3/d) | 1425 | [25,46] |
| OpEx | USD/m3 | 0.232 | [25] | |
| Lifetime | y | 10 | [51] | |
| MVC | CapEx | USD/(m3/d) | 1000 | [52] |
| OpEx | USD/m3 | 0.232 | [25] | |
| Lifetime | y | 10 | [51] | |
| RO | CapEx | USD/(m3/d) | 1250 | [25,46] |
| OpEx | USD/m3 | 0.232 | [25] | |
| Lifetime | y | 10 | [51] | |
| Water Storage | CapEx | USD/m3 | 1000 | [13] |
| OpEx | USD/m3/y | 10 | ||
| Lifetime | y | 20 | ||
| Coal | Unit Cost | USD/kg | 0.09 | [53,54] |
| Inflation Rate | % | 3 |
© 2020 by the authors. Licensee MDPI, Basel, Switzerland. This article is an open access article distributed under the terms and conditions of the Creative Commons Attribution (CC BY) license (http://creativecommons.org/licenses/by/4.0/).
Share and Cite
Castro, M.; Alcanzare, M.; Esparcia, E., Jr.; Ocon, J. A Comparative Techno-Economic Analysis of Different Desalination Technologies in Off-Grid Islands. Energies 2020, 13, 2261. https://doi.org/10.3390/en13092261
Castro M, Alcanzare M, Esparcia E Jr., Ocon J. A Comparative Techno-Economic Analysis of Different Desalination Technologies in Off-Grid Islands. Energies. 2020; 13(9):2261. https://doi.org/10.3390/en13092261
Chicago/Turabian StyleCastro, Michael, Myron Alcanzare, Eugene Esparcia, Jr., and Joey Ocon. 2020. "A Comparative Techno-Economic Analysis of Different Desalination Technologies in Off-Grid Islands" Energies 13, no. 9: 2261. https://doi.org/10.3390/en13092261
APA StyleCastro, M., Alcanzare, M., Esparcia, E., Jr., & Ocon, J. (2020). A Comparative Techno-Economic Analysis of Different Desalination Technologies in Off-Grid Islands. Energies, 13(9), 2261. https://doi.org/10.3390/en13092261