Abstract
Fired bricks represent one of the most popular building materials, of which production is still growing. Since the functional properties of bricks have reached their physical limits, the current development aims at an optimization of production procedures as it goes along with heavy environmental loads. This paper is focused on tailoring the firing procedure to optimize the energy demands. Dealing with five different clays, their heat storage properties are determined using inverse analysis of calorimetric data so that the measurement errors are reduced. Moreover, effective values incorporate the thermal processes that occur during firing. A simplified model of clay samples is then used to calculate the energy demands for reaching an optimal firing scheme. The results show that specific treatment is necessary for particular clays as the energy demands may range between 89 and 173 MJ·m−2, depending on a clay composition. The highest demands were found in the case of clays containing the high volume of calcite and dolomite, of which thermal decomposition is very energy demanding. Using the tailored firing scheme, one can reach energy savings of up to 49% while the functional properties would be preserved due to maintaining the optimal temperature evolution in the brick body.
1. Introduction
Clay bricks represent one of the most traditional building materials that have been used worldwide for centuries [1]. In the course of time, fired bricks have become the most popular type of bricks as they exhibit better mechanical properties than unfired or dried ones. The main reason of getting such favorable properties is a formation of a strong bond between clay particles at higher temperatures, which can be attributed to the melting of silica in clay [2]. The brick production, nowadays, is very extensive as it reaches about 1400 billion units a year [3]. However, the volume produced is still growing year by year [4] as bricks are widely used for construction of both residential and non-residential buildings for load bearing walls as well as partitions. The major part of brick production is allocated to Asia. It has been reported by Ul Rehman et al. [5] that China, Pakistan, India, Bangladesh, and Vietnam account for 75% of the global brick production.
The brick production goes along with heavy environmental loads. It has been reported that, depending on a type of kiln used, 1 kg of brick fired produces up to 282 g of carbon dioxide, 5.78 g of carbon monoxide, 0.29 g of carbon black, and 1.56 g of particulate matter [6]. The energy consumption is also very high, accounting for 0.54–3.14 MJ/kg, depending on the efficiency of the kiln and type of fuel used. Unfortunately, it is the firing and drying, procedures highly favorable from the point of view of functional properties of final products, which are responsible for the largest part of the energy consumption [6]. A utilization of unfired bricks, being proposed by several researchers due to lesser energy demands and environmental impacts in general [7], would therefore not solve the problem entirely as some of the favorable functional properties would be lost. On the other hand, this branch of research encourages stabilizing the clay to reach better properties [8,9,10,11,12] which can make the unfired bricks good alternatives to the traditional ones in the future.
The energy savings efforts that have been adopted in most human activities have affected the brick production process as well. The current efforts therefore aim at an optimization of processes or material base to make brick production more efficient, cost effective, and environmentally-friendly [13,14]. For instance, Refaey et al. [15] investigated the effects of brick setting arrangement, guide vane tape, or heat flow parameters on thermal performance of a kiln to optimize the cooling process. Various studies exploiting computational modeling has also been reported, aiming at a description of the thermal processes in a kiln [16,17] to improve its design [18] or configuration to make the convection more efficient, as it is considered an essential factor of the drying/burning process [19]. The type of firing fuel and optimization of its consumption have been proposed as other measures resulting in reduction of the environmental impacts [20,21,22]. Another possibility to contribute to the reduction of environmental impacts can be the preprocessing of the raw materials entering the process. In this light, Bruno et al. [23] investigated an influence of earth compaction to 100 MPa prior to rapid firing at low temperatures. An efficient preheating can be applied as well [24].
Generally, the materials base, the quality of input materials in particular, plays a significant role in the brick production from the point of view of both the quality of final products and amount of energy consumed during the manufacturing procedure. Since clay is a natural matter, its composition may differ even within a single deposit, and its thermal performance during the firing may be different as various minerals may exhibit different thermal processes, which should be considered to maintain a constant quality of the fired body.
This paper therefore aims at experimental characterization of five different clays used for production of ceramics bricks. The experimental investigation is followed by a computational modeling procedure, the objective of which is to estimate the amount of energy required for firing a given amount of a brick body to reach the identical temperature distribution inside the material. Using three-dimensional modeling of heat transport, the computational modeling exploits the data obtained within the preceding experimental investigation to incorporate both the exothermic and endothermic reactions that are exhibited during the firing procedure. The main objective of the work is to propose a methodology that enables the clays to be treated individually by tailoring the firing boundary conditions so that all the thermal processes occurring during firing would be exploited maximally, which should allow an efficient moderating of the firing boundary conditions.
2. Materials and Methods
2.1. Description of Clays Selected for Investigations
Five different clays for the brick production were studied within this research, and they are described below. They originated from different deposits, as shown in Table 1. The samples were subjected to experimental analyses aimed at determination of their chemical composition, phase composition, and particle size composition (granulometry).

Table 1.
Labeling of samples based on deposits locations.
The chemical composition of the clays was determined using XRF spectroscopy (ED-XRF ARL QUANT’X spectrometer made by Thermo Scientific, Waltham, MA, USA), being completed by an analysis of total carbon amount using the micro combustion analyzer Vario EL Cube made by Elementar (Langenselbold, Germany). Subsequently, the amount of organic carbon was determined by means dissolution of carbonates using dilute hydrochloric acid. As shown in Table 2, the higher amount CaO in samples C1 and C4 correlates with the higher amount of total carbon due to a dominant presence of Ca in the form of calcium carbonate. The amount of chemically bound water was determined by means of thermogravimetry as the mass difference between 400 and 600 °C where dehydroxylation of clay minerals takes place.
Table 2.
Chemical composition of the clays (percent by mass).
As captured in Figure 1, the particle size distribution of the clays was determined based on results provided by a laser diffraction analyzer (Bettersizer S3 made by 3P Instruments) with samples dispersed in water using 5% solution of Na2P2O7.
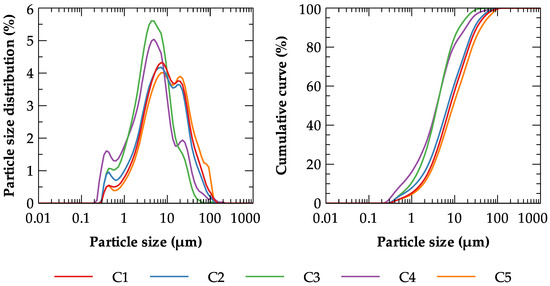
Figure 1.
Particle size distributions of the clays.
The approximate mineralogical composition of the clays is given in Table 3. It was obtained based on an analysis of results of XRD diffractometry (Aeris XRD diffractometer made by PANalytical (Malvern, United Kingdom) CoKα source, 40 kV, 7.5 mA, Bragg–Brentano geometry) on oriented and powder samples, being completed using thermogravimetry. The oriented samples were prepared for precise determination of the clay minerals content by the sedimentation of the clay fraction to non-diffraction Si plate and its subsequent saturation by ethylene glycol at 80 °C for at least 8 h. It was found that the most dominant minerals in the clays investigated are quartz (C1, C2, C3, and C5), kaolinite (C2 and C3), illite-smectite (C1 and C5), various feldspars (C2, C3, and C5), and calcite (C1 and C4). Feldspars are a group of tectosilicates in system orthoclase-albite-anorthite. A detailed specification of individual feldspars in the clays would be possible, but since it does not have a significant impact for this research, only their totals are presented in Table. The total amount of clay minerals in the samples ranges between 24% and 30%. Some samples also contain high amounts of carbonates and quartz, which was confirmed by their presence in the XRD diffractograms. However, only the diffractogram of C1 is presented as an example in Figure 2.
Table 3.
Phase composition of the clays (%).
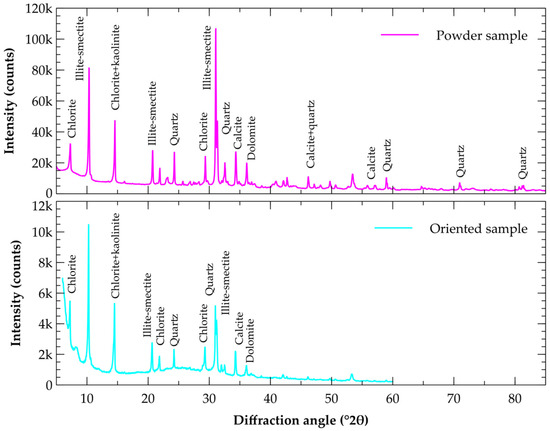
Figure 2.
XRD diffractogram of the C1 sample.
Using the Labsys Evo DSC device (made by Setaram), the heat flow diagrams as a function of temperature of clays studied are summarized in Figure 3. The samples were exposed to elevated temperatures up to 1000 °C using the rate of 5 °C·min−1. Besides the heat flow, also the change of mass was recorded (see Figure 3).
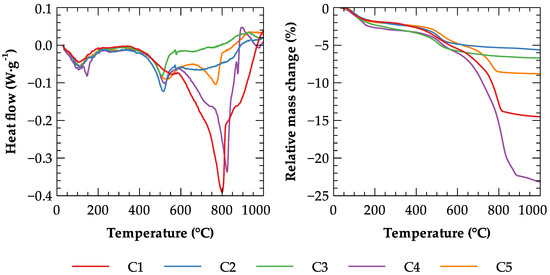
Figure 3.
Heat flow diagrams and relative mass change of the clays.
2.2. Determination of Effective Parameters Describing the High Temperature Performance
A computational model developed within the previous research [25] was employed to process the curves presented in Figure 3 to obtain effective heat storage parameters that describe the performance of clays when exposed to high temperatures. Moreover, the computational representation of the differential scanning calorimeter can filter out systematic errors that accompany the experimental measurement. According to the experience gained thus far, these errors originate from the position of thermocouples that cannot be introduced directly into the sample. This drawback has a subsequent impact on a signal delay, which is obvious when various sample mass and heating rates are tested as proved by several studies published [26,27,28].
The three-dimensional computational mesh (see Figure 4) used for the modeling is composed of 121,015 nodes and 692,071 tetrahedral elements. The model was calibrated in the same way as a real device, i.e. by means of five standard metals that underwent a melting process, and corresponding heat power was recorded and compared to reference values. After the calibration, the model exhibited very good agreement with the experimental outputs, yielding R2 = 0.999794. The model validation performed on aluminum melting and α-β quartz transition showed very good agreement as well.
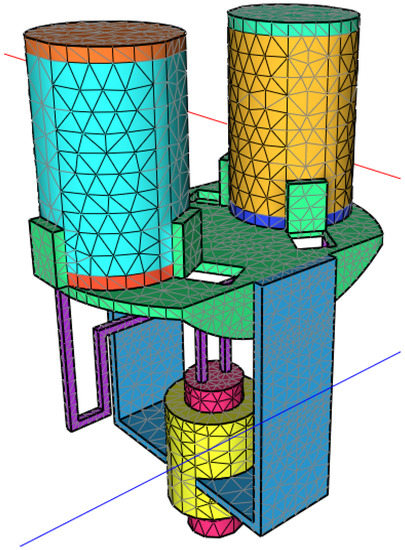
Figure 4.
Computational mesh of the model-DSC sensor rod with reference and measurement crucibles. Reprinted from International Journal of Heat and Mass Transfer, 136, V. Kočí, J. Maděra, A. Trník, R. Černý, Heat transport and storage processes in differential scanning calorimeter: Computational analysis and model validation, 355–364, Copyright (2019), with permission from Elsevier.
This calibrated and validated model can identify physical origins of measurement uncertainties, i.e., it can identify the heat transport and storage processes ongoing directly in the sample (not on thermocouples) that produce the same outputs on thermocouples as in the real experimental measurement. In this way, the signal delay and the thermal inertia can be efficiently eliminated. Heat storage parameters of the sample tested were then described using so-called effective specific heat capacity that comprises all the phase change processes, as depicted in Figure 5, following the principles proposed by Krabbenhoft et al. [29].
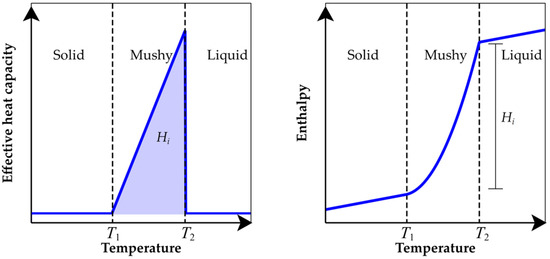
Figure 5.
Relations between effective heat capacity and enthalpy.
The main objective of the model is therefore to find effective specific heat capacity vs. temperature functions of particular clays that, after processing by the computational model, produce the same heat flow diagrams as depicted in Figure 3.
The concept of effective specific heat capacity is commonly used in building materials engineering as it allows involving latent thermal processes without a necessity of model extension, but just by a modification of input material properties. The values of effective specific heat capacity are then usually higher as their physical nature, but, in the field of computational modeling, they can be exploited very efficiently. An example of determination of such a parameter can be found, e.g., in the research presented by Lakatos and Trnik [30], who introduced the effective specific heat capacity of an aerogel blanket to incorporate thermal processes related to thermal annealing.
2.3. Numerical Analysis of Energy Demands during Firing
The energy demands during firing are estimated based on a modeling of a temperature distribution in the clay samples. The temperature field is calculated using the three-dimensional heat transport equation
where T = T(x, y, z, t) (K) is the temperature as a function of space and time, t (s) is the time, ρ (kg·m−3) is the bulk density, λ (W·m−1·K−1) is the thermal conductivity, and ceff (J·kg−1·K−1) is the effective specific heat capacity of the clay. The approximate values of thermal conductivity of clays were used for the calculations, which were derived from data published by Garcia-Ten et al. [31,32].
Having a rather comparable value, a simplified arrangement is assumed to estimate the energy demands. Precise calculations of the energy demands would require detailed specification of the furnace, type of fuel, and brick arrangement in the furnace, which is beyond the scope of this research. In this light, a sample made of the particular clays being heated from five sides by heat flux, q (W·m−2), with dimensions of 290 × 140 × 65 mm3 was chosen as an example, as depicted in Figure 6.
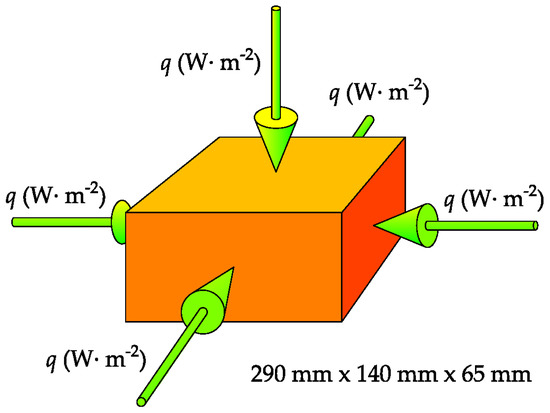
Figure 6.
Scheme of the energy demands modeling procedure.
The main objective of the modeling procedure is to identify a heat flux vs. time function, q(t), that ensures the required firing temperature in the middle of the cube. Many factors affect the firing schedule, e.g. composition of the brick body, geometry and thickness of the ceramic product, furnace parameters, etc. For the energy demands calculations presented in this paper, the curve shown in Figure 7 was used [33]. The overall amount of energy demanded for firing, Q (J), is calculated as
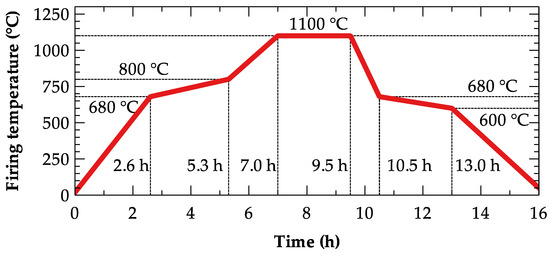
Figure 7.
Optimal firing schedule according to Ferrer et al. [33].
The heat flux vs. time function can be found by means of the genetic algorithms, which has been successfully applied in many engineering problems [34,35,36]. Within the genetic algorithm terminology, the heat flux function, being constructed as a multiple linear curve, is represented by several points Xi [t, T], i.e., individuals, which form a population. The evolution starts from a population that is randomly generated, forming a generation. Then, a fitness function of every individual in each generation is evaluated, based on which multiple individuals are selected and modified using genetic operators. Cross-over and mutation are among the most typically used to form a new generation. The fitness function is evaluated using the least square method, comparing the actual and optimal firing temperature in the center of the sample modeled. The main goal of the optimization procedure is to identify such individuals that fulfill requirements for a satisfactory low fitness function value.
3. Results and Discussion
3.1. Effective Specific Heat Capacity of Clays
Using the computational model described in Section 2.2, the DSC curves presented in Figure 3 were analyzed to obtain the effective specific heat capacity of the particular clays that accommodate all the heat releasing/consuming processes that occur during burning. Additionally, these results are free of systematic errors as the model is able to treat heat losses due to thermal inertia of the device as well as due to heat redistribution before reaching the sensors.
Due to the similarity of their thermal performances, according to their phase compositions, calcite content in particular, C2, C3, and C5 as well as C1 and C4 (see Table 3) are displayed separately (see Figure 8).
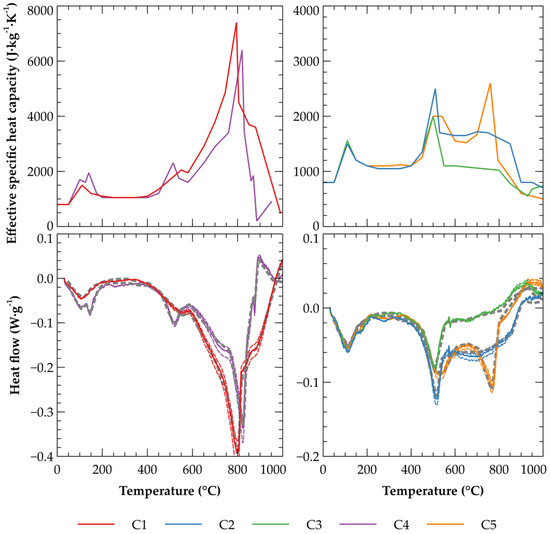
Figure 8.
Effective specific heat capacity of the clays obtained by means of fitting the computational outputs on experimental data: (Top) the identified values of effective specific heat capacity; (Bottom) a comparison of experimentally and computationally (gray dashed lines) obtained heat flows. The experimental uncertainties for particular heat flow curves are expressed using dashed lines of the corresponding color.
During the DSC analysis, the first significant endothermic peak was observed in the temperature range between 25 and 200 °C, being related to the evaporation of physically bound water from the structure of the clays. Depending on the particular clay type, this peak may reach up to −0.082 W·g−1, which increases the effective specific heat capacity to up to 1950 J·kg−1·K−1. The dehydroxylation of kaolinite (see Equation (3)), typical for C2, C3, and C4, and illite-smectite (typical of all clays) was observed in the temperature range of about 400–600 °C [37,38], generating endothermic peaks of about −0.080 to −0.113 W·g−1. Dehydroxylation of illite, due to its considerable isomorphic substitution, cannot be described by a simple chemical equation, as in the case of kaolinite, but the result is similar—amorphous dehydroxylated matter. The quartz (α-β) phase transition (573 °C, see Equation (4)) [39] is observable in DSC signals of C2 and C3. This reversible process should not usually occur on DSC curves. However, due to the significant amount of quartz in the clays together with the fact that the DSC analysis was performed using crucibles covered by lids (higher pressures), the first measurement and blank could have shifted positions. Even if the other clays contain quartz as well, the experiments ran correctly in these cases, thus the signal is not visible. C1 and C4 differ from the others as they contain significant amount of calcite and dolomite (up to 35%), which typically has its thermal decomposition at above 650 °C [40] (see Equations (5) and (6)). Since this decomposition is an endothermic process, it is clearly seen by the major heat power peak visible in this temperature region, which can reach up to −0.391 W·g−1. This process is also reflected in the effective specific heat capacity calculated, yielding 7400 J·kg−1·K−1 for C1 and 6400 J·kg−1·K−1 for C4. A minor peak was also detected in the case of C5, which is, according to the XRD analysis, formed by 6% calcite and dolomite. Here, the heat power peak of −0.104 W·g−1 resulted in specific heat capacity of 2600 J·kg−1·K−1. The decomposition of calcite and dolomite, CaCO3 in general, can partially overlap with dehydroxylation of illite, which take place in the temperature interval 450–650 °C [38].
Using the effective specific heat capacities of the clays shown in Figure 8 (top), the computational outputs of the DSC model were obtained, as shown in Figure 8 (bottom) (gray dashed lines). The agreement is very good, yielding RMSE (root mean square error) between ~0.004 and 0.006 W·g−1. The maximal difference found was only ~0.032 W·g−1 in the cases of C1 and C4 and ~0.012 W·g−1 in the cases of C2, C3 and C5. Additionally, the computational outputs differ from the experimental ones mostly within the measurement uncertainties, which further confirms the very good agreement reached. The summary of the evaluation of the clays is given in Table 4.
Table 4.
Evaluation of agreement of DSC curves obtained using experimental measurement and computational modeling.
3.2. Energy Demands for Clays Firing
Regarding to the mostly endothermic processes (see Section 3.1) during the firing procedure, it is obvious that different clays would require different treatments to reach the given firing schedule. An application of a general firing scheme is therefore ineffective and might result in a completely different evolution of temperature, causing structural failures in the final products. To demonstrate the necessity of specific treatments for different clays, the temperature distribution of the studied clays when exposed to a unified firing scheme was calculated (see Figure 9).
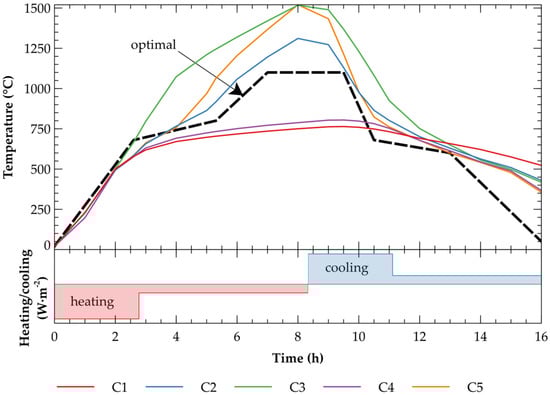
Figure 9.
Evolution of temperatures in particular clays when exposed to unified firing scheme.
In the example presented in Figure 9, the heating boundary fluxes of 4000 and 1000 W·m−2 were applied, followed by the cooling fluxes of 3500 and 1000 W·m−2. While the temperature inside the samples made of C3 and C5 reached up to 1520 °C, the endothermic processes inside C2 led to a certain heat consumption that reduced the target temperature to only 1311 °C. Due to the heat consumption related to the decomposition of calcite and dolomite, the temperatures in C1 and C4 rose even less, to only 764 and 805 °C, respectively. It means that, in this case, samples C2, C3, and C5 would remain over burned after the firing procedure, while C1 and C4 would be not burned sufficiently when compared to the optimal scheme. Since the firing temperature is a key factor to achieve favorable material properties [41], the optimization of the firing scheme is important, bringing substantial energy savings as well.
Using the genetic algorithm searching procedure, the boundary conditions (heat flux through the samples walls) could be adjusted so that the temperature evolutions inside the clay samples fit the optimal curve. The heating/cooling curves then fully exploited or compensated all the thermal processes that occur during the firing procedure. The graphical results are shown in Figure 10.
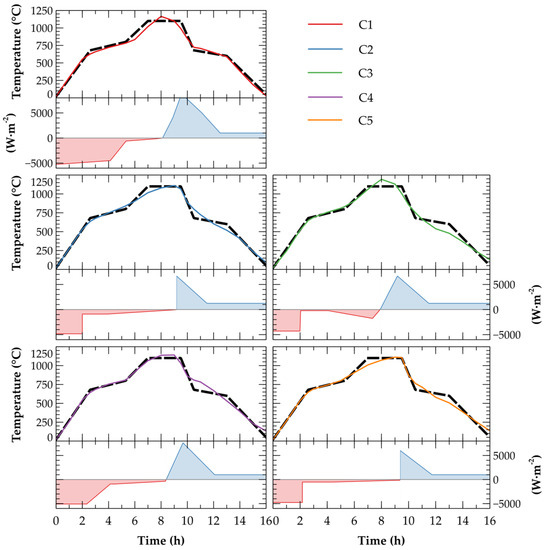
Figure 10.
Evolution of temperatures in particular clays when exposed to optimized firing schemes.
It is obvious that, by adjusting the boundary conditions, the temperature evolutions in the clay samples fit the optimal curve to a greater extent than in the previous case (see Figure 9). Each graph in Figure 10 is accompanied by a heat flux function, where the red color marks heating while the blue color marks cooling. The colored area then expresses the overall amount of energy related to one square meter of the sample required for reaching the optimal firing scheme. Due to a diversity of heating/cooling modes of the particular clays, a deeper insight is given in Table 5 describing the particular phases of the process.
Table 5.
Detailed description of the heating/cooling process.
As expected, the highest energy demands are shown for C1 and C4, which are rich with calcite and dolomite. These particular phase compositions resulted in the demands of 173.42 and 141.28 MJ·m−2, respectively. When the other clays undergo the firing process, the energy demands could be significantly reduced as C2 requires only 103.06 MJ·m−2, C5 92.33 MJ·m−2 and C3 88.58 MJ·m−2. The summary of firing demands adjustment is given in Table 6.
Table 6.
Evaluation of agreement of optimal and calculated firing temperatures of particular clays.
Since the RMSEs of the optimal and adjusted firing temperatures are relatively similar in all clays, accounting for ~45–55 °C, it can be concluded that the energy demands estimated are comparable to each other. The results therefore confirm that the adjustment of the firing parameters could be an effective way to reduce the energy demands. Comparing the values presented in Table 5, one can achieve energy savings of up to 48.9% when tailored firing schemes are used. The precise modeling of the temperature distribution in a furnace can therefore present an additional step of how to produce ceramics even in an even more efficient way considering not only functional properties but also the compromise between them and the environmental loads. On the other hand, it is important to notice that the results of energy demands calculations have rather a comparative value as they are based only on simplified presumptions that come from few small samples with specific dimensions. Precise calculations would require detailed specifications on brick arrangement in the furnace, furnace parameters, type of fuel, etc.
4. Conclusions
This paper focuses on optimizing the energy demands related to red clays firing. Since ceramics, bricks in particular, represent the main clay products of which physical limits have been almost reached, this research represents another step towards making the brick lifecycle more efficient. Due to the extensive brick production that goes along with heavy environmental loads, the optimization of the production process gains more importance. The main objective of the study was to treat clays individually by tailoring the firing boundary conditions so that all thermal processes occurring during firing would be exploited maximally.
Five different clays were chosen and subjected to experimental characterization to determine their chemical and phase compositions. The experimental work was followed by thermal analysis (DSC), the results of which were processed using the DSC model to obtain effective heat storage parameters of clays that accommodates ongoing thermal processes and, furthermore, are easy to be implemented in available mathematical models for description of heat transport. Being rich with calcite and dolomite, theh decomposition of whic is highly endothermic, the highest effective specific heat capacities were found in the cases of C1 and C4 clays, yielding up to 7400 J·kg−1·K−1. The dehydroxylation of clays or the quartz transition were among the other thermal processes that significantly formed the effective specific heat capacity curves of particular clays within the investigated temperature range.
The necessity of an individual treatment of the clays firing was demonstrated within a computational modeling of clay samples defined, which produced completely different temperature evolutions when a unified firing scheme was applied. Adjusting the firing boundary conditions in the form of heat fluxes using the genetic algorithm, the temperature evolutions of clay samples were modified to fit a given optimal temperature profile. While C1 and C4 required initial rapid firing power of more than 5000 W·m−2, a power of less than 4800 W·m−2 was sufficient for the other clays. Similarly, the cooling demands were found to be highest in the cases of C1 and C4, ranging between 7636 and 8000 W·m−2. On the other hand, the lowest cooling demand, only 3980 W·m−2, was identified as optimal for C3. Finally, by summing the heat fluxes, the energy demands for the particular clays were expressed. It was revealed that, in the cases of C2, C3, and C5, the energy consumption could be reduced by up to 49% when compared to C1 and C4. The most energy demanding clay was C1 (173.42 MJ·m−2) while C3 (88.58 MJ·m−2) was found to be the least demanding.
It is important to notice that the results of energy demands calculations have rather a comparative value as they are based only on simplified presumptions that come from few samples with specific dimensions. Precise calculations would require detailed specifications on brick arrangement in the furnace, furnace parameters, and type of fuel, which will be incorporated within the future work dealing with this issue.
Author Contributions
Conceptualization, V.K. and Z.S.; methodology, V.K.; software, J.M.; validation, G.Ł., Z.S. and J.M.; formal analysis, R.Č.; investigation, L.S. and M.K.; resources, L.S. and M.K.; data curation, L.S. and M.K.; writing—original draft preparation, V.K.; writing—review and editing, R.Č. and Z.S.; visualization, V.K.; supervision, R.Č.; project administration, J.M.; and funding acquisition, V.K. and R.Č. All authors have read and agreed to the published version of the manuscript.
Funding
This research was supported by the Ministry of Industry and Trade of the Czech Republic under project No. FV40007 and by the Integral Grant Agency of the Institute of Technology and Business in Ceske Budejovice under grant No. 8210-009.
Conflicts of Interest
The authors declare no conflict of interest.
References
- Torgal, F.P.; Jalali, S. Masonry Units. In Eco-Efficient Construction and Building Materials; Springer: London, UK, 2011; pp. 131–142. [Google Scholar]
- Munoz Velasco, P.; Morales Ortiz, M.P.; Mendivil Giro, M.A.; Munoz Velasco, L. Fired clay bricks manufactured by adding wastes as sustainable construction material—A review. Constr. Build. Mater. 2014, 63, 97–107. [Google Scholar] [CrossRef]
- Rashid, K.; Haq, E.U.; Kamran, M.S.; Munir, N.; Shahid, A.; Hanif, I. Experimental and finite element analysis on thermal conductivity of burnt clay bricks reinforced with fibers. Constr. Build. Mater. 2019, 221, 190–199. [Google Scholar] [CrossRef]
- Zhang, L. Production of bricks from waste materials—A review. Constr. Build. Mater. 2013, 47, 643–655. [Google Scholar] [CrossRef]
- Ul Rehman, M.; Ahmad, M.; Rashid, K. Influence of fluxing oxides from waste on the production and physico-mechanical properties of fired clay brick: A review. J. Build. Eng. 2020, 27, 17. [Google Scholar] [CrossRef]
- Murmu, A.L.; Patel, A. Towards sustainable bricks production: An overview. Constr. Build. Mater. 2018, 165, 112–125. [Google Scholar] [CrossRef]
- Oti, J.E.; Kinuthia, J.M.; Bai, J. Engineering properties of unfired clay masonry bricks. Eng. Geol. 2009, 107, 130–139. [Google Scholar] [CrossRef]
- El-Mahllawy, M.S.; Kandeel, A.M.; Abdel Latif, M.L.; El Nagar, A.M. The Feasibility of Using Marble Cutting Waste in a Sustainable Building Clay Industry. Recycling 2018, 3, 39. [Google Scholar]
- Galán-Marín, C.; Martínez-Rocamora, A.; Solís-Guzmán, J.; Rivera-Gómez, C. Natural Stabilized Earth Panels versus Conventional Façade Systems. Economic and Environmental Impact Assessment. Sustainability 2018, 10, 1020. [Google Scholar] [CrossRef]
- Rempel, A.R.; Rempel, A.W. Intrinsic Evaporative Cooling by Hygroscopic Earth Materials. Geosciences 2016, 6, 38. [Google Scholar] [CrossRef]
- Mobili, S.; Galán-Marín, C.; Rivera-Gómez, C. A New Affordable Masonry System Based on Unfired Clay Sandwich Panel. Proceedings 2018, 2, 1378. [Google Scholar] [CrossRef]
- Nagaraj, H.B.; Sravan, M.V.; Arun, T.G.; Jagadish, K.S. Role of lime with cement in long-term strength of Compressed Stabilized Earth Blocks. Int. J. Sustain. Built Environ. 2014, 3, 54–61. [Google Scholar] [CrossRef]
- Solgi, E.; Husseini, S.M.M.; Ahmadi, A.; Gitinavard, H. A hybrid hierarchical soft computing approach for the technology selection problem in brick industry considering environmental competencies: A case study. J. Environ. Manag. 2019, 248, 109219. [Google Scholar] [CrossRef] [PubMed]
- Pisello, A.L.; Fabiani, C.; Makaremi, N.; Castaldo, V.L.; Cavalaglio, G.; Nicolini, A.; Barbanera, M.; Cotana, F. Sustainable New Brick and Thermo-Acoustic Insulation Panel from Mineralization of Stranded Driftwood Residues. Energies 2016, 9, 20. [Google Scholar] [CrossRef]
- Refaey, H.A.; Abdel-Aziz, A.A.; Salem, M.R.; Abdelrahman, H.E.; Al-Dosoky, M.W. Thermal performance augmentation in the cooling zone of brick tunnel kilnwith two types of guide vanes. Int. J. Therm. Sci. 2018, 130, 264–277. [Google Scholar] [CrossRef]
- Tehzeeb, A.H.; Bhuiyan, M.; Jayasuriya, N. Evaluation of brick Kiln performances using computational fluid dynamics (CFD). Energy Environ. Eng. J. 2012, 1, 86–93. [Google Scholar]
- Dugwell, D.R.; Oakley, D.E. A model of heat transfer in tunnel kilns used for firing refractories. Int. J. Heat Mass Transf. 1988, 31, 2381–2390. [Google Scholar] [CrossRef]
- Gomez, R.S.; Porto, T.R.N.; Magalhaes, H.L.F.; Moreira, G.; Andre, A.; Melo, R.B.F.; Lima, A.G.B. Natural Gas Intermittent Kiln for the Ceramic Industry: A Transient Thermal Analysis. Energies 2019, 12, 29. [Google Scholar] [CrossRef]
- Riedel, R. Optimization of tunnel kilns by utilization of convection. Brick Tile Ind. Int. 1989, 42, 373–379. [Google Scholar]
- Soussi, N.; Kriaa, W.; Mhiri, H.; Bournot, P. Reduction of the energy consumption of a tunnel kiln by optimization of the recovered air mass flow from the cooling zone to the firing zone. Appl. Therm. Eng. 2017, 124, 1382–1391. [Google Scholar] [CrossRef]
- Mancuhan, E.; Kucukada, K. Optimization of fuel and air use in a tunnel kiln to produce coal admixed bricks. Appl. Therm. Eng. 2006, 26, 1556–1563. [Google Scholar] [CrossRef]
- Kaya, S.; Mancuhan, E.; Kucukada, K. Modeling and optimization of the firing zone of a tunnel kiln to predict the optimal feed locations and mass fluxes of the fuel and secondary air. Appl. Energy 2009, 86, 325–332. [Google Scholar] [CrossRef]
- Bruno, A.W.; Gallipoli, D.; Perlot, C.; Mendes, J. Optimization of bricks production by earth hypercompaction prior to firing. J. Clean. Prod. 2019, 214, 475–482. [Google Scholar] [CrossRef]
- Mancuhan, E.; Kucukada, K.; Alpman, E. Mathematical modeling and simulation of the preheating zone of a tunnel kiln. J. Therm. Sci. Technol. 2011, 31, 79–89. [Google Scholar]
- Koci, V.; Madera, J.; Trnik, A.; Cerny, R. Heat transport and storage processes in differential scanning calorimeter: Computational analysis and model validation. Int. J. Heat Mass Transf. 2019, 136, 355–364. [Google Scholar] [CrossRef]
- Hasan, A.; McCormack, S.J.; Huang, M.J.; Norton, B. Characterization of phase change materials for thermal control of photovoltaics using Differential Scanning Calorimetry and Temperature History Method. Energy Convers. Manag. 2014, 81, 322–329. [Google Scholar] [CrossRef]
- Tyagi, V.V.; Buddhi, D. Thermal cycle testing of calcium chloride hexahydrate as a possible PCM for latent heat storage. Sol. Energy Mater. Sol. Cells 2008, 92, 891–899. [Google Scholar] [CrossRef]
- Sari, A.; Karaipekli, A. Preparation and thermal properties of capric acid/palmitic acid eutectic mixture as a phase change energy storage material. Mater. Lett. 2008, 62, 903–906. [Google Scholar] [CrossRef]
- Krabbenhoft, K.; Damkilde, L.; Nazem, M. An implicit mixed enthalpy-temperature method for phase-change problems. Heat Mass Transf. 2007, 43, 233–241. [Google Scholar] [CrossRef]
- Lakatos, Á.; Trník, A. Thermal Diffusion in Fibrous Aerogel Blankets. Energies 2020, 13, 823. [Google Scholar] [CrossRef]
- Garcia Ten, J.; Orts, M.J.; Saburit, A.; Silva, G. Thermal conductivity of traditional ceramics. Part I: Influence of bulk density and firing temperature. Ceram. Int. 2010, 36, 1951–1959. [Google Scholar] [CrossRef]
- Garcia-Ten, J.; Orts, M.J.; Saburit, A.; Silva, G. Thermal conductivity of traditional ceramics Part II: Influence of mineralogical composition. Ceram. Int. 2010, 36, 2017–2024. [Google Scholar] [CrossRef]
- Ferrer, S.; Mezquita, A.; Gomez-Tena, M.P.; Machi, C.; Monfort, E. Estimation of the heat of reaction in traditional ceramic compositions. Appl. Clay Sci. 2015, 108, 28–39. [Google Scholar] [CrossRef]
- Koci, J.; Zumar, J.; Pavlik, Z.; Cerny, R. Application of genetic algorithm for determination of water vapor diffusion parameters of building materials. J. Build. Phys. 2012, 35, 238–250. [Google Scholar] [CrossRef]
- Park, H.S.; Kwon, B.; Shin, Y.; Kim, Y.; Hong, T.; Choi, S.W. Cost and CO2 Emission Optimization of Steel Reinforced Concrete Columns in High-Rise Buildings. Energies 2013, 6, 5609–5624. [Google Scholar] [CrossRef]
- Suleiman, A.R.; Nehdi, M.L. Modeling Self-Healing of Concrete Using Hybrid Genetic Algorithm-Artificial Neural Network. Materials 2017, 10, 135. [Google Scholar] [CrossRef]
- Shvarzman, A.; Kovler, K.; Grader, G.S.; Shter, G.E. The effect of dehydroxylation/amorphization degree on pozzolanic activity of kaolinite. Cem. Concr. Res. 2003, 33, 405–416. [Google Scholar] [CrossRef]
- Gualtieri, A.F.; Ferrari, S. Kinetics of illite dehydroxylation. Phys. Chem. Miner. 2006, 33, 490–501. [Google Scholar] [CrossRef]
- Dolino, G. The α-inc-β transitions of quartz: A century of research on displacive phase transitions. Phase Transit. Multinatl. J. 1990, 21, 59–72. [Google Scholar] [CrossRef]
- Karunadasa, K.S.P.; Manoratne, C.H.; Pitawala, H.M.T.G.A.; Rajapakse, R.M.G. Thermal decomposition of calcium carbonate (calcite polymorph) as examined by in-situ high-temperature X-ray powder diffraction. J. Phys. Chem. Solids 2019, 134, 21–28. [Google Scholar] [CrossRef]
- Choudary, R.B.; Burri, A.; Priya, K.V.P. Fabrication and testing of clay cups. Mater. Today Proc. 2020. [Google Scholar] [CrossRef]


© 2020 by the authors. Licensee MDPI, Basel, Switzerland. This article is an open access article distributed under the terms and conditions of the Creative Commons Attribution (CC BY) license (http://creativecommons.org/licenses/by/4.0/).