Abstract
Latvia’s industrial energy efficiency policy imposes the implementation of mandatory energy audits and energy management systems in large industrial enterprises and large industrial electricity consumers to improve industrial competitiveness, to move towards a carbon-neutral economy and to increase the security of supply. Companies affected by this energy efficiency policy are obliged to report to the national energy efficiency monitoring system on energy efficiency measures indicated in energy audits or energy management systems with the highest savings or economical potential. The purpose of this study was to assess the initial outcomes of the first industrial energy efficiency program in Latvia, using data from the national energy efficiency monitoring system, including an analysis of individual energy audit reports, and benchmarking it with findings from a similar program, thereby revealing untapped energy efficiency and CO2 emission reduction potential. Although the national monitoring system made it possible to ascertain results of the energy efficiency program, the statistical analysis of the data did not allow for a robust conclusion on the technical or economic industrial energy efficiency potential. This study suggests that Latvia’s energy efficient policy should continue its course in implementation and provides recommendations for improvements on the national energy efficiency monitoring system.
1. Introduction
For more than two decades, the European Union (EU) has been among front runners in terms of ambitious climate goals. The EU climate and energy framework for 2030 envisages the EU’s economy as a low-carbon, sustainable and climate-friendly economy, and at the same time, stresses the need for affordable energy prices for consumers [1]. In a comprehensive study on the electricity prices for energy-intensive industries in the EU and its global competitors, Lutz et al. [2] confirmed the importance of low electricity costs in maintaining the global competitiveness of energy intensive industries. To address the concern for competitiveness of Europe’s energy intensive industries, the European Commission offers the energy efficiency policy, which is one of the most crucial cornerstones in the ‘Clean energy for all Europeans’ proposal, as the tool to reduce the energy intensity of industrial activities [3]. Amendments to EU Directive 2012/27/EU (Energy Efficiency Directive) envisages even more ambitious energy efficiency targets and recognizes the essential importance of energy efficiency improvements to the environment, public health, reduction of greenhouse gases (GHG) emissions and energy security by reducing dependence on energy imports from outside the EU [4]. On 11 December 2019, the European Commission came up with even more ambitious climate goals by publishing the European Green Deal, aiming for EU GHG neutrality by 2050, which cannot be achieved without rapid and significant involvement of industry as industry is causing approximately 20% of all GHG emissions in the EU, and it takes 25 years for industry to transform all value chains and to be decarbonized [5]. In that sense, improvements in the energy efficiency of industry must be at the heart of the competitiveness of European industry, and therefore, more emphasis should be placed upon the industrial policies of Latvia and other new EU member states, which have hardly been addressed in this context.
The first energy efficiency program of Latvia was initiated in 2016 with the introduction of mandatory energy efficiency measures through energy audits and energy management systems. The national energy efficiency monitoring system (NEEMS) was established to gather information on identified and already achieved energy efficiency savings provided by companies under the program.
The objective of this research is to assess the outcomes of Latvia’s first industrial energy efficiency program by analyzing the data available in NEEMS and by benchmarking the identified energy efficiency potential of the most significant industrial sectors in Latvia (in terms of energy use and value added) with findings of a similar energy efficiency program in Sweden. Authors assume that since Latvia’s energy efficiency program has been developed only recently, there could be gaps and flaws in the program that limit the potential of program. The findings about Latvia’s first energy efficiency program could be used not only as a starting point to improve the energy efficiency program in Latvia, but also as a reference for other countries where similar energy efficiency programs are being developed.
The research was made in four steps (see Figure 1).
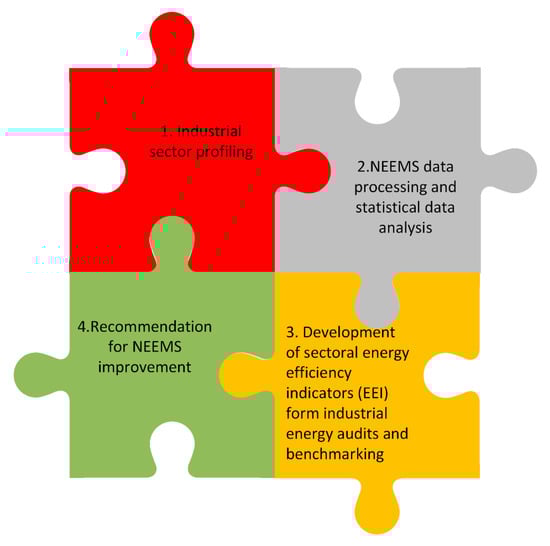
Figure 1.
Visualization of research steps.
In Section 2 and Section 3 of this article, the literature review and context of the study is described. In Section 4, we provide the methodology used. In Section 5 and its four sub-chapters, the authors present the results and discussions of four different steps of the research. Finally, short conclusions are presented.
2. Literature Review
While there are number of studies and publications related to the energy efficiency barriers and driving forces with the first efforts to classify energy efficiency barriers by Blumstein et al. [6], Jaffe and Stavins [7], Painuly and Reddy [8] and Weber [9], as well as a further taxonomy of barriers by Sorrell et al. [10] and Cagno et al. [11] and later studies concerning specific industries [12], there are only a few concerning policies and measures for industrial energy efficiency [13]. Some of the programs, the importance of which has been recently raised, include voluntary environmental management agreements [14], which encourage participants to decrease energy consumption and their environmental footprint by introducing the concept of continuous improvement using the Plan-Do-Check-Act Cycle [15] and energy audit programs [13]. Much of the EU’s energy policy is focused on large and energy intensive industries. The Energy Efficiency Directive envisages mandatory energy audits on large enterprises [16], and the concerns about the international competitiveness of EU industries are mainly focused on energy-intensive industries [5,17]. However, according to Backlund et al. [18], a relatively greater potential for energy efficiency could be identified in energy non-intensive industries, although non-intensive industries have less incentives and have more behavioral/organizational barriers, including lack of time, other priorities, weak organization or insufficient technical skills [19].
An assessment by Johansson et al. [13] on studies of Germany’s [20] and Sweden’s [21] energy policy programs for small and medium enterprises (SMEs) revealed that both programs raised the awareness of participants, while the financial barriers still remained. Overall, the participants benefited from the programs as the adoption rates of energy efficiency measures were higher than without the programs. The adopted energy efficiency measures in most cases were related to auxiliary processes (heating and cooling, ventilation, lighting and compressed air). Research performed by Johansson et al. [13] of different studies between 1970 and 2018 for SMEs revealed that a majority of studies were related to energy audit programs [20,21,22,23,24], and it was concluded that the highest energy efficiency potential is found in auxiliary processes, not in the main production process [20,21,22,23,25]. Johansson et al. also asserted that the countries most researched are such European countries as Sweden and Italy, as well as China [13].
Andersson et al. [26] suggest to use Energy Efficiency Cost Curves (EECC) to determine the cost-effective energy efficiency potential considering the technological and energy costs. However, the application of the EECC method depends on the comprehensiveness of data available on energy efficiency measures, their saving potential and related costs, as well as on possible productivity benefits identified by participants [27]. The importance of the amount and precision of input data required for benchmarking at the industrial process was highlighted by Lawrence et al. [28], as this makes it possible to identify where the efficiency measures can be placed. Furthermore, benchmarking on the international level could be performed with more aggregated data, thereby identifying the overall potential of energy efficiency [28].
3. Context of the Study
To promote energy efficiency for a wide range of industrial consumers in Latvia, the Energy Efficiency Law [29] has been adopted since 29 March 2016, which imposes mandatory energy audits and energy management systems in large enterprises and large electricity consumers. The legislative aspects were discussed in a previous publication [30].
The Ministry of Economics of the Republic of Latvia is responsible for monitoring the implementation of energy efficiency obligations applicable to large enterprises and large consumers. The regulation of the NEEMS [31] provides detailed rules on how large enterprises and large consumers report annually on the implementation of energy audits or energy management systems, as well as on those energy efficiency measures and savings identified and implemented for energy efficiency. The regulation [31] stipulates that each responsible party must initially submit at least three energy efficiency measures with the most savings indicated or with the greatest economic effect. The level of detail required in the initial report on planned measures is minimal: the name of the measure, planned date of implementation and planned annual energy savings. A copy of the energy management system certificate or a copy of the energy audit report, if the energy audit was performed, is also to be included in the report. The annual reports foresee a little more detailed information: name of measure, annual energy savings, distribution between specific activities (e.g., energy efficiency of buildings, lighting, equipment, transport, other), effective useful life of the measure and total costs of energy efficiency measures (not necessary to report on each measure separately if several measures are to be reported). There is no obligation to report any information in the annual report if no energy efficiency measures were performed [31].
Latvia’s energy efficiency policy—which imposes mandatory energy efficiency audits or energy management systems with mandatory reporting on those energy efficiency measures identified, planned and implemented and, in some cases, even provided energy tax rebates for energy intensive industries—was expected to ensure a comprehensive energy policy leading to a carbon neutral economy, security of supply and affordable energy.
4. Materials and Methods
This research was conducted in four steps according to the algorithm shown in Figure 2.
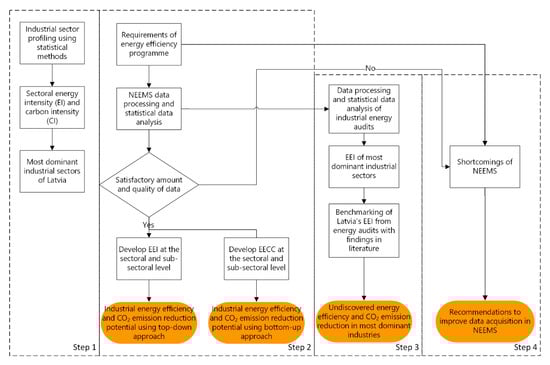
Figure 2.
Proposed algorithm of the research.
In the first step, we profiled industries in Latvia using two indicators. The first indicator is energy intensity (EI), which measures energy needed (in gigajoules) to produce a thousand euro of gross value added (GVA) at factor cost (Equation (1)). The second indicator is CO2 intensity (CI), which measures a certain industry’s emission factor of fuel mix in terms of CO2 emissions per MWh (Equation (2)).
where
- EI
- energy intensity of certain industrial sector (GJ/thousand euro);
- Eind
- final energy consumption of certain industrial sector (GJ);
- GVAind
- gross value added at factor costs of certain industrial sector (thousand euro).
- CI
- CO2 intensity of certain industry sector (t/MWh);
- EFf
- CO2 emissions factor of energy source f to n used in certain industrial sector (t/MWh);
- Ef
- energy source f to n used in certain industrial sector (MWh).
In the second step, we performed a statistical analysis of information available in NEEMS. The analysis was performed from May 2019 until October 2019. The aim of this step was to identify the correlation between the planned energy efficiency savings the program is delivering and the consumption level of the program’s participants, so that it could lead to the development of energy efficiency indicators (EEI) at sectoral and sub-sectoral levels and estimations of energy efficiency savings potential using a top-down approach. The sub-objective of this step was to examine the feasibility of constructing EECC, which could be further used to identify cost-effective industrial energy efficiency measures available, considering the technological and energy costs, and use them for industrial energy and CO2 savings estimation by using a bottom-up approach.
In the third step, we performed statistical analysis of 111 industrial energy audits available in NEEMS and calculated the average EEI for the most energy consuming industries in Latvia. The average EEI of the industrial sector (EEIS) were calculated as an arithmetic mean of individual EEIi, which measures the share of annual energy efficiency savings indicated in energy audits of total energy consumption (Equation (3)).
where
- EEIS
- sectoral energy efficiency indicator or the ratio of the industrial sector’s annual energy efficiency savings to the sector’s consumption level (no dimension);
- EEMi
- annual energy efficiency savings indicated in individual energy audits i to n of a certain industrial sector (MWh);
- Ei
- yearly consumption indicated in individual energy audits i to n of a certain industrial sector (MWh).
The average EEI of most energy consuming industries in Latvia were benchmarked with findings from a similar energy efficiency program in Sweden, where larger differences in sectoral EEI indicate undiscovered energy efficiency measures of Latvia’s policy and, accordingly, the potential for reducing CO2 emissions from energy efficiency measures.
Finally, in the last (fourth) step, we developed recommendations to improve data acquisition in NEEMS, which could remove some existing deficiencies found in this research and could enhance more comprehensive research in the future.
5. Results and Discussions
5.1. Sector Profiling of Latvia’s Industry
The most dominant industrial sector in Latvia both in terms of share of GVA at factor cost and energy consumption is the manufacture of wood and wood products (NACE C16); this sector consumed 62% of total industrial energy consumption in Latvia [32] and produced 24% of total industrial GVA at factor cost in Latvia [33] in 2017. An important aspect of detecting cost-effective energy efficiency measures is to correctly assess the market value of energy saved, since different MWh savings have different market values, and therefore, the determination of an actual energy mix of industries concerned is imperative. The actual energy mix also helps policy makers to evaluate the planned energy efficiency targets on climate goals, as different energy resources have a different climate footprint. Detailed information on Latvia’s industrial sector share of energy consumption and GVA, as well as its energy intensity (EI) and CO2 intensity (CI), are shown in Table 1.

Table 1.
Breakdown of energy consumption and GVA at factor cost by sectors of Latvia’s industry (%), energy intensity (EI) and CO2 intensity (CI) of Latvia’s industrial sectors in 2017 according to [32,33,34,35,36].
The top three energy consuming industries (C16, C23, C10–12) consumed 89% of all industrial energy consumption in Latvia in 2017; however, they produced 53% of industrial GVA at factor cost (see Table 1). The top three most energy consuming industries in Latvia also represent high levels of energy intensity across the industry and are noticeably higher compared to the EU average (see Figure 3).
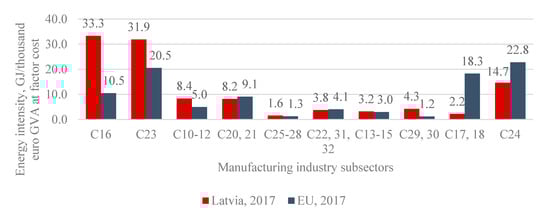
Figure 3.
Energy intensity of industrial subsectors in Latvia and EU average (2017) according to [32,33].
The only industrial sectors in Latvia that indicate significantly lower intensity compared to the EU average are C17,18 and C24, which can be explained by significant structural differences in these sectors, representing relatively small, niche companies in Latvia without significant energy consumption (1% of total consumption), in contrast to the EU, where these sectors are important energy consumers.
Latvia’s industrial energy mix is largely CO2 neutral, as the largest energy consumers (C16) mostly consume wood and wood products in their energy mix (see Figure 4).
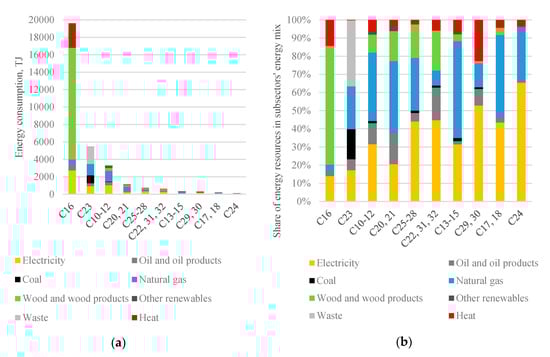
Figure 4.
Latvian’s industry energy mix: (a) energy resource absolute distribution (TJ), and (b) energy source proportional distribution (2017) according to [34].
Figure 4 shows that the share of electricity in the manufacturing industry energy mix is not crucial in the top three energy consuming industries at least, and much more emphasis should be placed on the thermal part of the technological processes.
5.2. Analysis of NEEMS
There are in total 1441 entities included in NEEMS, of which approximately 500 are industrial companies.
Data received from NEEMS contained:
- Each company’s main activity according to NACE Rev.2.0 division;
- Large enterprise/Large consumer identification according to classification of Energy Efficiency Law [29];
- Electricity (not energy) consumption for 2016–2018;
- Method via which each company fulfilled the Energy Efficiency Law obligations: energy audit/certified energy management system (ISO 50001) [37]/supplementary environmental management system (ISO 14001) [38];
- Each company’s targeted annual energy savings (MWh/year) and its distribution between specific activities (energy efficiency of buildings, lighting, equipment, transport, other);
- Each company’s already achieved annual energy savings in 2016–2017 (MWh) and their distribution among specific activities (energy efficiency of buildings, lighting, equipment, transport, other);
- Copies of performed energy audits, if an energy audit was performed.
Noting the differences between energy audits, which are more representative of the current situation in the company, and the energy management systems that are a long-term strategy dedicated to continuous monitoring and improvement of energy efficiency [37,38], we first clarified which method (energy audit or energy management system) was more widely used and ranked them depending on the annual electricity consumption level, as this was the only common indicator for all companies. Figure 5 shows the distribution of submitted energy audits, ISO 14001 management certificates and ISO 50001 certificates according to the company’s electricity consumption. Figure 5 also shows that larger electricity consumers tended to choose management systems over energy audits, which could be explained by the higher cost incurred for energy audits of larger companies due to more complex production processes and relatively well-known procedures for the implementation of quality standards for larger companies.
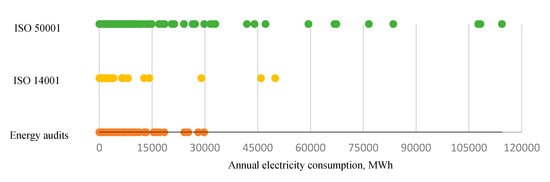
Figure 5.
Submitted energy audits, ISO14001 and ISO50001 distribution depending on electricity consumption.
Furthermore, we tried to identify correlation between the planned energy efficiency savings the program is delivering and the consumption level of program participants so that it could lead to the development of EEI in sectoral and sub-sectoral industrial levels for estimations of energy efficiency saving potential. However, NEEMS only collected data on the electricity consumption of participants instead of on energy consumption overall; therefore, annual planned energy savings can exceed 100% of electricity consumption as the savings can be achieved in the final energy mix as a whole. Figure 6 shows weak correlation between annual electricity consumption and targeted or planned energy efficiency savings; hence, it is groundless to claim that savings can be derived from electricity consumption alone, and it is crucial that the NEEMS collects all energy consumption data.
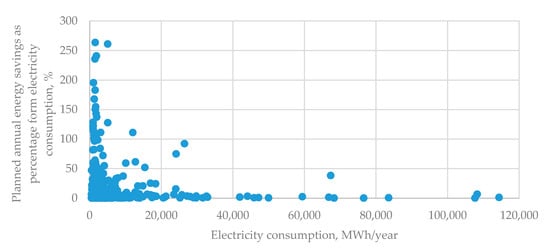
Figure 6.
Correlation between annual electricity consumption and planned annual energy savings.
The total projected annual industrial savings indicated in NEEMS to be achieved by 2022 is 190.3 GWh or 1.87% of current industrial energy consumption in Latvia. Three quarters (142.6 GWh) of the planned annual savings are expected to be achieved in lighting and equipment energy efficiency activities, 12.4 GWh (6.5%) is planned to be saved in buildings and 0.3 GWh, or practically nothing, is planned to be saved in transport activities, but a large part or 35 GWh (18%) is planned to be saved in uncategorized activities (see Figure 7). The already achieved savings in 2016 are 9.9 GWh or 0.10% and, in 2017, 59.3 GWh or 0.58% of industrial consumption in Latvia. Such modest initial results might be explained by the ramping-up time of the program. Comparing the annual planned savings by 2022 and achieved savings in 2017 by activities described in NEEMS, it can be seen from Figure 7 that in buildings 57% and in equipment 53% of the planned savings have been achieved. Savings in lighting have only reached 4% of the planned savings, but savings in transport have tripled compared to the originally planned savings, but it is still an insignificant activity for the manufacturing industry.
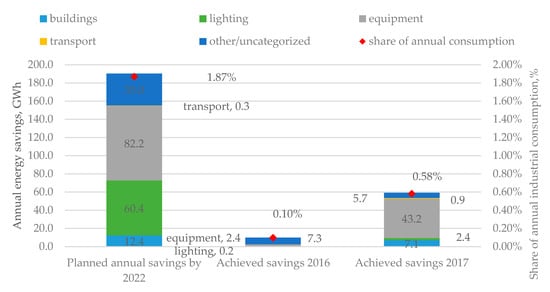
Figure 7.
Planned annual savings and achieved savings (2016–2017) by specific activities, GWh (left axis) and share of annual industrial consumption, % (right axis).
Industrial energy efficiency savings reflected in Figure 7 characterize specific energy efficiency program savings in Latvia. In order to identify the most cost-effective industrial energy efficiency measures available and industrial energy and CO2 savings potential using a bottom-up approach, it would be necessary to develop EECCs, the feasibility of which was one of the sub-tasks of this research. However, the data insufficiency in NEEMS imposes limitations on further usage of the research findings to develop EEI in sectoral and sub-sectoral industrial levels for estimations of energy efficiency saving potential or to develop EECCs.
A significant drawback is the fact that NEEMS only collects data on electricity consumption, not covering the energy consumption in its entirety. In addition, only the total cost of all energy efficiency measures at the company level is available, and there is no information available on the costs of the individual energy efficiency measures with regard to specific groups (e.g., lighting, appliances, etc.). This situation with the deficiencies of the initial organization of the energy monitoring system is in line with findings of Andersson et al. [26], which emphasize the importance of collecting high quality input data to develop robust energy efficiency policy programs, so that the energy efficiency potential of measures can be fully assessed.
Therefore, an important recommendation for the future development of the Latvian NEEMS and other policies related to the implementation of energy efficiency is the development of a good, convenient and practical data acquisition system, which would enhance comprehensive studies of energy efficiency potential and gaps in Latvia in the future.
5.3. Sectoral EEI of Most Energy Consuming Industries in Latvia from Energy Audits
As opposed to the generic data found in the NEEMS, energy audit reports contained more detailed information regarding the energy (not only electricity) consumption levels and proposed energy efficiency measures identified as a result of energy audits. We used data available in 111 industrial energy audits covering only part of the entire industrial energy efficiency program in Latvia.
Energy efficiency indicators (EEI) obtained from energy audits show weak correlation with energy consumption levels (see Figure 8). The identified energy efficiency potential in energy audits was in the range of 0.13% to 40.11%, with an average value of 6.53% (see Table 2).
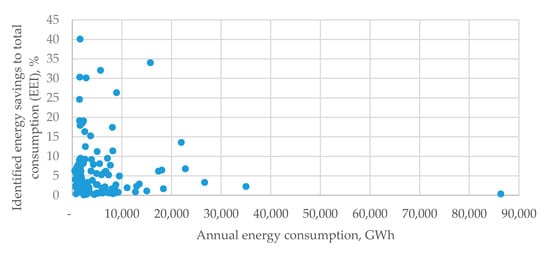
Figure 8.
Energy efficiency potential indicated by energy audits depending on annual consumption.
Table 2.
EEI indicated by energy audits.
The histogram of EEI (see Figure 9) shows that 93 (i.e., 84%) of energy audits recorded EEI below 10% and 18 (i.e., 16%) reported EEI in the range of 10% to 40%.
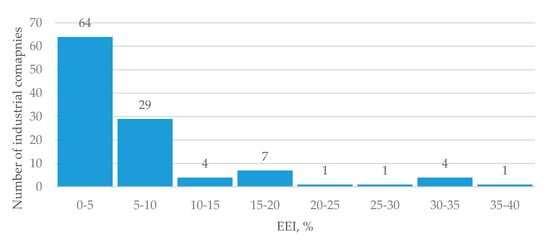
Figure 9.
Histogram of EEI indicated by energy audits.
Separate analysis was made for the top three energy consuming industries, which covers 89% of the industrial energy consumption in Latvia, based on energy audits from wood and wood products division (C16), from other non-metallic mineral products division (C23) and from food products, beverages and tobacco production divisions (C10–12). The results are summarized in Table 3.
Table 3.
EEIs of C16, C10–12 and C23 indicated by energy audits.
The average EEI of most energy consuming industries in Latvia is 6.68% in C16, 3.00% in C10–12 and 2.57% in C23, whereas according to Paramonova and Thollander’s research [23], a similar program in Sweden reported EEI of these sectors as follows: 18%, 11% and 20%, respectively. The noticeable differences in sectoral EEI might indicate undiscovered energy efficiency measures of Latvia’s policy and, accordingly, the potential for reducing CO2 emissions from energy efficiency measures. Table 4 shows potential energy efficiency savings in the top three energy consuming industries and their impact on CO2 emission reduction, taking into account EEI as identified in energy audits in Latvia and benchmarking it with a similar program in Sweden.
Table 4.
Annual energy consumption, CO2 intensity, energy efficiency potential (MWh) and CO2 reduction potential (t) in C16, C23 and C10–12.
It could be concluded that the undiscovered annual energy efficiency savings potential in Latvia’s top three energy consuming industries can be found by benchmarking the identified savings from energy audits in Latvia and a similar program in Sweden is 863 GWh, which corresponds to 91 thousand t of CO2 emissions (see Figure 10).
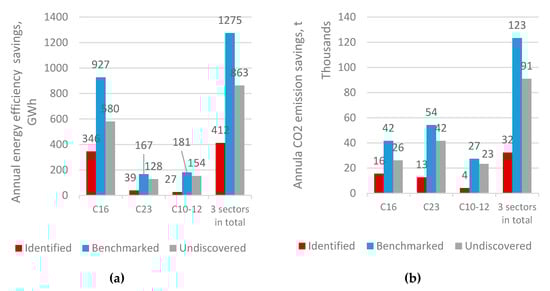
Figure 10.
Identified, benchmarked and undiscovered annual saving potential in C16, C23, C10–12 and in all three sectors: (a) energy consumption (GWh), and (b) CO2 emission (thousand tonnes).
Sectoral EEI for three of the highest energy consuming industries and their impact on CO2 emission reduction has been obtained from 65 energy audits that covered only 4 to 20% of the total energy consumption of the relevant industrial sector. Therefore, the results of energy efficiency and CO2 emission reduction potential of those three sectors should be interpreted with consideration of the limited data set. The improvement of the NEEMS would allow us overcome these limitations and the benchmarking method could be used to assess the performance of energy efficiency program in Latvia, as well as for future comparability studies of different energy audit policy programs worldwide.
5.4. Recommendations to Improve Data Acquisition in NEEMS
In addition to previously mentioned aspects that hinder the determination of energy efficiency potential through NEEMS, the authors highlight the absence of a unified electronic format for energy audits, which makes their processing time consuming. Manual analysis of energy audits revealed different approaches used by energy auditors and sometimes reluctance to go into industrial processes. Similar to findings in [20,21,22,23,25], energy auditors in Latvia often recommend energy efficiency measures for support processes rather than production processes. Some audit reports identify only three minimum energy efficiency measures, and sometimes all three are of the same type.
To overcome the shortcomings of NEEMS, the authors’ recommendations to policy makers are:
- Establish a centralized, mandatory online data collection platform where aggregate data can be entered into unified forms using templates from a drop-down list as much as possible.
- The amount of data to be collected should contain at least:
- 2.1.
- The company’s main activity at least in a Class level according to NACE Rev.2.0 classification [39];
- 2.2.
- The consumption data of all energy (fuel) types for at least the last three years to avoid annual fluctuations;
- 2.3.
- A list of identified (potential), planned and introduced energy efficiency measures by specific activities (energy efficiency of buildings, lighting, equipment, transport, other) or processes (from a pre-made drop-down list);
- 2.4.
- The evaluation of an annual energy saving potential by energy (fuel) type and the expected lifetime of measure for identified (technical), planned and implemented measures;
- 2.5.
- The costs of identified (potential), planned and introduced energy efficiency measures;
- 2.6.
- Each energy efficiency measure should contain self-assessment for reasoning to implement the measure or not from a drop-down list, identifying barriers and benefits (including non-energy related).
- Frequency of reporting should be made at least once a year.
- NEEMS users should have access to their own data and comparison with aggregated EEI of similar activity, providing benchmarking and facilitating a competitive attitude among participants.
6. Conclusions
The key conclusions drawn from the Latvia’s first industrial energy efficiency program research show that NEEMS, which was setup for monitoring the implementation of energy efficiency obligations applicable to large enterprises and large consumers, is sufficient for collecting information on already achieved energy efficiency savings; however, it is not applicable for the calculation of industrial energy efficiency potential. This is due to NEEMS only collecting data on electricity consumption and not covering the consumption in its entirety, and there is no information available on the costs of the individual energy efficiency measures with regard to specific groups (e.g., lighting, appliances, etc.), which imposes limitations on the usage of NEEMS for further research on the program’s improvement. The authors suggest substantial improvements on the process of data collection by standardizing reporting forms and introducing mandatory electronic environment for periodical data submissions to overcome limitations for further research on energy efficiency program improvement. These recommendations could also be applied in similar energy efficiency programs being developed worldwide.
Industrial sector profiling indicates that the top three energy consuming industries (C16, C23 and C10–12), which consume 89% of all industrial energy consumption in Latvia, are more energy intensive in terms of energy consumption of GVA compared to the EU average. The benchmarking of energy efficiency potential shown in energy audit reports in Latvia and a similar energy audit program in Sweden indicated undiscovered energy efficiency potential in these industries in Latvia, which could reach 862.6 GWh of annual energy savings, and which corresponds to 91 thousand tons of CO2 emissions. However, it should be noted that these results have been obtained from energy audits that covered only 4 to 20% of energy consumption of the relevant industrial sector; therefore, the results of the energy efficiency and CO2 emission reduction potential of those three sectors should be interpreted with the consideration of a limited data set. The improvement of the NEEMS would allow us to overcome data limitations, and the proposed benchmarking method could be used to assess the performance of the energy efficiency program in Latvia, as well as for future comparability studies of different energy audit policy programs worldwide.
Author Contributions
All the parts of manuscript were discussed among all the authors. K.L. was the main author and wrote all the parts. D.B. developed the conceptual part, while A.K. and A.B. structured the data from national energy efficiency monitoring system. All authors have read and agreed to the published version of the manuscript.
Funding
This research is funded by the Ministry of Economics of the Republic of Latvia, project "The pathway to energy efficient future for Latvia (EnergyPath)", project No. VPP-EM-EE-2018/1-0006.
Acknowledgments
We acknowledge that the data gathering and analysis was governed by a contract between the Riga Technical University and the Ministry of Economics of the Republic of Latvia on provision of access to data for scientific research on the companies’ energy consumption and planned energy efficiency measures.
Conflicts of Interest
The authors declare no conflict of interest. The funders had no role in the design of the study; in the collection, analyses, or interpretation of data; in the writing of the manuscript, or in the decision to publish the results.
References
- European Commission. A Framework Strategy for a Resilient Energy Union with a Forward-Looking Climate Change Policy; Publications Office of the European Union: Luxembourg, 2015; Available online: https://eur-lex.europa.eu/legal-content/EN/TXT/?uri=CELEX:52015DC0080 (accessed on 7 February 2020).
- Lutz, C.; Grave, K.; Mandana, H.; Boeve, S.; Blücher, F.V.; Bourgault, C.; Breitschopf, B.; Friedrichsen, N.; Arens, M.; Aydemir, A.; et al. Electricity Costs of Energy Intensive Industries: An International Comparison; Ecofys Germany GmbH: Berlin, Germany, 2015. [Google Scholar] [CrossRef]
- European Union, Directorate-General for Energy. Clean Energy for All Europeans; Publications Office of the European Union: Luxembourg, 2019; Available online: https://op.europa.eu/en/publication-detail/-/publication/b4e46873-7528-11e9-9f05-01aa75ed71a1 (accessed on 29 January 2020).
- European Union. Directive (EU) 2018/2002 of the European Parliament and of the Council of 11 December 2018 Amending Directive 2012/27/EU on Energy Efficiency; OJ L 328, 21.12.2018; Publications Office of the European Union: Luxembourg, 2018; pp. 210–230. [Google Scholar]
- European Union, European Commission. The European Green Deal; Publications Office of the European Union: Luxembourg, 2019; Available online: https://ec.europa.eu/info/sites/info/files/european-green-deal-communication_en.pdf (accessed on 30 January 2020).
- Blumstein, C.; Krieg, B.; Schipper, L.E.E.; York, C. Overcoming social and Institutional barriers to energy conservation. Energy 1980, 5, 355–371. [Google Scholar] [CrossRef]
- Jaffe, A.B.; Stavins, R.N. The energy-efficiency gap What does it mean? Energy Policy 1994, 22, 804–810. [Google Scholar] [CrossRef]
- Painuly, J.P.; Reddy, B.S. Electricity Conservation Programs: Barriers to Their Implementation. Energy Sources 1996, 18, 257–267. [Google Scholar] [CrossRef]
- Weber, L. Some reflections on barriers to the efficient use of energy. Energy Policy 1997, 25, 833–835. [Google Scholar] [CrossRef]
- Sorrell, S.; Schleich, J.; Scott, S.; O’malley, E.; Trace, F.; Boede, U.; Radgen, P. Reducing barriers to energy efficiency in public and private organizations. In Science and Policy Technology Research (SPRU); University of Sussex: Sussex, UK, 2000. [Google Scholar]
- Cagno, E.; Worrell, E.; Trianni, A.; Pugliese, G. A novel approach for barriers to industrial energy efficiency. Renew. Sustain. Energy Rev. 2013, 19, 290–308. [Google Scholar] [CrossRef]
- Brunke, J.C.; Johansson, M.; Thollander, P. Empirical investigation of barriers and drivers to the adoption of energy conservation measures, energy management practices and energy services in the Swedish iron and steel industry. J. Clean. Prod. 2014, 84, 509–525. [Google Scholar] [CrossRef]
- Johansson, I.; Mardan, N.; Cornelis, E.; Kimura, O.; Thollander, P. Designing Policies and Programmes for Improved Energy Efficiency in Industrial SMEs. Energies 2019, 12, 1338. [Google Scholar] [CrossRef]
- Zobel, T.; Malmgren, C. Evaluating the Management System Approach for Industrial Energy Efficiency Improvements. Energies 2016, 9, 774. [Google Scholar] [CrossRef]
- Thollander, P.; Palm, J. Industrial Energy Management Decision Making for Improved Energy Efficiency—Strategic System Perspectives and Situated Action in Combination. Energies 2015, 8, 5694–5703. [Google Scholar] [CrossRef]
- European Union. Directive 2012/27/EU of the European Parliament and of the Council of 25 October 2012 on Energy Efficiency, Amending Directives 2009/125/EC and 2010/30/EU and Repealing Directives 2004/8/EC and 2006/32/EC; OJ L 315, 14.11.2012; Publications Office of the European Union: Luxembourg, 2012; pp. 1–56. [Google Scholar]
- European Union, European Commission. Guidelines on State Aid for Environmental Protection and Energy 2014-2020. Communication from the Commission. Off. J. Eur. Union 2014, 57, 1–55. [Google Scholar]
- Backlund, S.; Broberg, S.; Ottosson, M.; Thollander, P. Energy efficiency potentials and energy management practices in Swedish firms. In Proceedings of the ECEEE 2012 Industry Summer Study, Arnhem, The Netherlands, 11–14 September 2012. [Google Scholar]
- Backman, F. Barriers to Energy Efficiency in Swedish Non-Energy-Intensive Micro- and Small-Sized Enterprises—A Case Study of a Local Energy Program. Energies 2017, 10, 100. [Google Scholar] [CrossRef]
- Fleiter, T.; Schleich, J.; Ravivanpong, P. Adoption of energy-efficiency measures in SMEs—An empirical analysis based on energy audit data from Germany. Energy Policy 2012, 51, 863–875. [Google Scholar] [CrossRef]
- Thollander, P.; Danestig, M.; Rohdin, P. Energy policies for increased industrial energy efficiency: Evaluation of a local energy programme for manufacturing SMEs. Energy Policy 2007, 35, 5774–5783. [Google Scholar] [CrossRef]
- Cagno, E.; Trianni, A. Analysis of the Most Effective Energy Efficiency Opportunities in Manufacturing Primary Metals, Plastics, and Textiles Small- and Medium-Sized Enterprises. J. Energy Resour. Technol. 2012, 134, 021005. [Google Scholar] [CrossRef]
- Paramonova, S.; Thollander, P. Ex-post impact and process evaluation of the Swedish energy audit policy programme for small and medium-sized enterprises. J. Clean. Prod. 2016, 135, 932–949. [Google Scholar] [CrossRef]
- Andersson, E.; Arfwidsson, O.; Bergstrand, V.; Thollander, P. A study of the comparability of energy audit program evaluations. J. Clean. Prod. 2017, 142, 2133–2139. [Google Scholar] [CrossRef]
- Thollander, P.; Paramonova, S.; Cornelis, E.; Kimura, O.; Trianni, A.; Karlsson, M.; Cagno, E.; Morales, I.; Navarro, J.P.J. International study on energy end-use data among industrial SMEs (small and medium-sized enterprises) and energy end-use efficiency improvement opportunities. J. Clean. Prod. 2015, 104, 282–296. [Google Scholar] [CrossRef]
- Andersson, E.; Karlsson, M.; Thollander, P.; Paramonova, S. Energy end-use and efficiency potentials among Swedish industrial small and medium-sized enterprises—A dataset analysis from the national energy audit program. Renew. Sustain. Energy Rev. 2018, 93, 165–177. [Google Scholar] [CrossRef]
- Nehler, T.; Rasmussen, J. How do firms consider non-energy benefits? Empirical findings on energy-efficiency investments in Swedish industry. J. Clean. Prod. 2016, 113, 472–482. [Google Scholar] [CrossRef]
- Lawrence, A.; Thollander, P.; Andrei, M.; Karlsson, M. Specific Energy Consumption/Use (SEC) in Energy Management for Improving Energy Efficiency in Industry: Meaning, Usage and Differences. Energies 2019, 12, 247. [Google Scholar] [CrossRef]
- Energy Efficiency Law. Available online: https://likumi.lv/ta/en/en/id/280932-energy-efficiency-law (accessed on 29 January 2020).
- Locmelis, K.; Blumberga, D.; Bariss, U. Energy efficiency in large industrial plants. Legislative aspects. Energy Procedia 2018, 147, 202–206. [Google Scholar] [CrossRef]
- Cabinet Regulations No. 668 Regarding the Energy Efficiency Monitoring and Applicable Energy Management System Standard. Available online: https://likumi.lv/ta/id/285878 (accessed on 29 January 2020).
- Statistical Office of the European Union. Simplified Energy Balances. Final Consumption—Industry Sector—Energy Use (FC_IND_E). 2020. Available online: https://ec.europa.eu/eurostat/data/database (accessed on 31 January 2020).
- Statistical Office of the European Union. Annual Detailed Enterprise Statistics for Industry. Value Added at Factor Cost (V12150). 2020. Available online: https://ec.europa.eu/eurostat/data/database (accessed on 10 February 2020).
- Central Statistics Bureau of Latvia, Database ENG020. Energy Balance. Available online: https://data1.csb.gov.lv/pxweb/en/vide/vide__energetika__ikgad/ENG020.px/ (accessed on 9 February 2020).
- The Intergovernmental Panel on Climate Change. IPCC Guidelines for National Greenhouse Gas Inventories. Available online: https://www.ipcc-nggip.iges.or.jp/public/2006gl/vol2.html (accessed on 31 January 2020).
- European Environmental Agency. CO2 Emission Intensity. Available online: https://www.eea.europa.eu/data-and-maps/daviz/co2-emission-intensity-5 (accessed on 31 January 2020).
- International Organization for Standardization. Energy management systems—Requirements with Guidance for Use (ISO Standard No. 50001). Available online: https://www.iso:standard/51297.html (accessed on 31 January 2020).
- International Organization for Standardization. Environmental Management Systems—Requirements with Guidance for Use (ISO Standard No.14011). Available online: https://www.iso:standard/60857.html (accessed on 31 January 2020).
- European Commission. NACE Rev. 2—Statistical Classification of Economic Activities in the European Community. Available online: https://ec.europa.eu/eurostat/documents/3859598/5902521/KS-RA-07-015-EN.PDF (accessed on 27 March 2020).


© 2020 by the authors. Licensee MDPI, Basel, Switzerland. This article is an open access article distributed under the terms and conditions of the Creative Commons Attribution (CC BY) license (http://creativecommons.org/licenses/by/4.0/).