Article

Simulation of Immiscible Water-Alternating-CO2 Flooding in the Liuhua Oilfield Offshore Guangdong, China

1
Guangdong Research Center for Unconventional Energy Engineering Technology, Guangdong University of Petrochemical Technology, Maoming 525000, China
2
CAS Key Laboratory of Ocean and Marginal Sea Geology, South China Sea Institute of Oceanology, Chinese Academy of Sciences, Guangzhou 510301, China
3
Key Laboratory of Renewable Energy, Guangzhou Institute of Energy Conversion, Chinese Academy of Sciences, Guangzhou 510640, China
4
UK-China (Guangdong) CCUS Centre, Guangzhou 510663, China
5
Business School, University of Edinburgh, Edinburgh EH8 9JS, UK
6
State Key Laboratory of Geomechanics and Geotechnical Engineering, Institute of Rock and Soil Mechanics, Chinese Academy of Sciences, Wuhan 430071, China
7
Energy Resource School (State Key Laboratory of Oil and Gas Reservoir Geology and Exploitation), Chengdu University of Technology, Chengdu 610059, China
8
Southern Marine Science and Engineering Guangdong Laboratory (Guangzhou), Guangzhou 511458, China
9
Innovation Academy of South China Sea Ecology and Environmental Engineering, Chinese Academy of Sciences, Guangzhou 511458, China
*
Author to whom correspondence should be addressed.
Energies 2020, 13(9), 2130; https://doi.org/10.3390/en13092130
Submission received: 27 March 2020 / Revised: 18 April 2020 / Accepted: 20 April 2020 / Published: 28 April 2020
(This article belongs to the Special Issue Investigation of Mechanisms Responsible for Enhanced Oil Recovery)

Abstract

:
In this paper, the immiscible water-alternating-CO2 flooding process at the LH11-1 oilfield, offshore Guangdong Province, was firstly evaluated using full-field reservoir simulation models. Based on a 3D geological model and oil production history, 16 scenarios of water-alternating-CO2 injection operations with different water alternating gas (WAG) ratios and slug sizes, as well as continuous CO2 injection (Con-CO2) and primary depletion production (No-CO2) scenarios, have been simulated spanning 20 years. The results represent a significant improvement in oil recovery by CO2 WAG over both Con-CO2 and No-CO2 scenarios. The WAG ratio and slug size of water affect the efficiency of oil recovery and CO2 injection. The optimum operations are those with WAG ratios lower than 1:2, which have the higher ultimate oil recovery factor of 24%. Although WAG reduced the CO2 injection volume, the CO2 storage efficiency is still high, more than 84% of the injected CO2 was sequestered in the reservoir. Results indicate that the immiscible water-alternating-CO2 processes can be optimized to improve significantly the performance of pressure maintenance and oil recovery in offshore reef heavy-oil reservoirs significantly. The simulation results suggest that the LH11-1 field is a good candidate site for immiscible CO2 enhanced oil recovery and storage for the Guangdong carbon capture, utilization and storage (GDCCUS) project.

Graphical Abstract

1. Introduction

In recent years, with the increase of energy consumption, global CO2 emissions have reached 33.1 Gt in 2018 [1], which indicates a serious situation in fighting global climate change. To achieve the targets in the Paris Agreement, the carbon capture, utilization and storage (CCUS) is considered as one of the key technologies of low carbon for reducing CO2 emissions [2]. CO2 Enhanced Oil Recovery (CO2-EOR), as an effective technology to sequestrate CO2 while generate additional oil reserve growth, is a most commercially viable way to deploy CCUS on a large scale [3]. Miscible CO2 flooding is more effective in terms of enhancing oil recovery due to the reduction in the interfacial tension. But for those reservoirs whose pressure is lower than the required minimum miscibility pressure (MMP) due to the oil properties and geological conditions, CO2 injection as a gas displacement recovery mechanism should be applied to enhance additional oil recovery. A specific type of gas displacement recovery is the CO2 immiscible water-alternating-gas (IWAG) displacement process. In this application, a water slug is put into injection well, followed by CO2 gas, which results in a separate phase from water and oil in the reservoir. CO2 IWAG projects have been implemented with varying WAG ratios and gas slug sizes, resulting in incremental reserves ranging from 2% to 9% and oil recovery from 14% to 20% [4]. In particular, several CO2 IWAG studies and pilot test projects have been implemented in offshore oilfields such as the Dulang field offshore Malaysia [5], E field offshore west Africa [6], western India offshore [7] and the North Sea [8,9]. These indicate that the CO2 IWAG applications in offshore oilfields are also beneficial for oil recovery and CO2 storage, and receiving significant attention. Unfortunately, the research and pilot projects for offshore CO2 IWAG are very inadequate, and so more extensive studies are urgently needed.
During preliminary evaluation of the CO2 storage potential and site screening for the Guangdong offshore CO2 utilization and storage project, we found that there is potential for a possible application of CO2 IWAG in the Liuhua 11-1 (LH) oilfield in the Pearl River Mouth Basin (PRMB) of the northern South China Sea. The suitability and potential of CO2-EOR and CO2 sequestration in the LH field are of great significance for Guangdong coastal CO2 emission reduction and oil production [10,11,12,13]. The detailed assessment of CO2-EOR and CO2 storage potential in the LH field has therefore become essential. Consequently, in this paper a full field evaluation and simulation study of the CO2 EOR process is applied to quantitatively analyze the mechanism and capacity for CO2-EOR and storage in the LH field. A 3D geological model for the LH field was built and compositional simulations for varying WAG injection scenarios (including Continue CO2 and a No-CO2 scenarios) were performed to predicate and evaluate the process of CO2-EOR and storage. This is the first attempt to evaluate the potential of immiscible CO2-EOR and storage potential in the PRMB at the full field scale. We hope that the results could provide a guidance for further development of the Guangdong offshore CO2-EOR and storage in the PRMB, as well as global offshore CCUS project.

2. Background

2.1. Geography and Geology

The Pearl River Mouth Basin (PRMB), developed between 111°20′˜118°0′E and 18°30′˜23°00′N, is the largest sedimentary basin in the northern South China Sea. The LH oilfield, developed in the Dongsha uplift of PRMB, and located ~ 210 km southeast of Hong Kong at a water depth of approximately 305 m (Figure 1A), is the biggest reefal heavy oilfield offshore China [14,15]. It is a NW-SE trending, elongate reefal buildup bounded to the north and south by normal faults of late Tertiary (Figure 1B) [16,17]. The field is primarily a stratigraphic trap formed as an isolated lower Miocene reefal buildup developed over a subtle basement high. The structure is 13 km long and 4 km wide with a closure area of 59.2 km2 and a vertical closure high of 87.0 m. It has an oil column height of 75 m and original oil water contact (OWC) at 1247 m. As shown in Figure 1B, the field is structurally composed of two highs, including the west high near the LH11-1-1A well and the east high north of the LH11-1-3 well. The principal part of the structure is relatively flat; two wings were cut by main faults. The boundary faults, parallel to the axis of the structure, have maximum vertical displacement of 70 m and the flat extension of 2 ~ 8 km, and extend longitudinally from the basement upward to the bottom of the quaternary formation [16,17]. Some small normal faults, parallel to the axis and having vertical displacement of 5 ~ 20 m, do not have a significant impact on fluid flow. A number of circular karstic sinkholes, identified from 3-D seismic survey, are present along the southern boundary fault [15].

2.2. Reservoir Characteristics

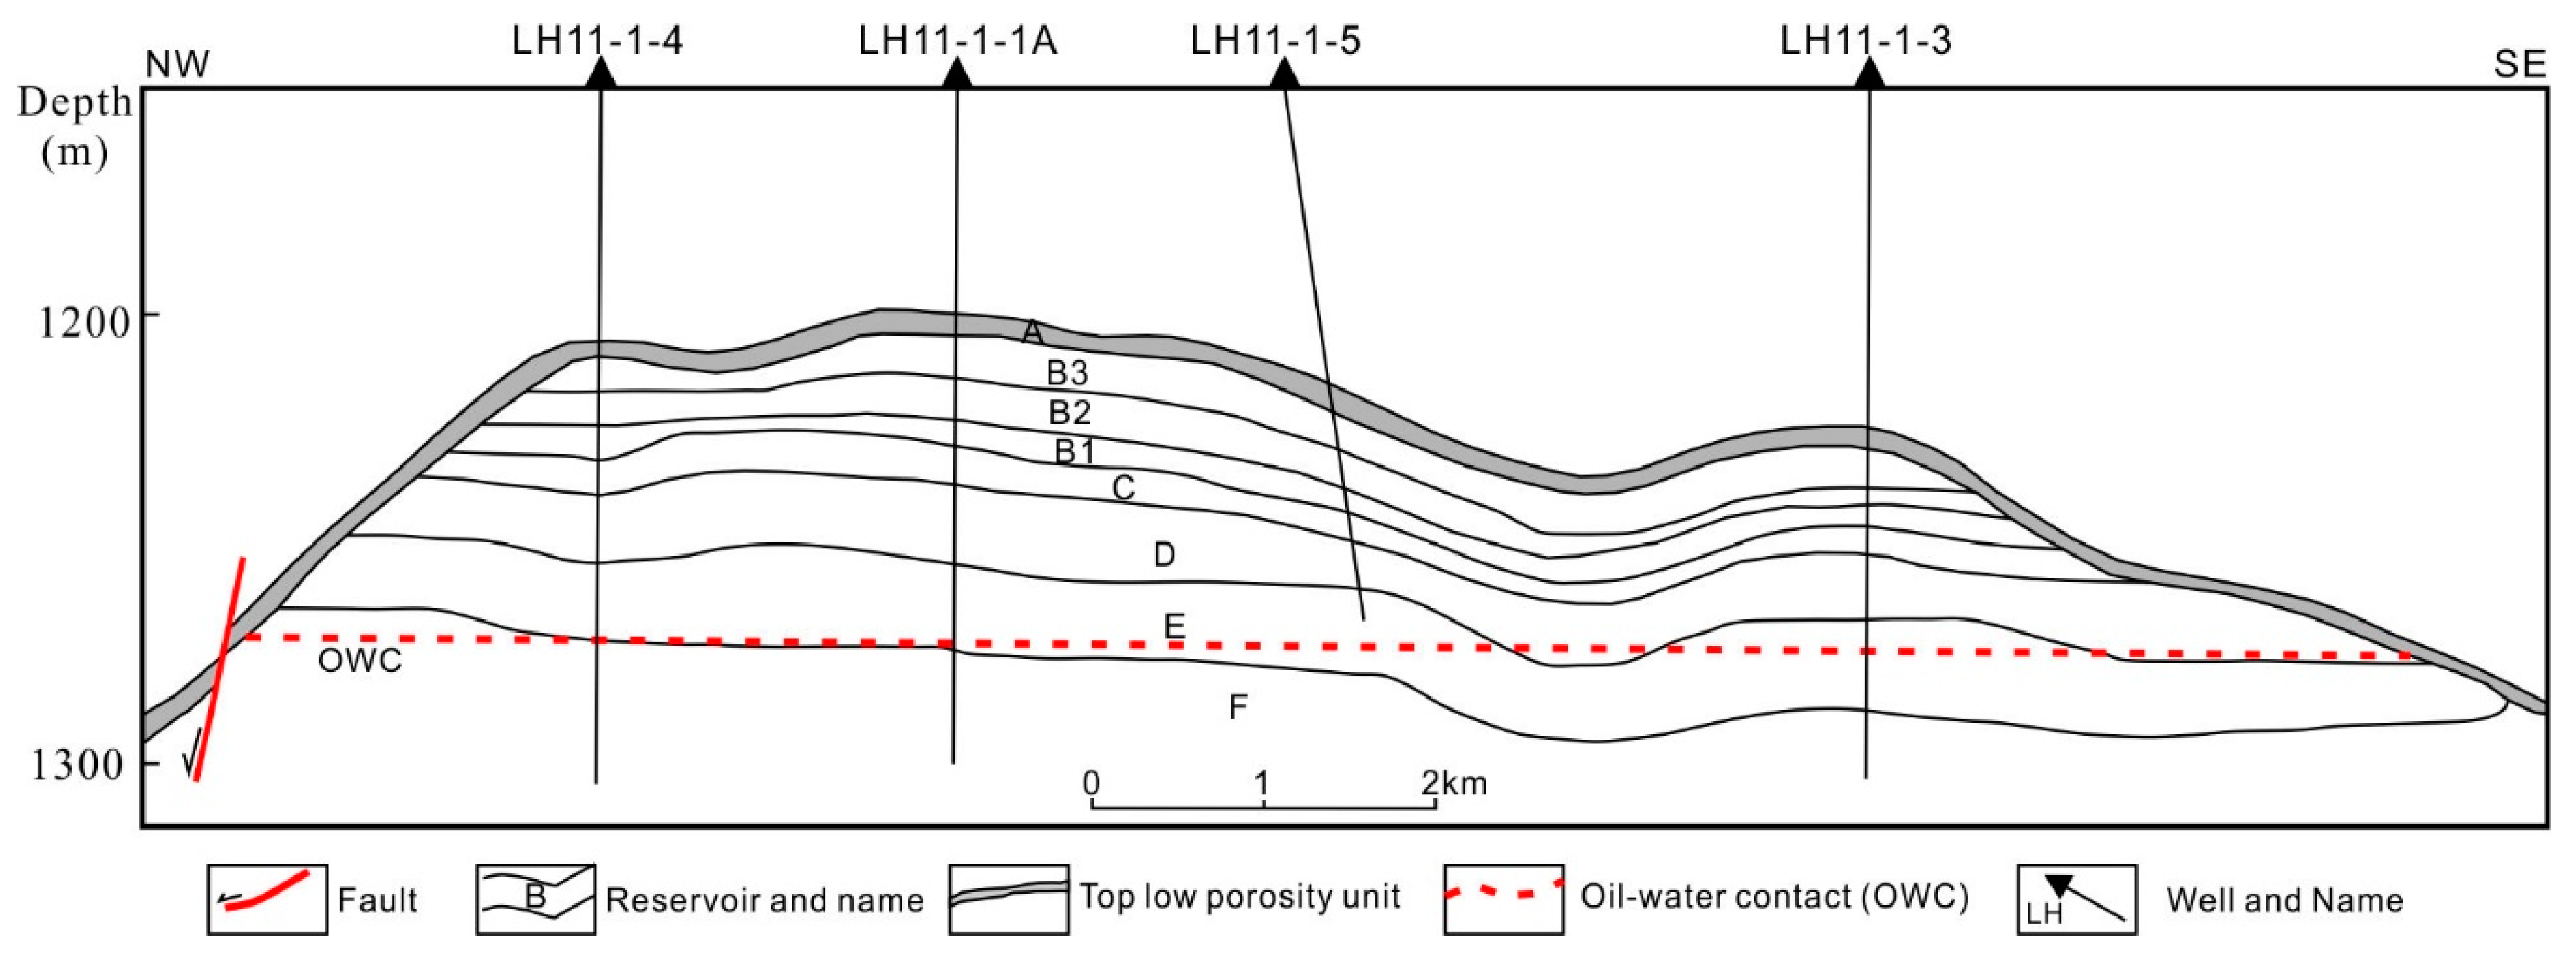
The oil-bearing reservoir in the LH oilfield is a multi-layered reef limestone unit with thickness of 75 m. The general parameters for the oil reservoirs in the LH field, as listed in Table 1, is highly stratified. The reservoir comprised 6 alternating stratigraphic and diagenetically thin zones of high porosity unit and tight unit based on the Dunham limestone classification [21] and the analysis of seismic data and evaluations of wireline logs and cores from the LH oilfield. The units labeled A-F from top to bottom as shown in Figure 2, in which B and D are major reservoir flow units and A, C and E are tight and mappable across the entire platform [14,22].
Unit A is a 3.1 ~ 4.0 m thick tight unit with average porosity of 10.7% ~ 14.5%, permeability of 6.4 ~ 27.6 mD and water saturation of 50.8 ~ 64.8%, containing several sediment facies and formed by drowning of the carbonate platform.
Unit B is a 17.5 ~ 26.9 m thick porous unit and is broadly subdivided into three sub-units (B1, B2 and B3), with the two most porous sections occurring at its top (B1) and base (B3). B1 is a firm, friable rhodolith-foraminiferal packstone with thickness of 7.9 ~ 8.5 m and porosity of 25 ~ 33%, which is the uppermost high-porosity unit within the field. B2 is 13.7 m thick and lithologically identical to B3 but is generally more cemented by opaque calcite cement. Unit B3 is 9 m thick and lithologically similar to B1 but shows higher porosity of 23 to 34%.
Unit C is a 2.9 ~ 7.6 m thick tight unit resulting from carbonate cementation in the phreatic zone beneath the palaeo-water table with only minor visual porosity in cuttings and cores.
Unit D is 11.5 ~ 18.5 m thick. It is overall the most porous unit due to the presence of predominantly grainstone and packstone with porosity of 15.8 ~ 30.7%, permeability of 514.02 ~ 383.0 mD and a low water saturation of 1.9 ~ 29.7%.
Unit E is a 16.0 ~ 18.4 m thick tight unit above the OWC forming the base of the reservoir. It forms a low-porosity zone of foraminiferal packstone with average porosity of 16% but varies widely. The low porosity may be a result of calcite cementation along the former OWC by degradation of oil by oxygen-rich water.
Unit F is a 91.6 m thick highly porous zone in the aquifer with porosity of up to 40%.
The LH oilfield produces biodegraded heavy crude oil with formation density of 0.899 ~ 0.930 g/cm3 and viscosity 46.5 ~ 162.1 mPa·s, and API gravity of 16 ~ 22 degree and low solution gas as listed in Table 2 [14,17,23]. The initial formation pressure in the LH oilfield is 12.66 MPa, the saturation pressure is 2.19 MPa, the formation pressure coefficient is 1.05, and the formation temperature is 52.2 °C, which show a normal temperature and pressure system in the reservoir. For crude oil potential, the proven geological oil reserve in LH oilfield is 1.66 × 10⁸ m3 (1.55 × 10⁸ t), the technical recoverable oil reserve is 0.26 × 10⁸ m3 (0.24 × 10⁸ t), and the economical recoverable oil reserve is 2547.20 × 104 m3 (2379.08 × 104 t) [16,17]. The oil reservoir is underlain by a large and permeable bottom aquifer. Water influx from the bottom aquifer is strong and expected to provide the energy for oil recovery and to dictate the recovery performance of the reservoir [24].

2.3. Field History

The LH field was discovered in 1987 with the drilling of well LH11-1-1A and the start of oil production in March, 1996. The oil production was developed with 25 long-radius horizontal wells drilled from a floating production system tied to a modular sub-sea structure. The LH oilfield contains very viscous (46.5 ~ 162.1 mPa·s) and low gravity (16-23 °API) crude oil in a challenging geological environment [23]. Consequently, oil production declined very quickly with highest water cut and lowest oil recovery in early development stage [17]. The water cut increased rapidly at the beginning stage of development of the oilfield, and the oil production decreased quickly too. The oil production rate of entire field reached a maximum of about 13 798 m3/d in September, 1996. The cumulative oil production was 1018.5 × 104 m3 by the end of 2001, and the water cut was up to 93.8%. When the water cut was more than 90%, the rate of oil production declined and the increase in the water cut slowed down. Although several enhanced recovery measures, such as adjustment and sidetracking, have been conducted, the oil production rate is still very slow and the oil recovery is low. The cumulative oil production of the field was 1519.3 × 104 m3 by the end of December 2007. The field only produces through horizontal wells and natural depletion operations, and does not take into account any EOR operation because of limitations including CO2 source supply, complex reservoir characteristics and marine engineering conditions [16].

3. Data and Methodology

3.1. Data Set and Parameters

The data of geology and oil production of LH oilfield used in this study are all referred from a oilfield database built by South China Sea Institute of Oceanology (SCSIO), Chinese Academy of Sciences through collecting industry data in publications such as papers, books, reports and atlases. Most of the information used in this paper references from 4 books as follows: Development of Oil and Gas fields of China [17], Petroleum geology of China [25], Atlas of oil and gas basins, China Sea [16], and Development practices of typical oilfield offshore China [26]. Due to the data confidentiality and limitation, the oil production data of the field in this paper is only to the end of 2005.

3.1.1. Reservoir Parameters

The reservoir property dataset consists of top structure maps of each layer interpreted from 3D seismic reflection cubes, wireline logs from three vertical wells (LH11-1–4, LH11-1–1A, LH11-1–3) and one horizontal well (LH11-1–5) and core data from well LH11-1–4 made available from the database of SCSIO. The log data include gamma-ray, sonic velocity, neutron porosity and bulk density logs for wells LH11-1–1A and LH11-1–3, and only porosity, gamma-ray and calculated acoustic impedance for wells LH11-1–4 and LH11-1-5. Permeability and water saturation were calculated by regressing porosity vs. permeability of core test and effective porosity vs. water saturation from log calculation referenced from Heubeck et al. [14]. The porosity and permeability were reinterpreted and calculated for four wells (LH11-1–4, LH11-1–1A, LH11-1–3 and LH11-1-5) as described in Story et al. [23] and contoured to control their vertical variations in the reservoir property model.

3.1.2. Equation of Sate

The laboratory studies of oil fluid samples taken from the LH reservoir are available for review and for the development of a multi-component equation of state (EoS) to match the phase behavior and carbon dioxide (CO2) interactions with crude oil in reservoir condition. In order to simulate the CO2 displacement process proposed for the LH oilfield, a compositional model description of the reservoir fluids was necessary which captures the wide changes in compositions and physical properties expected in the CO2 flooding process. Because the data of detailed oil composition from laboratory test was poor, the composition of the oil was simulated using WINPROP’s ‘Recombination’ tool according to the information form the oil chromatogram, gas/oil ratio, dissolved gas content, oil densitfy, and viscosity as shown in Table 2. This resulted in an eight components oil (C1 ~ 3, C11 ~ 15, C16 ~ 17, C18, C19 ~ 20, C21 ~ 25, C26 ~ 35 and C31+) as listed in Table 3. It was then matched with oil properties from laboratory tests using WINPROP through regression parameters of omega A and omega B to obtain the oil compositions fitted by phase diagrams and critical point pressures. Finally, an EoS was developed based on the Peng-Robinson formulation to match the fluid behavior. The EoS parameters were adjusted by regression of the 1998 data [27]. The resulted EoS file then was inputted into CMG-GEM for replacing fluid property and further simulation.

3.1.3. Minimum Miscible Pressure

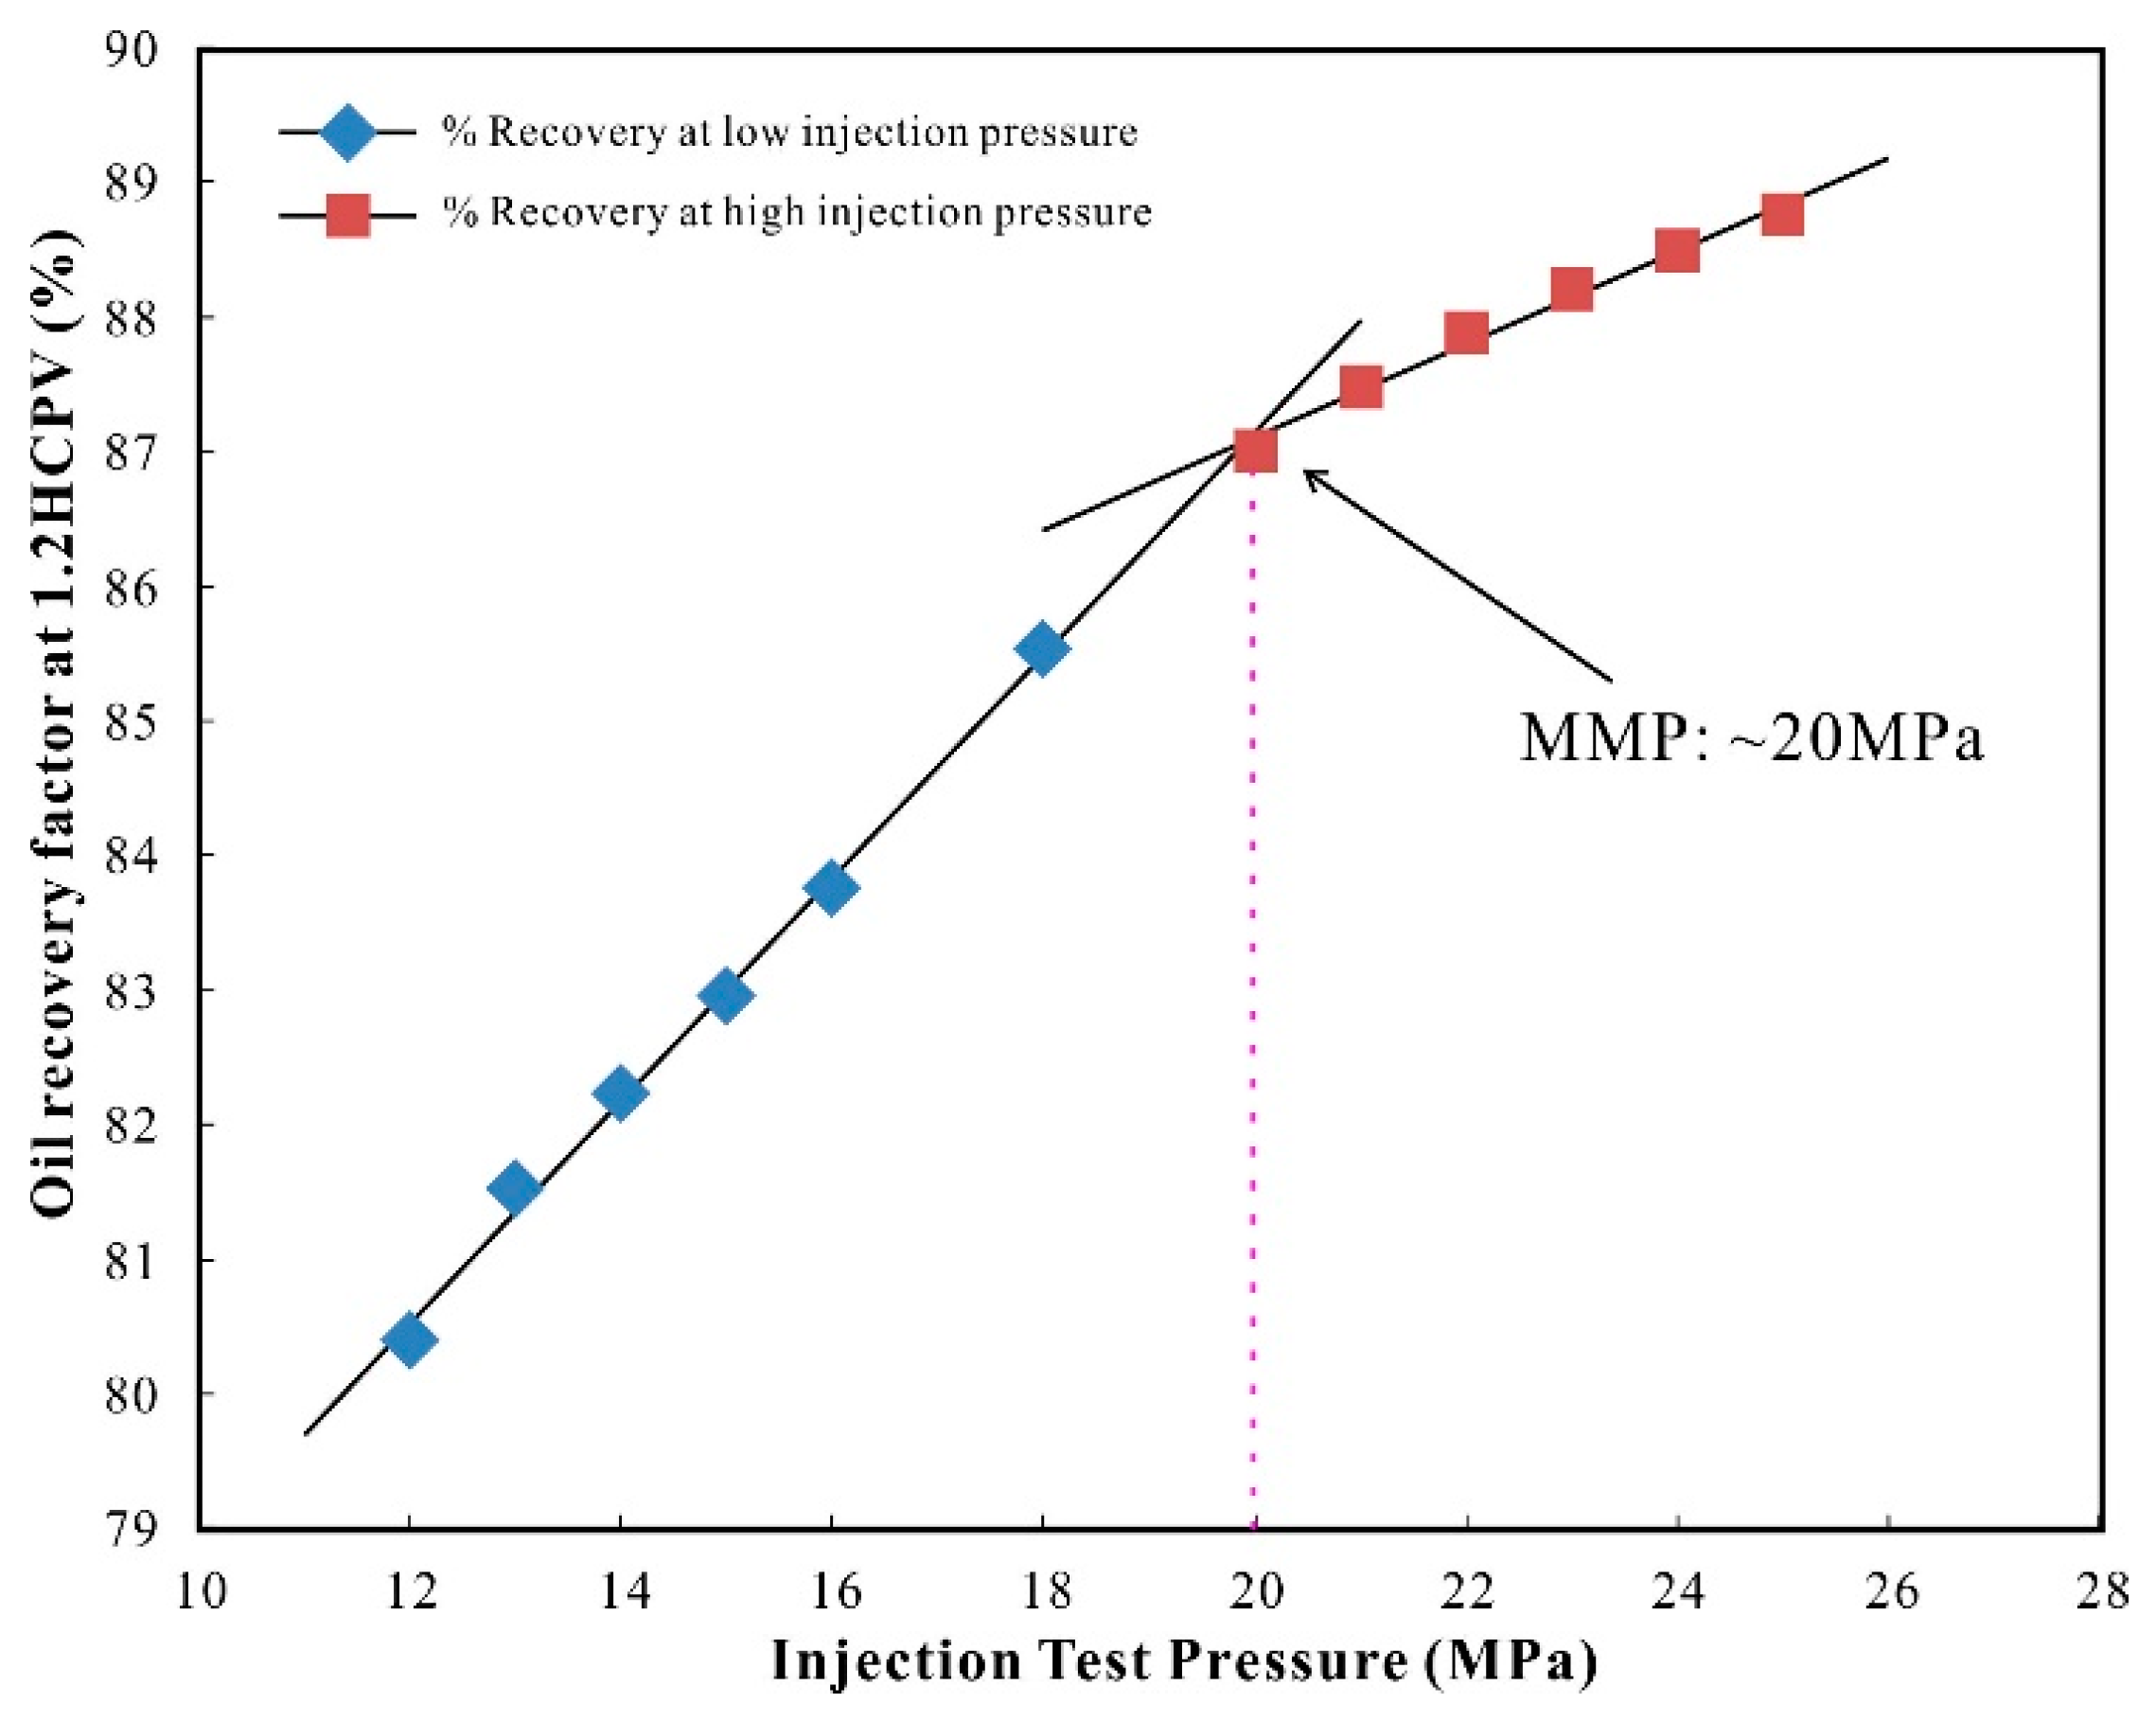
Because there are presently no available data of laboratory slim tube experiments from crude oil samples, we have made a set of 1D compositional models mimicking slim tubes at a range of constant reservoir temperature and pressure to determine the minimum miscible pressure (MMP) and analyze displacement mechanisms for the CO2 flooding process of the LH oilfield. The main parameters used in slim tube numerical simulation are listed in Table 4. The simulated results show that when the injection pressure reaches ~ 20 MPa, the oil recovery factor stopped increasing quickly as shown in Figure 3. This indicates that the MMP is approximately 20 MPa, which is much higher than the original formation pressure (12.66 MPa) in the LH field. Thus, we can conclude that the CO2 flooding process in the LH field should use an immiscible displacement mechanism with the in-situ crude oil.

3.2. Modelling and Simulation

3.2.1. Model Configuration

A detailed 3D geological model has been built in the Petrel platform through integrating the available log, core, fluid, and production data spanning 30 years. The top structure values of field and each sub-interval thickness were imported into the reservoir simulation mapping package to develop the original structural model. The model used an 8-zone description to represent internal geometry and the vertical stratigraphy of the field. The model, with 15,300 m length and 6,850 m width, has thickness of 66.4 m, and covers the entire area of the field at the depths from 1162.5 m to 1247 m. The model consists of 306 × 137 × 40 (total of 1,676,880) grid cells, and each cell is approximately 50 × 50 × 1.66 m. The interpolation with a Gaussian Random Simulation process was used to construct a layered 3D property model, including a porosity model (Figure 4a) and permeability model (Figure 4b), based on log data reinterpretations.
The average porosity and permeability in the 3D property model are 25.27 % and 621 mD, respectively. The error is < 3 % compared with the observed data from log, core and field test (porosity 25.27 % and permeability 651 mD, respectively), which indicates that the resulted models had relatively uniform characteristics compared to the real field. Thus, the 3D property model built in this paper is reliable and can be used in further CO2 flooding compositional simulation.
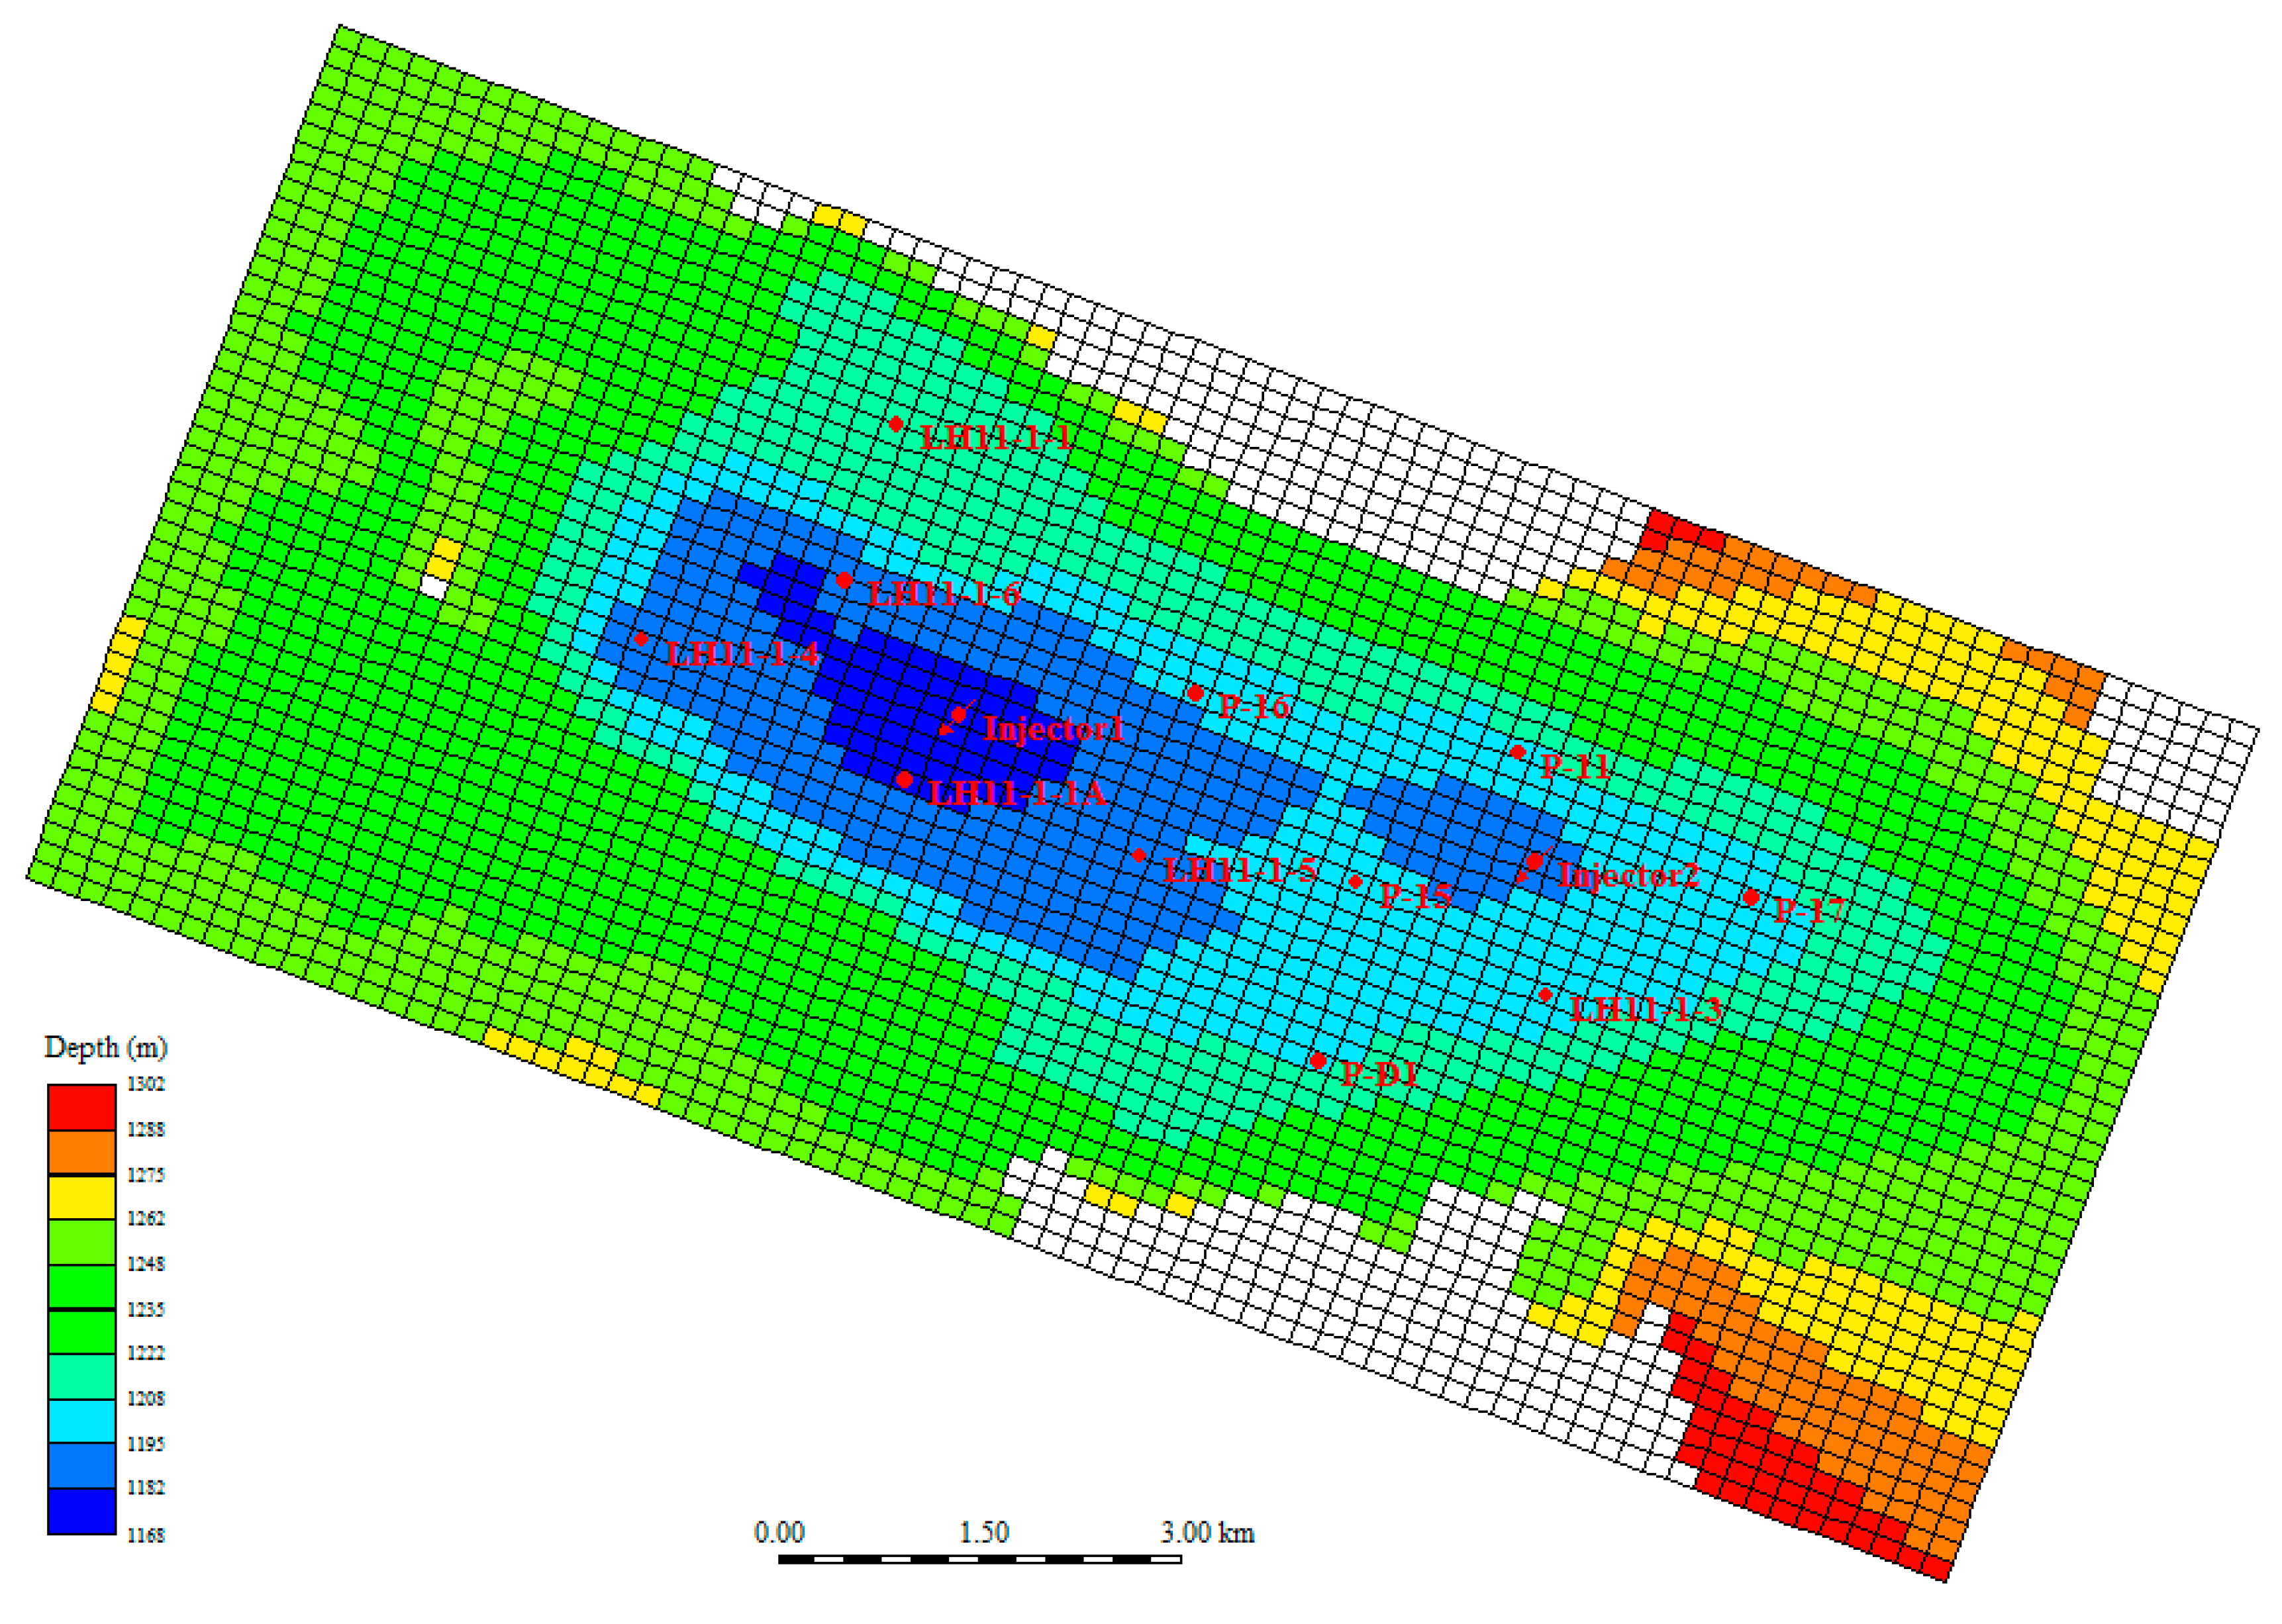
The 3D property model was then scaled up in Petrel and directly imported into the CMG-GEM calculator for a further CO2 injection simulation model. During the scaleup process, each zone was vertically divided into four or five grids according to reservoir thickness. The final simulation model used a 40 layers description to represent the vertical stratigraphy and fluid distribution in the reservoir simulation. Overall, the compositional simulation model comprised 76 × 45 × 40 (total of 136,800) grid blocks as shown in Figure 5.

3.2.2. Relative Permeability

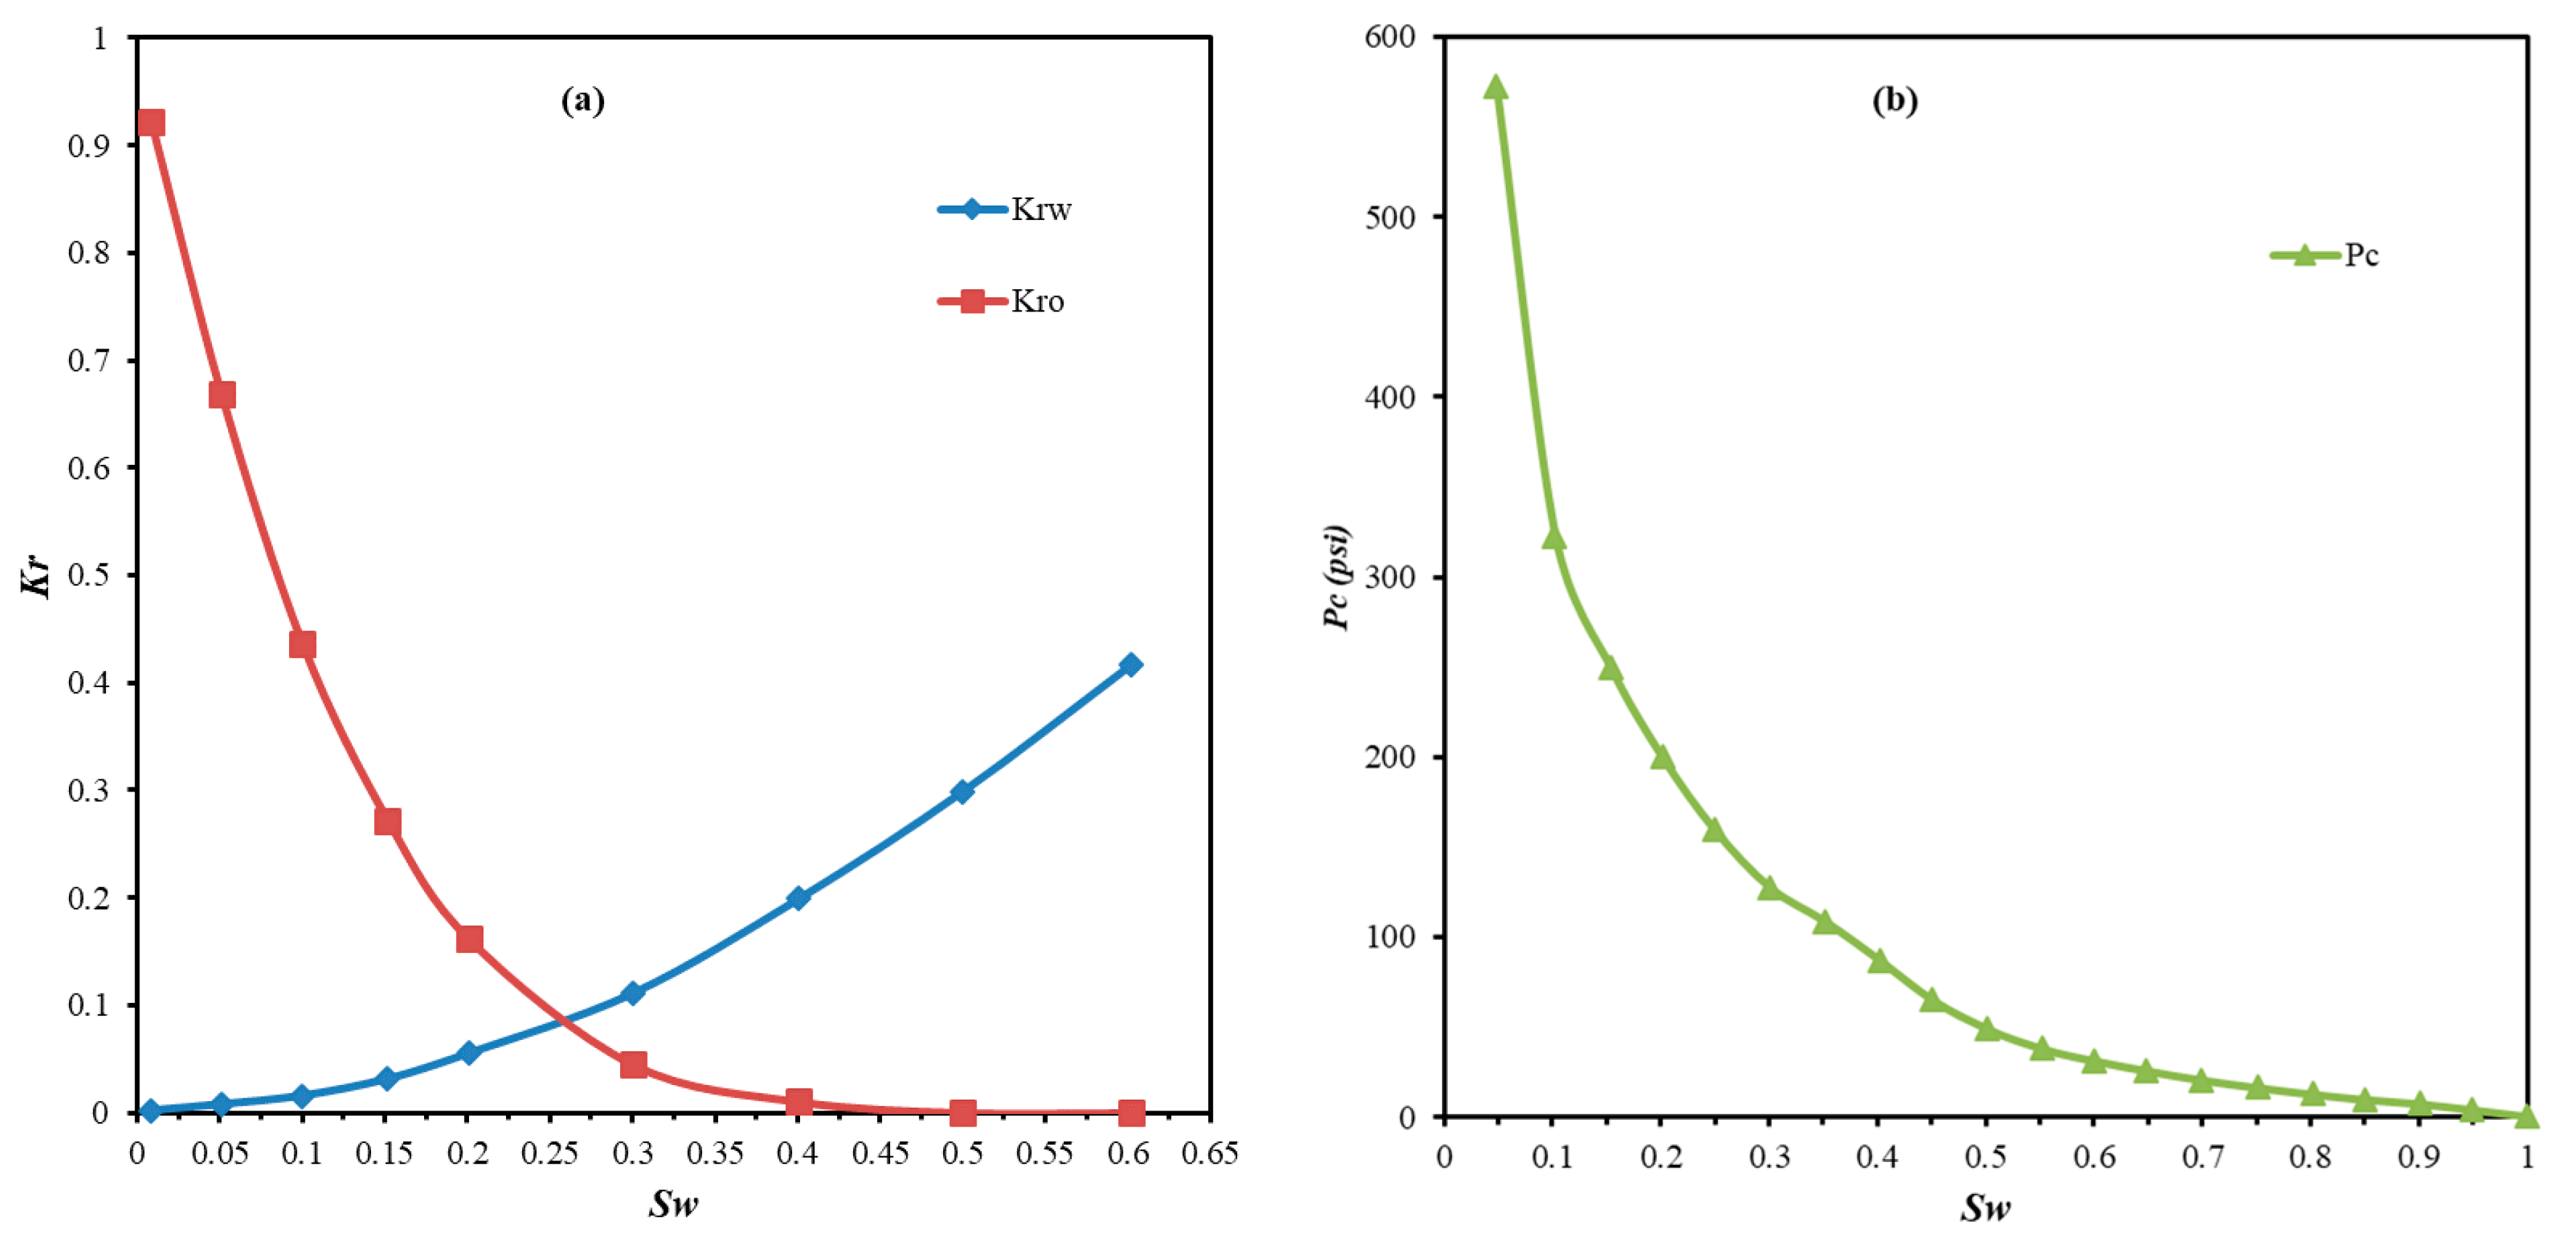
The available water-oil relative permeability (Kr) curves were tested from a total 16 steady-state core samples referenced from Story et al. [23]. As shown in Figure 6a, the normalized relative permeability curves of the oil-water phases indicate a preferential permeability to water in LH heavy oil reservoirs. The gas-oil imbibition relative permeability curves were calculated by pore scale model based on the experimental data of relative permeability in the displacement process of Figure 6a. Since there was no available capillary pressure (Pc) data for rock-type definition from a core test of the LH field, a common capillary pressure curve of peloidal−bioclastic packstone to grainstone data was used referencing from Hulea and Nicholls [29] for predicting saturation and permeability. The normalized capillary pressure curve was shown in Figure 6b. This is a mercury-air test data of limestone with a peloidal packstone to grainstone depositional fabric which is very similar to the reservoir stone of the LH field in the lithology and micropore-throat system. Initial water saturations were established using the J (Sw) Function approach as a function of height above the oil water contact and rock property (porosity and permeability). These curves were inputted into the model and used throughout the entire simulation model process and the curve shapes were modified during history matching.

3.2.3. Initialization

Based on the reservoir model described above, well positions were set to be representative of the actual positions of the initial oil production wells (including 6 wells: LH11-1–1, LH11-1–1A, LH11-1–3, LH11-1–4, LH11-1–5 and LH11-1–6) as shown in Figure 1 and Figure 5 [16,17]. The oil-water contact was set at 1247 m subsea, and a 12.66 MPa was used as the reservoir pressure for the middle formation case at 1230 m for the pressure balance of the model. Finally, the model was initialized as per the conditions at the beginning of production from the field.

3.2.4. History Match

Since available production history data ended in 2005, the history matching was performed to match the 20-year (1996 ~ 2005) of primary depletion production history of the field using the GEM simulator. Modifications were made to the primary reservoir parameters, including the relative permeability, capillary pressure and well productivity indices, to match the oil reserves and oil and water production history of the reservoir. Because of the variability of the historical data caused by pump operating conditions, temporary shut-ins and gauge accuracy, we mainly focused on matching the monthly average performance of oil rate and cumulative oil production instead of the transient variations of data. During the matching process, reservoir parameters known to have large uncertainties and questionable data quality were adjusted. All permeabilities were adjusted by a factor range of 0.05 ~ 0.2 to get the wells to produce at the required oil production rates and water cuts. After several simulation runs, we obtained a very good match with production history data including the monthly curves of cumulative oil production, oil rate, recovery factor and water cut. After the history matching, the reservoir mode is assumed to be an approximation of the field in terms of the pressure and residual oil saturation by the end of 2005.

3.2.5. Simulation Scenario Design

After the history matching process, the model was used to simulate and predict different scenarios including primary depletion production, continuous CO2 flooding and the CO2 IWAG processes. According to the primary production well distribution and reservoir structural characteristics, we designed a well pattern including 11 oil production wells and two CO2 injection wells for simulation forecasts as shown in Figure 5. The two injection wells are located at the two structural highs of the field structure. The settings of the oil production wells are all the same as those used in the primary production, which were constrained by a minimum bottom hole pressure (BHP) of 12.2MPa. The settings of the CO2 injection wells were constrained by a maximum bottom hole pressure (HP) of 15MPa and a maximum surface gas rate (STG) of 2 × 10⁵m3/d, and for water injection wells by a maximum BHP of 17 MPa. With a constant ratio of kz/kx (= 0.1) and a constant injection pressure, 20 simulation runs were set with various combinations of CO2 and water injection time, which resulted in various CO2-water slug sizes, as listed in Table 5.
As well as a WAG ratio of 1:1 (with the same slug size of CO2 and water), two different sets of WAG ratios were also evaluated, one in which the CO2 slug size was greater than the water slug size (WAG ratios of 2:1, 3:1 and 5:1), and the others in which the water slug size were greater than the CO2 slug size (WAG ratios of 1:2, 1:3 and 1:5). The natural depletion production (No-CO2) and continuous CO2 injection (Con-CO2) scenarios were also designed for comparison analysis. As data was limited to the end of 2005, our simulation assumed a start in 2005, the time period of the simulation in all of the scenarios being 20 years (2005–2025).

4. Results

We simulated runs for all the 18 WAG injection scenarios specified in Section 3.2.5, as well as for the continuous CO2 injection (Con-CO2) and primary depletion (No-CO2) scenarios. The resulting cumulative oil production, ultimate oil recovery factor, reservoir pressure buildup, and quantity of CO2 storage for the different scenario groups are presented in Table 6. The Con-CO2 simulation results show that the ultimate cumulative oil production at end of 20 simulation years is up to 28.8 × 10⁶ m3, which indicates a significant increase over the No-CO2 scenario result of 19.8 × 10⁶m3. The ultimate oil recovery of Con-CO2 at the end of 20 simulation years is 21.02%, which is much higher than 14.49% of the primary recovery factor of the No-CO2 scenario. Therefore, continuous injection of CO2 increases approximately an incremental ~ 7% of recovery factor which shows an obvious enhancement of oil recovery by CO2 flooding. The WAG simulation results for scenario groups with same CO2 and water slug ratio and different slug size will be described separately in detail in next sections.

4.1. Scenarios with WAG Ratio of 1:1

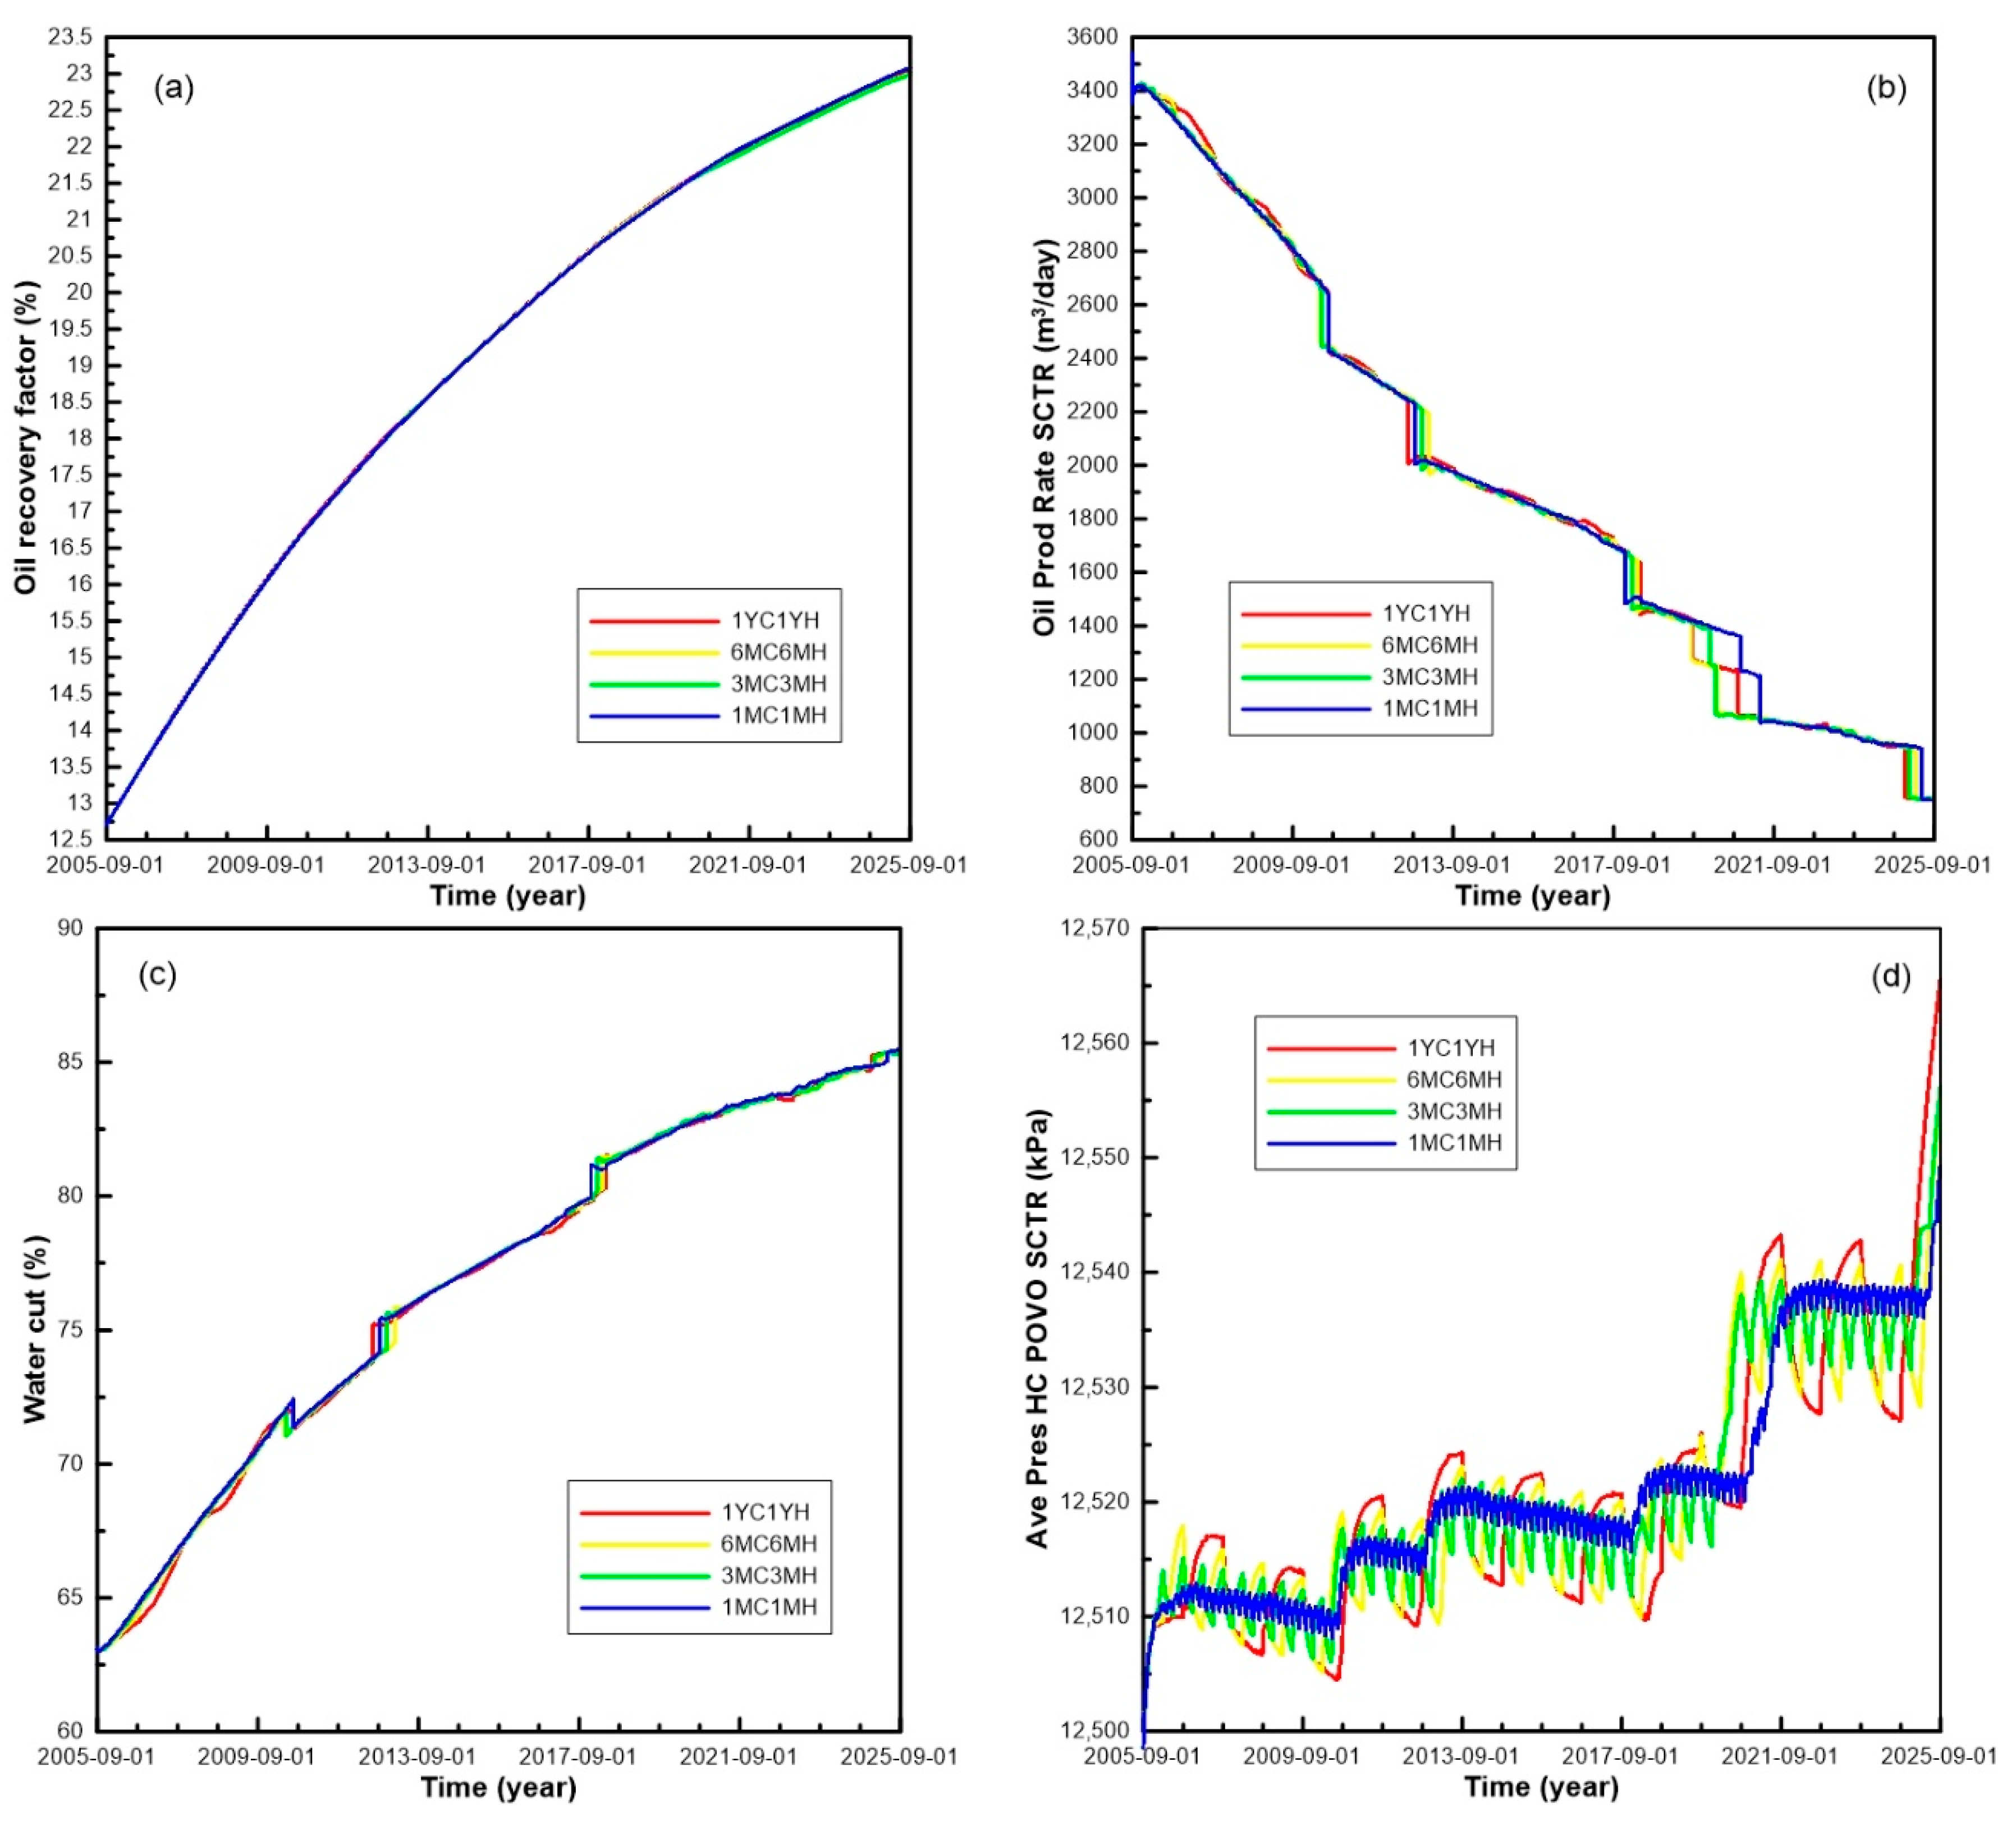
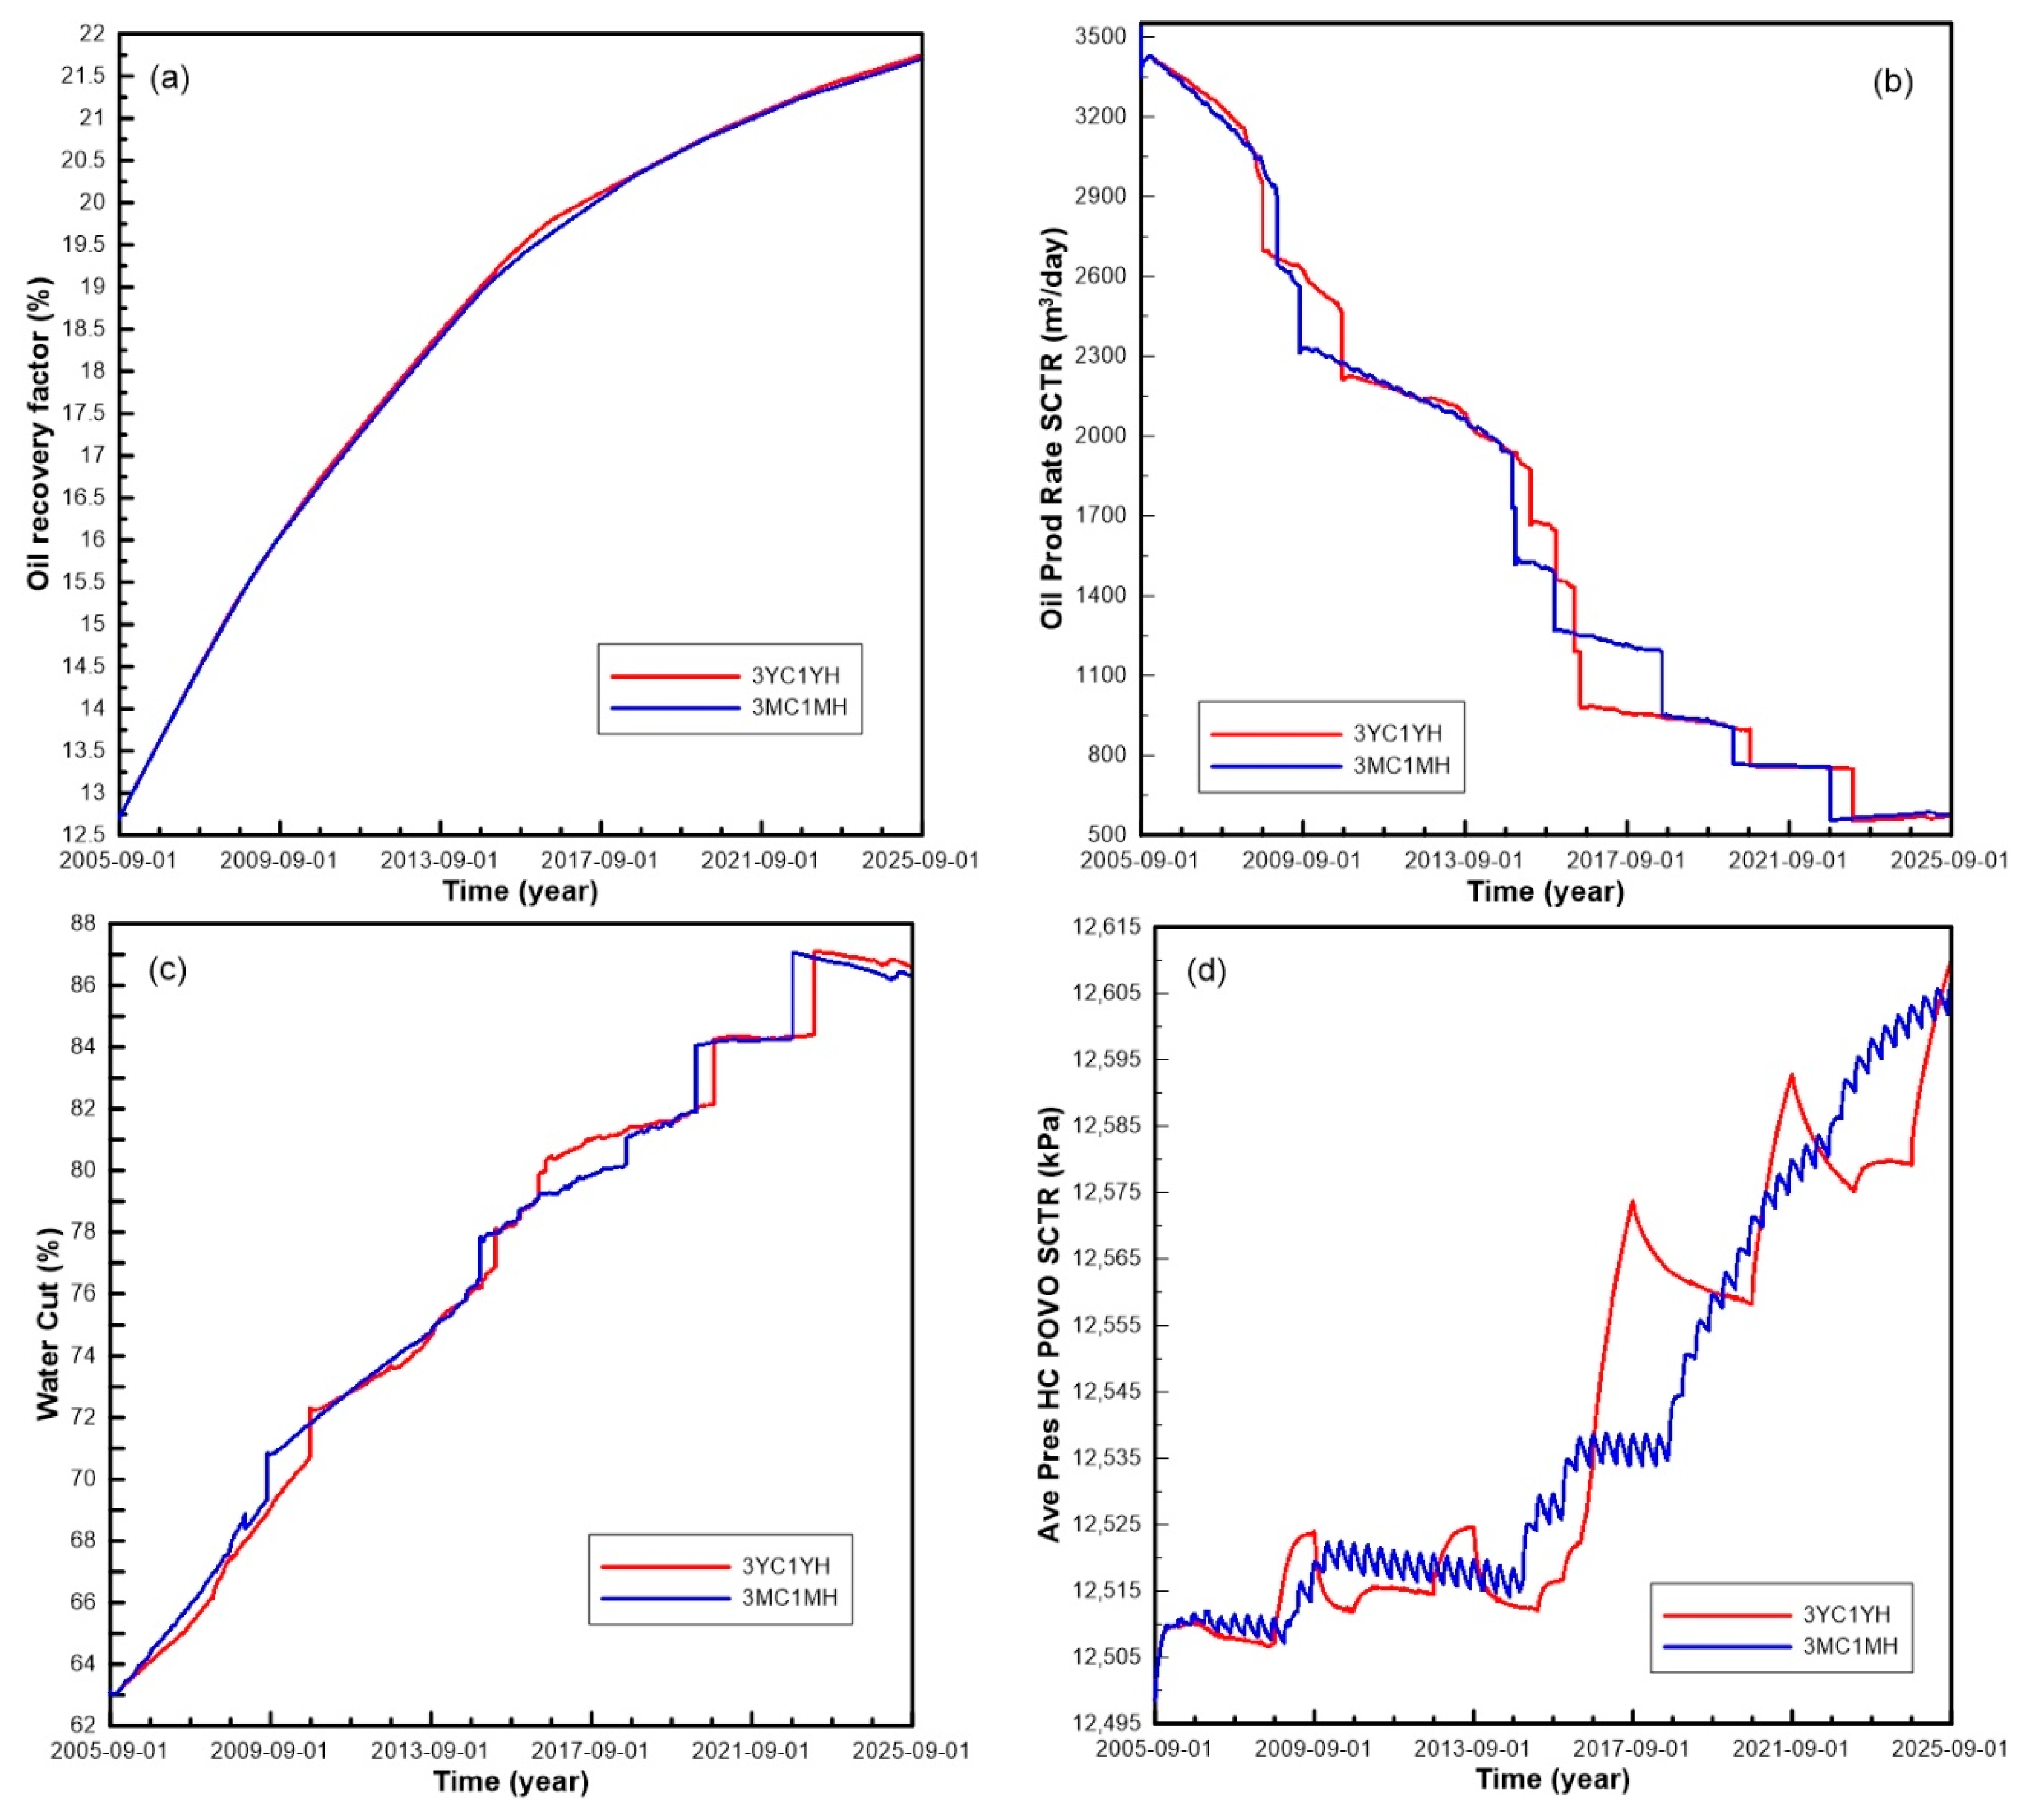
The scenario with a WAG ratio of 1:1 was simulated for four cases with different lengths of water and CO2 slug sizes as list in Table 5. The results show they have very similar output curves including recovery factor, oil production rate, water cut as shown in Figure 7. The ultimate recovery factor is up to 22.98 ~ 23.08% and water cut to 85.35 ~ 87.29% as listed in Table 6 and shown in Figure 7a,c. The oil production rate decreased slowly during flooding except for several small rapid drops (Figure 7b). The water cut increased slowly with one sudden drop and two raises (Figure 7c). The formation pressure was gradually built up in the form of serrated steps, but the increasing range was totally very small, only 30kPa. It can be seen from Figure 7d that the average reservoir pressure curves are zigzag due to the WAG process with different slug sizes of water and CO2. The larger the slug, the larger the range of serrated curve, and the larger the reservoir pressure buildups, but overall, they have a similar buildup trend, which indicate that the lengths of water and CO2 slug sizes only affect the amplitude of the pressure change, but not the overall trend.

4.2. Scenarios with WAG Ratio of 1:2

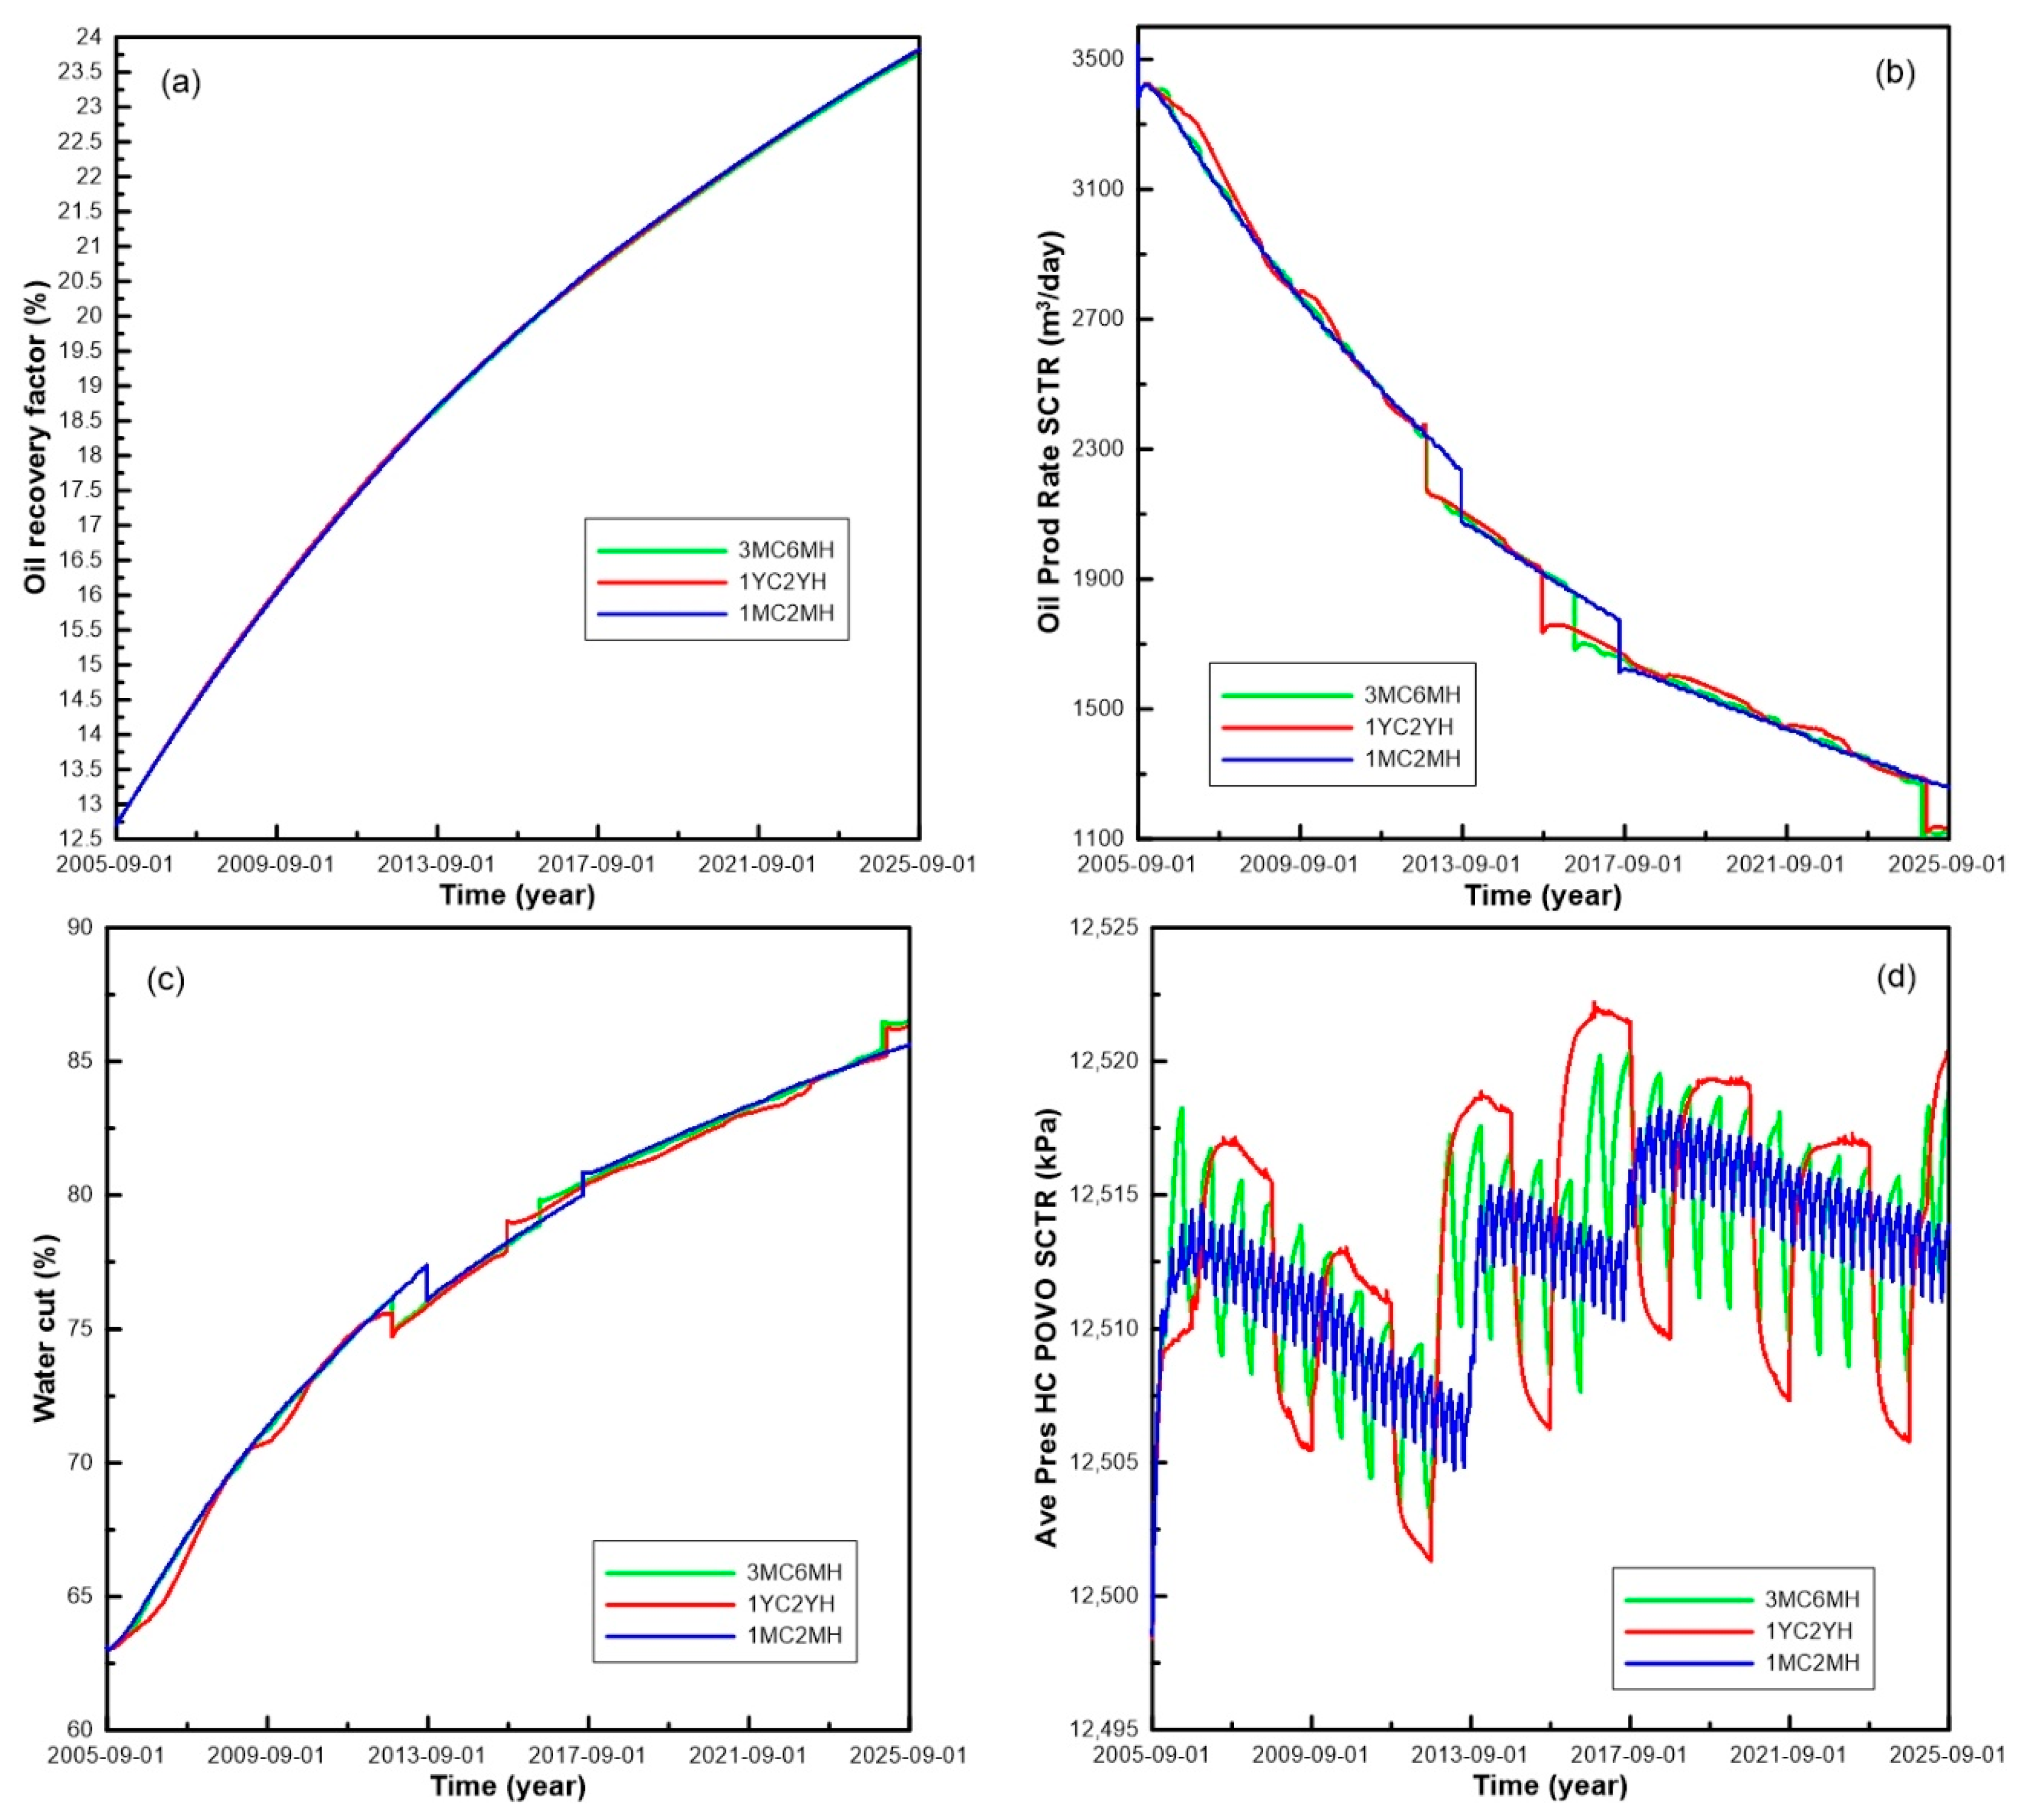
The simulation runs with a WAG ratio of 1:2 include three schemes with different slug lengths as listed in Table 5. The results show very similar output curves of oil recovery factors, oil production rates and water cuts as shown in Figure 8. The ultimate oil recovery factor after 20-year WAG process was up to 23.75 ~ 23.82%, water cut to 86.33 ~ 86.62% (Table 6 and Figure 8a,c). The oil production rate decreased slowly during the WAG process except for the two small rapid drops in the middle stage (Figure 8b). The average formation pressures show the characteristics of three stages (Figure 8d), which is like an inclined step, but the total change range is very small, only 20 kPa. As shown in Figure 8, with the increase of the length of CO2 and water slugs, the timing of the increases of water cut and the rapid drops of oil recovery factor were advanced, and the serrated amplitude of formation pressure increased. These indicate that the short CO2-water slug is relatively beneficial to reduce water cut, slow down the decline of oil production rate and keep the reservoir pressure stable. But on the whole, the trends of the curves of three schemes are basically the same, and the ranges of change are small.

4.3. Scenarios with WAG Ratio of 2:1

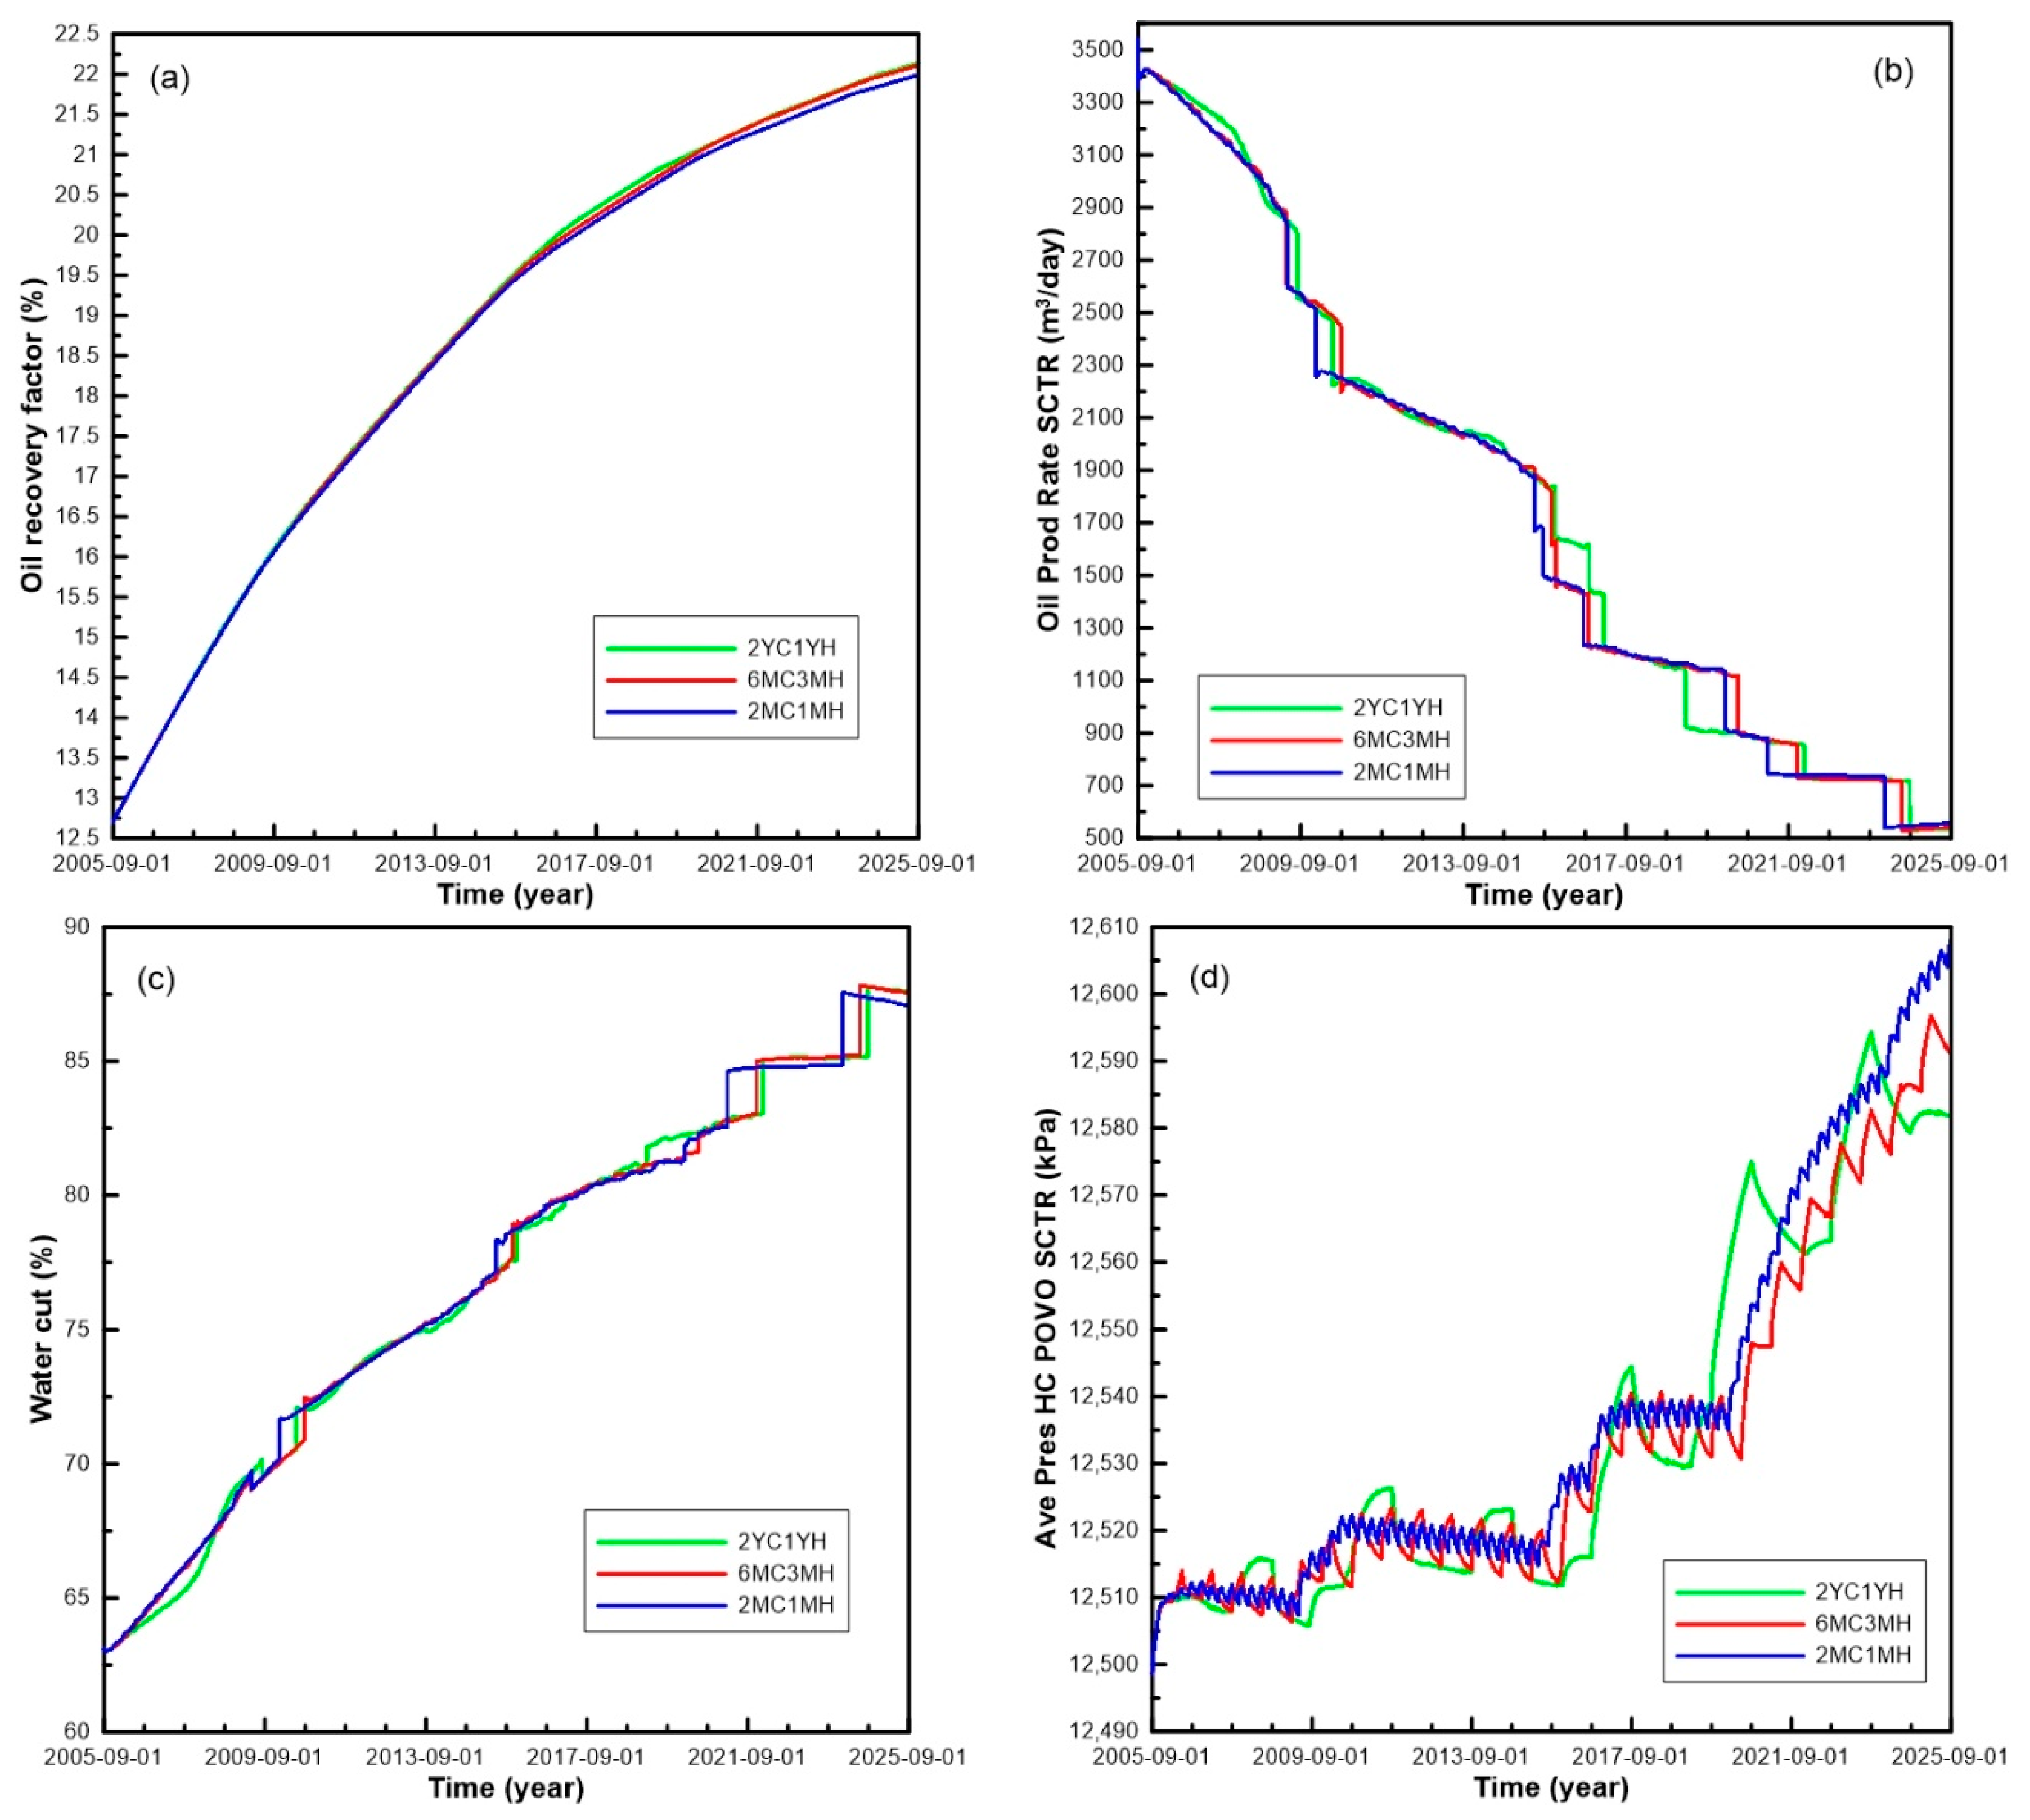
The simulation runs with a WAG ratio of 2:1 also include three schemes with different lengths of water and CO2 slugs as list in Table 5. The simulations show they have a similar output of oil recovery factors, oil production rates and water cuts curves during the WAG injection processes as shown in Figure 9. The ultimate oil recovery factor at the end of 20 years of the WAG process was up to 21.99 ~ 22.03%, water cut to 87.08 ~ 87.58% (Table 6 and Figure 9a,c). The oil production rate decreases relatively fast, and there are several sudden drops, especially in the later 10 years stage (Figure 9b). After three steps of bench rises in the early stage, the formation pressure increases rapidly in the last five years as shown in Figure 9d. The total increase of formation pressure is 110 kPa. As shown in Figure 9, with the increase of the length of CO2-water slug, there is no obvious effect on the increase in water cut and decrease in the oil production rate. The only effect is an increase in the serrated amplitude of the formation pressure. These indicate that the length of CO2-water slug at the WAG ratio of 2:1 has a little effect on oil recovery efficiency.

4.4. Scenarios with WAG Ratio of 1:3

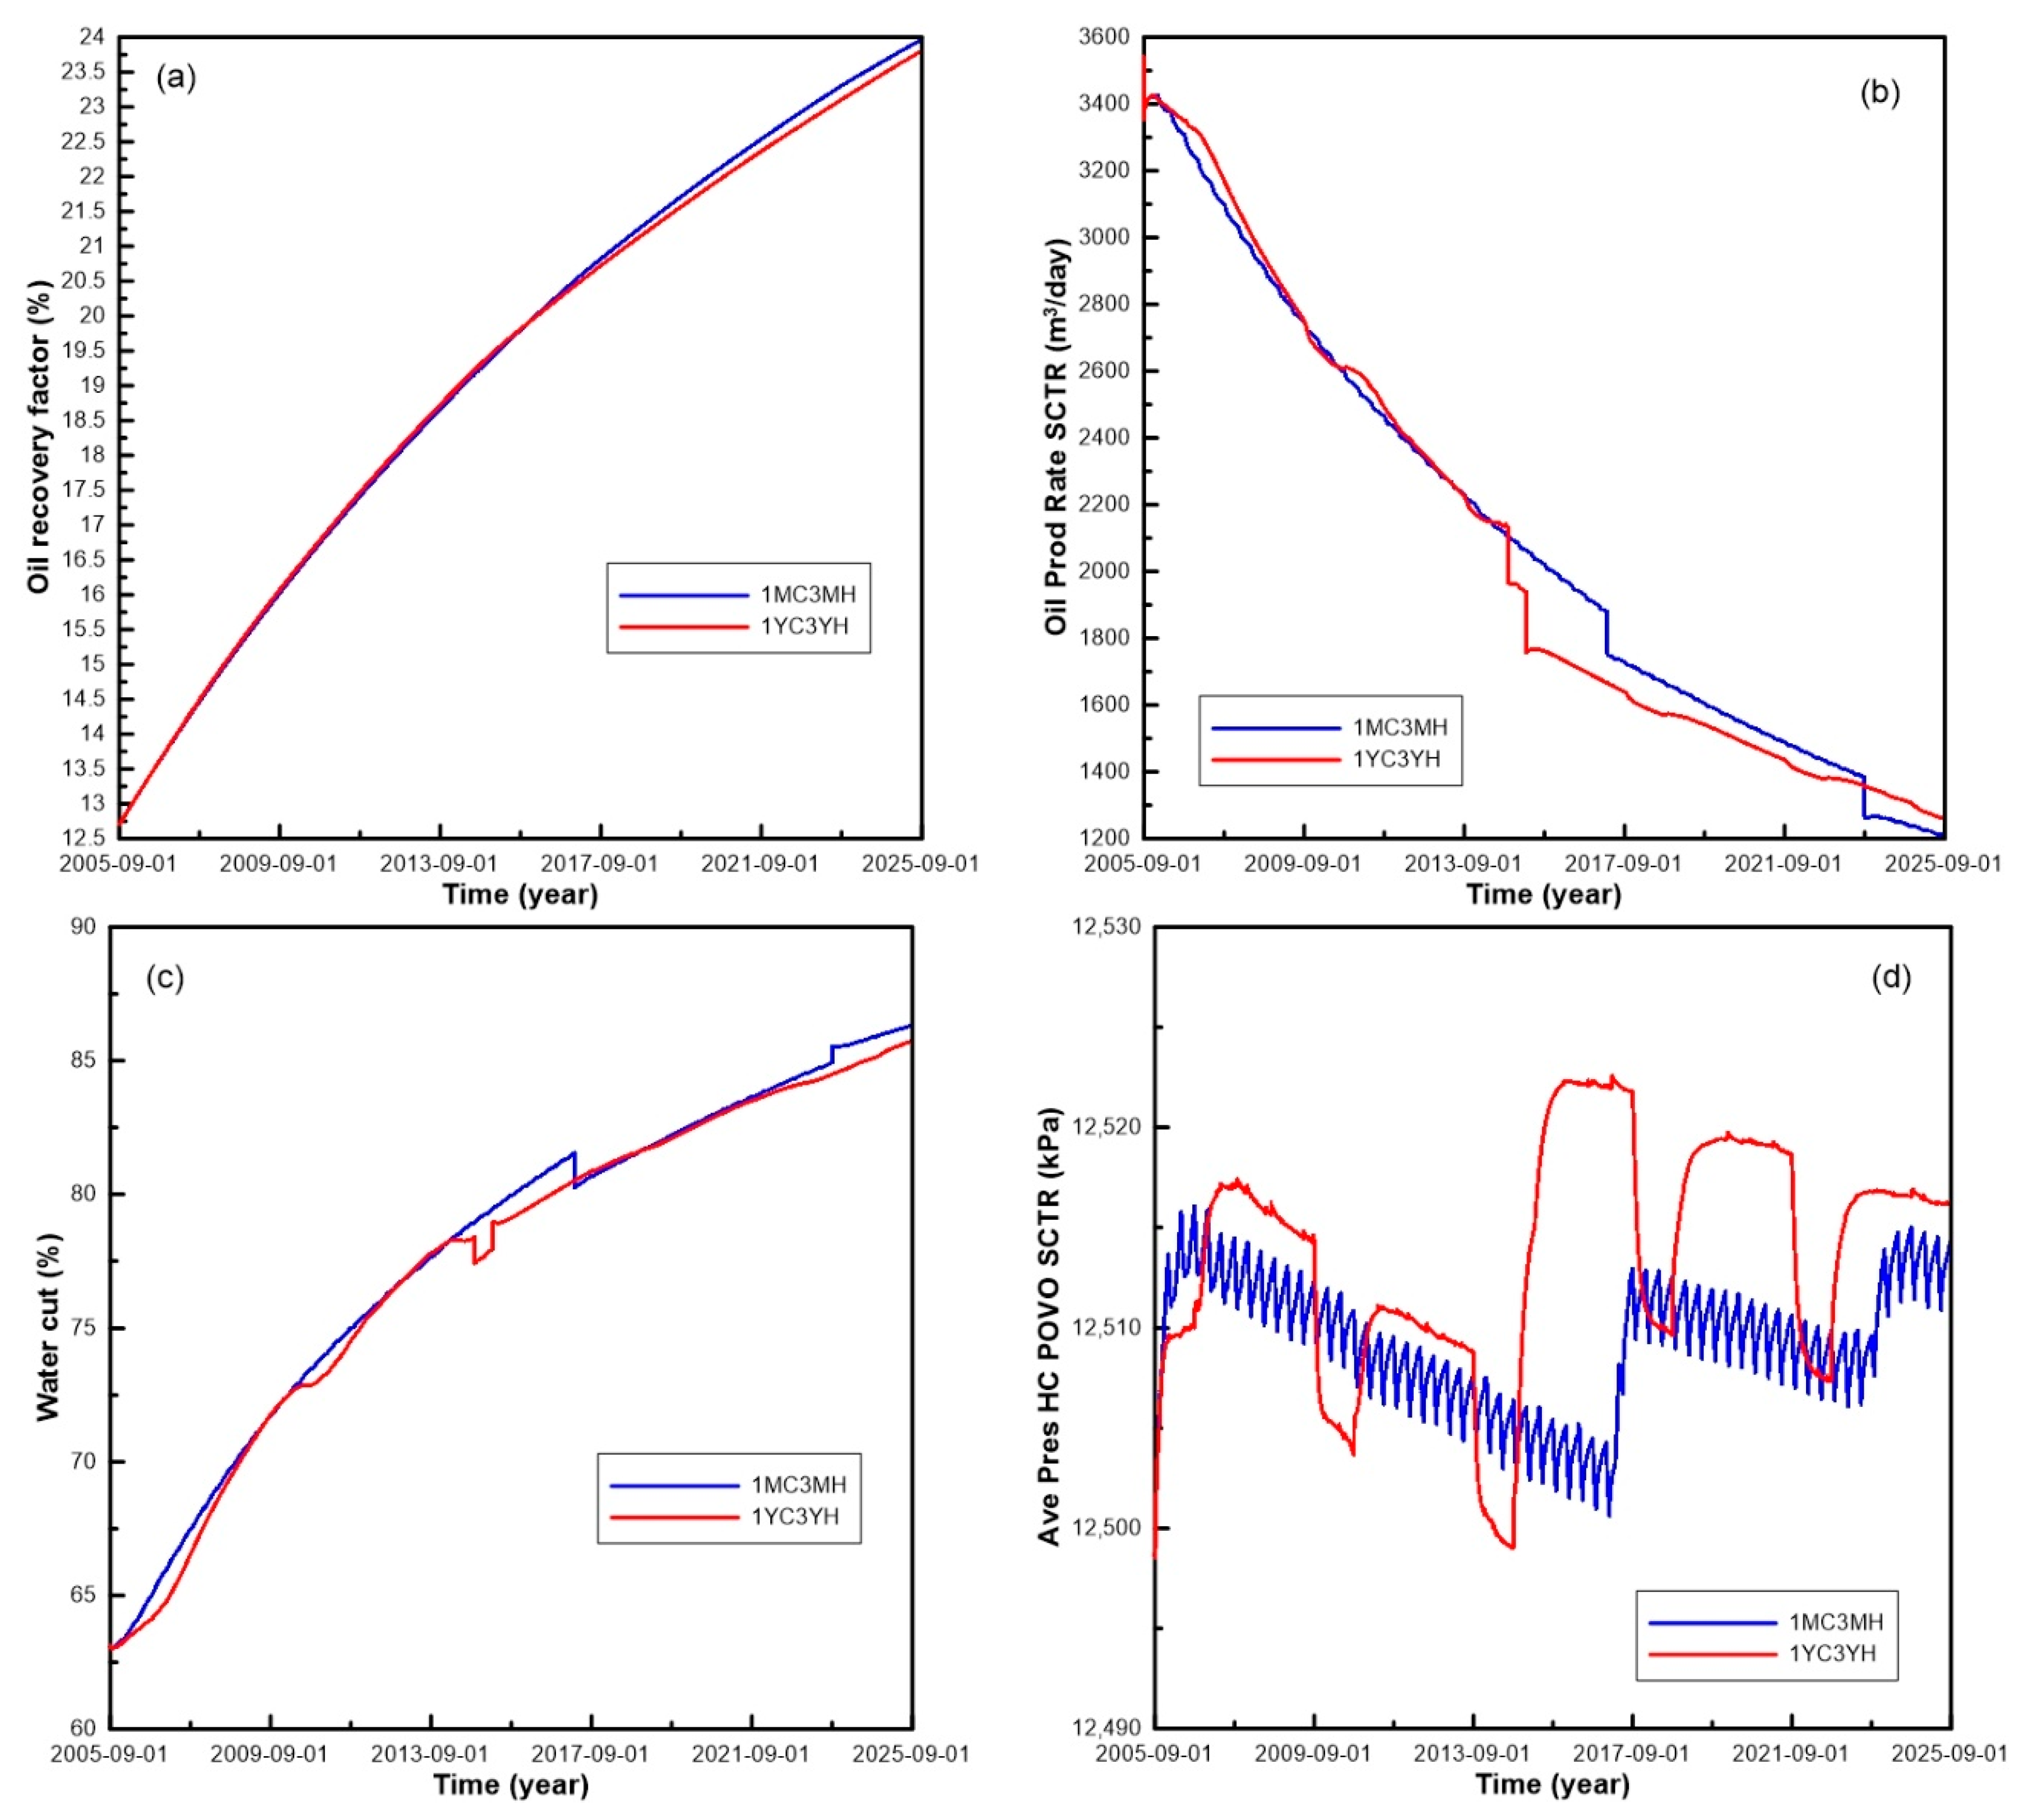
The simulation runs with a WAG ratio of 1:3 include two processes with different lengths of water and CO2 slugs caused by different injection times as listed in Table 5. The simulation outputs indicate that they also have similar trends of oil recovery factor, oil production rate, water cut curves during the WAG injection processes as shown in Figure 10. The ultimate oil recovery factor after 20-year of WAG injection was up to 23.80 ~ 23.97%, water cut to 85.74 ~ 86.33% (Table 6 and Figure 10a,c). The oil production rate decreased slowly with only one sudden drop in middle stage (Figure 10b). The formation pressure shows a raise in an inclined step, the total change range is also small, only 20 kPa (Figure 10d), which indicates a relatively stable characteristic of formation pressure as a whole.
As shown in Figure 10, with the increase in the length of the CO2-water slug both brought forward and increased the oil recovery factor, the water cut and the serrated amplitude of pressure change and decreased the oil production rate. These results indicate that the length of CO2-water slug at the WAG ratio of 1:3 affects the oil replacement efficiency. So, these suggest that a monthly rather than yearly short CO2-water slug is more beneficial to increase oil recovery, reduce water cut, slow down the decline of oil production rate and keep the reservoir pressure stable.

4.5. Scenarios with WAG Ratio of 3:1

The simulation runs with a WAG ratio of 3:1 include two cases with monthly and annual lengths of CO2-water slugs as listed in Table 5, respectively. The simulations indicate they have similar trend curves of oil recovery factor, oil production rate, water cut during the WAG injection process as shown in Figure 11. The ultimate oil recovery factors after 20-year of WAG injection were up to 21.70 ~ 21.75%, water cuts to 86.33 ~ 86.59% (Table 6 and Figure 11a,c). The oil production rate decreases very quickly, and there are several large drops, especially in the later 10-year stage and the time of drops was brought forward (Figure 11b). The water cut increases rapidly and there are also several sudden increases (Figure 11c). The time of the increase of water cut and drop of oil production rate were also brought forward. Like the scenarios with a WAG ratio of 2:1, the formation pressure shows a bench rise with three steps in the early stage and then a rapid increase in the last 10 years as shown in Figure 11d. The increases of reservoir pressure in the first 10 years were very small, only 15kPa; and the growth rates were significantly increased in the next 10 years, up to 85 kPa, the total increase of formation pressure is relatively large, up to 105kPa. As shown in Figure 11, with the increase of the length of the CO2-water slug, there is no obvious differences in decreasing water cut and enhancing the oil recovery. The only difference is the serrated change of the pressure. These indicate that the length of CO2-water slug at the WAG ratio of 3:1 has little effect on oil recovery efficiency.

4.6. Scenarios with WAG Ratio of 1:5

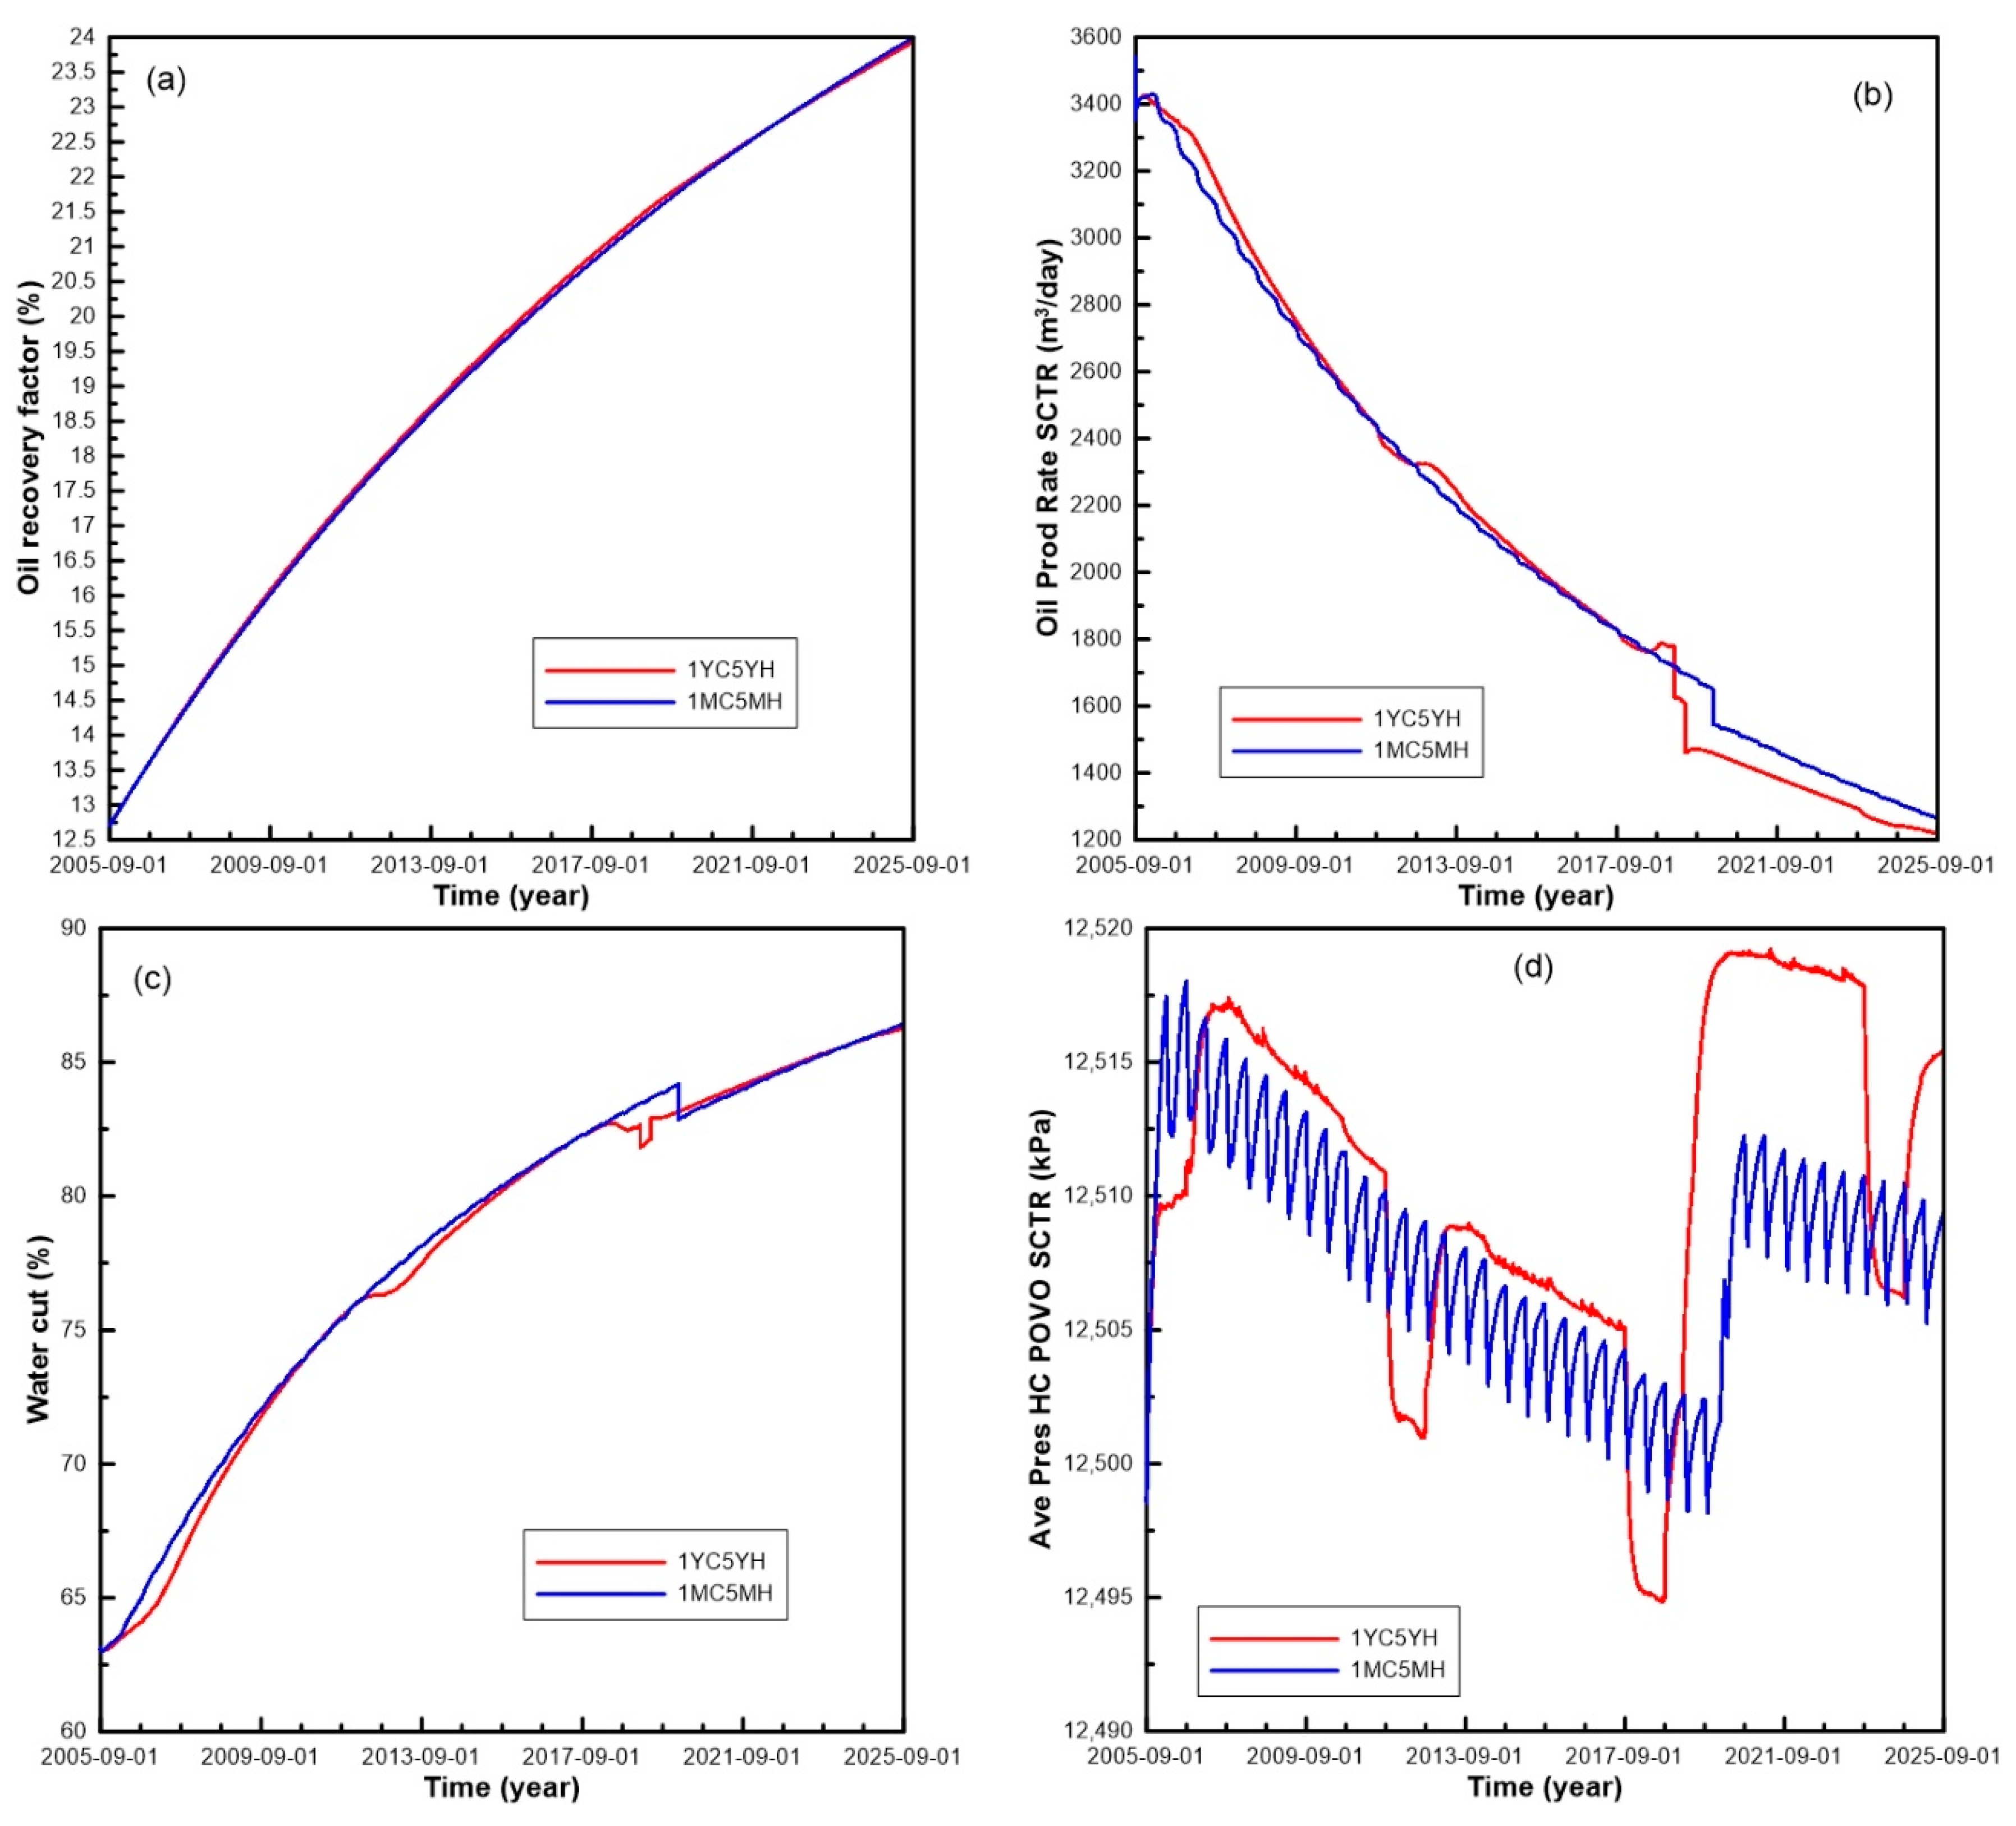
The simulation runs with a WAG ratio of 1:5 include two cases with monthly and yearly lengths of the CO2-water slug as listed in Table 5, respectively. The simulation results show that they have similar output curves of oil recovery factor, oil production rate and water cut during the WAG processes as shown in Figure 12. The ultimate oil recovery factors after 20-year of WAG injection is up to 23.93 ~ 23.99%, water cuts to 86.27 ~ 86.42% (Table 6 and Figure 12a,c). The oil production rates decrease slowly with only one sudden drop and which happens very late (Figure 12b). The water cuts increase slowly, and there is a sudden drop in the later stage (Figure 12c). The average formation pressures are characterized by two-stage distributions with a change of less than 20 kPa, which suggests a relatively stable condition of the formation pressure as a whole. In the early stage (the first 15 years), the formation pressure shows a slow serrated decline, following a more abrupt rise in the late stage as shown in Figure 12d. As shown in Figure 12, with the increase of the length of the CO2-water slug, there is no obvious difference of oil recovery factor, oil production rate, water cut and reservoir pressure, except for only one change in the later stage and the increase of the pressure serrated amplitude. Consequently, it is found that the longer water slug is more beneficial to increase oil recovery, reduce water cut, slow down the decline of oil production rate and keep the reservoir pressure stable during the CO2 IWAG process.

4.7. Scenarios with WAG Ratio of 5:1

The simulation runs with a WAG ratio of 5:1 also include three cases with different lengths of CO2-water slug as listed in Table 5. The simulations show they also have similar output curves of oil recovery factor, oil production rate and water cut after the 20-year WAG injection as shown in Figure 13. The ultimate oil recovery factor at the end of 20 years of WAG is up to 21.36 ~ 21.42%, water cut to 85.89 ~ 85.99% (Table 6 and Figure 13a,c). The oil production rate decreases relatively very fast, and there are also several sudden drops, especially in the later 10-year stage (Figure 13b). The water cut increases rapidly and there are also several sudden increases (Figure 13c). The time of the first sudden increase of water cut and drop of oil production rate is greatly advanced. The bench increase includes only two steps in this section, the pressure starts to rise from the ninth year as shown in Figure 13d which is much earlier than in the others. The increase of reservoir pressure in the first 8 years is small, only 25 kPa; and the growth rate increase in the next 12 years, up to 80 kPa, the total increase of reservoir pressure is relatively large, up to 100 kPa. Comparing the two cases with different lengths of CO2-water slug, there is no obvious differences in decreasing water cut and increasing oil recovery. The only effect is an increase in the reservoir pressure change amplitude with the increase of slug length. These indicate that the length of CO2-water slug at the WAG ratio of 5:1 has also little effect on oil recovery efficiency.

5. Discussion

5.1. Recovery Factor Enhancement

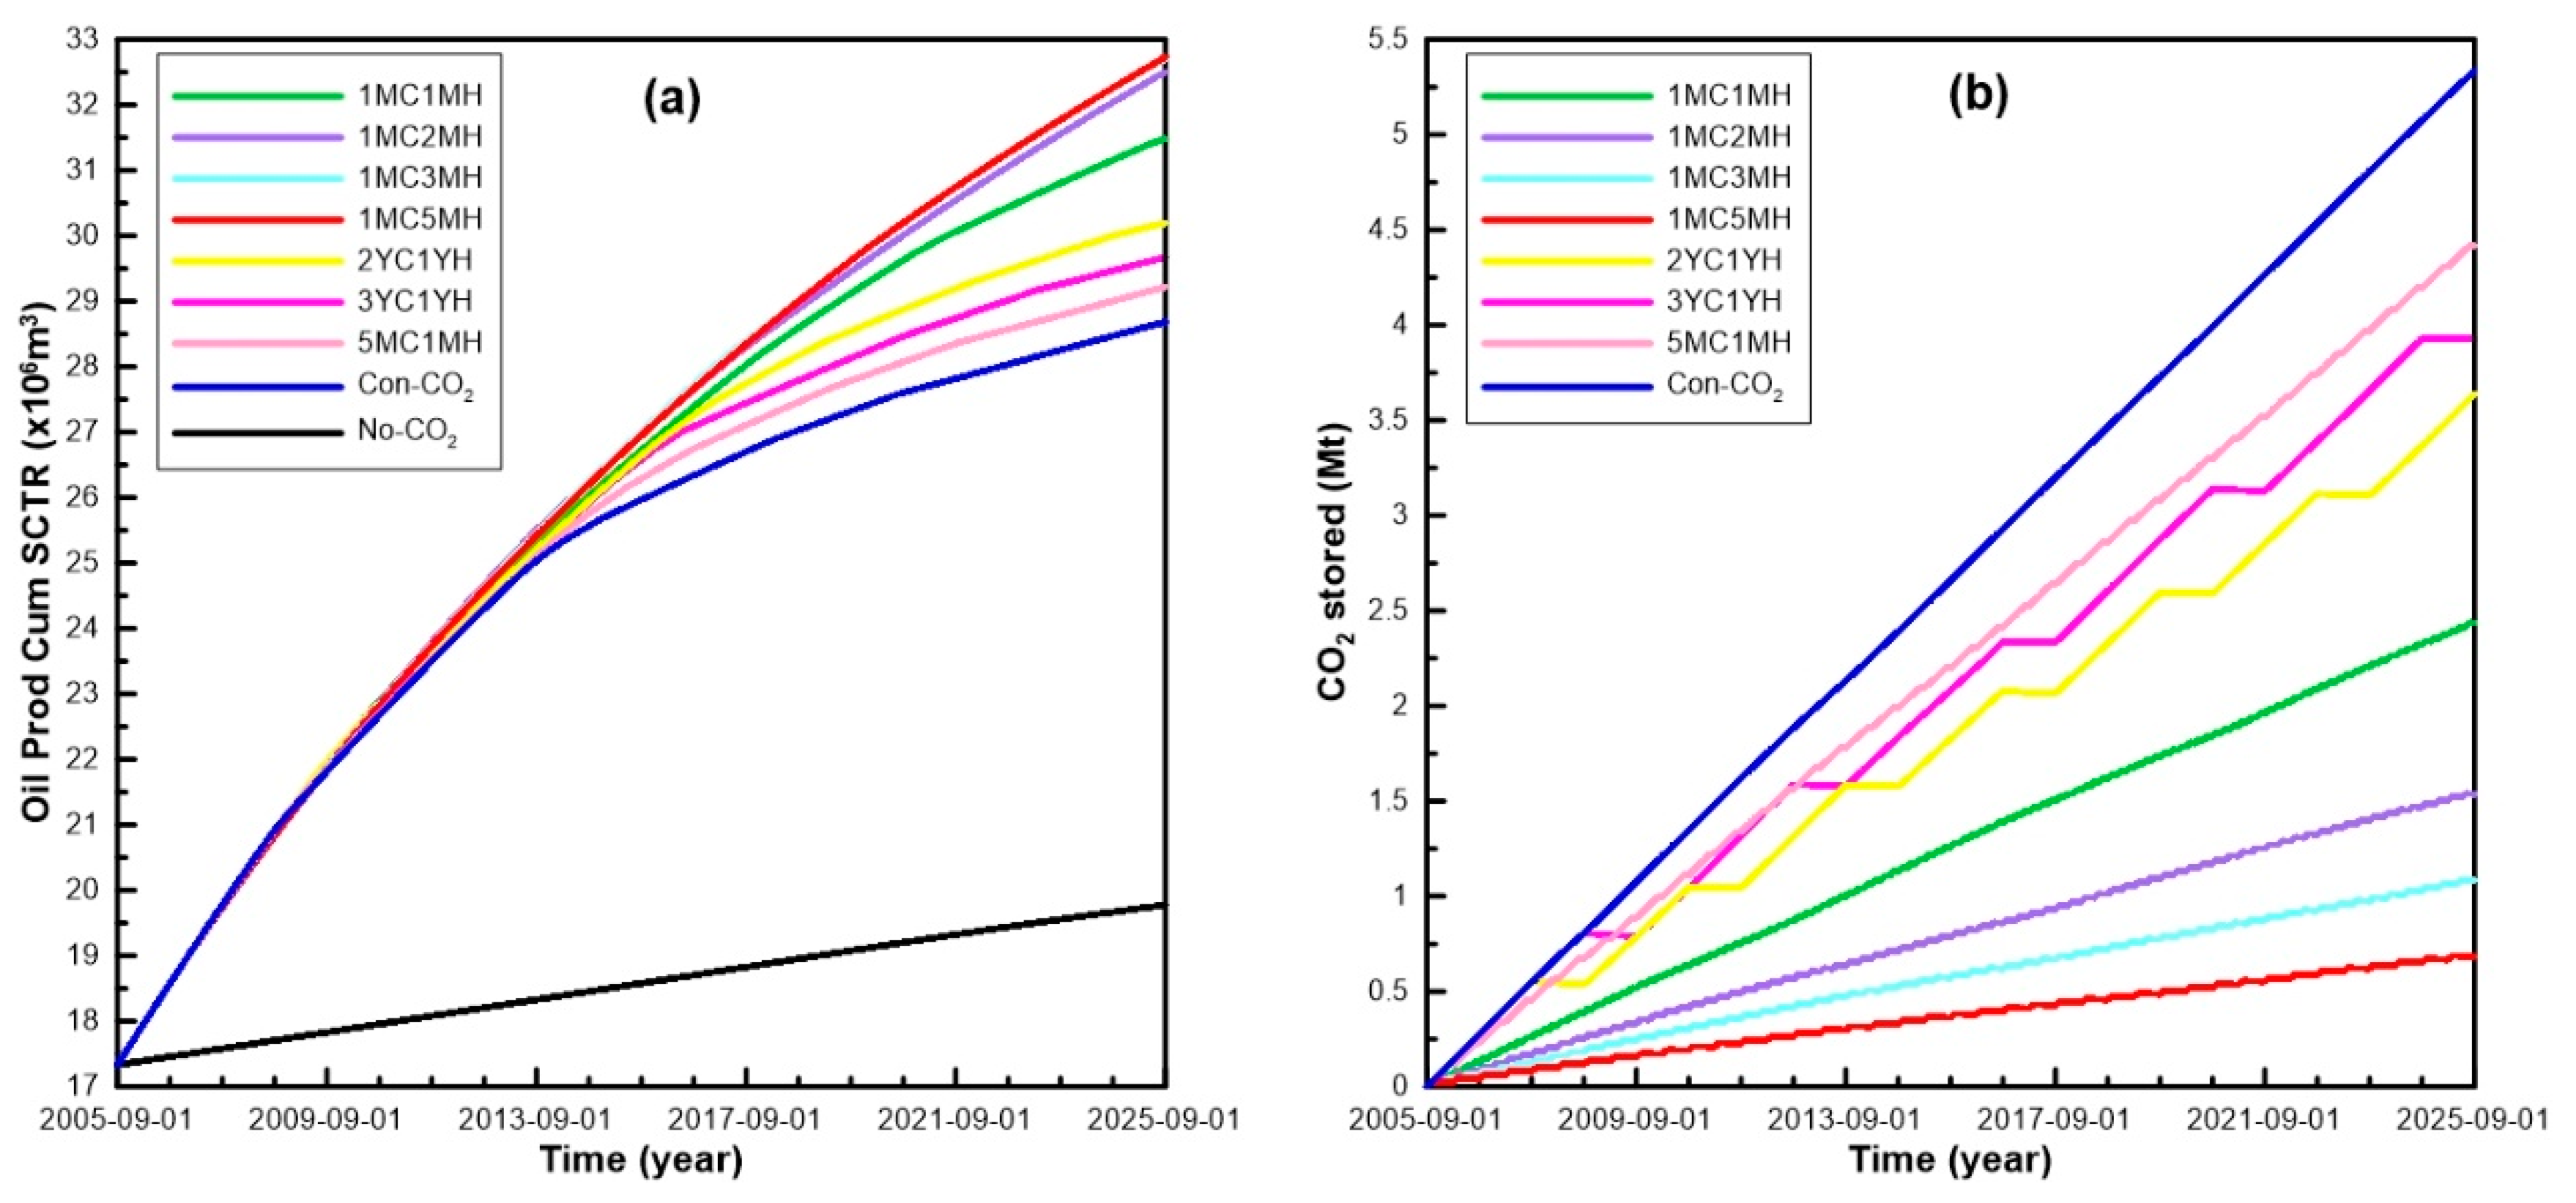
The scenarios with the highest ultimate recovery factor from those with the same WAG ratios were selected to analysis compared with continuous CO2 flooding and primary depletion production. The cumulative oil production increased from 19.77 × 10⁶ m3 of No-CO2 to 28.68 × 10⁶ m3 of Con-CO2, and to 32.73 × 10⁶ m3 of CO2-IWAG. The ultimate oil recovery factor result of No-CO2 is only 14.49%, it is raised to 21.02% by Con-CO2, and to 24% by CO2-IWAG. The ultimate recovery factor has been enhanced by approximately 10% over the level of primary production, and the CO2-IWAG can furtherly improve the recovery factor by 3 ~ 4% on the basis of Con-CO2 (Table 4 and Figure 14a). Among CO2-IWAG scenarios, those with WAG ratios of 1:2, 1:3 and 1:5 have the largest oil productions and highest oil recovery factors. These suggest that immiscible CO2 flooding, especially CO2 IWAG, can significantly improve the recovery over the primary production operation in the LH oilfield.

5.2. CO2 Sequestration

From the perspective of CO2 storage, the amount of CO2 storage increases linearly with the injection time as shown in Figure 14b. The amount of CO2 stored was directly related to the injection amount. The Con-CO2 scenario has the largest amount of CO2 storage. Among the WAG scenarios, those with a WAG ratio of 1:5 has the smallest amount of CO2 storage, while those with WAG ratio of 5:1 have the largest. Most of the injected CO2 (84 ~ 98%) has been sequestrated in the field, while the storage efficiency of Con-CO2 is up to 97.8% and WAG up to 84~97%. These suggest that the LH11-1 oilfield has the best prospects for the application of CO2 geological storage.

5.3. Optimal Analysis

The corrections between ultimate oil recovery factors and CO2 stored volumes in all of the CO2 flooding scenarios in our simulation indicate a negative correlation as shown in Figure 15. The WAG scenarios with CO2 slugs shorter than water slugs (including WAG ratios of 1:2, 1:3, 1:5) are distributed in the upper left corner in Figure 15, which shows a highest oil recovery and a lowest CO2 storage potential.
On the other hand, those with CO2 slug longer than water (including WAG ratios of 2:1, 3:1, 5:1) and Con-CO2 are distributed in the lower right corner in Figure 15, which indicates a lowest oil recovery and a highest storage of CO2. These suggest that the combination of short CO2 slug and long water slug is more conducive to improving oil displacement efficiency, and the smaller the ratio of CO2-water slugs, the better the efficiency of oil recovery, such as the scenarios with a WAG ratio of 1:5. But from the CO2 storage aspect, the longer the CO2 slug, the more favorable it is to increase the injection and storage capacity of CO2. These suggest that there are some incompatibility between the CO2 storage capacity and WAG recovery, especially the different WAG ratios and lengths of slug size, which need to be optimized for different purposes, such as enhanced oil recovery or CO2 sequestration.

6. Conclusions

The LH11-1 carbonate oilfield, characterized by high porosity, high permeability, high viscosity and heavy gravity crude oil, has good geological conditions for CO2 flooding and storage. In this paper, the potential and scheme of CO2-EOR and storage in the reservoirs of the LH oilfield have been evaluated through detailed full-field compositional simulation studies including a series of water alternating CO2 injection scenarios. The main conclusions are:
(1)
The reservoir pressure of the LH11-1 field is much lower than MMP which indicates that the CO2 flooding mechanism is an immiscible process.
(2)
The continuous CO2 injection process is expected to increase recovery up to ~ 7% over the primary depleted method, and the immiscible CO2 WAG process is expected to increase recovery up to ~ 4% over the continuous CO2 flooding over a 20-year production period, which indicate that the CO2 WAG should be the best process for oil recovery enhancement in the LH11-1oilfield.
(3)
The CO2 storage efficiency is very high, about 84 ~ 97% of injected CO2 is sequestered in the reservoir through the WAG processes, which determines that the LH field is a good candidate for CO2 storage.
(4)
Simulation results indicate that the slug size of water during the CO2 IWAG processes shows a positive effect on oil recovery. The WAG ratios of 1:5, 1:3 and 1:2 are the optimum values for yielding the highest oil recoveries.
(5)
Although the reservoirs of the LH oilfield are complicated, they are also suitable for CO2 EOR and CO2 geological storage, and the field can be suggested as a good candidate site for a GDCCUS project.
As this modelling was based on published data, we are fully aware that the optimization operation is rather general and hypothetic. In the future, the model needs to be revised based on more detailed data of the reservoir characteristics, fluid properties and production history, and the injection rate, slug size and well pattern should be furtherly optimized, so that the research can further guide and support the fulfilment of the GDCCUS development.

Author Contributions

Conceptualization, G.H.; methodology, Z.Z.; formal analysis, P.L.; investigation, X.T.; resources, P.L.; writing—original draft preparation, P.L.; writing—review and editing, P.L. and G.H.; supervision, L.Y.; funding acquisition, X.L. All authors have read and agreed to the published version of the manuscript.

Funding

This work was funded by the open fund of Guangdong Research Center for Unconventional Energy Engineering Technology (Guangdong University of Petrochemical Technology) (No. GF2018A004, GF2018A009, GF2018B004) and Guangdong Petrochemical Equipment Engineering and Technology Research Center (No.2017JJ517010), the open research fund of State Key Laboratory of Geomechanics and Geotechnical Engineering, Institute of Rock and Soil Mechanics, Chinese Academy of Sciences (No. Z0190915), Key Special Project for Introduced Talents Team of Southern Marine Science and Engineering Guangdong Laboratory (Guangzhou) (GML2019ZD0104, GML2019ZD0205), the Natural Science Foundation of Guangdong Province, China (No. 2018A030313433) and the National Natural Science Foundation of China (No. 41773039, U1901217).

Acknowledgments

We are grateful for help in modelling and simulation from The Gulf Coast Carbon Center, University of Texas at Austin and the Shell (China) Projects & Technology Limited.

Conflicts of Interest

The authors declare no conflict of interest.

References

  1. IEA. Global Energy & CO2 Status Report 2019; IEA: Paris, France, 2019; Available online: https://www.iea.org/reports/global-energy-co2-status-report-2019 (accessed on 14 April 2020).
  2. Guo, J.-X.; Huang, C.; Wang, J.-L.; Meng, X.-Y. Integrated operation for the planning of CO2 capture path in CCS–EOR project. J. Pet. Sci. Eng. 2020, 186, 106720. [Google Scholar] [CrossRef]
  3. IPCC. Special Report on Carbon Dioxide Capture and Storage; Metz, B., Davidson, O., Coninck, H.C., Loos, M., Meyer, L.A., Eds.; Cambridge University Press: Cambridge, UK; New York, NY, USA, 2005. [Google Scholar]
  4. Holtz, M.H. Immiscible Water Alternating Gas (IWAG) EOR: Current State of the Art. In SPE Improved Oil Recovery Conference; Society of Petroleum Engineers: Tulsa, OK, USA, 2016; pp. 1–19. [Google Scholar]
  5. Nadeson, G.; Anua, N.A.B.; Singhal, A.; Ibrahim, R.B. Water-Alternating-Gas (WAG) Pilot Implementation, A First EOR Development Project in Dulang Field, Offshore Peninsular Malaysia. In SPE Asia Pacific Oil and Gas Conference and Exhibition; Society of Petroleum Engineers: Perth, Australia, 2004; p. 9. [Google Scholar]
  6. Mousavi Mirkalaei, S.M.; Hoseini, J.; Masoudi, R.; Ataei, A.; Demiral, B.; Karkooti, H. Investigation of Different I-WAG schemes toward Optimization of Displacement Efficiency. In SPE Enhanced Oil Recovery Conference; Society of Petroleum Engineers: Kuala Lumpur, Malaysia, 2011; p. 12. [Google Scholar]
  7. Ramachandran, K.P.; Gyani, O.N.; Sur, S. Immiscible Hydrocarbon WAG: Laboratory to Field. In SPE Oil and Gas India Conference and Exhibition; Society of Petroleum Engineers: Mumbai, India, 2010; p. 11. [Google Scholar]
  8. Teigland, R.; Kleppe, J. EOR Survey in the North Sea. In SPE/DOE Symposium on Improved Oil Recovery; Society of Petroleum Engineers: Tulsa, Oklahoma, USA, 2006; p. 16. [Google Scholar]
  9. Crogh, N.A.; Eide, K.; Morterud, S.E. WAG Injection at the Statfjord Field, A Success Story. In European Petroleum Conference; Society of Petroleum Engineers: Aberdeen, UK, 2002; p. 9. [Google Scholar]
  10. Li, P.; Zhou, D.; Zhang, C.; Zhang, Y.; Peng, J. Potential of Sub-seafloor CO2 Geological Storage in Northern South China Sea and its Importance for CCS Development in South China. Energy Procedia 2013, 37, 5191–5200. [Google Scholar] [CrossRef] [Green Version]
  11. Li, X.; Zhou, D.; Li, P.; Wu, Y.; Liang, X.; Wei, N.; Haszeldine, S.; Senior, B.; Shu, Y.; Li, J.; et al. CO2 Offshore Storage in China: Research Review and Plan for Demonstration Project; Report No. D01/2015; UK-China (Guangdong) CCUS Centre: Guangzhou, China, 2015; p. 46. [Google Scholar]
  12. Zhou, D.; Li, P.; Liang, X.; Liu, M.; Wang, L. A long-term strategic plan of offshore CO2 transport and storage in northern South China Sea for a low-carbon development in Guangdong province, China. Int. J. Greenh. Gas Control 2018, 70, 76–87. [Google Scholar] [CrossRef] [Green Version]
  13. Zhou, D.; Zhao, D.; Liu, Q.; Li, X.-C.; Li, J.; Gibbons, J.; Liang, X. The GDCCSR Project Promoting Regional CCS-Readiness in the Guangdong Province, South China. Energy Procedia 2013, 37, 7622–7632. [Google Scholar] [CrossRef] [Green Version]
  14. Heubeck, C.; Story, K.; Peng, P.; Sullivan, C.; Duff, S. An integrated reservoir study of the Liuhua 11-1 field using a high-resolution three-dimensional seismic data set. Seism. Imaging Carbonate Reserv. Syst. AAPG Mem. 2004, 81, 149–168. [Google Scholar]
  15. Story, C.; Peng, P.; Heubeck, C.; Sullivan, C.; Lin, J.D. Liuhua 11-1 Field, South China Sea: A shallow carbonate reservoir developed using ultrahigh-resolution 3-D seismic, inversion, and attribute-based reservoir modeling. Lead. Edge 2000, 19, 834–844. [Google Scholar] [CrossRef]
  16. Zhu, W.; Mi, L. Atlas of Oil and Gas Basins, China Sea; Petroleum Industry Press: Beijing, China, 2010; p. 316. [Google Scholar]
  17. Liu, B. Development of Oil and Gas fields of China. Volume of oil and gas fields in eastern South China Sea; Edited by editorial committee of Development of Oil and Gas fields of China; Petroleum Industry Press: Beijing, China, 2011. [Google Scholar]
  18. Sattler, U.; Immenhauser, A.; Schlager, W.; Zampetti, V. Drowning history of a Miocene carbonate platform (Zhujiang Formation, South China Sea). Sediment. Geol. 2009, 219, 318–331. [Google Scholar] [CrossRef]
  19. Sattler, U.; Zampetti, V.; Schlager, W.; Immenhauser, A. Late leaching under deep burial conditions: A case study from the Miocene Zhujiang Carbonate Reservoir, South China Sea. Mar. Pet. Geol. 2004, 21, 977–992. [Google Scholar] [CrossRef]
  20. Tumer, N.L.; Hu, P.Z. The Lower Miocene Liuhua Carbonate Reservoir, Pearl River Mouth Basin, offshore People’s Republic of China. In Proceedings of the 23rd Annual Offshore Technology Conference, Houston, TX, USA, 6–9 May 1991; pp. 113–123. [Google Scholar]
  21. Dunham, R.J. Classification of Carbonate rocks according to depositional textures. In Classification of Carbonate Rocks; Ham, W.E., Ed.; American Association of Petroleum Geologists Memoirs: Tulsa, OK, USA, 1962; Volume 1, pp. 108–121. [Google Scholar]
  22. Liu, M.; Feng, Q.; Xiao, W.; Wu, Q.; Dan, Z. Fast Coning of Bottom Water in Bioherm Oilfield of LH11–1. J. Southwest Pet. Univ. 2015, 37, 49–56. [Google Scholar]
  23. Story, C.; Peng, P.; Sullivan, C.; Dong, L.J. An Integrated Geoscience and Reservoir Simulation Study of the Liuhua 11-1 Field: South China Sea. In Proceedings of the Offshore Technology Conference 2000, Houston, TX, USA, 1–4 May 2000; pp. 1–11. [Google Scholar]
  24. Peng, C.; Bateman, C.; Kaffenes, J.; Yanosik, J.; Liu, H.-M. Extended Production Tests in the Liuhua 11-1 Reservoir. SPE Reserv. Eng. 1994, 9, 169–174. [Google Scholar] [CrossRef]
  25. Zhai, G.; Wang, S. Oil and Gas Bearing Areas on the Continental Shelf and Ints Neighbouring Regions. In Petroleum Geology of China; Petroleum Industry Press: Beijing, China, 1990; Volume 16. [Google Scholar]
  26. Zhou, S. Development Practices of Typical Oilfield Offshore China; Petroleum Industry Press: Beijing, China, 2009. [Google Scholar]
  27. Wang, S.; Zhao, l.; Lu, G.; Liu, X.; Chen, R.; Zhang, Q.; Zhang, Z.; Jiao, D. Petroleum geology of oil & gas bearing area on continental shelf and its neighbouring regions. In Petroleum Geology of China; Zhai, G., Ed.; Petroleum Industry Press: Beijing, China, 1990; Volume 16, pp. 343–450. [Google Scholar]
  28. Li, P.; Lu, J.; Zhou, D.; Liang, X. A Preliminary Simulation of CO2-EOR and Storage in One Heavy Oil Carbonate Oilfield Offshore Guangdong, China. In Proceedings of the 8th International Congress on Environmental Geotechnics, ICEG2018, Hangzhou, China, 28 October–1 November 2019; Zhan, L., Chen, Y., Bouazza, A., Eds.; Environmental Science and Engineering. Springer: Singapore, 2019; Volume 3, pp. 3–16. [Google Scholar]
  29. Hulea, I.N.; Nicholls, C.A. Carbonate rock characterization and modeling: Capillary pressure and permeability in multimodal rocks—A look beyond sample specific heterogeneity. AAPG Bull. 2012, 96, 1627–1642. [Google Scholar] [CrossRef] [Green Version]
  30. Hulea, I.N. Capillary Pressure and Permeability Prediction in Carbonate Rocks—New Methods for Fractures Detection and Accurate Matrix Properties Prediction. In SPE Middle East Oil and Gas Show and Conference; Society of Petroleum Engineers: Manama, Bahrain, 2013; Volume SPE164251, pp. 1–7. [Google Scholar]
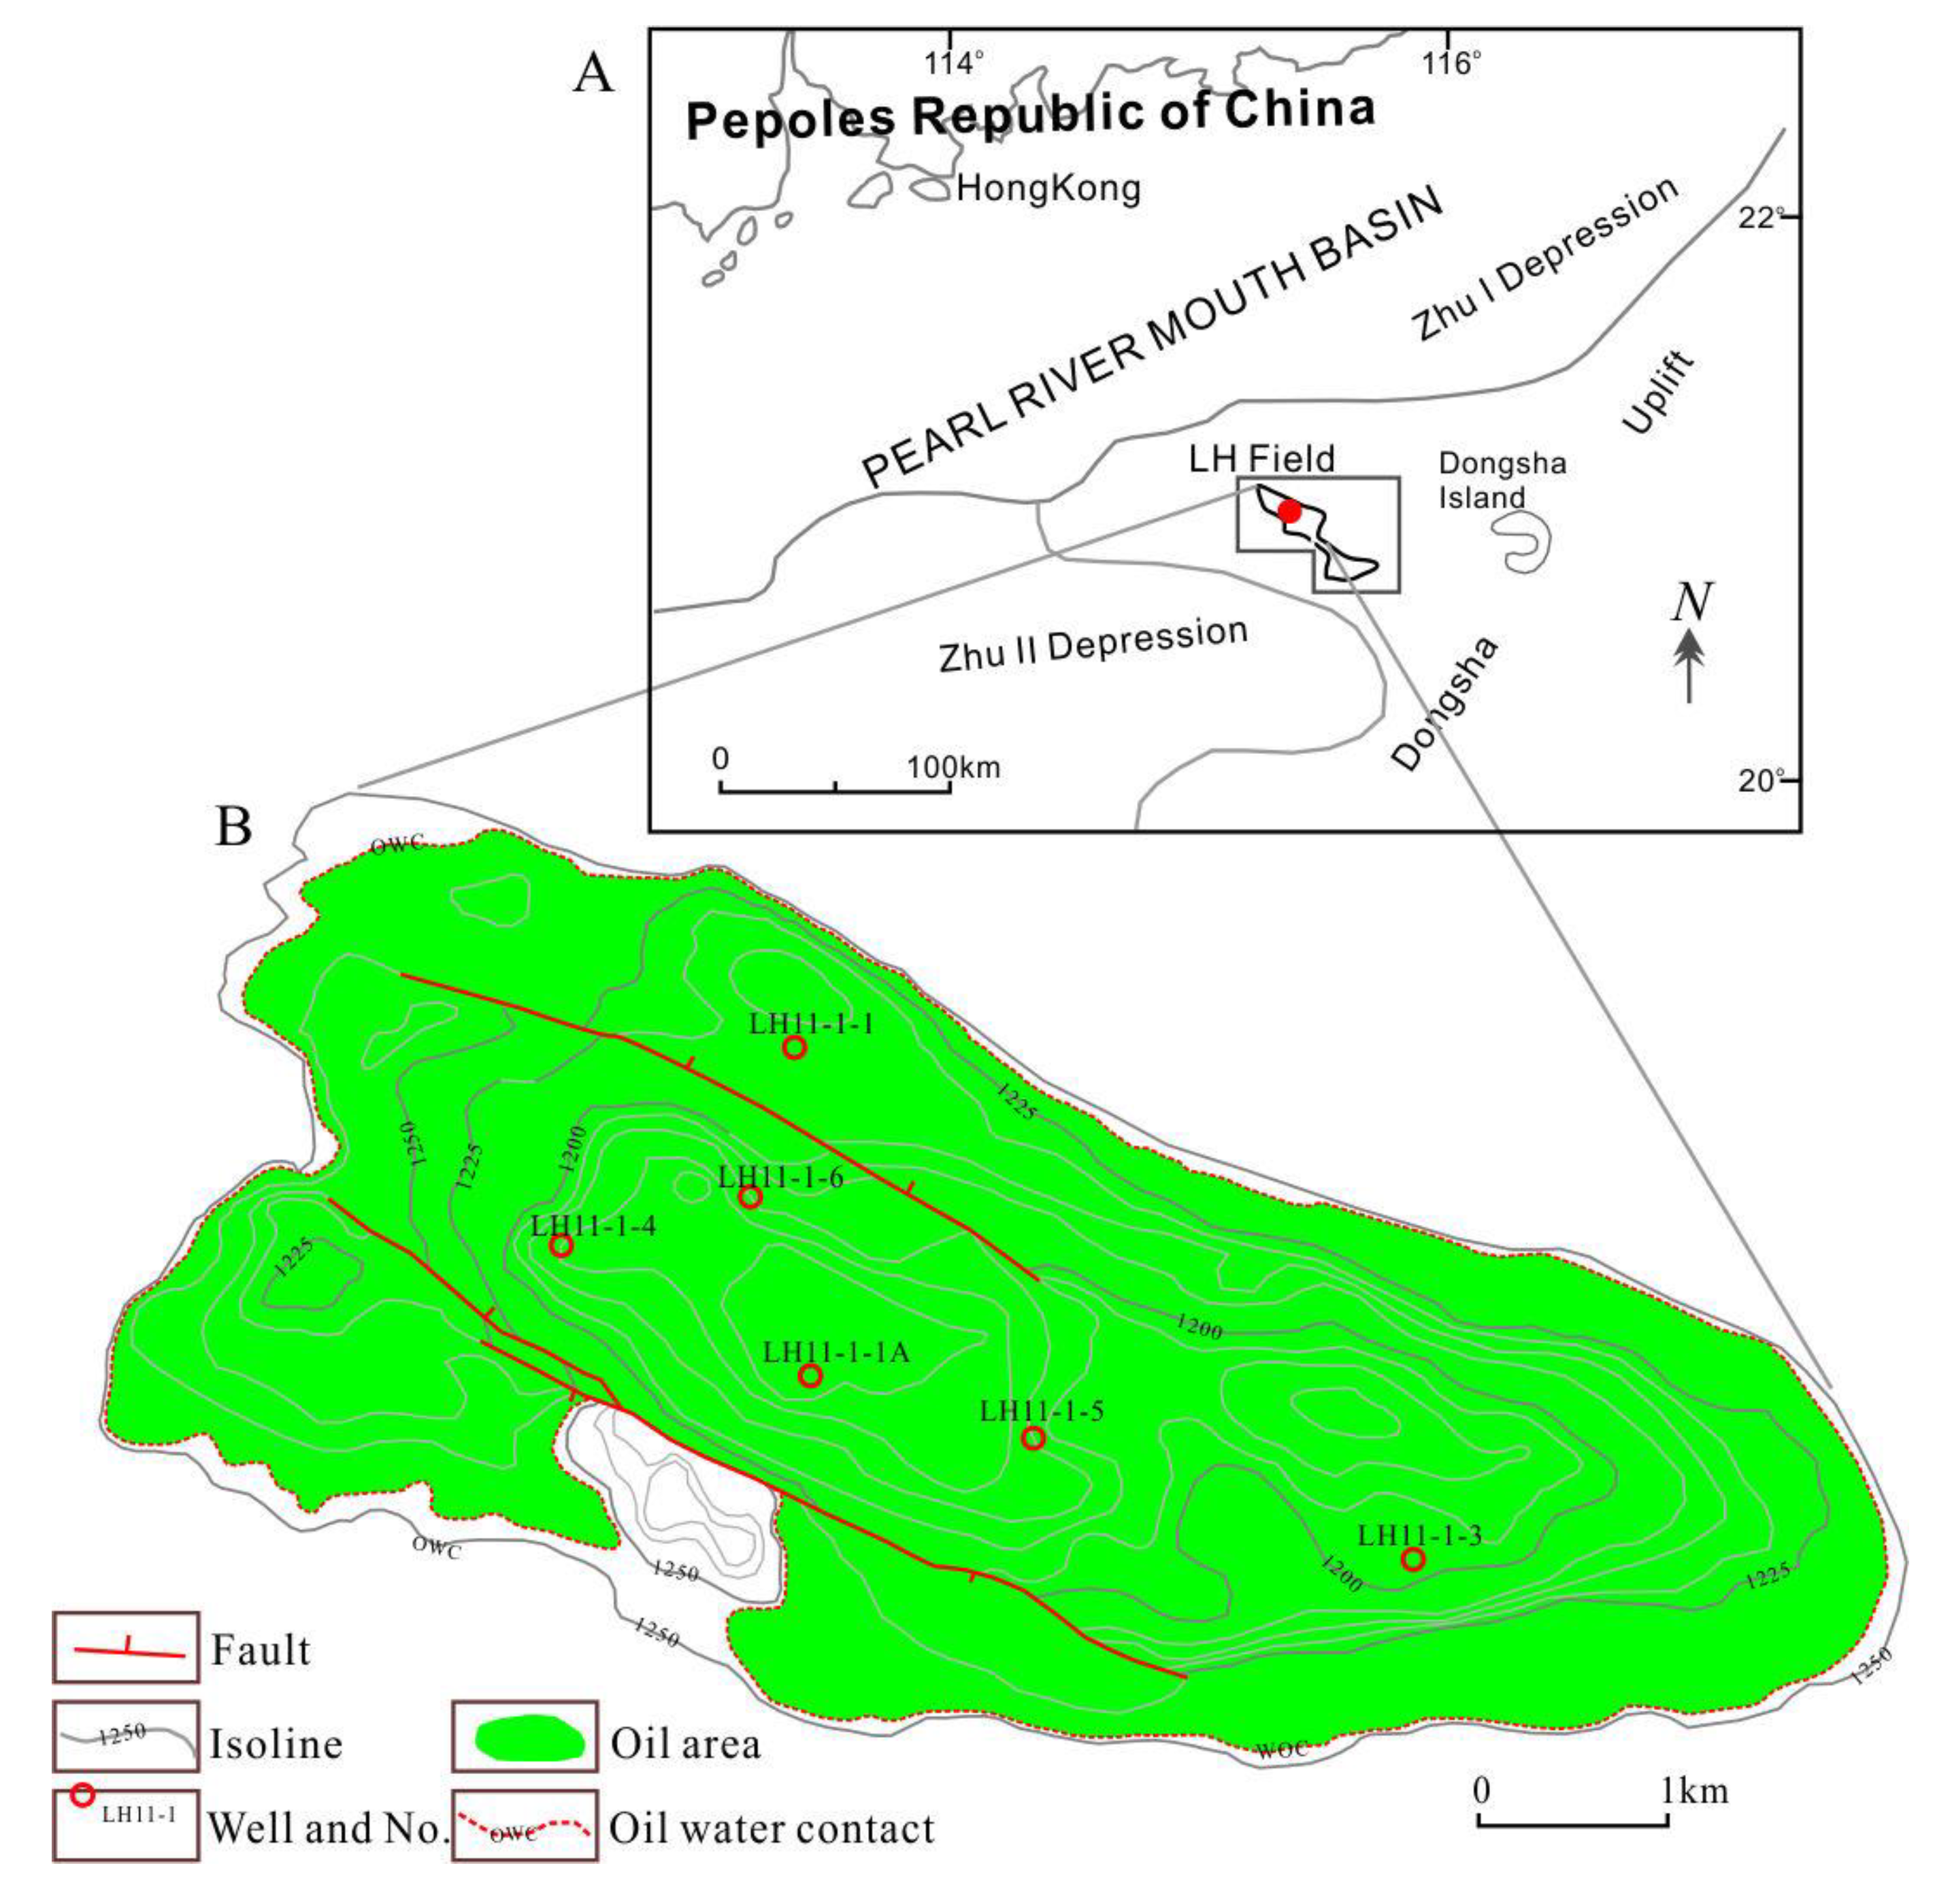
Figure 1. Maps showing geographic setting and reef structure of the top Zhujiang group of LH11-1 oilfield (A and B, respectively) in PRMB, offshore Guangdong province, southern China. Depths are in meters, and the oil area, oil water contact (OWC) and locations of oil well are also shown in B. A was modified after Sattler, et al. [18], Sattler, et al. [19], Tumer and Hu [20] and B after Zhu and Mi [16].
Energies 13 02130 g001
Figure 2. Simplified NW to SE geological cross section across the LH11-1 reef limestone oilfield (Modified according to Liu et al., 2015 [22]).
Energies 13 02130 g002
Figure 3. Oil recovery factor at 1.2 hydrocarbon pore volume (HCPV) versus injection test pressure of CO2 flooding for slim tube numerical simulations showing MMP estimated at approximately 20 MPa.
Energies 13 02130 g003
Figure 4. The 3D property models of porosity (a) and permeability (b) built for the LH oilfield (Modified after Li et al., 2019 [28]).
Energies 13 02130 g004
Figure 5. The upscaled grid model of the top reservoir depth structure, which include 3420 grids with NX = 76 grids and NY = 45 grids. The locations of 11 oil production wells and 2 CO2 injector wells for simulation are also shown. Expect initial 6 oil production wells (including LH11-1–1, LH11-1–1A, LH11-1–3, LH11-1–4, LH11-1–5 and LH11-1–6), 2 injection wells (Injector1 and Injector2) and other 5 oil wells (including P-D1, P-11, P-15, P-16 and P-17) are designed for simulation needed.
Energies 13 02130 g005
Figure 6. The relative permeability (Kr) curves (a) for water and oil phases based on drilling core tests [23] and capillary pressure (Pc) curve (b) referencing a common carbonate rock data [29,30]. Krw is the relative permeability of water, Kro is the oil permeability relative to water, Pc is the mercury-air capillary pressure.
Energies 13 02130 g006
Figure 7. Simulated result curves of oil recovery factor (a), oil production rate (b), water cut (c) and average reservoir pressure (d) of during the CO2 flooding with a same WAG ratio of 1:1 but different length of slug sizes.
Energies 13 02130 g007
Figure 8. Simulated result curves of oil recovery factor (a), oil production rate (b), water cut (c) and average reservoir pressure (d) of during the CO2 flooding with a WAG ratio of 1:2.
Energies 13 02130 g008
Figure 9. Simulated curves of oil recovery factor (a), oil production rate (b), water cut (c) and average reservoir pressure (d) of during the CO2 flooding with a WAG ratio of 2:1.
Energies 13 02130 g009
Figure 10. Simulated result curves of oil recovery factor (a), oil production rate (b), water cut (c) and average reservoir pressure (d) of during the CO2 flooding with a WAG ratio of 1:3.
Energies 13 02130 g010
Figure 11. Simulated result curves of oil recovery factor (a), oil production rate (b), water cut (c) and average reservoir pressure (d) of during the CO2 flooding with a WAG ratio of 3:1.
Energies 13 02130 g011
Figure 12. Simulated result curves of oil recovery factor (a), oil production rate (b), water cut (c) and average reservoir pressure (d) of during the CO2 flooding with a WAG ratio of 1:5.
Energies 13 02130 g012
Figure 13. Simulated curves of oil recovery factor (a), oil production rate (b), water cut (c) and average reservoir pressure (d) of during the CO2 flooding with a WAG ratio of 5:1.
Energies 13 02130 g013
Figure 14. Simulated trend curves of cumulative oil production (a) and CO2 stored (b) over time for the scenarios in simulation.
Energies 13 02130 g014
Figure 15. Correlation curves of results of the ultimate oil recovery factor and CO2 stored in the CO2 flooding scenarios with different CO2-water slug ratios.
Energies 13 02130 g015
Table 1. Reservoir characteristics of the LH oilfield [17,22].
EpochFormationReservoirLithologyReservoir Thickness /mAv. Porosity /%Av. Permeability /mDInitial Oil Saturation /%Reserves
Oil /× 104tSolution Gas / × 108m3
Early MioceneUpper Zhujiang formationARhodoid Rudstone 3.1 ~ 4.015.76.4 ~ 27.643.61272.420.93
B1Rhodoid rudstone17.5 ~ 26.925.3517.459.12494.331.83
B217.7552.647.51162.620.86
B323.71346.956.41385.751.02
CPackstone; grainstone2.9 ~ 7.620.4391.747.81349.270.99
DPackstone; grainstone11.5 ~ 18.523.9560.164.95406.153.98
EMicrite; packstone16 ~ 18.4< 10%
FCoarse bioclastic packstone and grainstone91.624.1 ~ 31.2533 ~ 794
Table 2. Parameters of fluid property in Liuhua11-1 oilfield (Reprint with permission (4815710131901); Copyright © 2020, Springer Nature Singapore Pte Ltd.).
PropertyFormation ValueMean Value
Initially formation pressure (MPa)12.66
Reservoir temperature (°C)52.22
Saturation pressure (MPa)0.63~5.782.19
Specific gravityOil: 0.920.92
Gas: 0.597 ~ 1.551.0735
Oil Density (g/cm3)0.899 ~ 0.9030.901
Oil Viscosity (mPa·s)46.5 ~ 162.1104.3
Oil Compressibility coefficient6.28 ~ 7.87
Gas-Oil ratio (m3/m3)1.6 ~ 13.47.5
Table 3. Simulated oil components used in the LH oilfield model (Reprint with permission (4815710131901); Copyright © 2020, Springer Nature Singapore Pte Ltd.).
ComponentsC1 ~ 3C11 ~ 15C16 ~ 17C18C19 ~ 20C21 ~ 25C26 ~ 35C31+
Normalized Composition0.0470.1320.1410.0880.0990.2580.1210.114
Table 4. Main parameters used in 1-D slim tube flooding model (Reprint with permission (4815710131901); Copyright © 2020, Springer Nature Singapore Pte Ltd.).
ParametersValue
The size of the slim tube (m)40 × 0.02
The node number200
The size of grid elements along x (m)
The size of grid elements along y and z (m)
0.2
0.02
Initial oil saturation0.8
Initial water saturation0.2
Initial gas saturation0.0
Porosity0.25
Permeability at x direction (mD)651
Initial temperature (o C)52.2
Initial pressure (MPa)12.660
CO2 injection rate of injection well (cc/hr)3
Wellbore flow pressure (MPa)12.65
Rock compressibility (1/kPa)2e-5
Reference pressure (kPa)2000
Table 5. Description of different scenarios designed in simulation.
No.Simulation RunCO2 Inj. TimeWater Inj. TimeScenario Codes
1Primary DepletionWithout CO2 injection Without water injectionNo-CO2
2Continuous CO2 injectionContinuous CO2 injectionWithout water injectionCon-CO2
3WAG 1:11 month 1 month1MC1MH
43 months 3 months3MC3MH
56 months 6 months6MC6MH
61 year 1 year1YC1YH
7WAG 1:21 months 2 months1MC2MH
83 months 6 months3MC6MH
91 year 2 years1YC2YH
10WAG 2:12 months 1 months2MC1MH
116 months 3 months6MC3MH
122 years 1 years2YC1YH
13WAG 1:31 month 3 months1MC3MH
141 year 3 years1YC3YH
15WAG 3:13 months 1 month3MC1MH
163 years1 year3YC1YH
17WAG1:51 month5 months1MC5MH
181 year5 years1YC5YH
19WAG5:15 months 1 month5MC1MH
205 years1 year5YC1YH
Table 6. Simulation results of different simulation scenario groups.
MethodCumulative Oil Production / × 106m3Ultimate Enhanced Recovery Factor /%Incremental Recovery Over No-CO2 /%Incremental Recovery Over Con-CO2 /%Ave. Reservoir Pressure During CO2 Flooding /MPaCumulative CO2 Injection/MtCumulative CO2 Production/MtTotal CO2 Stored/MtUltimate Water Cut/%
WAG 1:131.36 ~ 31.4822.98 ~ 23.088.592.0612.55 ~ 12.572.66 ~ 2.710.21~ 0.232.43 ~ 2.4985.35 ~ 87.29
WAG 1:232.10 ~ 32.5023.75 ~ 23.829.312.7812.521.72 ~ 1.890.18 ~ 0.201.54 ~ 1.6985.62 ~ 86.52
WAG 2:130.16 ~ 30.1921.99 ~ 22.127.641.1112.603.61 ~ 3.810.173.44 ~ 3.6487.08 ~ 87.58
WAG 1:332.47 ~ 32.7023.80 ~ 23.979.482.9512.521.26 ~ 1.350.13 ~ 0.181.08 ~ 1.2286.33 ~ 86.59
WAG 3:129.61 ~ 29.6721.70 ~ 21.757.260.7312.614.04 ~ 4.090.15 ~ 0.163.90 ~ 3.9286.33 ~ 86.59
WAG1:532.64 ~ 32.7323.93 ~ 23.999.52.9712.520.81 ~ 1.080.130.68 ~ 0.9586.27 ~ 86.42
WAG5:129.13 ~ 29.2221.36 ~ 21.426.930.4012.594.630.134.585.89 ~ 85.99
Con-CO228.6821.026.5312.545.380.285.185.95
No-CO219.7714.4912.540.1193.97