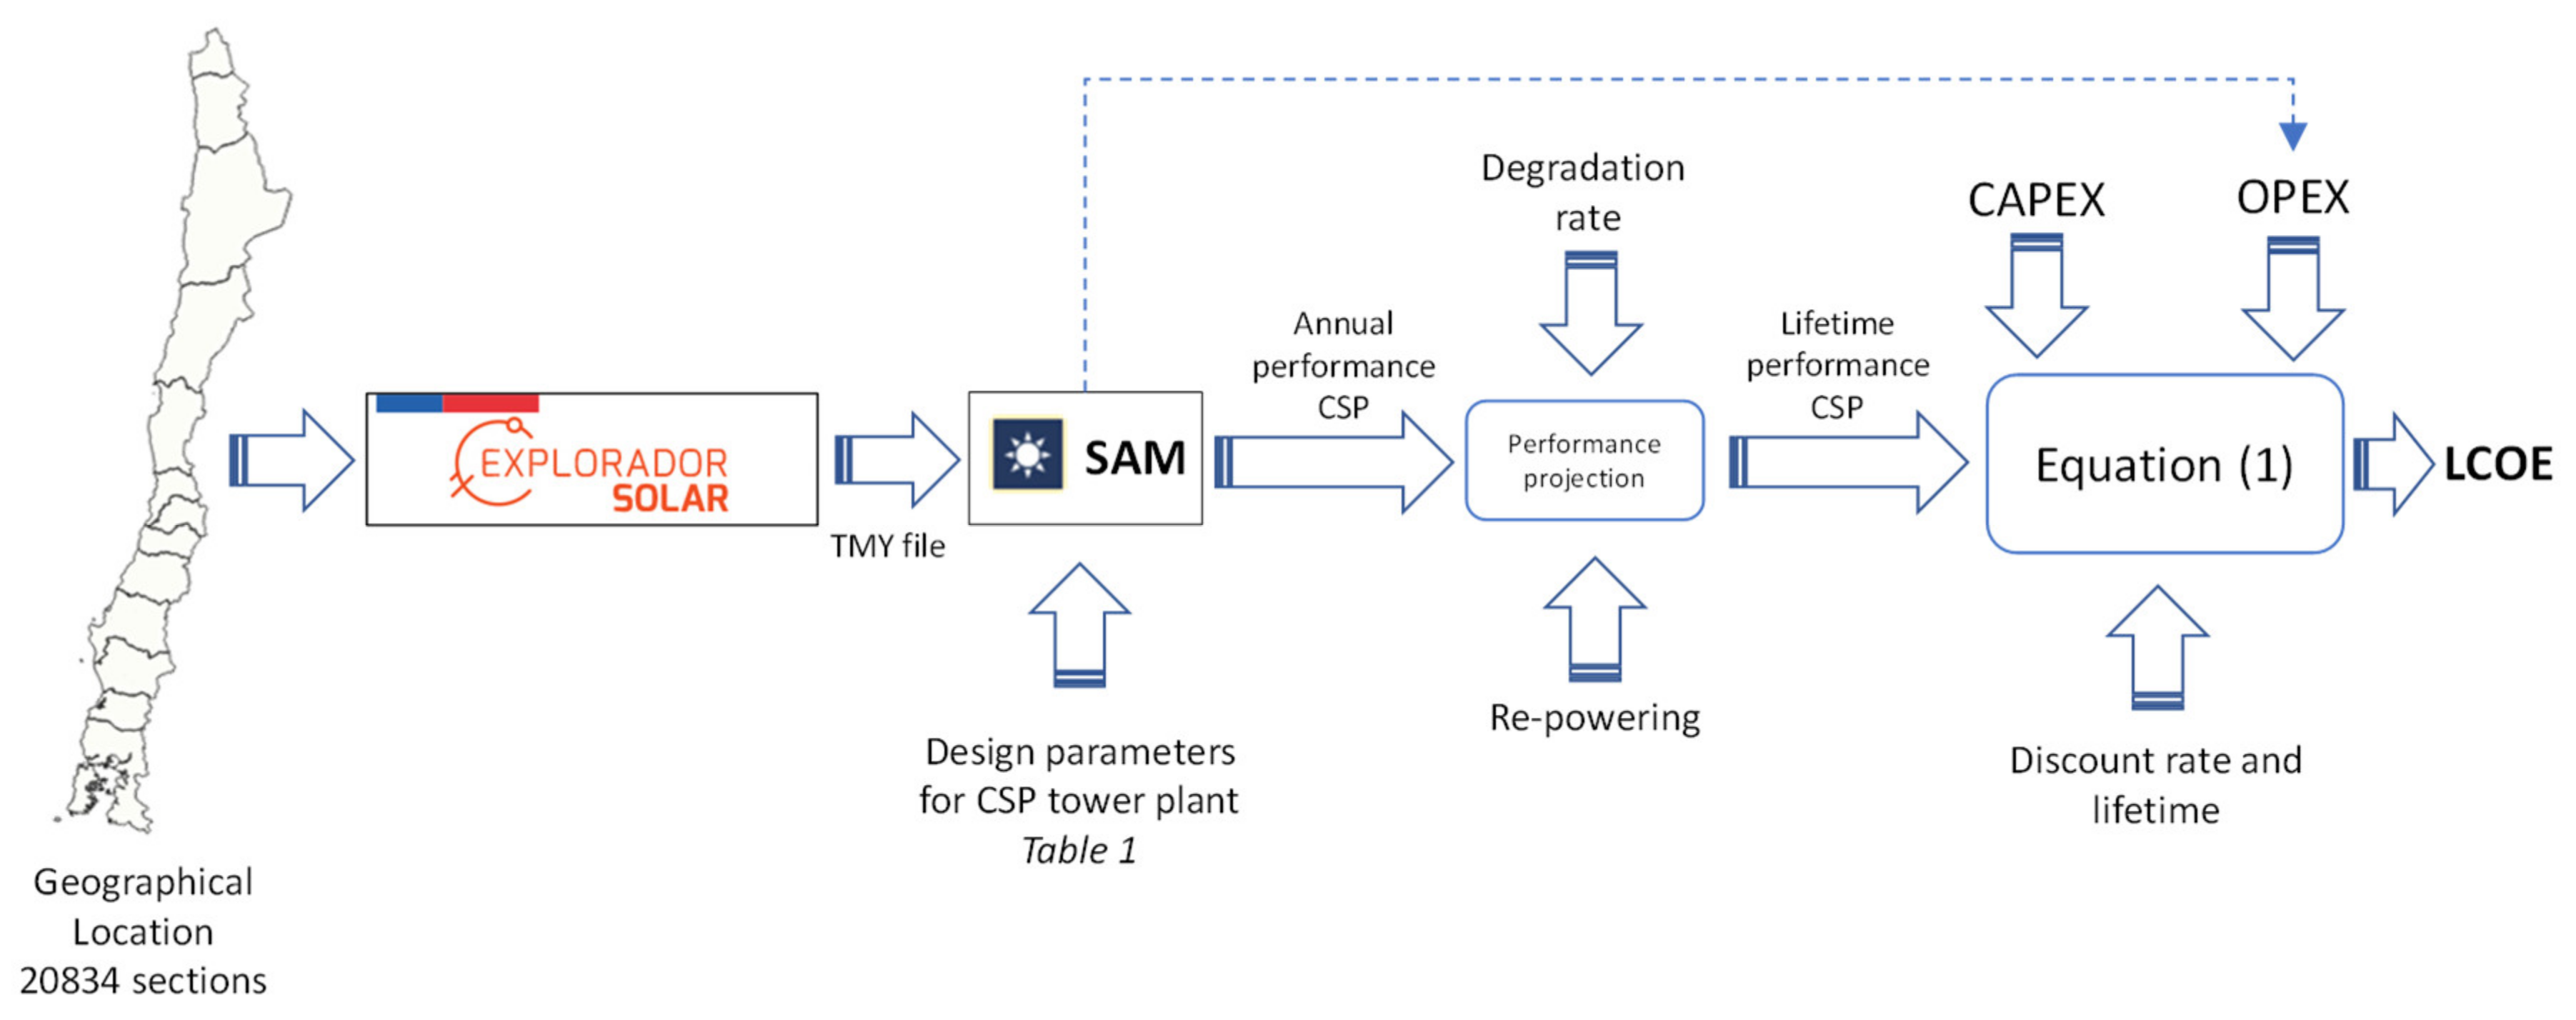
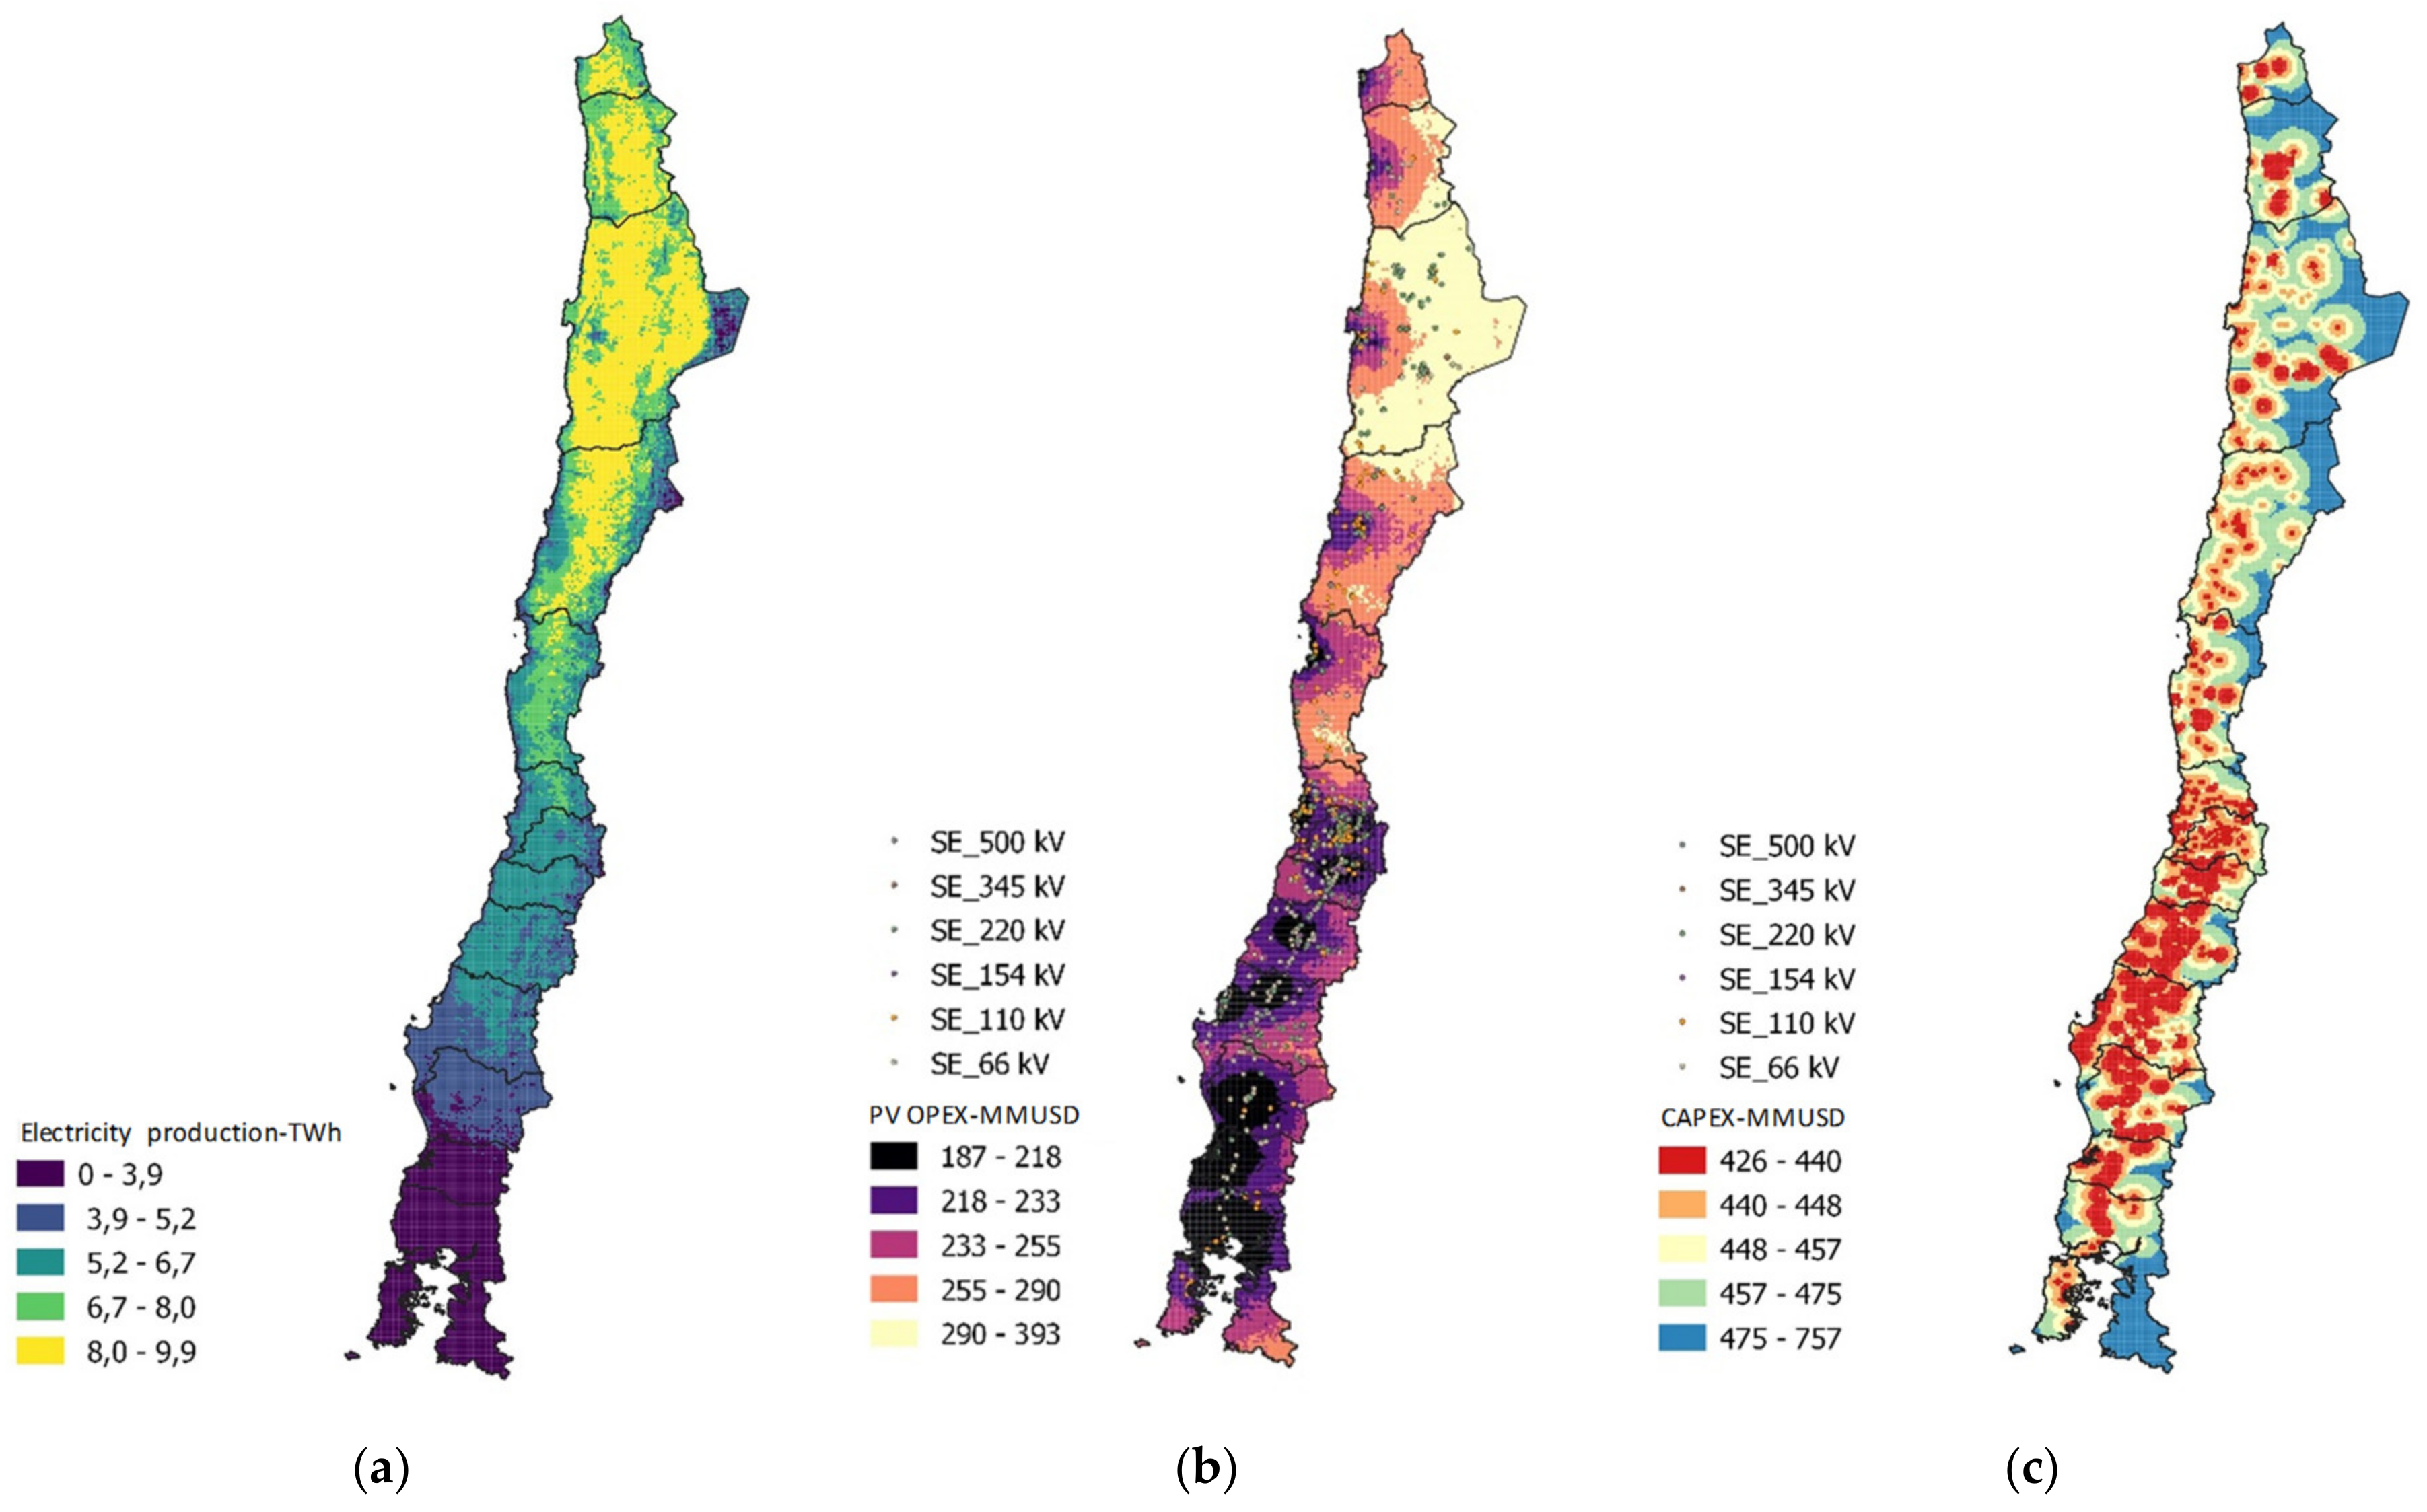
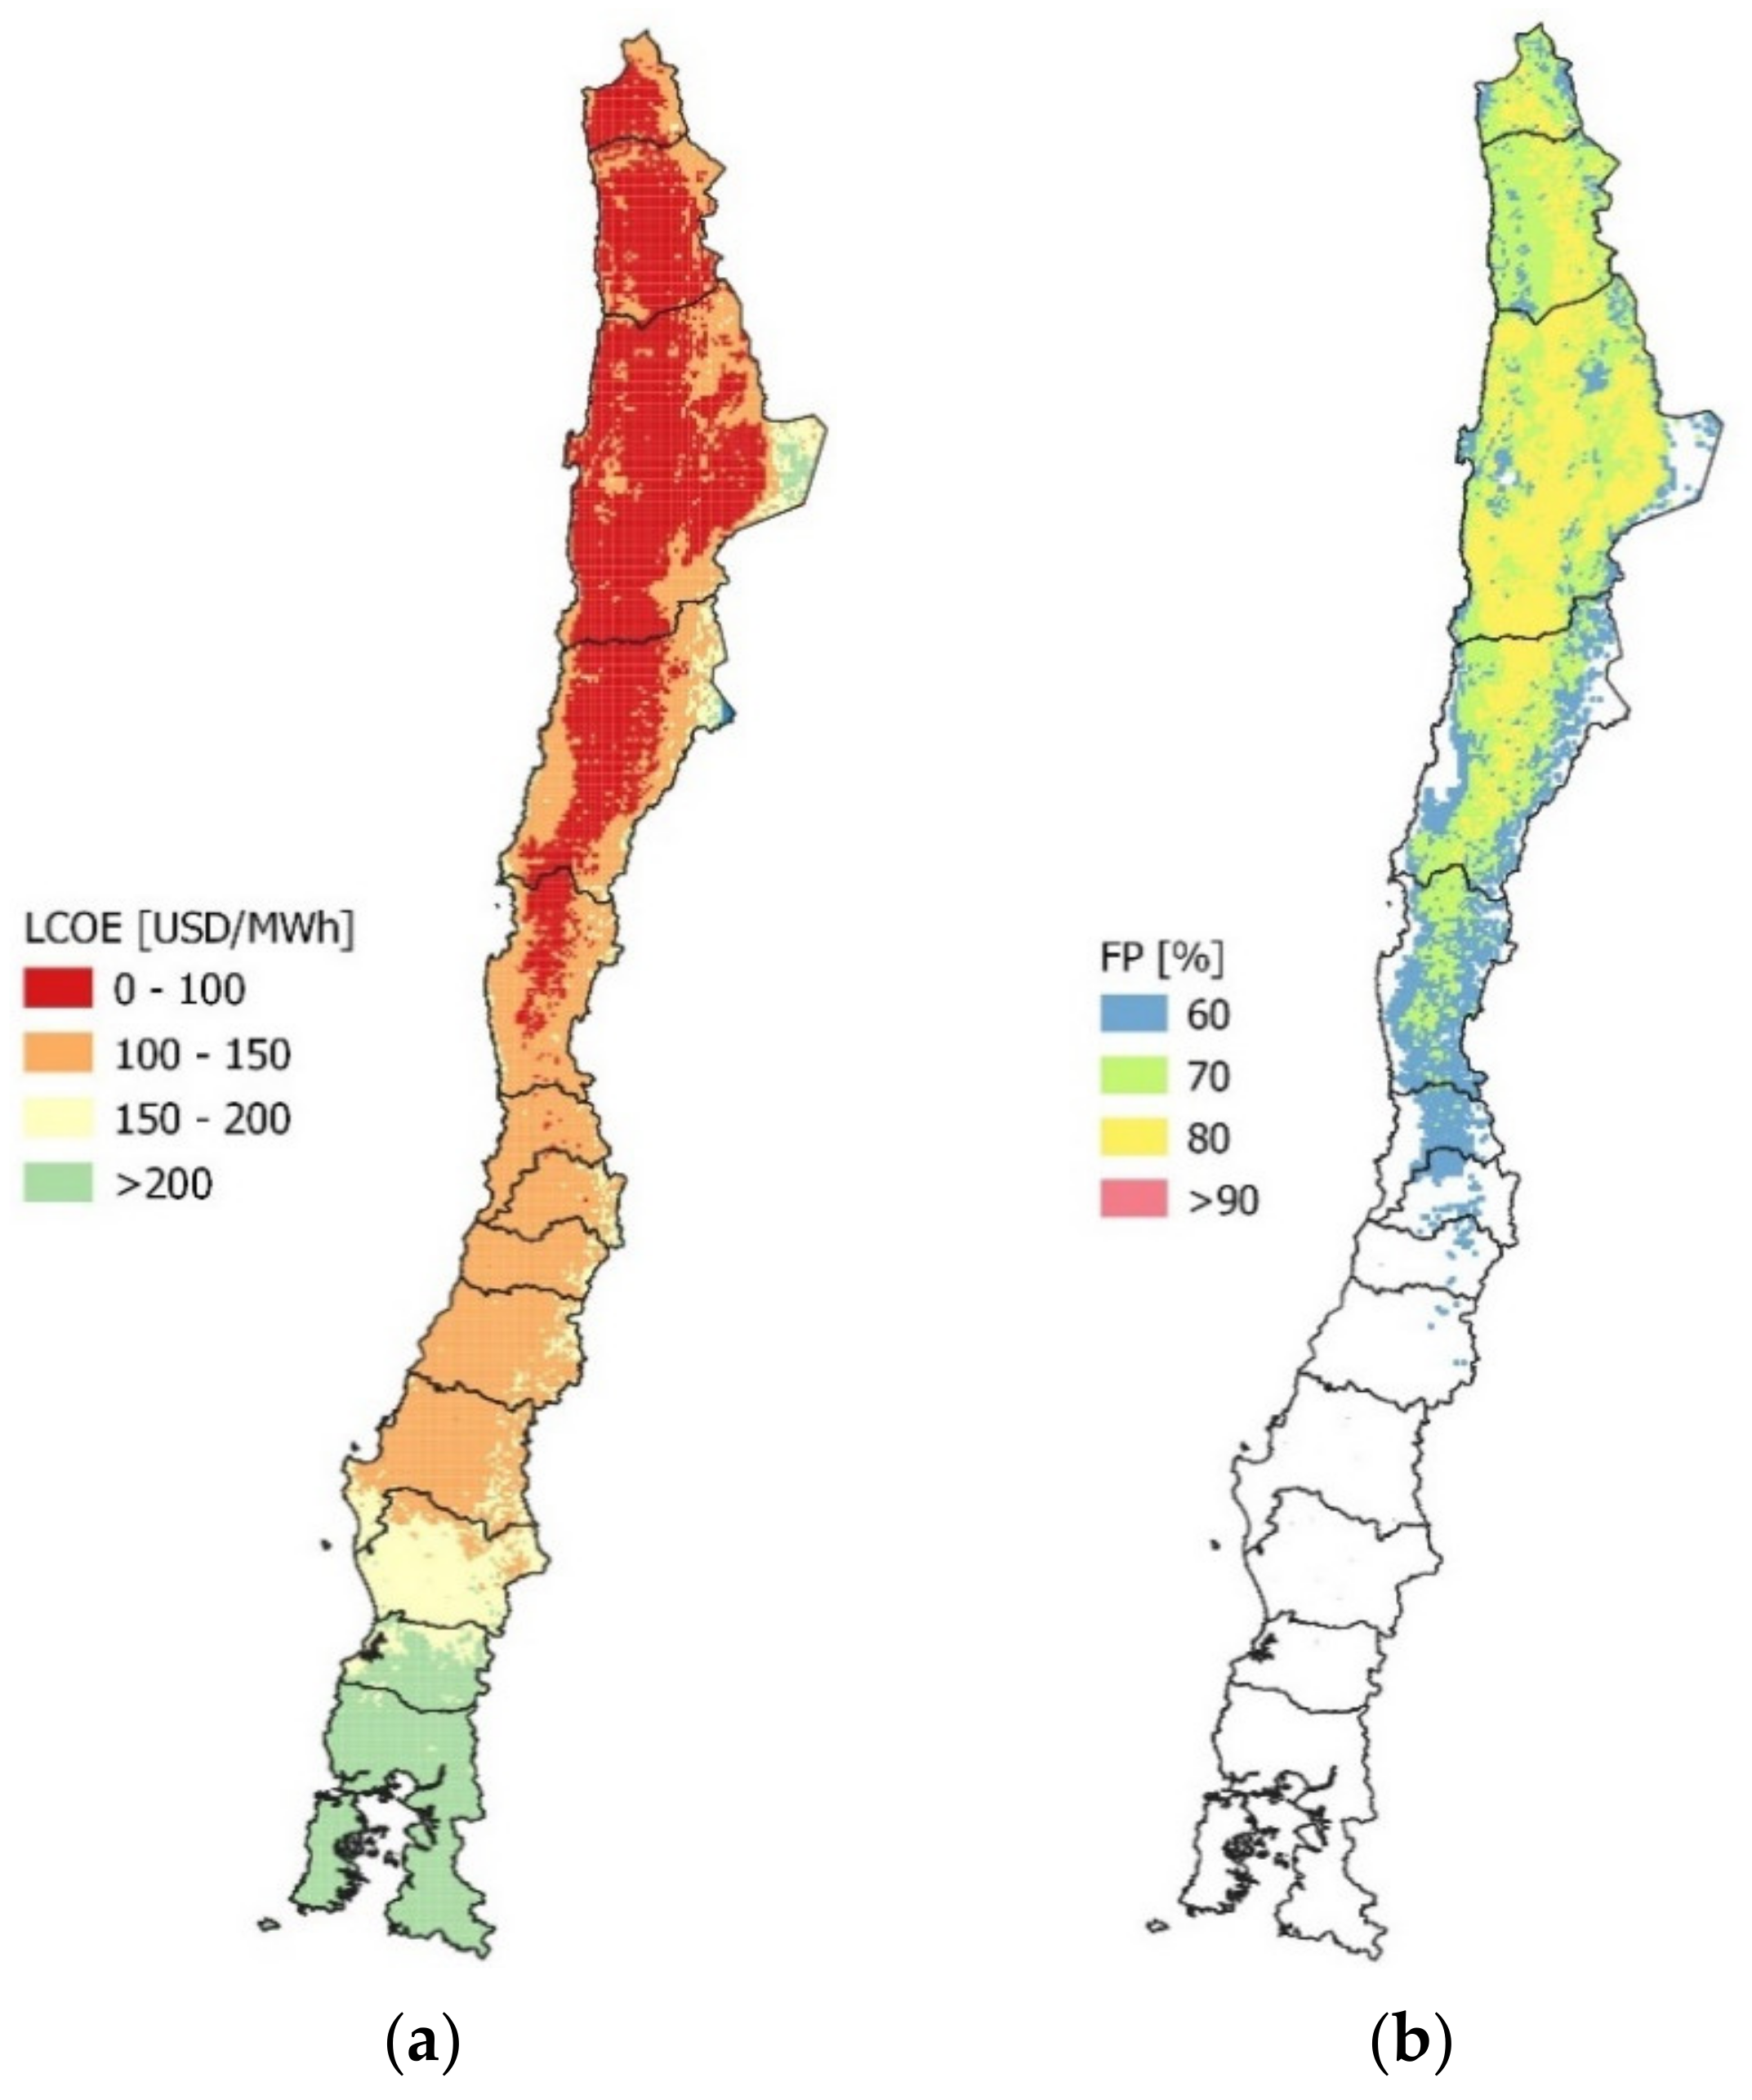
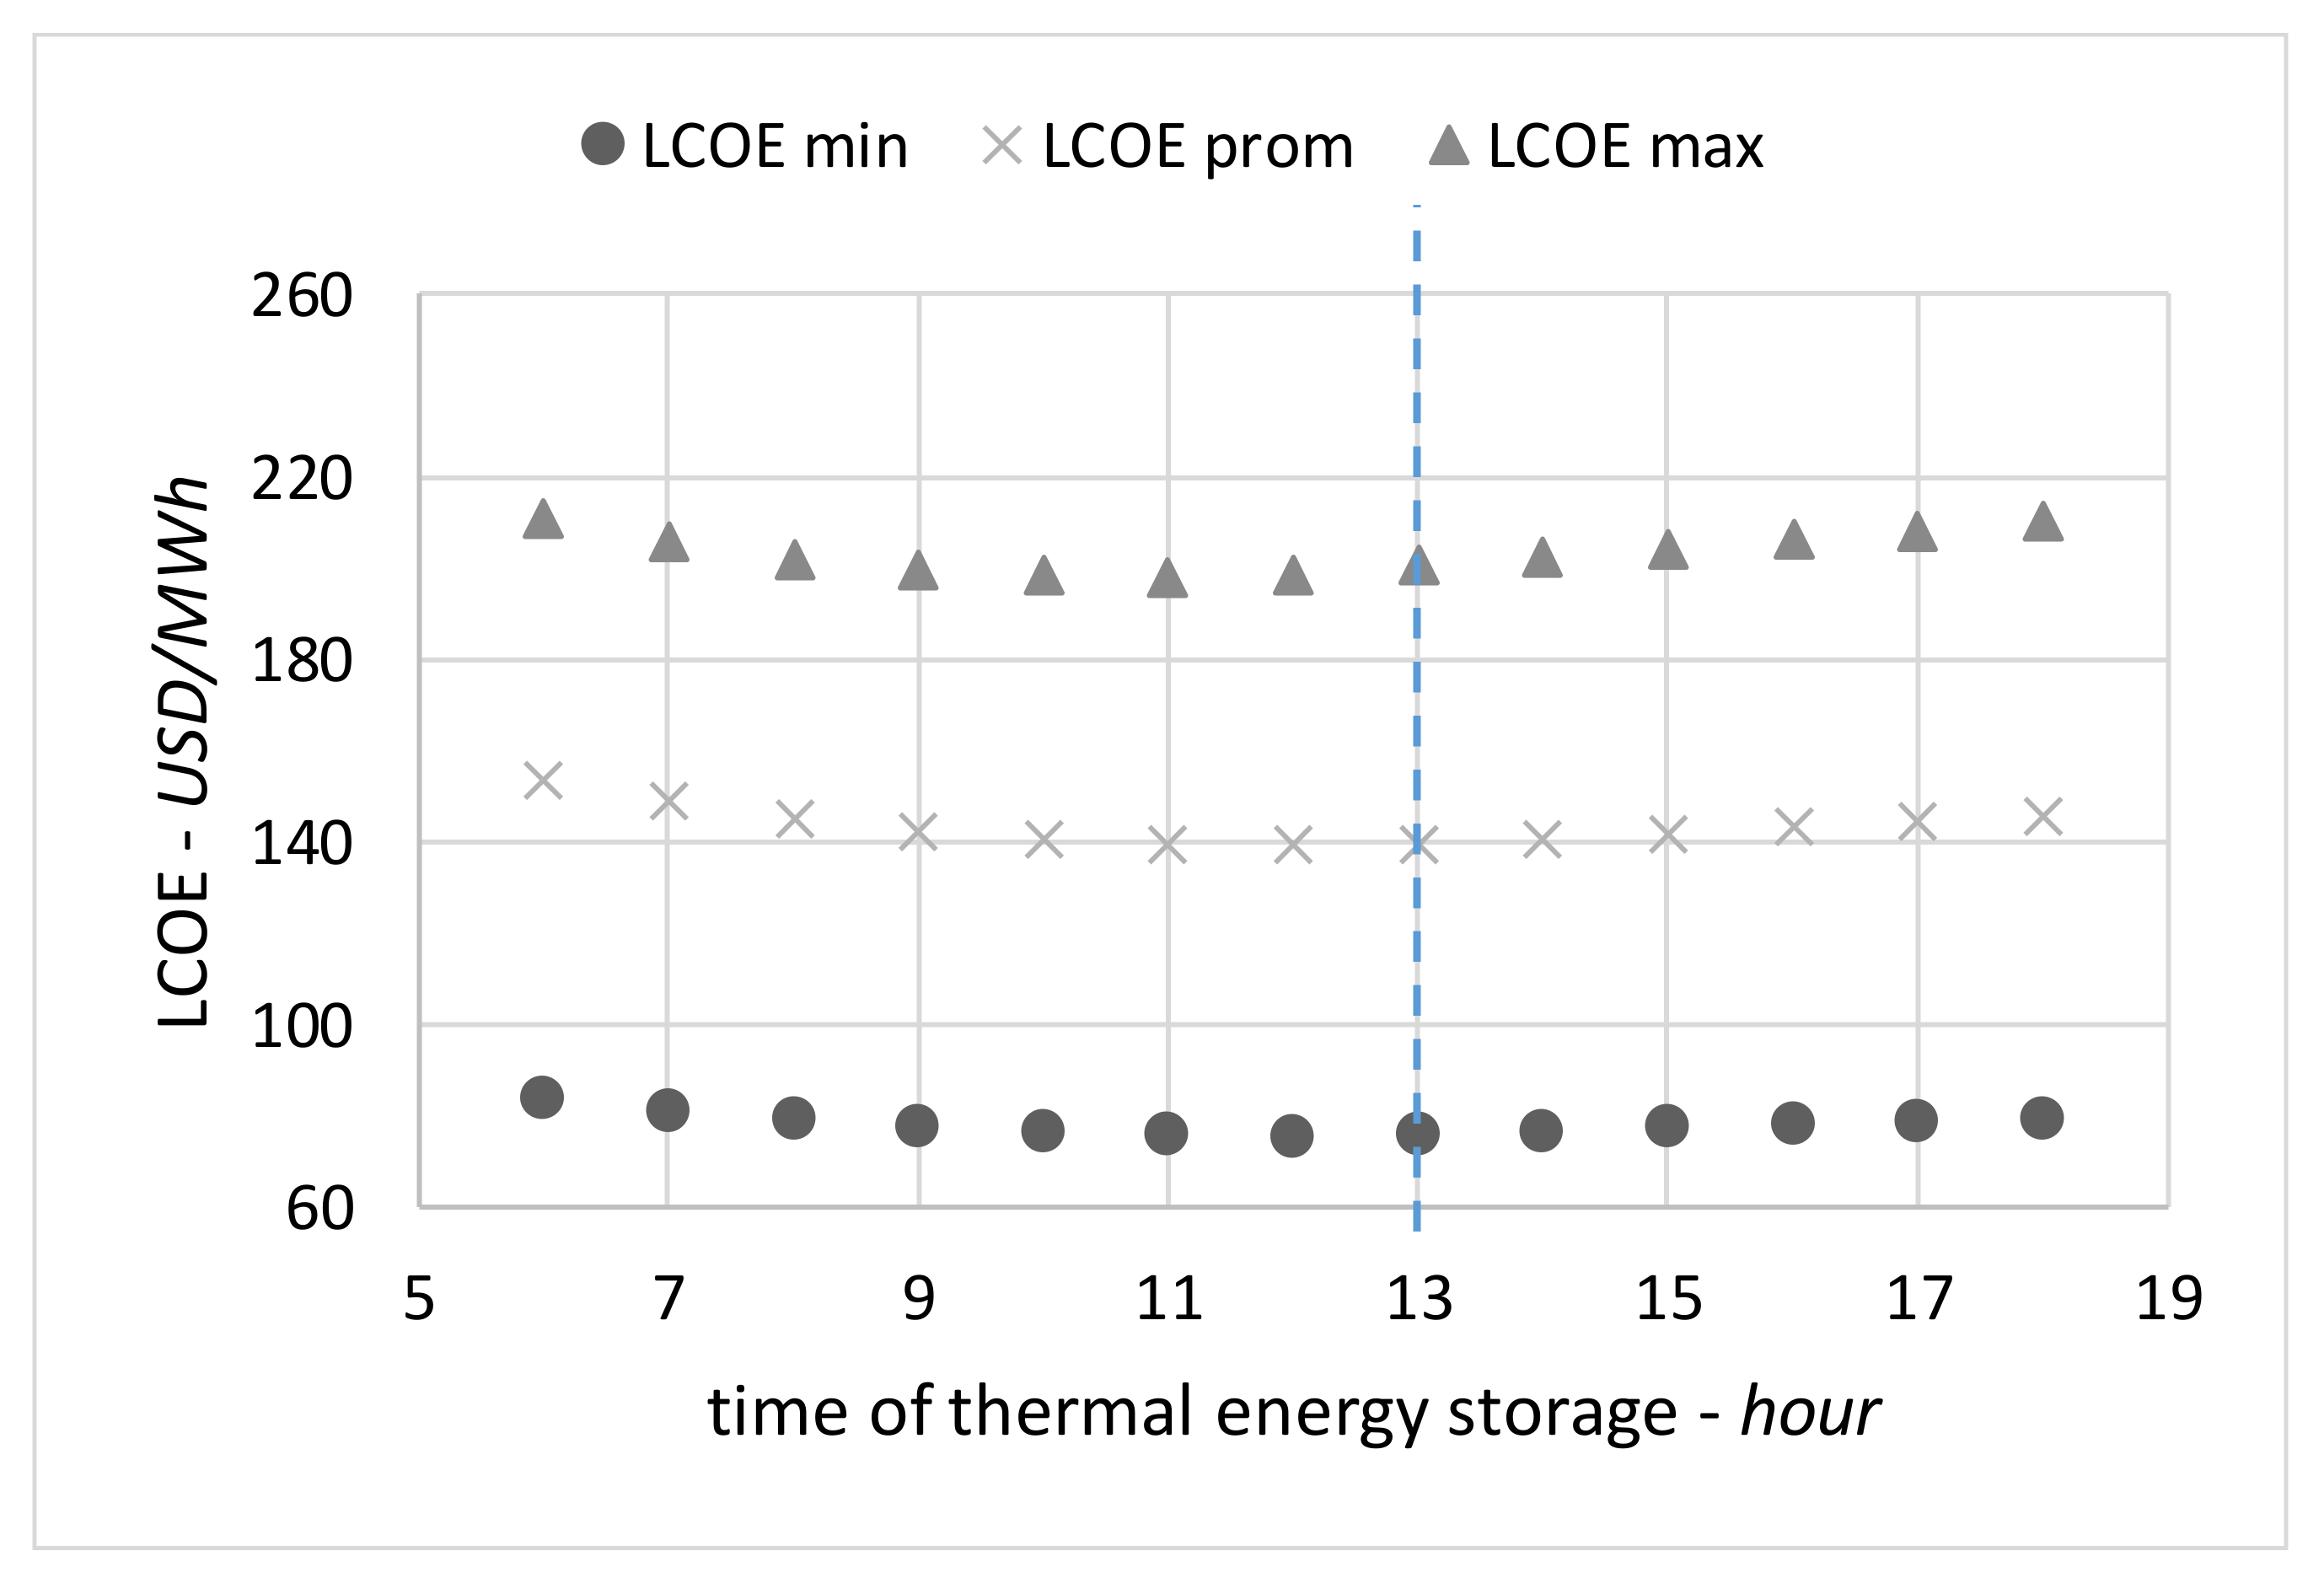
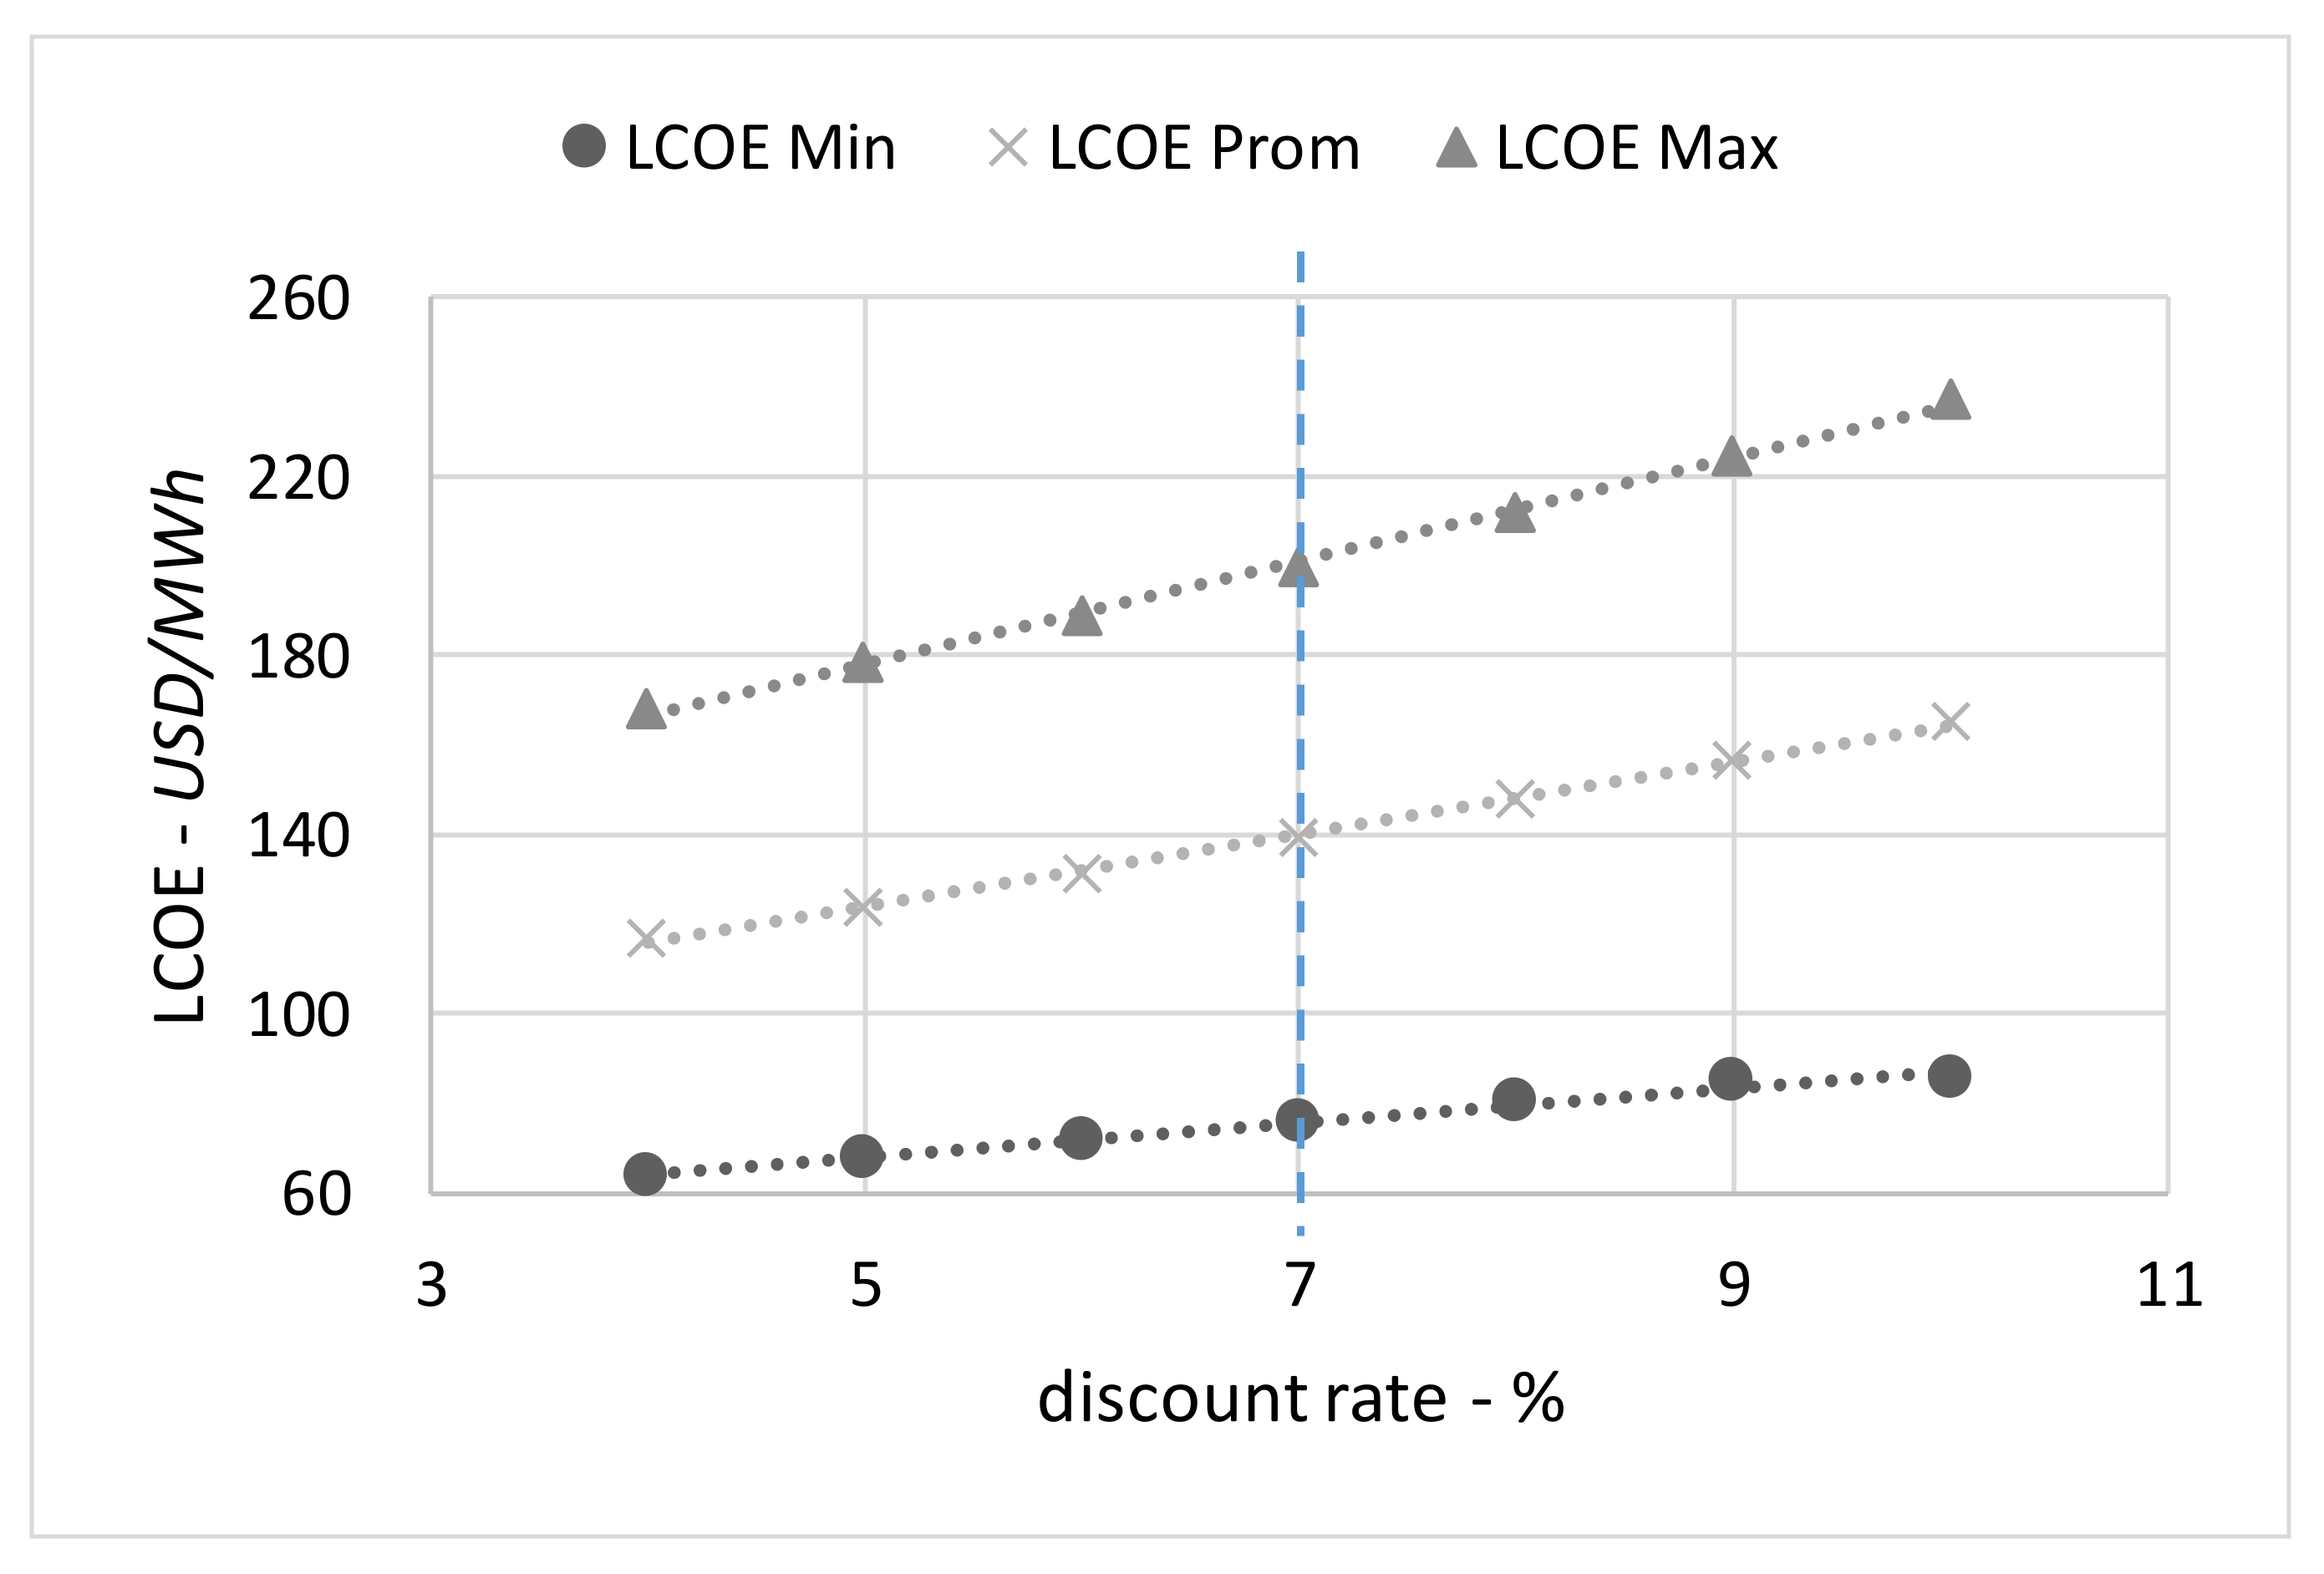
The LCOE represents the electricity generation cost during the entire lifetime of the power plant. This parameter is useful to compare different technologies in terms of economic viability. Equation (1) shows the mathematical expression for
LCOE as reported by Hernandez-Moro and Martinez-Duart [
7]. It is the ratio in terms of present value during the lifetime of the plant considering all the costs required to install and operate a specific technology and the total electricity production.
Production represents the electricity generated annually,
CAPEX refers to the capital expenditures, and
OPEX denotes the operational expenditures. The discount rate (
t) is assumed to be 7% and the lifetime (
i) for the CSP tower is 30 years [
31]. The
LCOE is calculated in nominal base [
32].
5.1. CAPEX
The CAPEX required to build a CSP tower plant includes site preparation, construction of the solar field, solar tower, solar receiver, TES and power block, among other expenses. The CAPEX was determined based on several studies [
33,
34] and by adjusting the reported values according to information provided by local developers of CSP tower plants. The solar fields CAPEX was determined considering 122 USD/m
2 of heliostats. The solar tower and receiver’s capital costs were valued in 13 and 63 MMUSD (Million U.S. dollars), respectively. The investment in thermal energy storage was calculated using 22 USD/kWh of thermal storage considering that the HTF was provided by a local supplier. The power block investment cost was estimated at 685 USD/kW of the electrical peak power. The site preparation and contingency related CAPEX were estimated at 5% each.
Table 2 shows the summary of the CAPEX required for a CSP tower plant of 130 MWe with 13 h of thermal storage capacity. The solar field, solar receiver, TES and power block represent over 85% of the required investment in the CSP tower plant.
The Chilean national electric grid features lines of 500, 345, 220, 154, 110 and 66 kV, and the most common lines are 500, 220, 110 and 66 kV. A line with higher voltage reduces electrical losses but is more expensive. The model selects a connection between the CSP tower plant with a near substation optimizing the LCOE. The independent variables are distance and substation voltage. For example, in a specific location the models simulation found that the closest substation had 66 kV lines, although there was a 110 kV line in the next substation. By optimizing the LCOE, the model determined that a connection to the 110 kV line is more convenient, as the cost of construction of the 110 kV line (requiring longer distance and higher initial investment) does not exceed the energy losses of the 66 kV line.
The model considers the construction of a dedicated line from the CSP tower plant to the selected substation (SS) that optimizes the LCOE. The substations considered as alternatives in the model are listed in the National Electric Coordinator [
35]. The energy losses in the triphasic lines are calculated using Equation (2), where
R is the electrical resistance (
R = 0.05759 Ω/km) and
I is the electrical current. The electrical current is determined using Equation (3), where
S is the apparent electrical power and
VLL is the line to line voltage.
Table 3 shows the CAPEX and OPEX in the transmission line as a function of distance. The OPEX includes the operational and maintenance costs.
A substation plant is required in the CSP tower plant. The required CAPEX and OPEX for the substation are listed in
Table 4 according to the voltage level of the line to be connected.
The CAPEX required to build roads may be studied using two approaches. The first, assessing the distance needed to connect the CSP tower plant and the selected substation, and the second, the connection to a major road which connects the CSP tower plant with the closest city. In this study, the first approach was used, as a road that follows the transmission line presents some advantage as it improves the routes conditions to perform maintenance tasks to the transmission line. The construction of an asphalt road in a rural sector with 1 km of extension and 7 m of width was quoted, representing a value of 0.329 MMUSD/km.
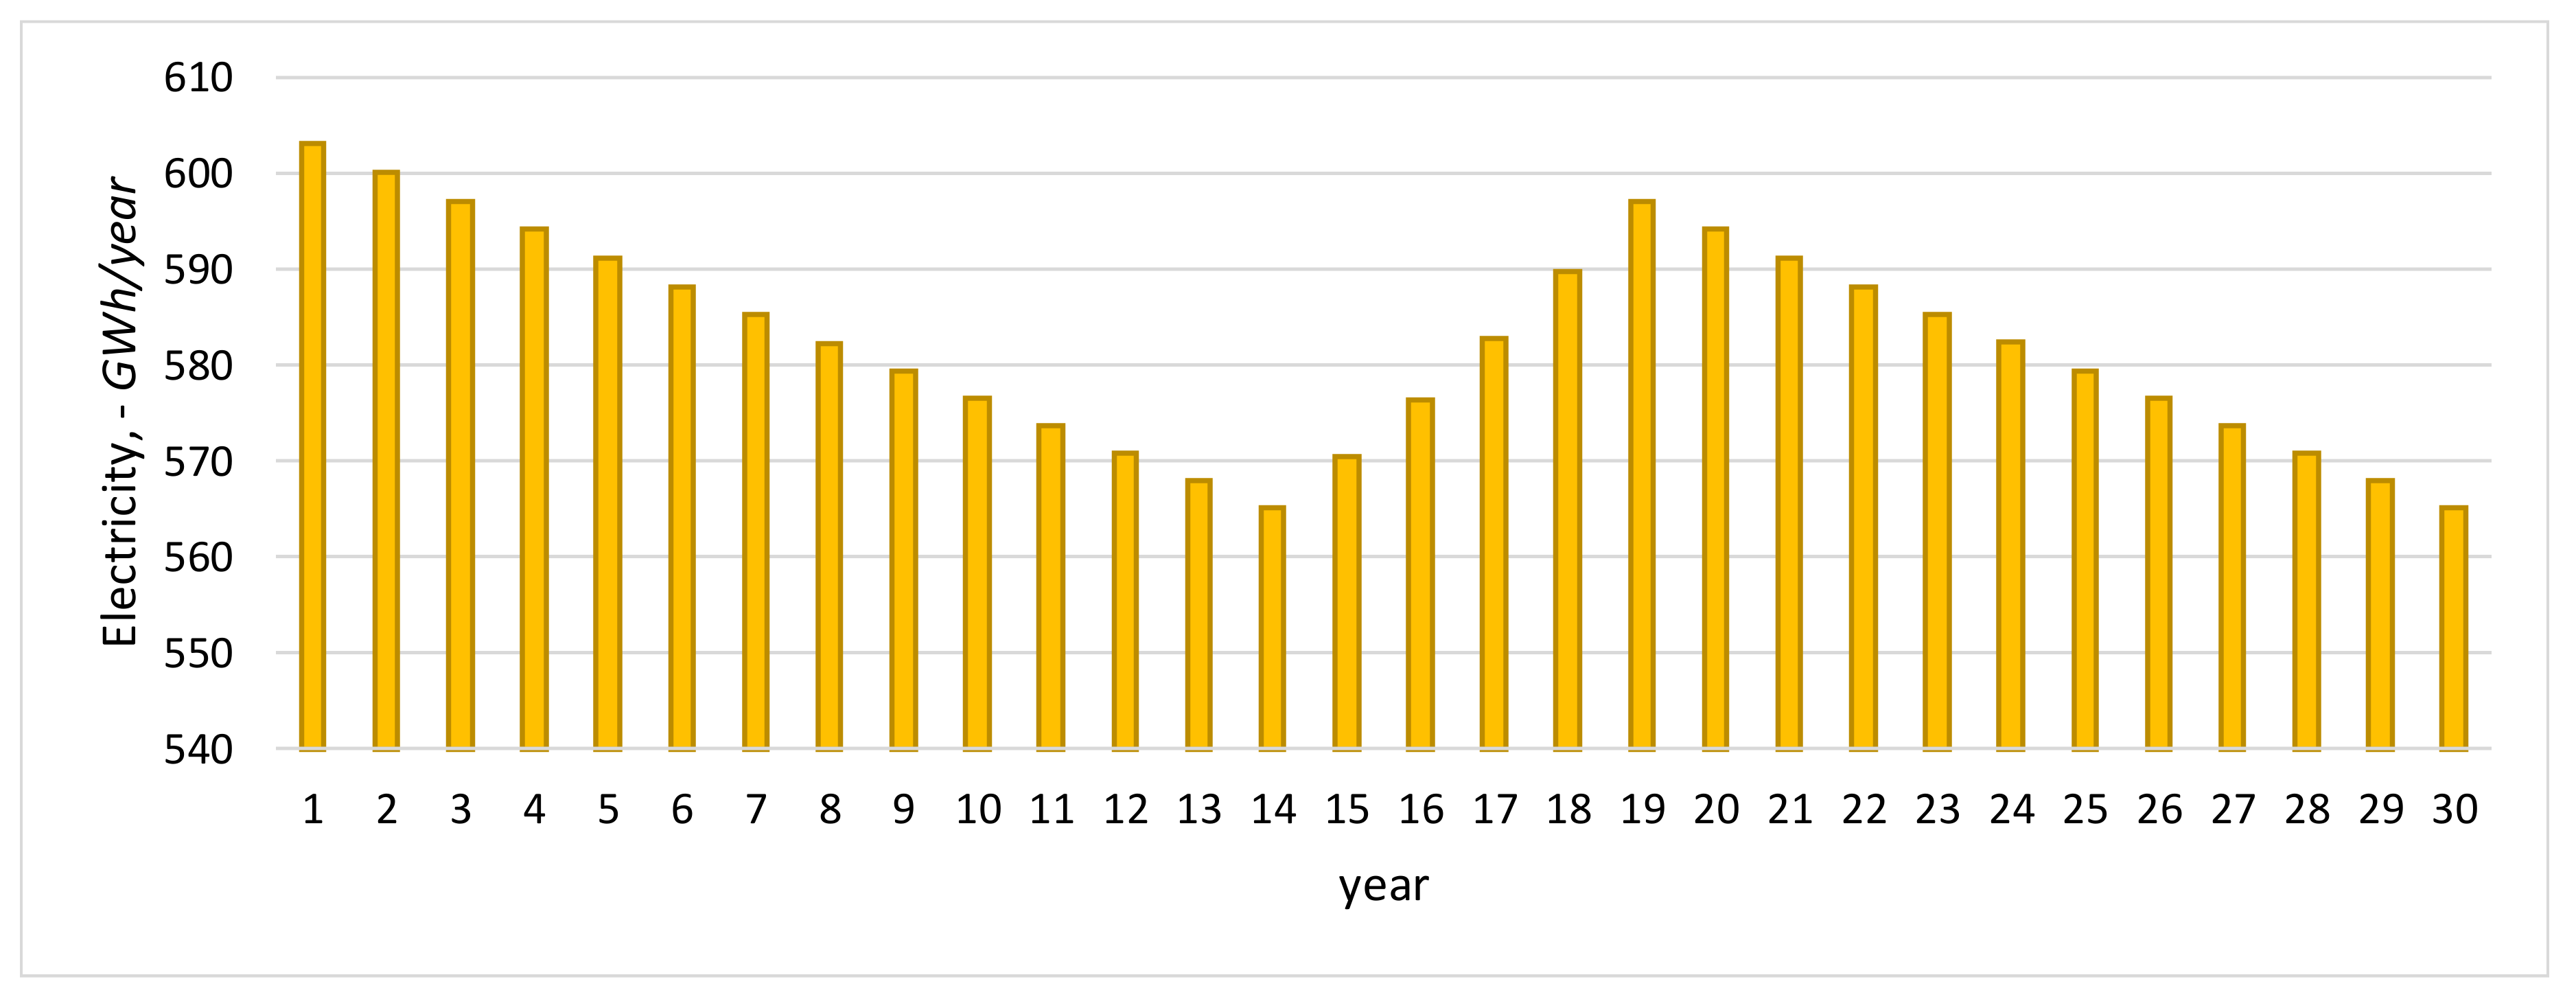
In addition, a recurring CAPEX equal to 10% of the investment of the CSP tower plant was used in replacement of the heliostat’s mirrors. The replacement involved only the mirrors, as the structures and remaining components of the heliostats were not replaced. Consequently, 10% (replacement of mirrors/solar field) of the total investment in the CSP tower plant was considered. This replacement began in the 15th year of operation and ended in the 19th year of operation where 20% of the mirrors were replaced each year.
5.2. OPEX
The OPEX in a CSP tower plant corresponds to operation and maintenance costs, human resources for operational and administrative purposes, transport and water required to clean the heliostats and run the Rankine cycle.
The OPEX related to the operation and maintenance of the CSP tower plant was composed by a fixed cost of 66 USD/kW/year and a variable cost of 3.5 USD/MWh/year, provided by SAM. In addition, the OPEX of the operation, maintenance and administration of the dedicated transmission line and the substation is presented in
Table 3 and
Table 4.
A CSP tower plant of 130 MWe requires 40 employees, in which eight work in administrative duties and 32 are operators. In a continuous operation mode (24 h and 365 days), 7 × 7 work shifts are assumed, where employees work 7 days and +7 days off-duty. Each shift has one supervisor, three engineers and four technicians. Regarding the above, the operational cost in human resources is 0.043 MMUSD per shift. In the administrative duties, the operational cost is 0.062 MMUSD per month.
In addition, employee shuttle services were considered from the city to the CSP tower plants location. A bus with capacity for 20 people was considered with a yield of 11.4 km per liter of fuel. The price of fuel was established according to the nearest major city, and was estimated according to the information provided by the Ministry of Energy [
37].
The OPEX also considers the water required to run the power block and clean the heliostats. SAM provides the water consumption for the operation of the power block, considering local environmental variables. The water required for cleaning is directly proportional to the soiling rate of the solar field. The goal is to keep an average reflectivity on the solar field; the water required to maintain the solar field is determined as a function of the yearly cleaning frequency. When an average soiling rate of 0.29% per day [
28] is considered, the heliostats should be cleaned 35 times every year, estimating a water consumption of 29,110 m
3/year. The water is transported by tanker trucks from the closest city to the power plant. The associated transport cost is defined by local quotes and is calculated as a function of the distance (0.384 USD/m
3-km). The price of the water is based on quotations of water from inverse osmosis treatment plants (demineralized water), with a price of 5.65 USD/m
3.
