Article

Hydrogenation Ability of Mg-Li Alloys

Institute of Materials Science and Engineering, Faculty of Advanced Technology and Chemistry, Military University of Technology, Kaliskiego 2 Street, 00-908 Warszawa, Poland
*
Authors to whom correspondence should be addressed.
Energies 2020, 13(8), 2080; https://doi.org/10.3390/en13082080
Submission received: 30 March 2020 / Revised: 17 April 2020 / Accepted: 19 April 2020 / Published: 21 April 2020
(This article belongs to the Special Issue Hydrides: Science and Technology)

Abstract

:
The Mg-Li binary system is characterized by the presence of α-Mg(Li) and β-Li(Mg) phases, where magnesium exists in ordered and disordered forms that may affect the hydrogenation properties of magnesium. Therefore, the hydrogenation properties of an AZ31 alloy modified by the addition of 4.0 wt.%, 7.5 wt.% and 15.0 wt.% lithium were studied. The morphology (scanning electron microscopy (SEM)), structure, phase composition (X-ray diffraction (XRD)) and hydrogenation properties (differential scanning calorimetry (DSC)) of AZ31 with various lithium contents were investigated. It was found that the susceptibility of magnesium in the form of α-Mg(Li) to hydrogenation was higher than that for the magnesium occupying a disordered position in β-Li(Mg) solid solutions. Magnesium hydride was obtained as a result of hydrogenation of the AZ31 alloy that was modified with 4.0 wt.%, 7.5 wt.% and 15.0 wt.% additions of lithium, and was characterized by high hydrogen desorption activation energies of 250, 187 and 224 kJ/mol, respectively.

Graphical Abstract

1. Introduction

The increasing demand for energy and growing awareness of environmental protection force us to look for new alternative solutions. Hydrogen is receiving interest as a clean energy carrier that can replace traditional fossil fuels. However, the main problem in using hydrogen as fuel in the future is finding the right way to store it. Hydrogen storage in the solid phase is one of the most promising solutions because of safety reasons, the reversibility of the process and, above all, its high capacity [1,2,3,4,5,6,7,8].
There are many materials that can be used as a medium for hydrogen storage. One of the basic groups of materials for hydrogen storage are AB, AB2, A2B and AB5 intermetallic phase-based alloys. They are characterized by the possibility of fast hydrogen absorption/desorption processes at room temperature. However, their major drawback is a low gravimetric storage capacity, which is usually less than 2 wt.% hydrogen [9,10]. A good example of this type of material is the FeTi intermetallic phase, which has a hydrogen capacity of 1.9 wt.%. Unfortunately, easy surface oxidation of FeTi powder provides additional difficulty and requires a long-lasting activation process at high temperatures [11,12,13,14,15]. The most commonly used LaNi5 is another example of the mentioned materials. However, in this case, in addition to a low capacity (which usually does not reach 1.4 wt.% H2), the degradation of the hydrogen storage capacity, which decreases with increasing number of cycles, is also a problem [16,17]. The very large advantage of this type of alloy is its susceptibility to equilibrium pressure tuning by alloying [18,19,20,21,22]. It can be concluded that hydrogen storage intermetallic alloys reversibly absorb and desorb hydrogen at room temperature. Unfortunately, in addition to their low hydrogen capacity, they are characterized by other unfavorable properties. On the other hand, materials that can store up to 12% of hydrogen also exist. Particular attention is being paid to complex hydrides containing lithium, especially LiBH4, due to its ability to potentially store up to 18 wt.% hydrogen [23]. Unfortunately, the commercial application of lithium borohydride is limited by a two-stage decomposition reaction, where at 400 °C, only half of the theoretical hydrogen content is released, and the second stage takes place above 600 °C. A major drawback is also rehydrogenation, which requires meeting specific and difficult technological conditions [24]. A more promising complex hydride appears to be lithium alanate [25]. However, similar to the behavior for lithium borohydride, LiAlH4 also decomposes in two stages [26]. Generally, complex hydrides, despite their prospectively large hydrogen capacities, have numerous technical and technological problems, including safety issues.
As one of the most commonly studied materials in terms of hydrogen storage, magnesium hydride shares some of the properties of the two previously mentioned groups and is used due to its high gravimetric density, relatively low cost and reversible absorption/desorption processes [27]. However, the problem that complicates its use is the slow kinetics of its absorption and desorption reactions, and high thermodynamic stability. There are a number of publications regarding the possibility of improving these properties, mainly by doping with transition group elements or other chemical compounds and the formation of ternary metal hydrides [27,28,29,30,31]. However, few papers have been published on the modification of magnesium with alkali metals.
Therefore, the use of lithium as an additive seems to be a solution worthy of interest, especially knowing lithium’s ability to form stable alkaline hybrids with a much higher total hydrogen content than magnesium. It is also attractive from a basic scientific point of view. For example, as can be seen in the Mg-Li phase diagram [32], only a small amount of lithium leads to the stabilization of a solid solution of magnesium in lithium with a body-centered cubic crystalline structure, which is in contrast to the hexagonal close-packed structure of magnesium [33].
Therefore, a noteworthy approach may be to check how changes in the chemical composition, and in the crystal lattice and its parameters, affect the absorption properties. To the best of our knowledge, only the hydrogenation properties of a solid solution of lithium in magnesium have been investigated [34,35]. There is no information about the behavior of magnesium in the form of a solid solution in a lithium matrix.
In this paper, the hydrogenation properties of a commercially available AZ31 magnesium alloy with the addition of lithium over a wide content range are presented.

2. Materials and Methods

The material used herein consisted of an AZ31 alloy (chemical composition: 2.5–3.5 wt.% Al, 0.7–1.7 wt.% Zn, 0.2–1.0 wt.% Mn, 0.05 wt.% Cu, and balance Mg) that was cast with the addition of various lithium contents. The alloys were cast in a laboratory one-chamber vacuum furnace (VSG furnace from Balzers). This process was carried out under a protective atmosphere of argon at an applied pressure of 8 × 10⁴ Pa. To obtain the highest purity in the melting space, the furnace chamber was pumped to a pressure of 1.3 Pa and then purged three times with argon. The alloys were cast into graphite molds. Depending on the percentage of lithium, various melting temperatures of 650 °C, 600 °C and 600 °C were used for the ingots with the different lithium contents of 4.0 wt.%, 7.5 wt.% and 15.0 wt.%, respectively.
The X-ray diffraction (XRD) phase analysis of the materials, both before and after hydrogenation, was performed using an Ultima IV (Rigaku, Tokyo, Japan) diffractometer with Co Kα radiation (1.79 Å). The XRD was conducted at 40 kV and 40 mA, with a scanning speed of 0.5 °/min. A DeteX-Ultra fast linear counter was used in continuous scanning mode along with a parallel beam geometry. All tests were performed in a special, custom-made environmental holder so that the sample did not come into contact with the air.
Morphological examination of the powders was conducted with high-resolution scanning electron microscopy (SEM, Quanta 3D FEG Dual-Beam scanning electron microscope) and an infrared particle size analyzer (IPS Kamika, Warsaw, Poland).
The hydrogenation process was carried out using a Sieverts-type sorption analyzer (HTP1-S Hiden Isochema, Warrington, UK). Initially, the ingots were subjected to a machining process, and the obtained chips were hydrogenated. Samples with masses from 200 to 250 mg were heated under a hydrogen pressure of approximately 80 bar at 450 °C (with a heating rate of 2 °C/min). When the sample was saturated and stopped absorbing hydrogen, it was removed from the reactor and ground in a mortar in a glove box. This procedure was repeated three times for each sample. The goal of this multistep hydrogenation process was to improve the absorption properties of the material by lowering the diffusion distances and preventing the “passivation” of the surface layer of the chips.
Differential scanning calorimetry (DSC) tests for samples after heating under hydrogen pressure were carried out with a Sensys Evo (Setaram) apparatus under a flow of ultrahigh-purity helium. To measure the hydride decomposition temperature and evaluate the kinetic properties of synthetized hydrides, samples were heated to 450 °C at rates of 1, 2 and 5 °C/min. The activation energy of hydrogen desorption Ea was estimated using the method by Kissinger:
l n ( β T m 2 ) = E a R T m + c o n s t
where Ea is the energy of activation; β is the heating rate (in K min−1) of the DSC experiment; Tm, the temperature at the differential heat flow maximum of the DSC experiment; and R, the universal gas constant.
The efficiency of the hydrogenation process was determined by thermogravimetric analysis (TGA) coupled with DSC. At the same time, during the DSC and TGA analyses, a mass spectrometer (MS) (Hiden Analytical) was used to investigate the chemical composition of the released gases by measuring the partial pressures of H2, O2, N2, H2O and -HO. All manual operations, including crucible loading, took place in a glove box (LABmaster, MBraun, Germany) with a controlled argon atmosphere that had an oxygen and water content below 0.1 ppm.

3. Results and Discussion

To determine the effect of the phase structure of the Mg-Li alloy on its hydrogenation properties, alloys with different lithium contents of 4.0 wt.%, 7.5 wt.% and 15.0 wt.% were tested.

3.1. Phase Structure and Morphology of the Materials Before and After Hydrogenation

Based on the analysis of the equilibrium phase diagram (Figure 1), it can be concluded that the lithium content significantly influences the phase composition of the alloy.
The investigated alloys represent an α solid solution of Li in Mg (Li content of 4.0 wt.%), β solid solution of Mg in Li (Li content of 15.0 wt.%) and the eutectic mixture of both phases (Li content of 7.5 wt.%). In the case of an α-Mg(Li) solid solution, the magnesium atoms occupy ordered positions in a hexagonal lattice. In contrast, in a β-Li(Mg) solid solution, the magnesium atoms occupy disordered positions, which may affect the magnesium hydrogenation properties. The XRD results (Figure 2) for alloys with different lithium contents revealed the presence of the α-Mg(Li) phase (01-079-6692) for the AZ31 alloy modified by 4.0 wt.% Li (Figure 2a), the β-Li(Mg) phase (04-006-5779) for the alloy containing 15.0 wt.% Li (Figure 2c) and a mixture of these phases for the eutectic alloy (Figure 2b). Moreover, for alloys with lithium contents higher than 4.0 wt.%, weak peaks originating from the LiAl phase can be seen.
The various chemical compositions and phase structures also affected the mechanical properties and the shape of the chips obtained after machining (Figure 3a–c) and the powder particles after grinding and hydrogenation (Figure 3d–f).
Microscopic observations showed a change in the shape of the material after cutting, grinding and hydrogenation. Powder particles for both α-Mg(Li) solid solutions and the eutectic mixture of α-Mg(Li) and β-Li(Mg) phases (Li content of 4.0 wt.% and 7.5 wt.%, respectively) had a globular morphology and varied in size. The powder particle morphology for an alloy consisting of the β-Li(Mg) solid solution of Mg in Li (Li content of 15.0 wt.%) was definitely more homogeneous than the powders with a lower lithium content. The results of the quantitative evaluation of the particle size with various lithium contents are presented in Table 1.
The average particle diameter (calculated from the volume-weighted particle size distribution) increased as the lithium content increased, although the value of the median diameter had a non-monotonic character. The varied character of the mean and median changes may have resulted from the lognormal distribution of the particle diameter (not presented in this paper). The change in the median diameter of the powder particles was likely due to the different mechanical properties of the alloy caused by the different lithium contents; the alloys therefore had a variable susceptibility to the grinding process [36]. Varin et al. showed that the presence of phases with different mechanical properties has a significant impact on the structural changes that occur during the milling process from nanostructurization to amorphization of the grinded material [37]. The same effect was confirmed for substrates used for Mg2FeH6 manufacturing when steel was used to replace pure iron [38].

3.2. Phase Structure and Hydrogenation Properties of the Alloys with Different Lithium Contents

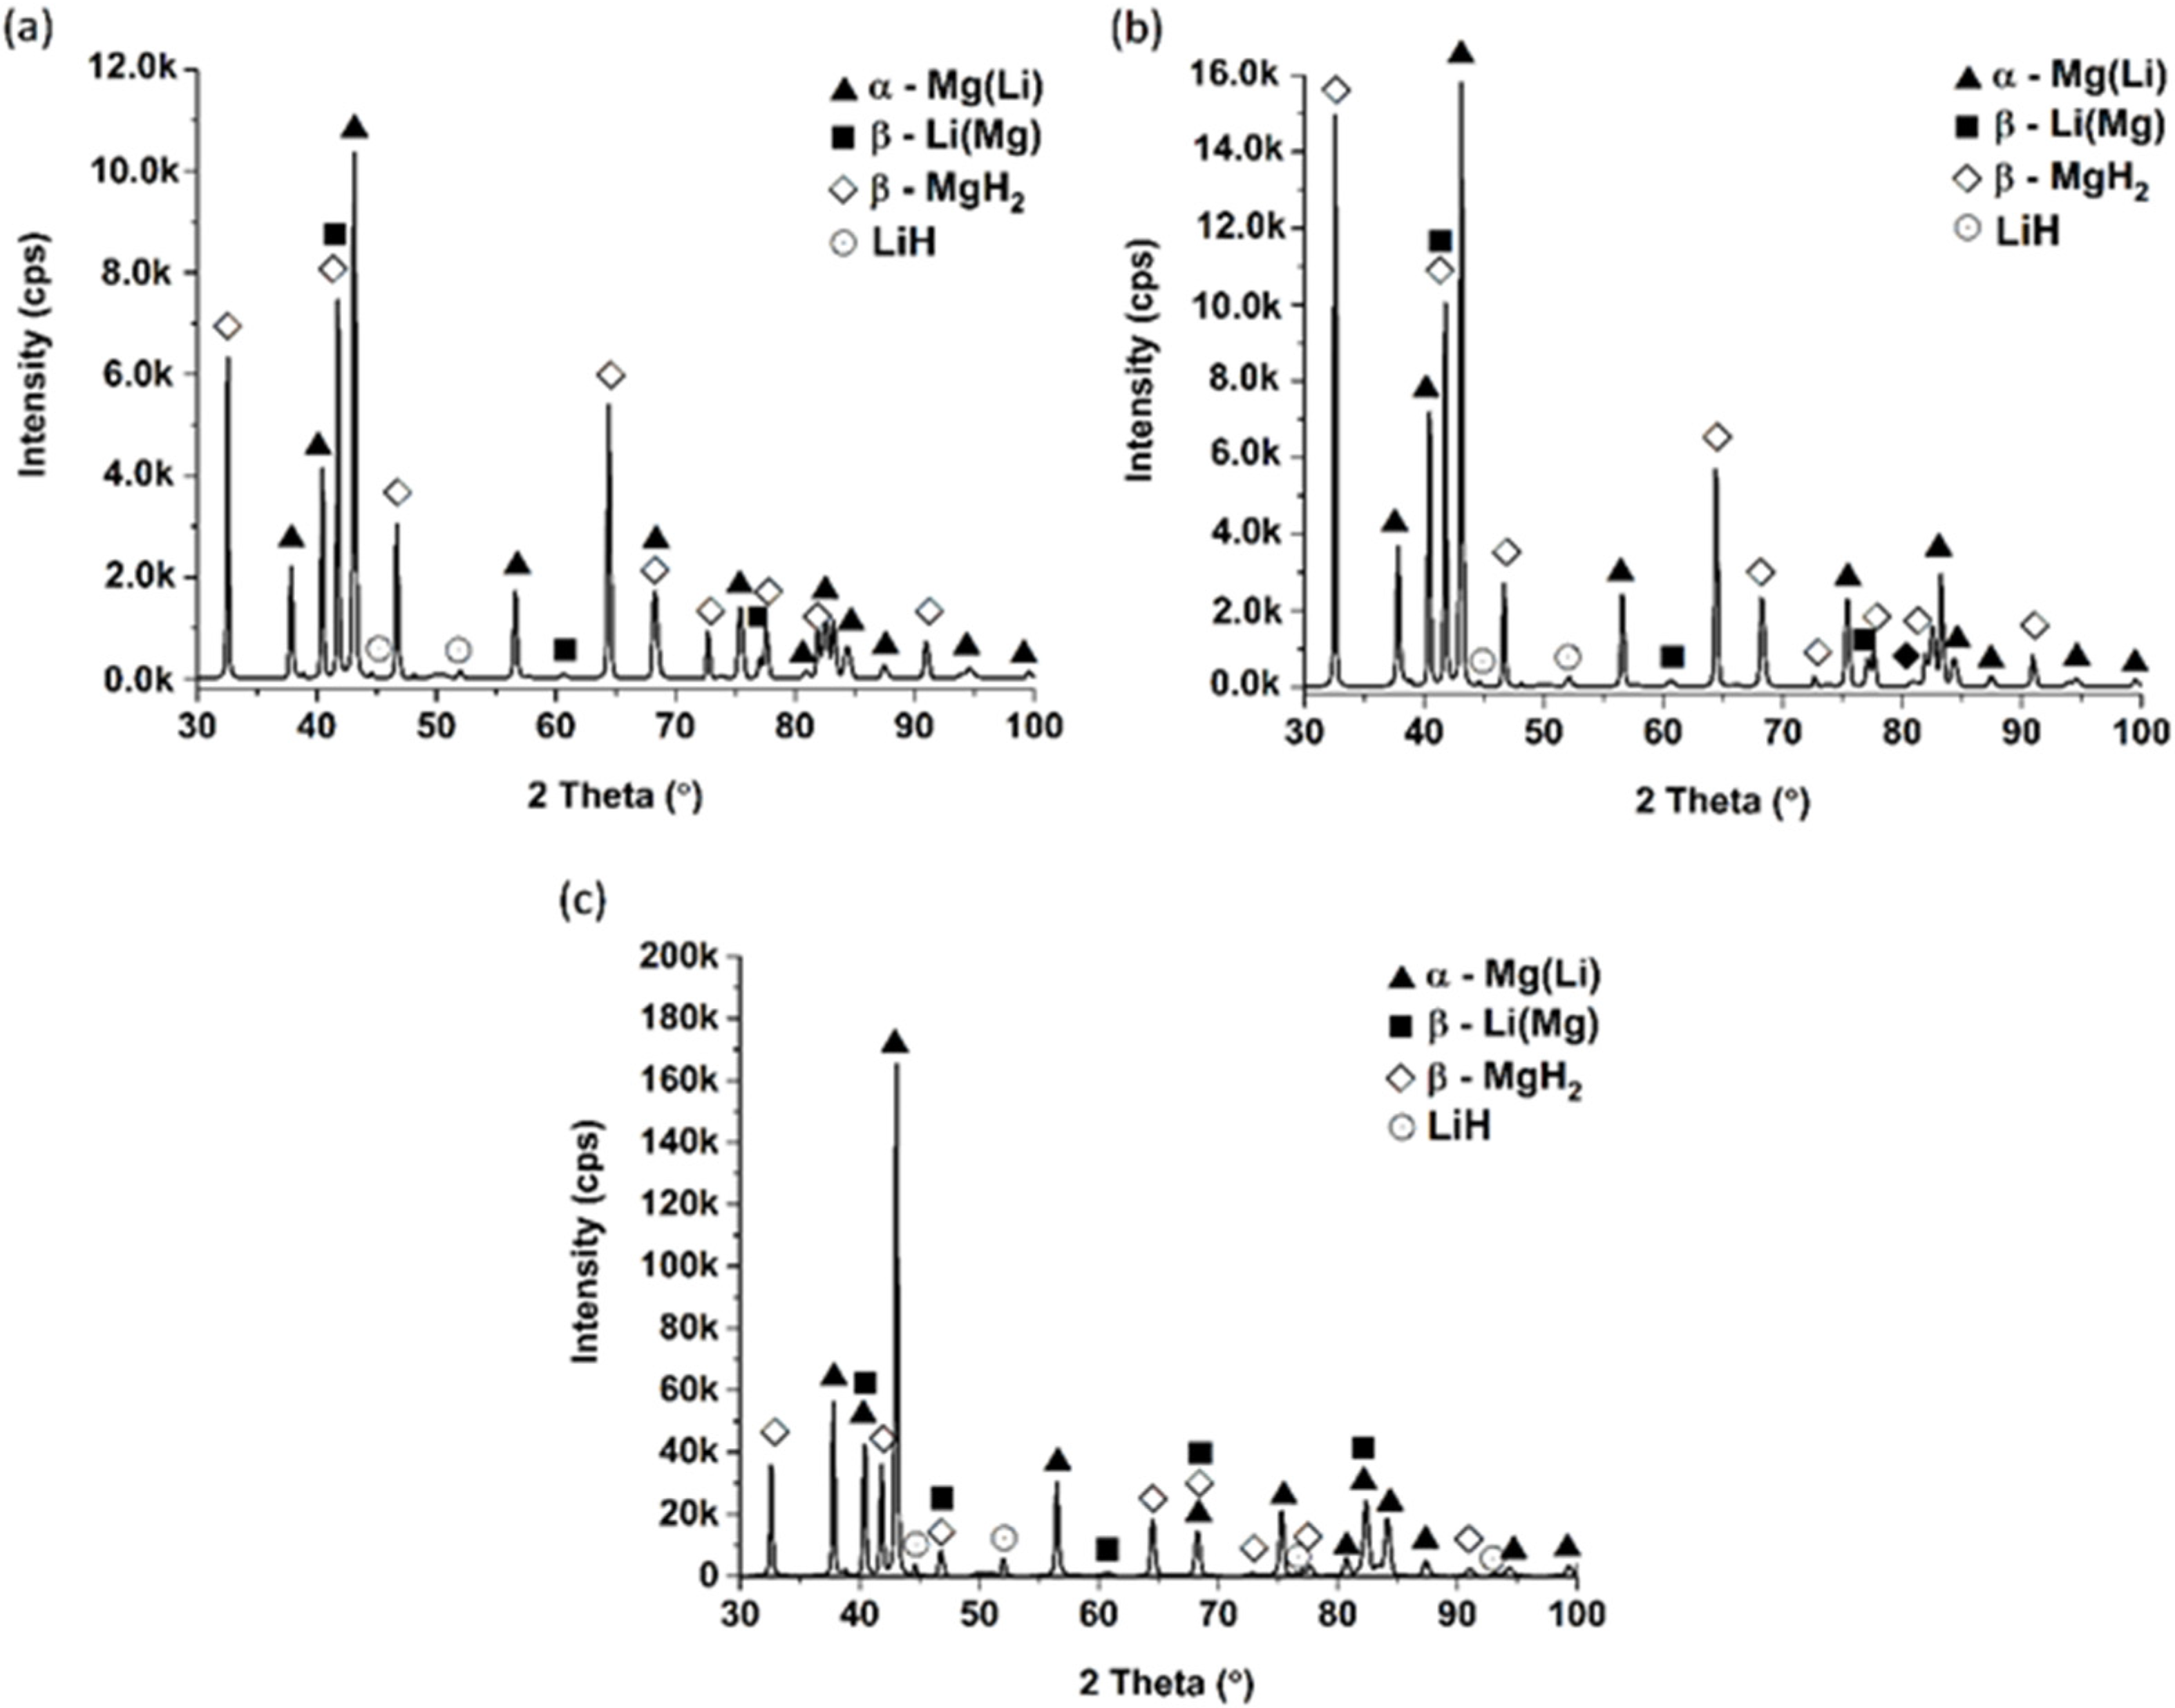
Considering that magnesium in Mg-Li alloys can exist in both ordered and disordered forms, its hydrogenating properties may vary. The XRD patterns of the Mg-Li alloys with various Li contents after the hydrogenation process are presented in Figure 4.
The XRD pattern of the hydrogenated alloy with a low Li content (4.0 wt.%), as shown in Figure 4a, is characterized by the presence of peaks originating from tetragonal β-MgH2 (01-076-9046) and LiH (04-016-1441) hydrides, as well as both α-Mg(Li) and β-Li(Mg) solid solutions. While the presence of unreacted α-Mg(Li) seemed natural, the appearance of peaks originating from the β-Li(Mg) phase was somewhat surprising. The hydrogenation rate of the crystalline Mg was much higher than for the small amount of Li present in the disordered solid solution, and hence peaks originating from the β-Li(Mg) phase appeared due to Mg dealloying. The susceptibility of Mg alloys to selective corrosion is a well-known phenomenon [39], hence the possibility of local Mg loss during hydrogenation, which caused the chemical composition to shift towards the eutectic composition.
The XRD pattern for hydrogenated AZ31 alloy modified by 7.5 wt.% Li is characterized by the presence of peaks originating from magnesium and lithium hydride, as well as unreacted phases observed in the alloys before hydrogenation (Figure 4b).
In the case of the AZ31 alloy modified by 15.0 wt.% Li (Figure 4c), the hydrogenated material was characterized by the presence of MgH2 and LiH hydrides as well as both α-Mg(Li) and β-Li(Mg) solid solutions. In contrast to the behavior of the alloy with a lower lithium content, we observed an increased ability to form lithium hydride, and hence, the α-Mg(Li) phase was locally formed [40].
The obtained X-ray results indicate a lack of complete hydrogenation, which may be due to the coarse-grained structure of the hydrogenated material [41]. Because the temperature of lithium hydride decomposition is too high from an application point of view, we focused on the properties of only the magnesium hydride.
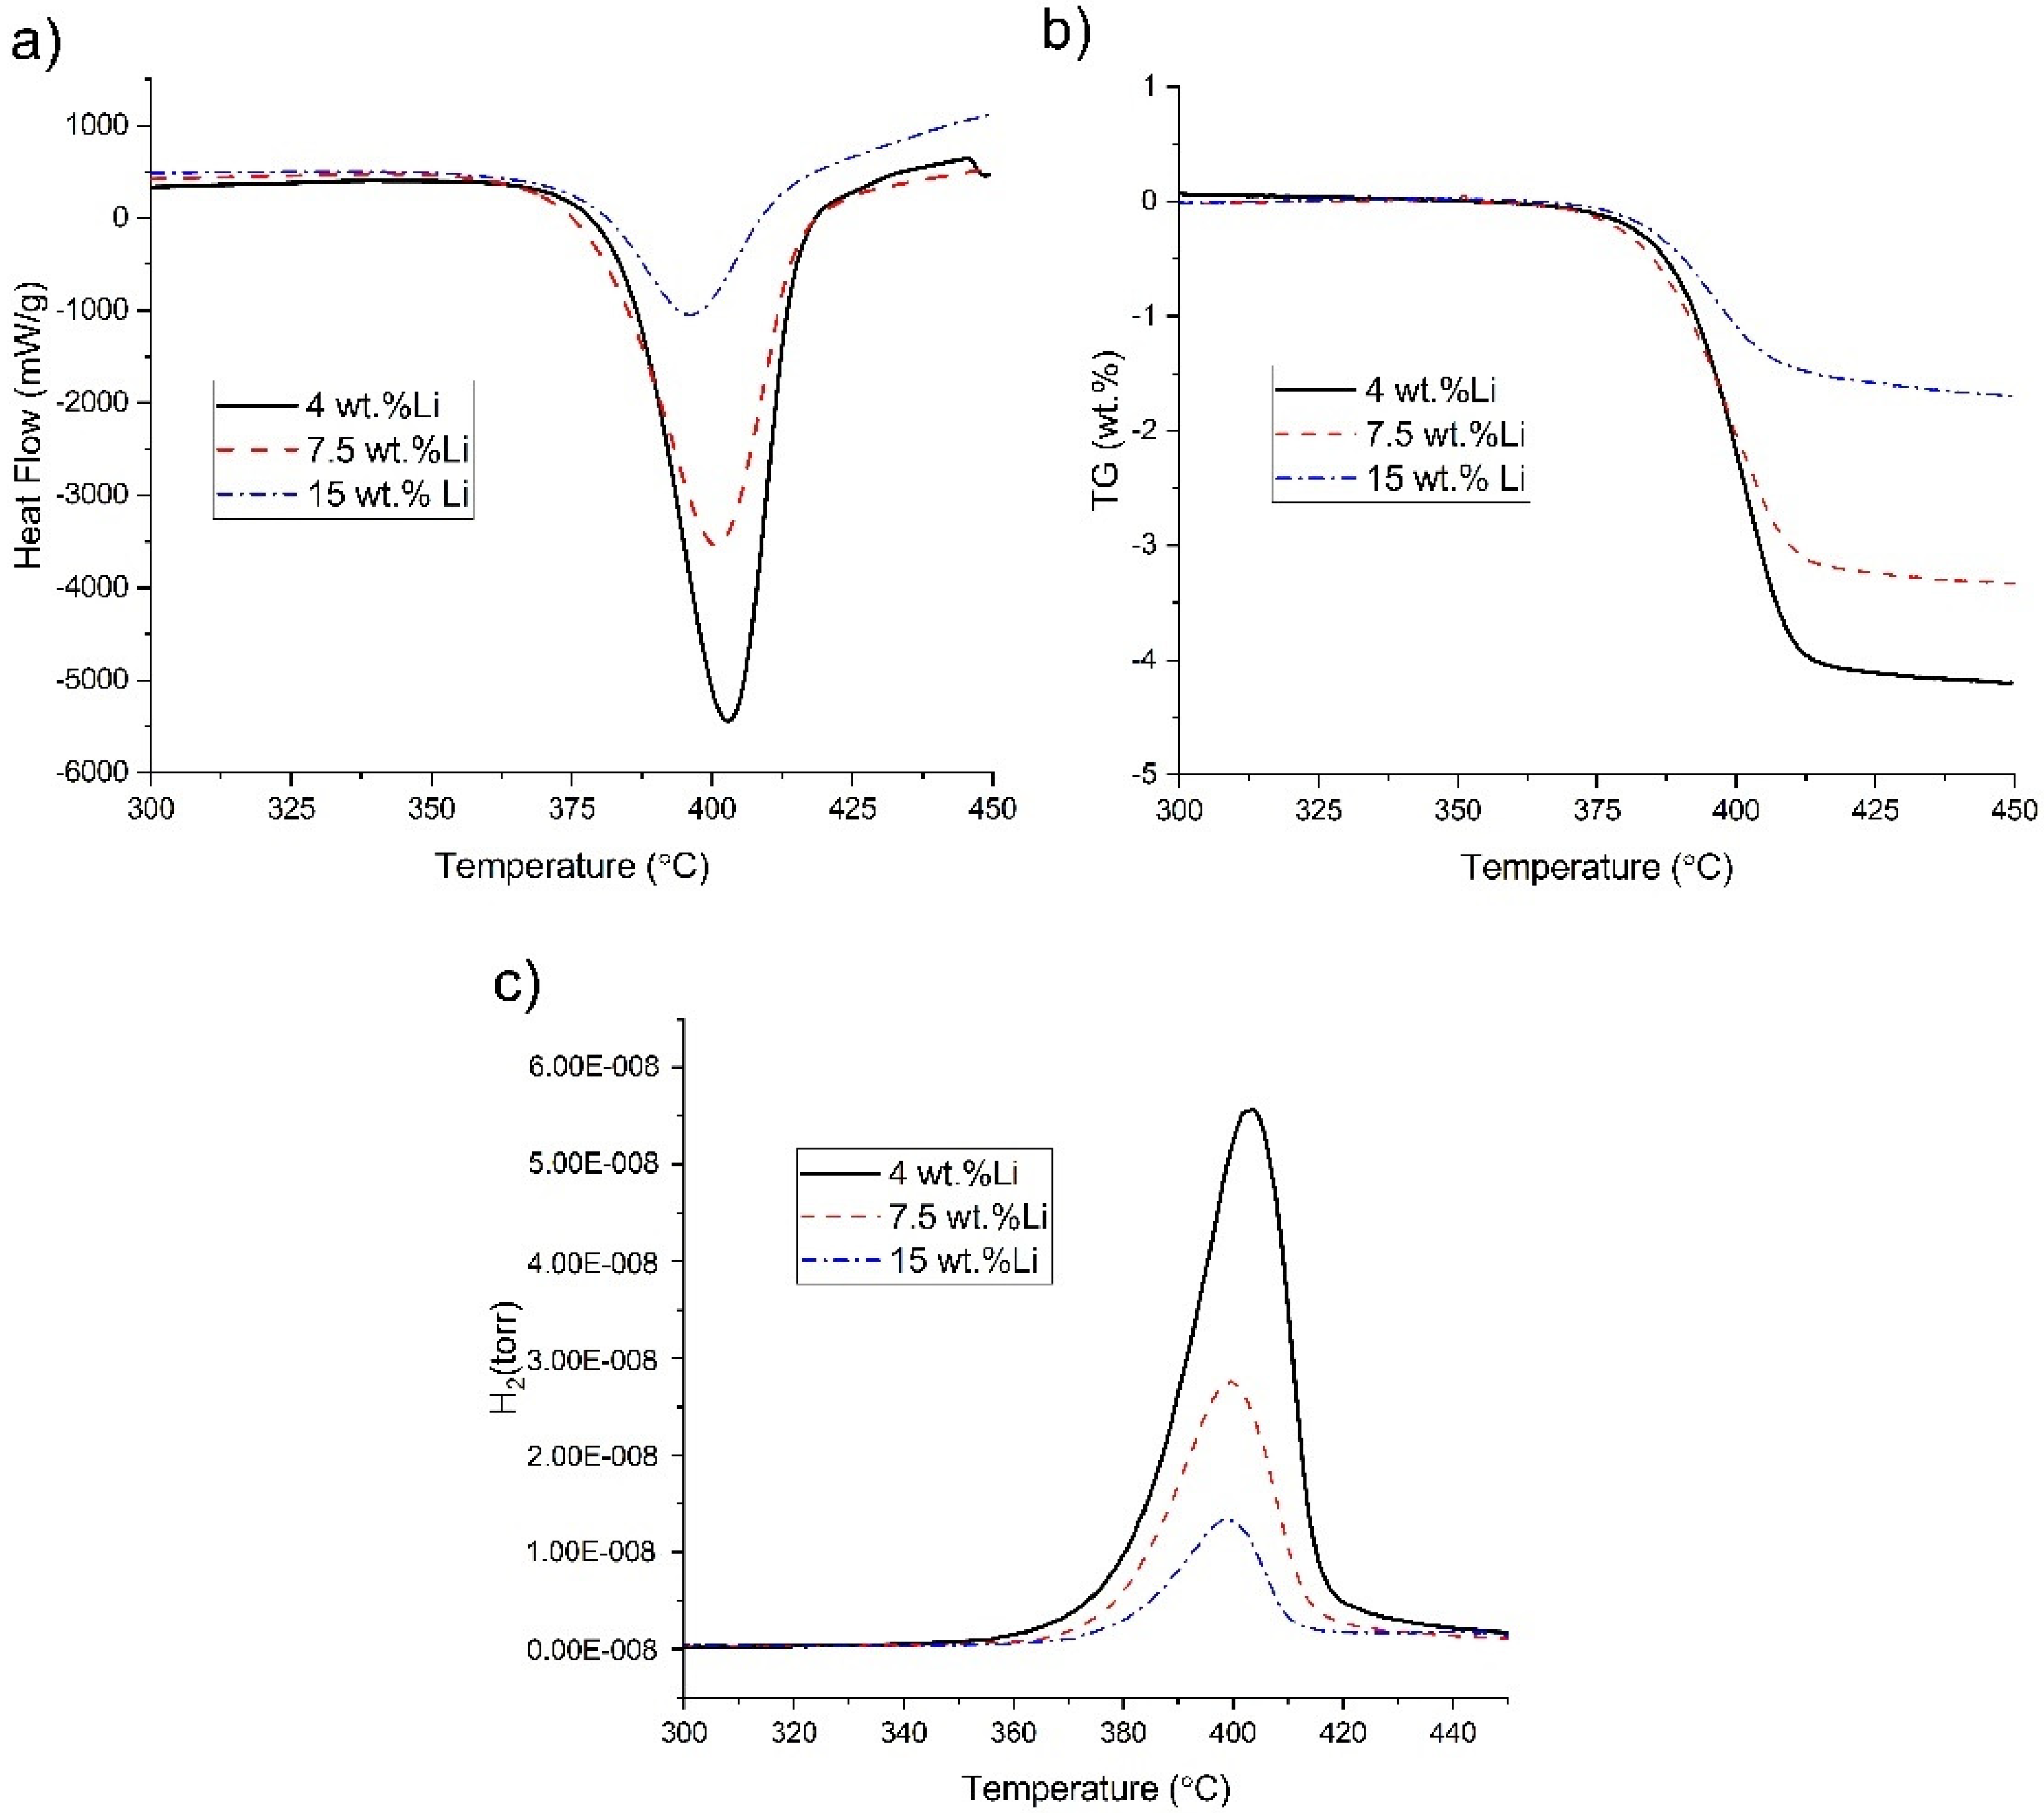
The decomposition temperature and hydrogen capacity obtained from the DSC-MS (differential scanning calorimetry and mass spectroscopy) (Figure 5a,c) and TGA (Figure 5b) measurements, respectively, show a decrease in the decomposition temperature and hydrogen capacity with an increase in the lithium content in the modified AZ31 alloy.
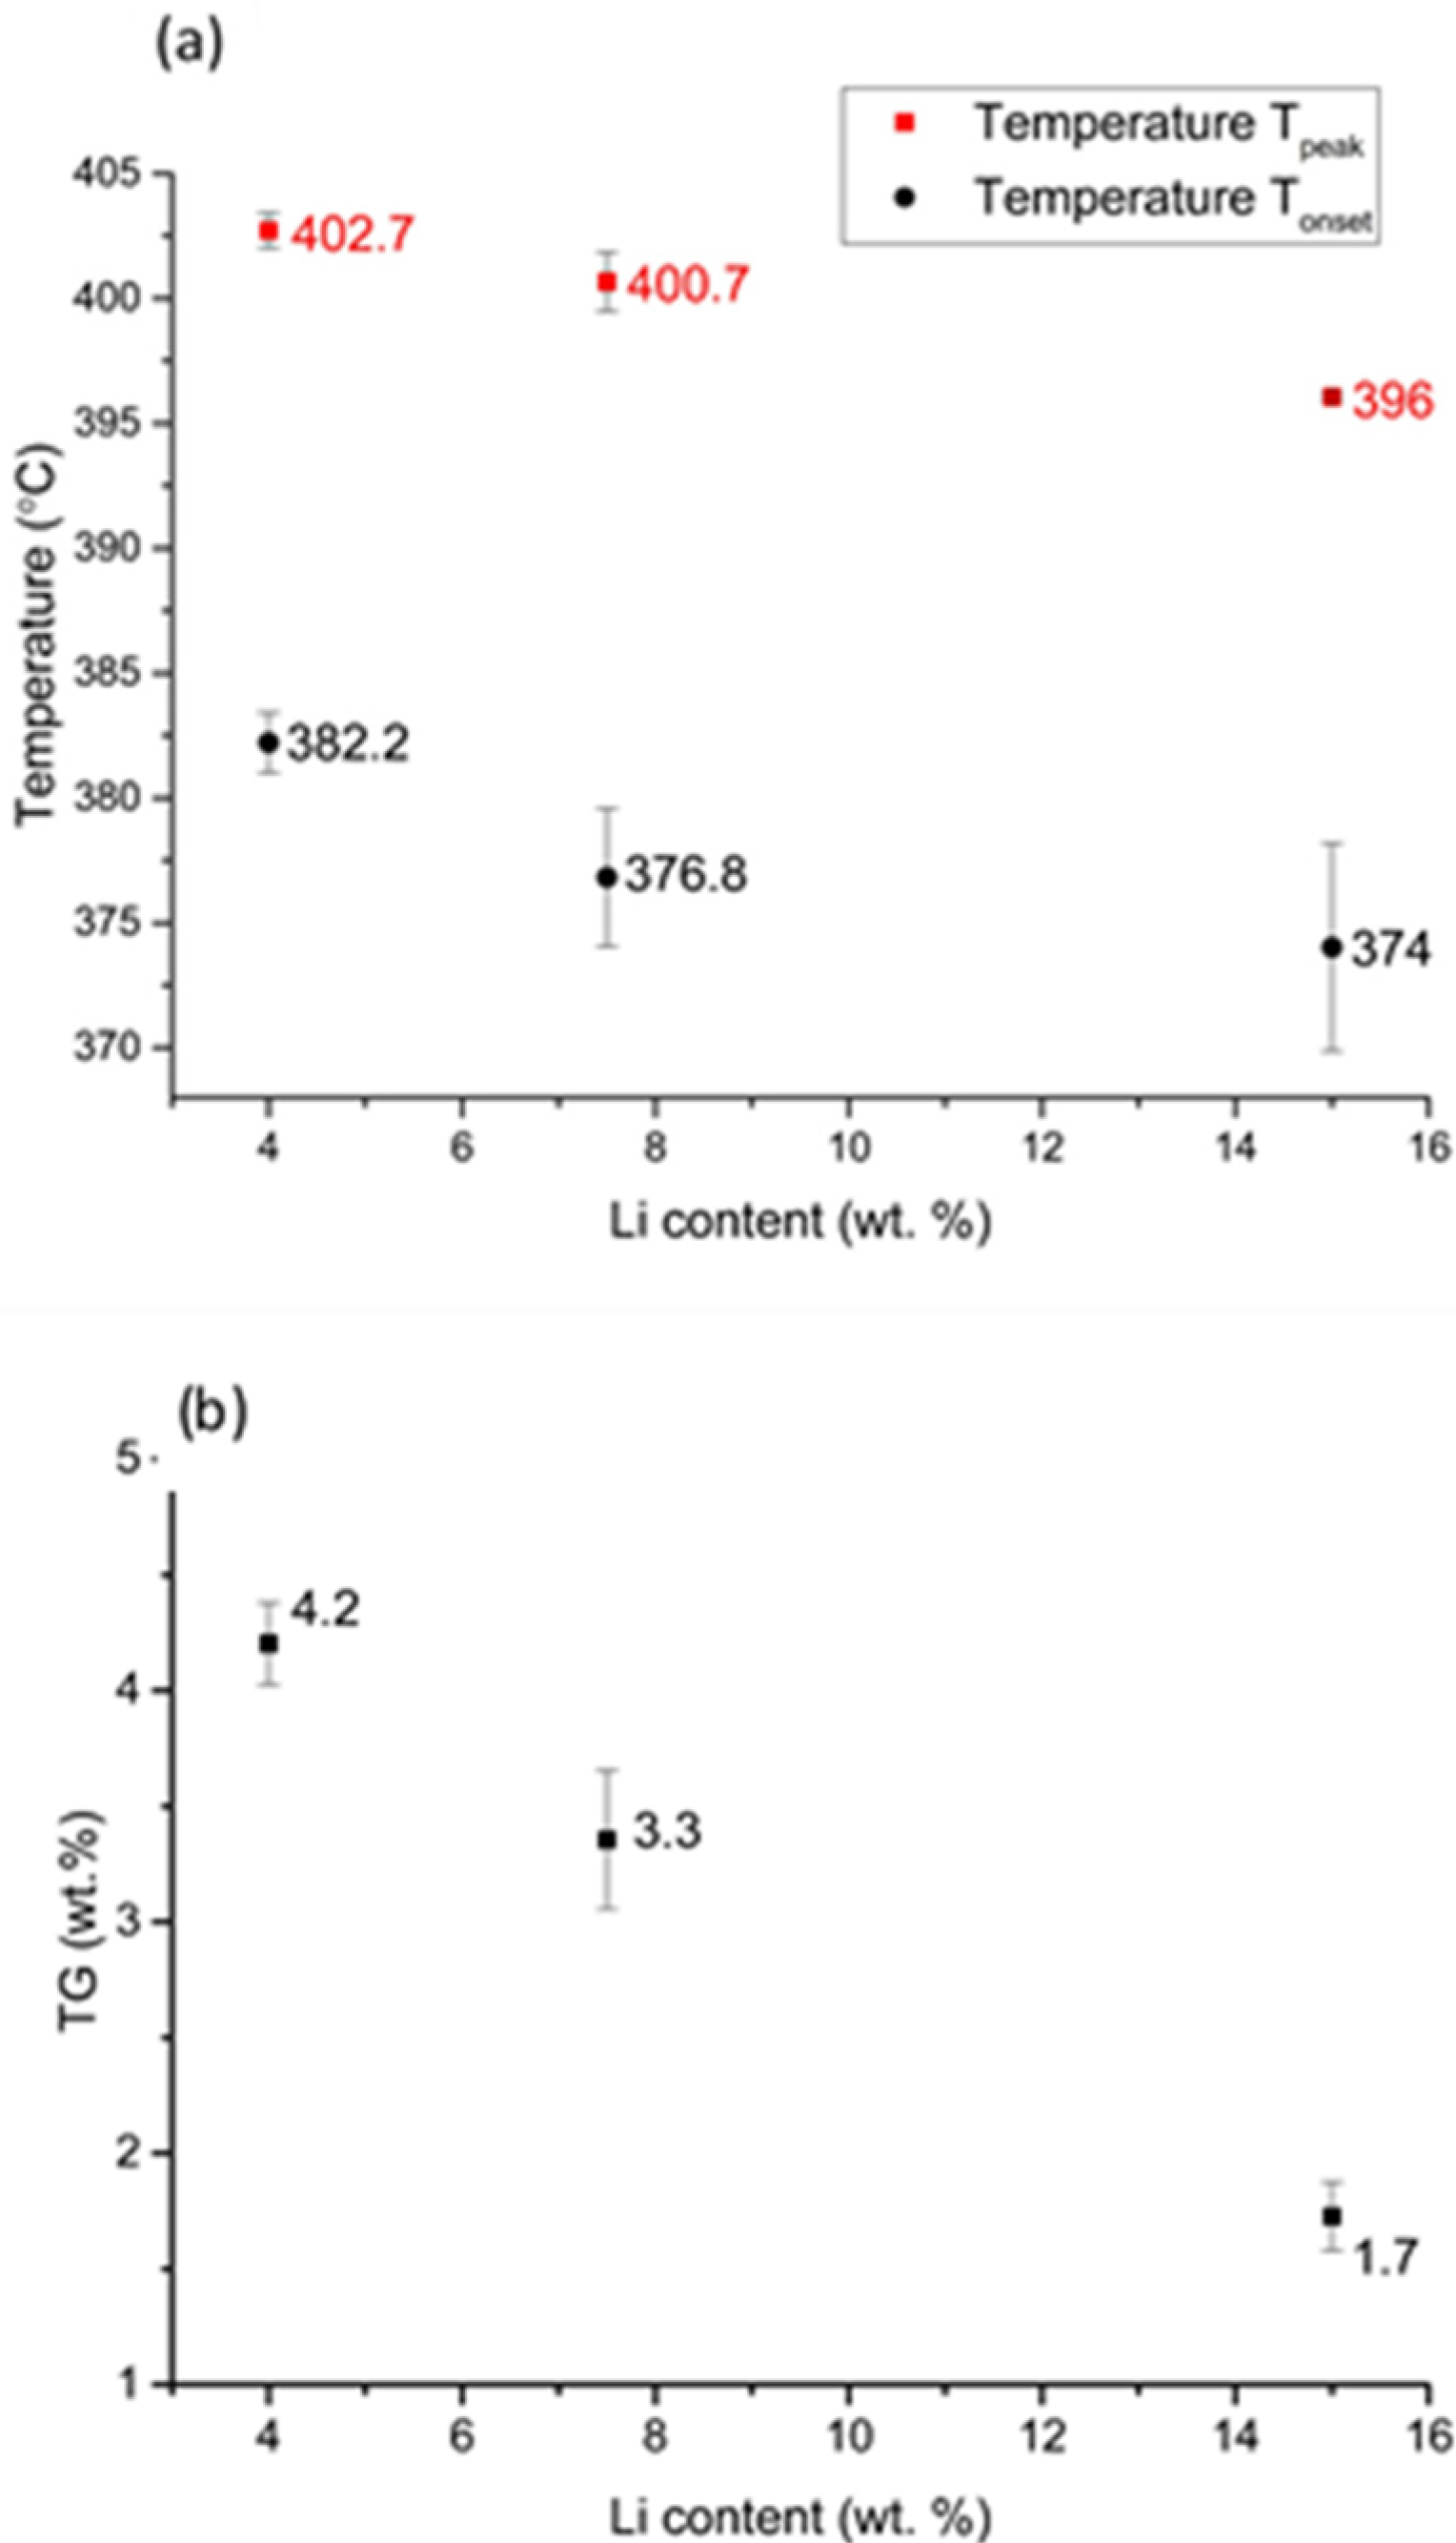
A quantitative analysis of the obtained results is presented in Figure 6. The DSC onset and peak temperature slightly decreased with increasing lithium content. The obtained decomposition temperature (at this heating rate) in the range from 402.7 °C to 396.0 °C is typical for noncatalyzed coarse MgH2 powder synthesized from magnesium [42]; however, it is slightly lower than that for commercially available hydride (usually approximately 420–425 °C at 5 °C/min). This means that the presence of lithium in Mg-Li alloys did not have a significant effect on the MgH2 decomposition temperature, and lithium did not play a catalytic role in this alloy.
The hydrogen capacity dramatically decreased as the lithium content increased, and it could be assumed that this was due to a relative decrease in the magnesium content in the alloy. However, the analysis of the hydrogen capacity values obtained for alloys with different lithium contents in relation to the theoretical capacity of these alloys indicated that the hydrogenation reaction yield varied depending on the chemical composition of the alloy (Table 2).
It is clearly visible that an increase in the lithium content in Mg-Li alloys caused a significant decrease in the efficiency of the magnesium hydrogenation. Marginally, the increase was also associated with the formation of lithium hydride, and part of the hydrogen was involved in the formation of not magnesium hydride but lithium hydride. Due to the DSC analysis method used, it is impossible to determine the hydrogen capacity in lithium hydride, and the temperature used during the test was too low, taking into account the decomposition temperature of LiH—near 700 °C [43]. The use of such low temperatures is justified because the temperature is associated with the evaporation of magnesium, which may have contaminated the analyzer components at high temperatures. However, it had a slight effect on the total hydrogen capacity in the system. The analysis of the obtained Mg hydrogenation yield in the context of the beta phase fraction (Figure 1) indicated that the hydrogenation properties of the α-Mg(Li) and β-Li(Mg) solid solutions were different. Because Mg is an ordered matrix structure and had the form of an unordered solution material, its hydrogenation properties may vary.
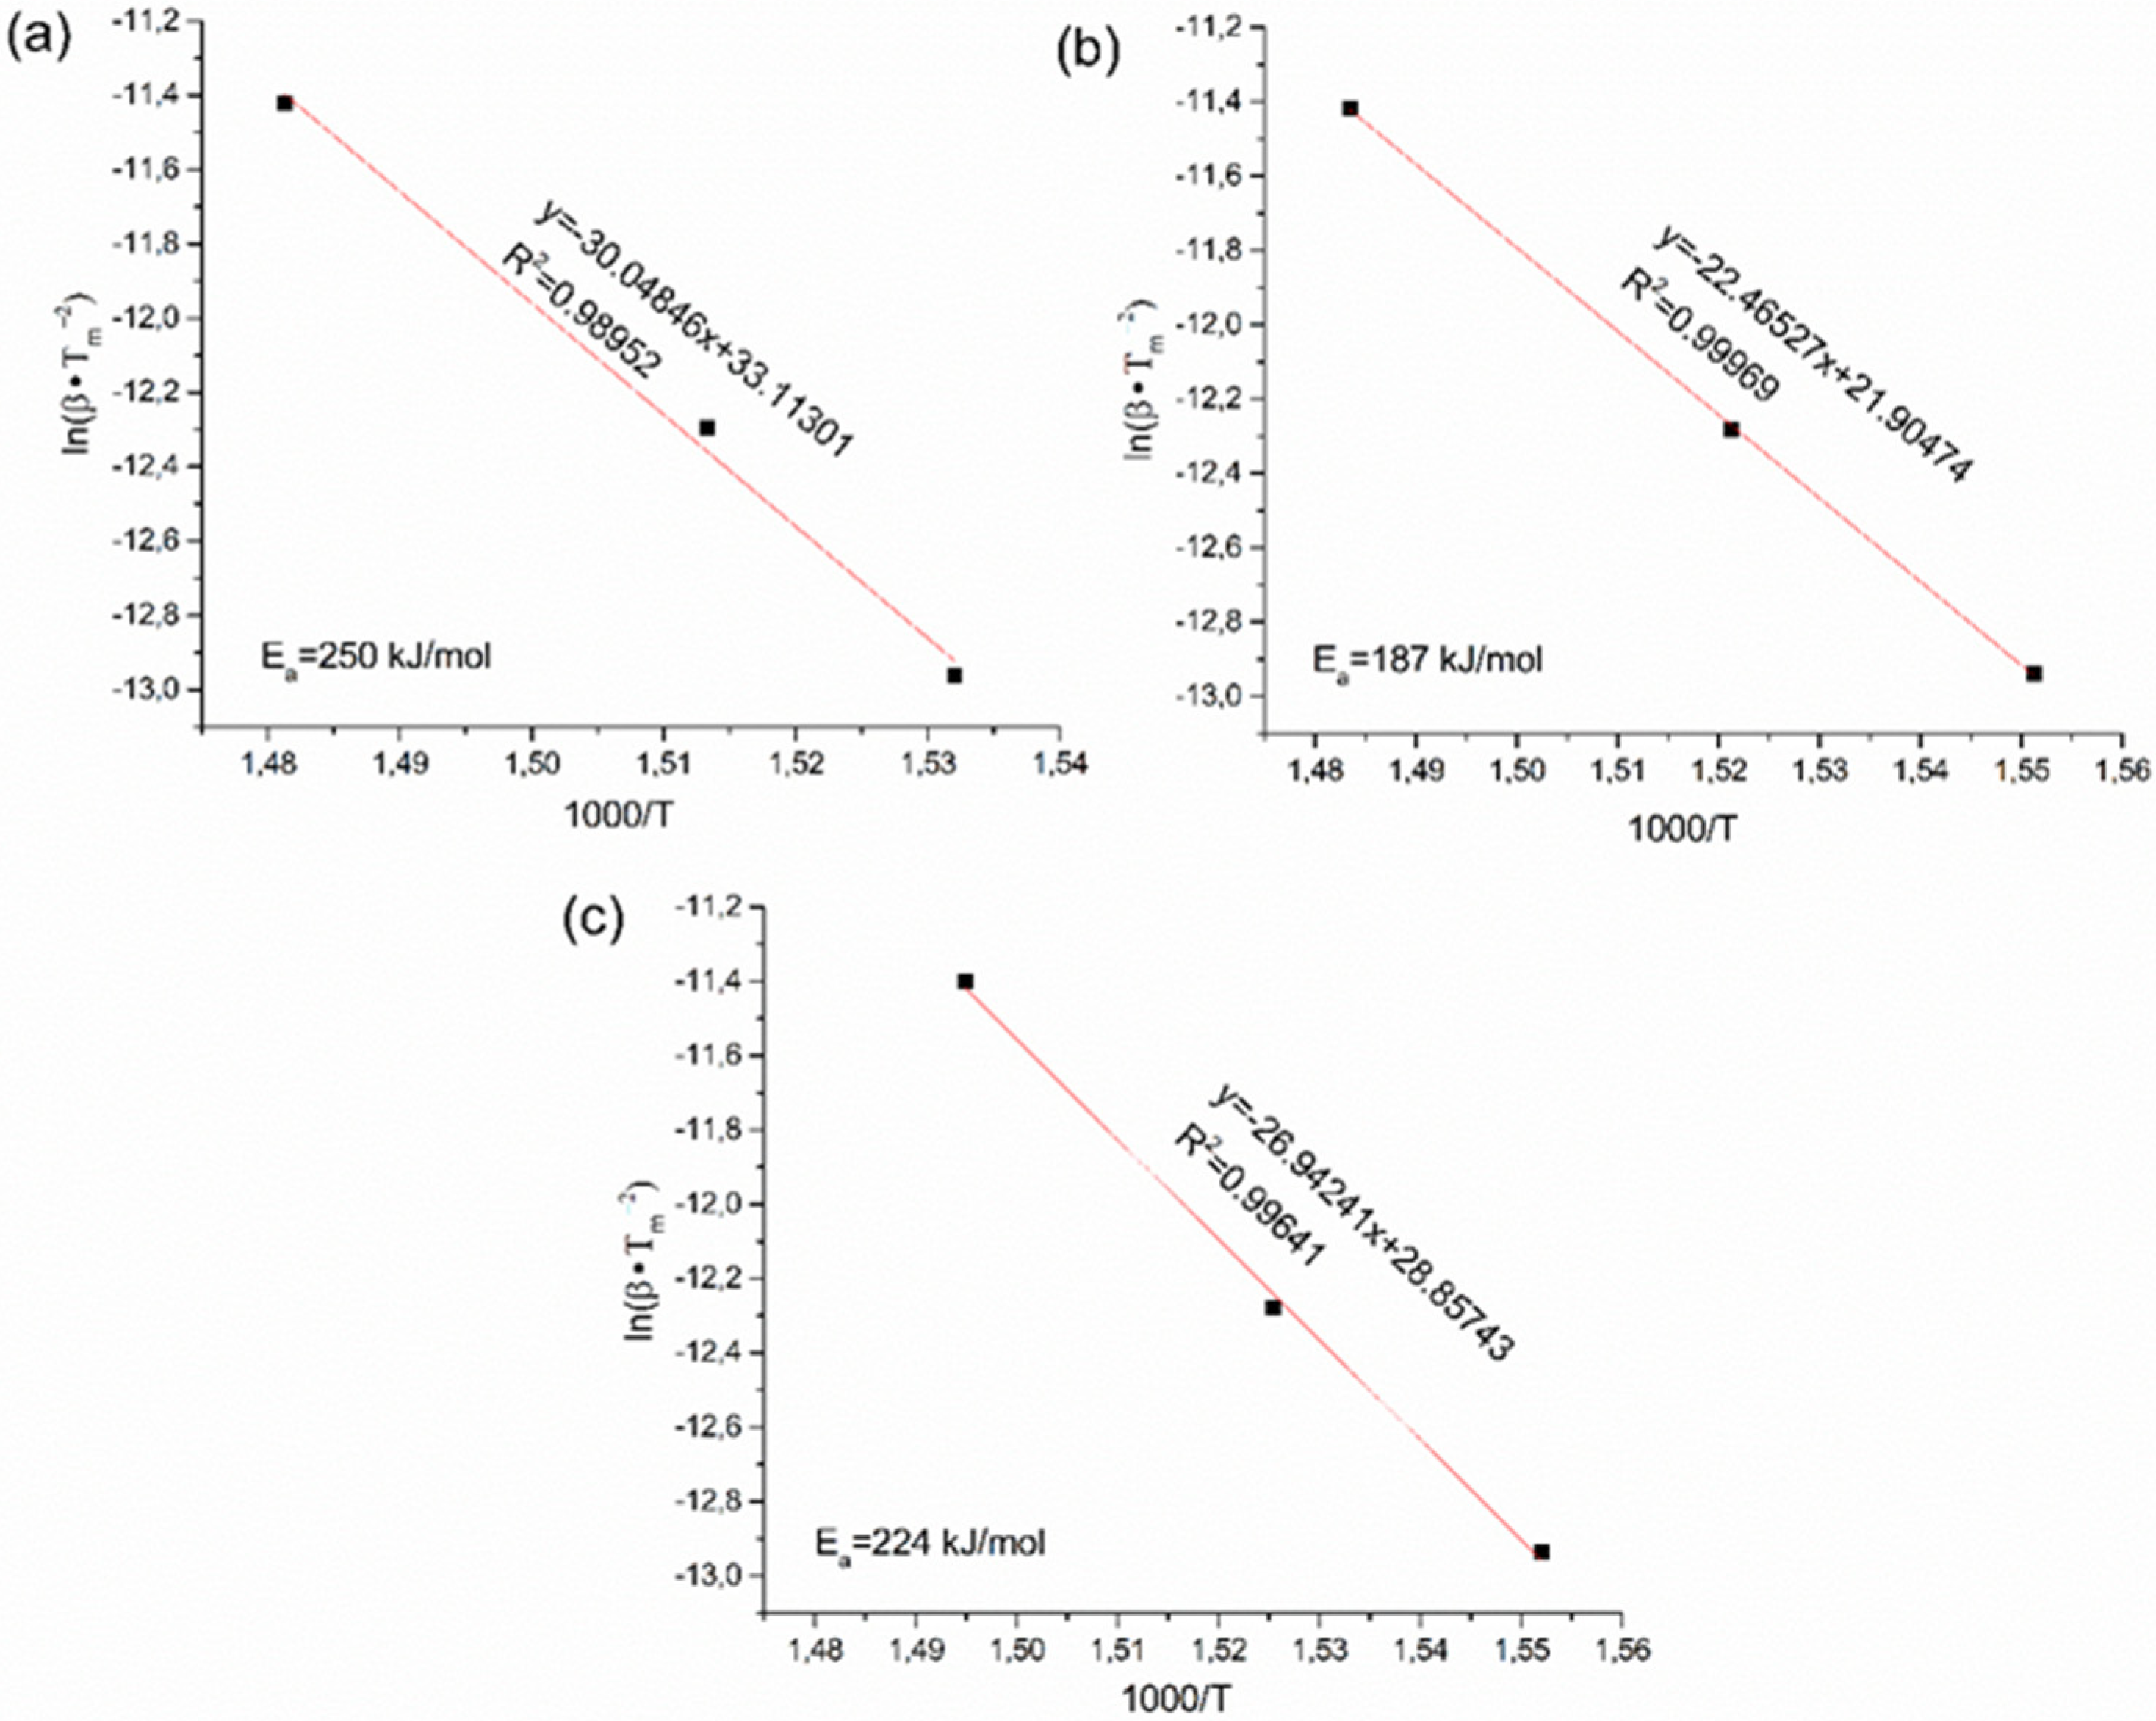
The kinetic properties of magnesium hydride formed after hydrogenation of the AZ31 alloy modified with 4.0 wt.%, 7.5 wt.% and 15.0 wt.% lithium were evaluated by measuring the energy of activation for the MgH2 decomposition process (Figure 7).
The obtained activation energies were in the range between 187 kJ/mol (AZ31 with 7.5 wt.% Li) and 250 kJ/mol (AZ31 with 4.0 wt.% Li). Magnesium hydride with a morphology similar to that presented in this paper is usually characterized by an activation energy from 120 to 160 kJ/mol [44]. Although pure materials were used for the tests and all manual operations were carried out in a protective atmosphere, such a high energy of activation is typical for hydrolyzed MgH2 in an argon atmosphere. Varin at al. reported such high activation energy values, ~217 kJ/mol for the as-received MgH2, which reduced to about ~140 kJ/mol after 25 h of milling, and then slight increased with milling time up to 100 h. According to Varin et al., milling contaminated MgH2 (whose powder particles are covered with a Mg(OH)2 layer) in H2 can be more beneficial than milling/grinding under Ar, as the activation energy for desorption decreases quickly [45].

4. Conclusions

It was observed that, along with an increase in lithium content, the grinding conditions changed, which affected the morphology and particle size of the tested powders. The hydrogenation of magnesium in the form of α-Mg(Li) was definitely higher than the ability of magnesium to occupy a disordered position in β-Li(Mg) solid solutions. Magnesium hydride obtained as a result of the hydrogenation of the AZ31 alloy modified with lithium (4.0 wt.%, 7.5 wt.% and 15.0 wt.%) was characterized by a high hydrogen desorption activation energy.

Author Contributions

Conceptualization, M.P. (Magda Pęska), T.C and M.P. (Marek Polański); methodology, M.P. (Magda Pęska); validation, M.P. (Marek Polański); formal analysis, T.C.; investigation, M.P. (Marek Polański); writing—original draft preparation, M.P. (Magda Pęska); writing—review and editing, T.C.; visualization, M.P. (Magda Pęska); and supervision, T.C. and M.P. (Marek Polański). All authors have read and agreed to the published version of the manuscript.

Funding

This research was funded by the statutory sources of the Department of Functional Materials and Hydrogen Technologies, Military University of Technology. Additional support provided by grant no. UMO-2018/29/B/ST8/01979 (National Science Center, Poland) is greatly appreciated.

Acknowledgments

The authors are grateful to J. Mizera and Anna Dobkowska for providing materials used for experiments.

Conflicts of Interest

The authors declare no conflicts of interest.

References

  1. Vajeeston, P.; Ravindran, P.; Fjellvåg, H. Predicting New Materials for Hydrogen Storage Application. Materials 2009, 2, 2296–2318. [Google Scholar] [CrossRef] [Green Version]
  2. Zhu, M.; Lu, Y.; Ouyang, L.; Wang, H. Thermodynamic Tuning of Mg-Based Hydrogen Storage Alloys: A Review. Materials 2013, 6, 4654–4674. [Google Scholar] [CrossRef] [Green Version]
  3. Rivard, E.; Trudeau, M.; Zaghib, K. Hydrogen Storage for Mobility: A Review. Materials 2019, 12, 1973. [Google Scholar] [CrossRef] [Green Version]
  4. Li, H.-W.; Yan, Y.; Orimo, S.-I.; Züttel, A.; Jensen, C.M. Recent Progress in Metal Borohydrides for Hydrogen Storage. Energies 2011, 4, 185–214. [Google Scholar] [CrossRef]
  5. Møller, K.; Sheppard, D.; Ravnsbæk, D.; Buckley, C.; Akiba, E.; Li, H.-W.; Jensen, T. Complex Metal Hydrides for Hydrogen, Thermal and Electrochemical Energy Storage. Energies 2017, 10, 1645. [Google Scholar] [CrossRef] [Green Version]
  6. Xueping, Z.; Jiaojiao, Z.; Shenglin, L.; Xuanhui, Q.; Ping, L.; Yanbei, G.; Weihua, L. A new solid material for hydrogen storage. Int. J. Hydrogen Energy 2015, 40, 10502–10507. [Google Scholar] [CrossRef]
  7. Hardy, B.; Tamburello, D.; Corgnal, C. Hydrogen storage adsorbent systems acceptability Envelope. Int. J. Hydrogen Energy 2018, 43, 19528–19539. [Google Scholar] [CrossRef]
  8. Gao, S.; Liu, H.; Xu, L.; Li, S.; Wang, X.; Yan, M. Hydrogen storage properties of nano-CoB/CNTs catalyzed MgH2. J. Alloys Compd. 2018, 735, 642. [Google Scholar] [CrossRef]
  9. Momirlan, M.; Veziroglu, T.N. Current status of hydrogen energy. Renew. Sustain. Energy Rev. 2002, 6, 141–179. [Google Scholar] [CrossRef]
  10. Stavila, V.; Klebanoff, L. Metal Hydrides. In Fuel Cells: Data, Facts And Figures; Stolten, D., Samsun, R.C., Garland, N., Eds.; Wiley-VCH: Weinheim, Germany, 2016; Volume 16, pp. 149–161. [Google Scholar]
  11. Gosselin, C.; Huot, J. Hydrogenation Properties of TiFe Doped with Zirconium. Materials 2015, 8, 7864–7872. [Google Scholar] [CrossRef] [PubMed] [Green Version]
  12. Gosselin, C.; Santos, D.; Huot, J. First hydrogenation enhancement in TiFe alloys for hydrogen storage. J. Phys. D Appl. Phys. 2017, 50. [Google Scholar] [CrossRef]
  13. Gosselin, C.; Huot, J. First Hydrogenation Enhancement in TiFe Alloys for Hydrogen Storage Doped with Yttrium. Metals 2019, 9, 242. [Google Scholar] [CrossRef] [Green Version]
  14. Manna, J.; Tougas, B.; Huot, J. First hydrogenation kinetics of Zr and Mn doped TiFe alloy after air exposure and reactivation by mechanical treatment. Int. J. Hydrogen Energy 2020. [Google Scholar] [CrossRef]
  15. Reilly, J.J.; Wiswall, R.H. Formation and properties of iron titanium hydride. Inorg. Chem. 1974, 13, 218–222. [Google Scholar] [CrossRef]
  16. Akiba, E.; Ibab, H. Hydrogen absorption by Laves phase related BCC solid solution. Intermetollics 1998, 6, 461–470. [Google Scholar] [CrossRef]
  17. Kumar, S.; Kojima, Y.; Kumar Dey, G. Thermodynamics and kinetics of hydrogen absorption–desorption of highly crystalline LaNi5. J. Therm. Anal. Calorim. 2018, 134, 889–894. [Google Scholar] [CrossRef]
  18. Pęska, M.; Dworecka-Wójcik, J.; Płociński, T.; Polański, M. The Influence of Cerium on the Hydrogen Storage Properties of La1-xCexNi5 Alloys. Energies 2020, 13, 1437. [Google Scholar] [CrossRef] [Green Version]
  19. Cheng, L.; Zhou, H.; Xiong, J.; Pan, S.; Luo, J. Microstructure, electromagnetic and microwave absorbing properties of plate-like LaCeNi powder. J. Mater. Sci. Mater. Electron. 2018, 29, 18030–18035. [Google Scholar] [CrossRef]
  20. An, X.H.; Gu, Q.F.; Zhang, J.Y.; Chen, S.L.; Yu, X.B.; Li, Q. Experimental investigation and thermodynamic reassessment of La–Ni and LaNi5–H systems. Calphad 2013, 40, 48–55. [Google Scholar] [CrossRef]
  21. Ngameni, R.; Mbemba, N.; Grigoriev, S.A.; Millet, P. Comparative analysis of the hydriding kinetics of LaNi5, La0.8Nd0.2Ni5 and La0.7Ce0.3Ni5 compounds. Int. J. Hydrogen Energy 2011, 36, 4178–4184. [Google Scholar] [CrossRef]
  22. Singh, S.K.; Singh, A.K.; Ramakrishna, K.; Srivastava, O.N. Investigations on the structural and hydrogenation characteristics of LaNi5, HoNi5, GdNi5, SmNi5, MmNi5, and CFMmNi4.5Al0.5 thin films. Int. J. Hydrogen Energy 1985, 10, 523–529. [Google Scholar] [CrossRef]
  23. Bouhadda, Y.; Djellab, S.; Bououdina, M.; Fenineche, N.; Boudouma, Y. Structural and elastic properties of LiBH4 for hydrogen storage applications. J. Alloys Compd. 2012, 534, 20–24. [Google Scholar] [CrossRef]
  24. Xu, J.; Meng, R.; Cao, J.; Gu, X.; Song, W.-L.; Wang, W.; Chen, Z. Graphene-supported Pd catalysts for reversible hydrogen storage in LiBH4. J. Alloys Compd. 2013, 564, 84–90. [Google Scholar] [CrossRef]
  25. Suarez-Alcantara, K.; Tena-Garcia, J.R.; Guerrero-Ortiz, R. Alanates, a Comprehensive Review. Materials 2019, 12, 2724. [Google Scholar] [CrossRef] [Green Version]
  26. Jepsen, L.H.; Ravnsbæk, D.B.; Grundlach, C.; Besenbacher, F.; Skibstede, J.; Jensen, T.R. A novel intermediate in the LiAlH4–LiNH2 hydrogen storage system. Dalton Trans 2014, 43, 3095–3103. [Google Scholar] [CrossRef] [PubMed]
  27. Cabo, M.S.; Garroni, S.; Pellicer, E.; Milanese, C.; Girella, A.; Marini, A.; Rossinyol, E.; Suriñach, S.; Baro, M.D. Hydrogen sorption performance of MgH2 doped with mesoporous nickel- and cobalt-based oxides. Int. J. Hydrogen Energy 2011, 36, 5400–5410. [Google Scholar] [CrossRef]
  28. Charbonnier, J.; de Rangoa, P.; Fruchart, D.; Miragliaa, S.; Pontonnier, L.; Rivoirard, S.; Skryabina, N.; Vulliet, P. Hydrogenation of transition element additives (Ti, V) during ball milling of magnesium hydride. J. Alloys Compd. 2004, 383, 205–208. [Google Scholar] [CrossRef]
  29. Li, Y.; Hu, F.; Luo, L.; Xu, J.; Zhao, Z.; Zhang, Y.; Zhao, D. Hydrogen storage of casting MgTiNi alloys. Catal. Today 2018, 318, 103–106. [Google Scholar] [CrossRef]
  30. Witek, K.; Karczewski, K.; Karpowicz, M.; Polanski, M. Mg2FeH6 Synthesis Efficiency Map. Crystals 2018, 8, 94. [Google Scholar] [CrossRef] [Green Version]
  31. Varin, R.A.; Czujko, T.; Wronski, Z.S. Thermal stability of Vale Inco nanonometric nickel as a catalytic additive for magnesium hydride (MgH2). Int. J. Hydrogen Energy 2009, 34, 8603–8610. [Google Scholar] [CrossRef]
  32. Okamoto, H.; Schlesinger, M.E. Li (Lithium) Binary Alloy Phase Diagrams. In ASM Handbook Volume 3: Alloy Phase Diagrams; ASM International: Materials Park, OH, USA, 1992. [Google Scholar]
  33. Atkins, G.; Marya, M.; Olson, D.; Eliezer, D. Magnesium-Lithium Alloy Weldability: A Microstructural Characterization. Proc. TMS Miner. Metals Mater. Soc. 2004, 1, 37–41. [Google Scholar]
  34. Huajian, W.; Zhenzhen, S.; Jiaqi, D.; Hua, N.; Guangxu, L.; Wenlou, W.; Zhiqiang, L.; Jin, G. Catalytic effect of graphene on the hydrogen storage properties of Mg-Li alloy. Mater. Chem. Phys. 2018, 207, 221. [Google Scholar] [CrossRef]
  35. Wang, Y.; Zhou, Z.; Zhou, W.; Xu, L.; Guo, J.; Lan, Z. Effects of in-situ formed Mg2Si phase on the hydrogen storage properties of Mg-Li solid solution alloys. Mater. Des. 2016, 111, 248–252. [Google Scholar] [CrossRef]
  36. Ji, H.; Wu, G.; Liu, W.; Liang, X.; Liao, G.; Ding, D. Microstructure characterization and mechanical properties of the as-cast and as-extruded Mg-xLi-5Zn-0.5Er (x = 8, 10 and 12 wt%) alloys. Mater. Charact. 2020, 159, 110008. [Google Scholar] [CrossRef]
  37. Varin, R.A.; Czujko, T.; Mizera, J. The effect of MgNi2 intermetallic compound on nanostructurization and amorphization of Mg-Ni alloys processed by controlled mechanical milling. J. Alloys Compd. 2003, 354, 281–295. [Google Scholar] [CrossRef]
  38. Polanski, M.; Nawra, D.; Zasada, D. Mg2FeH6 synthesized from plain steel and magnesium hydride. J. Alloys Compd. 2019, 776, 1029–1040. [Google Scholar] [CrossRef]
  39. Li, Y.; Wei, Y.; Yang, S. De-alloying Behavior of Mg–Al alloy in Sulphuric Acid and Acetic Acid Aqueous Solutions. Materials 2019, 12, 2046. [Google Scholar] [CrossRef] [Green Version]
  40. Park, C.-M.; Kim, J.-H.; Kim, H.; Sohn, H.-J. Li-alloy based anode materials for Li secondary batteries. Chem. Soc. Rev. 2010, 39, 3115–3141. [Google Scholar] [CrossRef] [PubMed]
  41. Varin, R.A.; Czujko, T.; Chiu, C.; Wronski, Z. Particle size effects on the desorption properties of nanostructured magnesium dihydride (MgH2) synthesized by controlled reactive mechanical milling (CRMM). J. Alloys Compd. 2006, 424, 356–364. [Google Scholar] [CrossRef]
  42. Varin, R.A.; Czujko, T.; Chiu, C.; Pulz, R.; Wronski, Z.S. Synthesis of nanocomposite hydrides for solid-state hydrogen storage by controlled mechanical milling techniques. J. Alloys Compd. 2009, 483, 252–255. [Google Scholar] [CrossRef]
  43. Wang, L.; Quadir, M.Z.; Aguey-Zinsou, K.-F. Direct and reversible hydrogen storage of lithium hydride (LiH) nanoconfined in high surface area graphite. Int. J. Hydrogen Energy 2016, 41, 8088–18094. [Google Scholar] [CrossRef]
  44. Varin, R.A.; Czujko, T.; Wronski, Z.S. Hydrogen Storage Characteristics of Commercial Mg and MgH2. In Nanomaterials for Solid State Hydrogen Storage; Springer Science: New York, NY, USA, 2009; pp. 87–102. [Google Scholar]
  45. Varin, R.A.; Jang, M.; Czujko, T.; Wronski, Z.S. The effect of ball milling under hydrogen and argon on the desorption properties of MgH2 covered with a layer of Mg(OH)2. J. Alloys Compd. 2010, 493, L29–L32. [Google Scholar] [CrossRef]
Figure 1. Magnesium-lithium phase diagram (made on the basis of data contained in [32]).
Energies 13 02080 g001
Figure 2. XRD patterns for the AZ31 alloy modified by 4.0 wt.% Li (a), 7.5 wt.% Li (b) and 15.0 wt.% Li (c).
Energies 13 02080 g002
Figure 3. The morphology of chips obtained after machining the AZ31 alloy modified by 4.0 wt.% Li (a), 7.5 wt.% Li (b) and 15.0 wt.% Li (c), as well as ground and hydrogenated particles of AZ31 alloy modified by 4.0 wt.% Li (d), 7.5 wt.% Li (e) and 15.0 wt.% Li (f).
Energies 13 02080 g003
Figure 4. XRD pattern for the AZ31 alloy modified by 4.0 wt.% Li (a), 7.5 wt.% Li (b) and 15.0 wt.% Li (c) after hydrogenation.
Energies 13 02080 g004
Figure 5. DSC (a), TGA (b) and MS (c) curves for alloys with various Li contents.
Energies 13 02080 g005
Figure 6. The decomposition temperature (a) and hydrogen capacity (b) for hydrides obtained using alloys with various lithium contents.
Energies 13 02080 g006
Figure 7. The activation energy of hydrogen decomposition for the AZ31 alloy modified by 4.0 wt.% Li (a), 7.5 wt.% Li (b) and 15.0 wt.% Li (c).
Energies 13 02080 g007
Table 1. The particle size for powders with various lithium contents.
SampleAverage Particle Diameter from Volume-Weighted Size Distribution
Dv (µm)
Median Diameter
Dmed (µm)
Mg 4 wt.% Li23.571.1
Mg 7.5 wt.% Li37.086.3
Mg 15 wt.% Li40.474.3
Table 2. The hydrogenation properties of alloys with various lithium contents.
SampleTheoretical Hydrogen Capacity in MgH2 (wt.%)Measured Hydrogen Capacity in MgH2 (wt.%)Yield of Mg Hydrogenation Reaction (%)
Mg 4.0 wt.% Li7.34.257.5
Mg 7.5 wt.% Li7.03.347.1
Mg 15.0 wt.% Li6.51.726.2