Article

Classifying the Level of Energy-Environmental Efficiency Rating of Brazilian Ethanol

by
Nilsa Duarte da Silva Lima
,
Irenilza de Alencar Nääs
,
João Gilberto Mendes dos Reis
* and
Raquel Baracat Tosi Rodrigues da Silva
Postgraduate Program in Production Engineering, Universidade Paulista - UNIP, Dr. Bacelar Street 1212, 04026002 São Paulo, Brazil
*
Author to whom correspondence should be addressed.
Energies 2020, 13(8), 2067; https://doi.org/10.3390/en13082067
Submission received: 28 February 2020 / Revised: 31 March 2020 / Accepted: 14 April 2020 / Published: 21 April 2020
(This article belongs to the Special Issue Alternative Energy Sources)

Abstract

:
The present study aimed to assess and classify energy-environmental efficiency levels to reduce greenhouse gas emissions in the production, commercialization, and use of biofuels certified by the Brazilian National Biofuel Policy (RenovaBio). The parameters of the level of energy-environmental efficiency were standardized and categorized according to the Energy-Environmental Efficiency Rating (E-EER). The rating scale varied between lower efficiency (D) and high efficiency + (highest efficiency A+). The classification method with the J48 decision tree and naive Bayes algorithms was used to predict the models. The classification of the E-EER scores using a decision tree using the J48 algorithm and Bayesian classifiers using the naive Bayes algorithm produced decision tree models efficient at estimating the efficiency level of Brazilian ethanol producers and importers certified by the RenovaBio. The rules generated by the models can assess the level classes (efficiency scores) according to the scale discretized into high efficiency (Classification A), average efficiency (Classification B), and standard efficiency (Classification C). These results might generate an ethanol energy-environmental efficiency label for the end consumers and resellers of the product, to assist in making a purchase decision concerning its performance. The best classification model was naive Bayes, compared to the J48 decision tree. The classification of the Energy Efficiency Note levels using the naive Bayes algorithm produced a model capable of estimating the efficiency level of Brazilian ethanol to create labels.

1. Introduction

Developing renewable energy is one of the leading global interests in promoting sustainability and environmental quality, including modern electricity grids worldwide, which have begun to rely more heavily on renewable energy sources [1,2,3]. Ethanol is a renewable fuel produced by the fermentation of sugarcane extract and molasses. The product has a lower carbon footprint, is biodegradable, and has greater energy-environmental efficiency (renewable energy) compared to oil due to its sustainability in the production chain with better use of natural resources [4,5,6,7,8,9,10]. Ethanol is one of the main biofuels consumed in Brazil.
Biofuel partially (or entirely) replaces fossil fuels in engines (flex vehicles) [11]. The addition of 27% ethanol in gasoline (Cgasoline, with the addition of anhydrous ethanol fuel) has been mandatory in Brazil since 2015 [8,12,13,14]. Such an initiative expanded the country’s consumption of biofuels and increased the energy matrix’s sustainability. It also supported the goal of reducing 37% of GHG emissions by 2025, compared to 2005 levels [2,12,15,16]. Differently, some European Union countries also include electromobility (electric cars) in their GHG emission reduction forecasts [17].
The production of biofuel from sugarcane is supported by the National Agency of Petroleum, Natural Gas and Biofuels’ (ANP) sustainable development programs to achieve goals to reduce greenhouse gas emissions. Therefore, annual national targets were developed by the Brazilian National Biofuel Policy (RenovaBio) [12,15]. These goals are established in units of Decarbonization Credits (CBios) calculated from annual mandatory targets defined individually for each producer and distributor according to their participation in the fossil fuel market [12,16,18,19,20,21].
The certification of biofuel production assigns different marks to each biofuel producer and importer, in a value inversely related to the carbon amount of biofuel produced. The note reflects the individual contribution of each producing agent to mitigate a specific amount of GHG concerning its fossil substitute (in tons of CO 2 equivalent). The total emission is compared with that of the equivalent fossil fuel (gasoline, for ethanol), resulting in a final score (Energy-Environmental Efficiency Rating), characterizing the mitigation of emissions. This note generates CBios for biofuel producers and importers; with the decarbonization of the Brazilian energy matrix, there is a mechanism for the commercialization of these CBios linked to the carbon intensity of biofuels [2,12,16,18].
The incentive to reduce pollutant emissions in the biofuel chain goes far beyond the use of flex vehicles by consumers [9,11,22], but it is directly linked to decarbonization credits given to biofuel producers and distributors, because although renewable, it depends on how sugarcane is produced [5,8,23,24,25,26]. Alkimim and Clarke [27] showed that the carbon debt of deforestation in Brazilian biomes for ethanol production was equivalent to 608 Mg CO 2 ha 1 in the Amazon, 142 Mg CO 2 ha 1 in the Cerrado, and 212 Mg CO 2 ha 1 to the Atlantic Forest with the respective return time of 62, 15, and 22 years. In this context, it is essential to integrate dissemination strategies, clear and comprehensive, on what is the level of energy-environmental efficiency of biofuel producers and distributors [22,28,29], in order to raise awareness and increase the number of certificates at RenovaBio, the membership of which is not mandatory.
Predictive models are essential for the biofuel chain for both the consumer and the distributor as this classification of the level of efficiency can generate labels of their energy-environmental performance, increasing transparency and environmental responsibility concerning a product such as ethanol. The use of data mining to assess the performance of classifiers in the sugarcane sector is quite broad. It ranges from classifiers for mapping sugarcane planting [30] to deep learning techniques for the detection of sugarcane diseases [31] and classification of crop yield characteristics with neural networks used both in the recognition and in the grading of satellite images of sugarcane plantations [32].
The present study aimed to assess and classify energy-environmental efficiency levels to reduce greenhouse gas emissions in the production, commercialization, and use of biofuels certified by the Brazilian National Biofuel Policy (RenovaBio).

2. Material and Methods

2.1. Characterization of the Study

The study considered certification data for the production or efficient import of biofuels from the Brazilian National Biofuel Policy (RenovaBio) regulated by the National Agency of Petroleum, Natural Gas and Biofuels [12,33,34]. The Certificate of Efficient Production of Biofuels includes an Energy-Environmental Efficiency Note, resulting from the technical profile informed by a calculation validation spreadsheet (RenovaCalc) [2,12,33,34], and is linked to the volume of biofuel produced and marketed, generating the Decarbonization Credits (CBio) of the RenovaBio to reduce carbon emissions and improve the performance of biofuels. In addition to offering CBio, it is generated by the difference between the CO 2 equivalent emission of fossil fuels (baseline) and its biofuel substitute [12,18]. The biofuels evaluated in the study were anhydrous ethanol and hydrous ethanol. Only the database of the certificates of the efficient production or import of biofuels approved in 2019 was evaluated [12].

2.2. Classifying the Biofuel Energetic-Environmental Efficiency

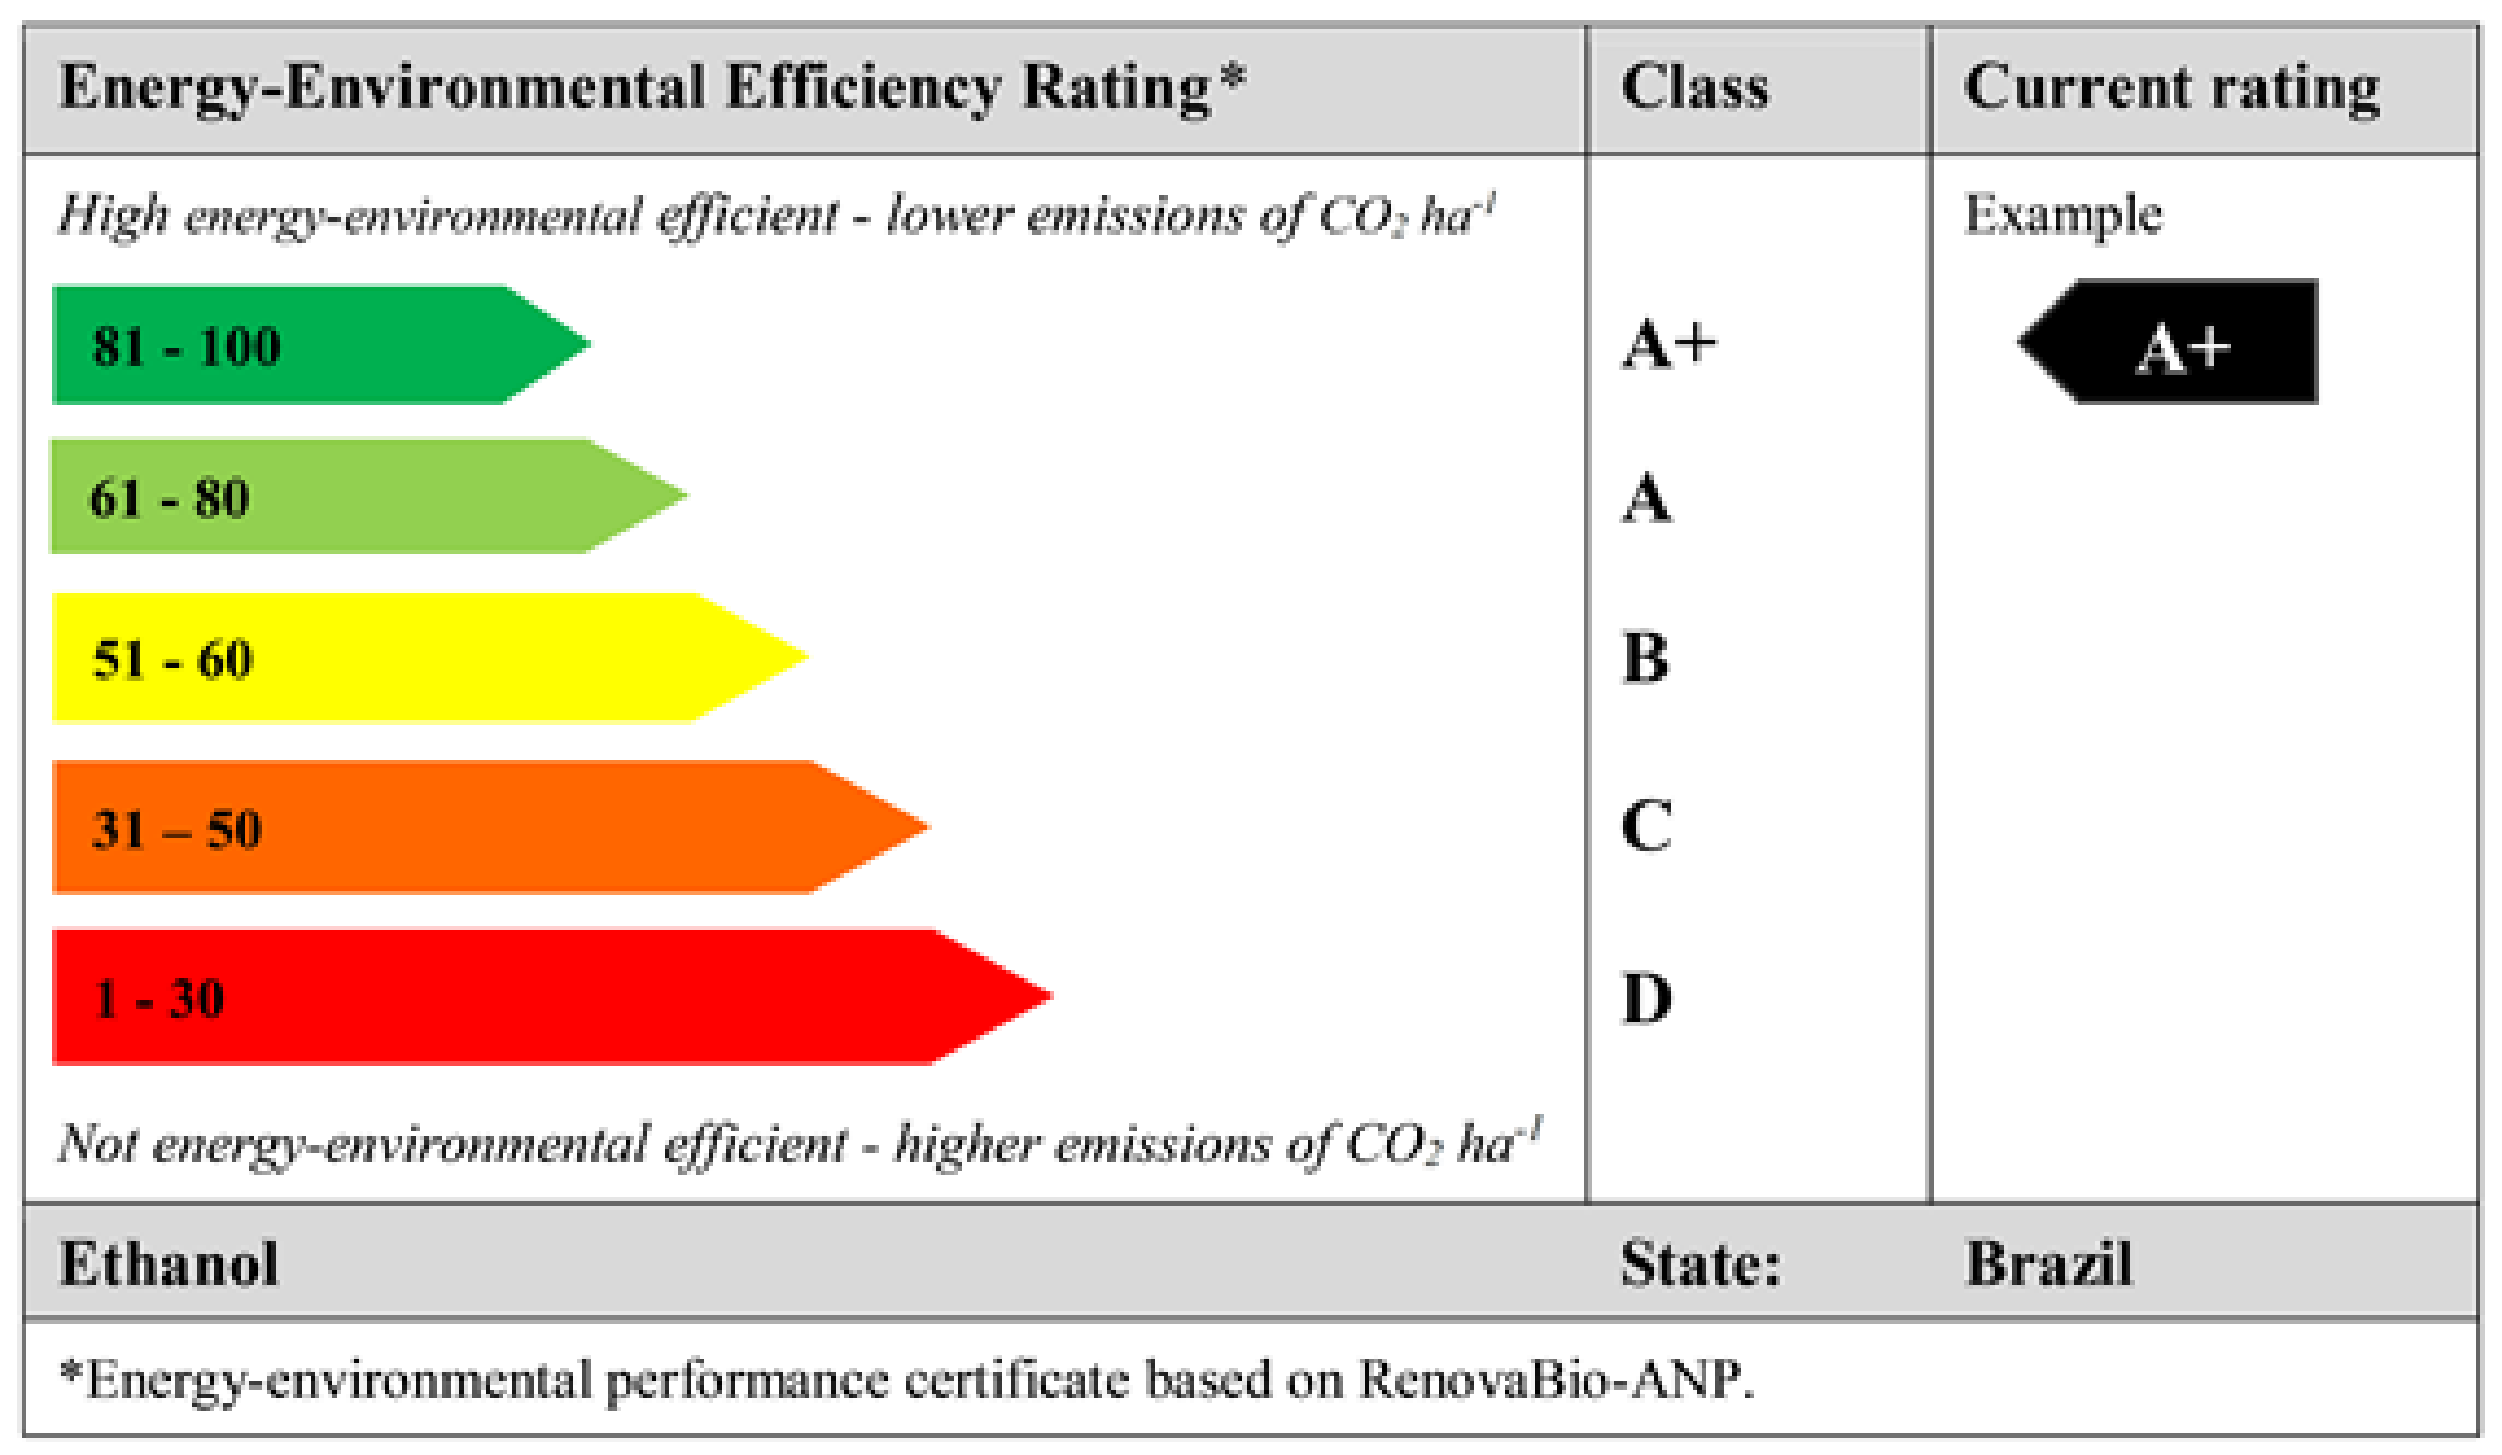
The classification levels of the biofuel environmental efficiency were performed based on the Energy-Environmental Efficiency Rating. Such a rating is the result of the certificates of the production or efficient import of biofuels informed through the calculation (RenovaCalc), linked to the volume of biofuel produced and commercialized, generating Decarbonization Credits (CBio) in the RenovaBio’s program.
The energy-environmental efficiency level parameters were standardized according to Table 1. The dataset was categorized according to the Energy-Environmental Efficiency Rating (RenovaBio) [12], the rating scale varying between lower efficiency and high efficiency + (highest efficiency), and an example of the label’s design of the energy-environmental efficiency for the performance of a certificate is given (Figure 1).
The calculation and indication of the environmental energy efficiency score (E-EER) of the certification for efficient production of biofuel, made available by the ANP, was discretized into categories of levels (classes) (pre-processing of the dataset) for the classification (data mining) and to create one of the labels of the energy-environmental performance (post-processing) of Brazilian ethanol. This labeling system allowed it to be classified into five classes (A+, A, B, C, and D) to provide consumers with a differentiation of the ethanol consumed from different producers, regions, or states.
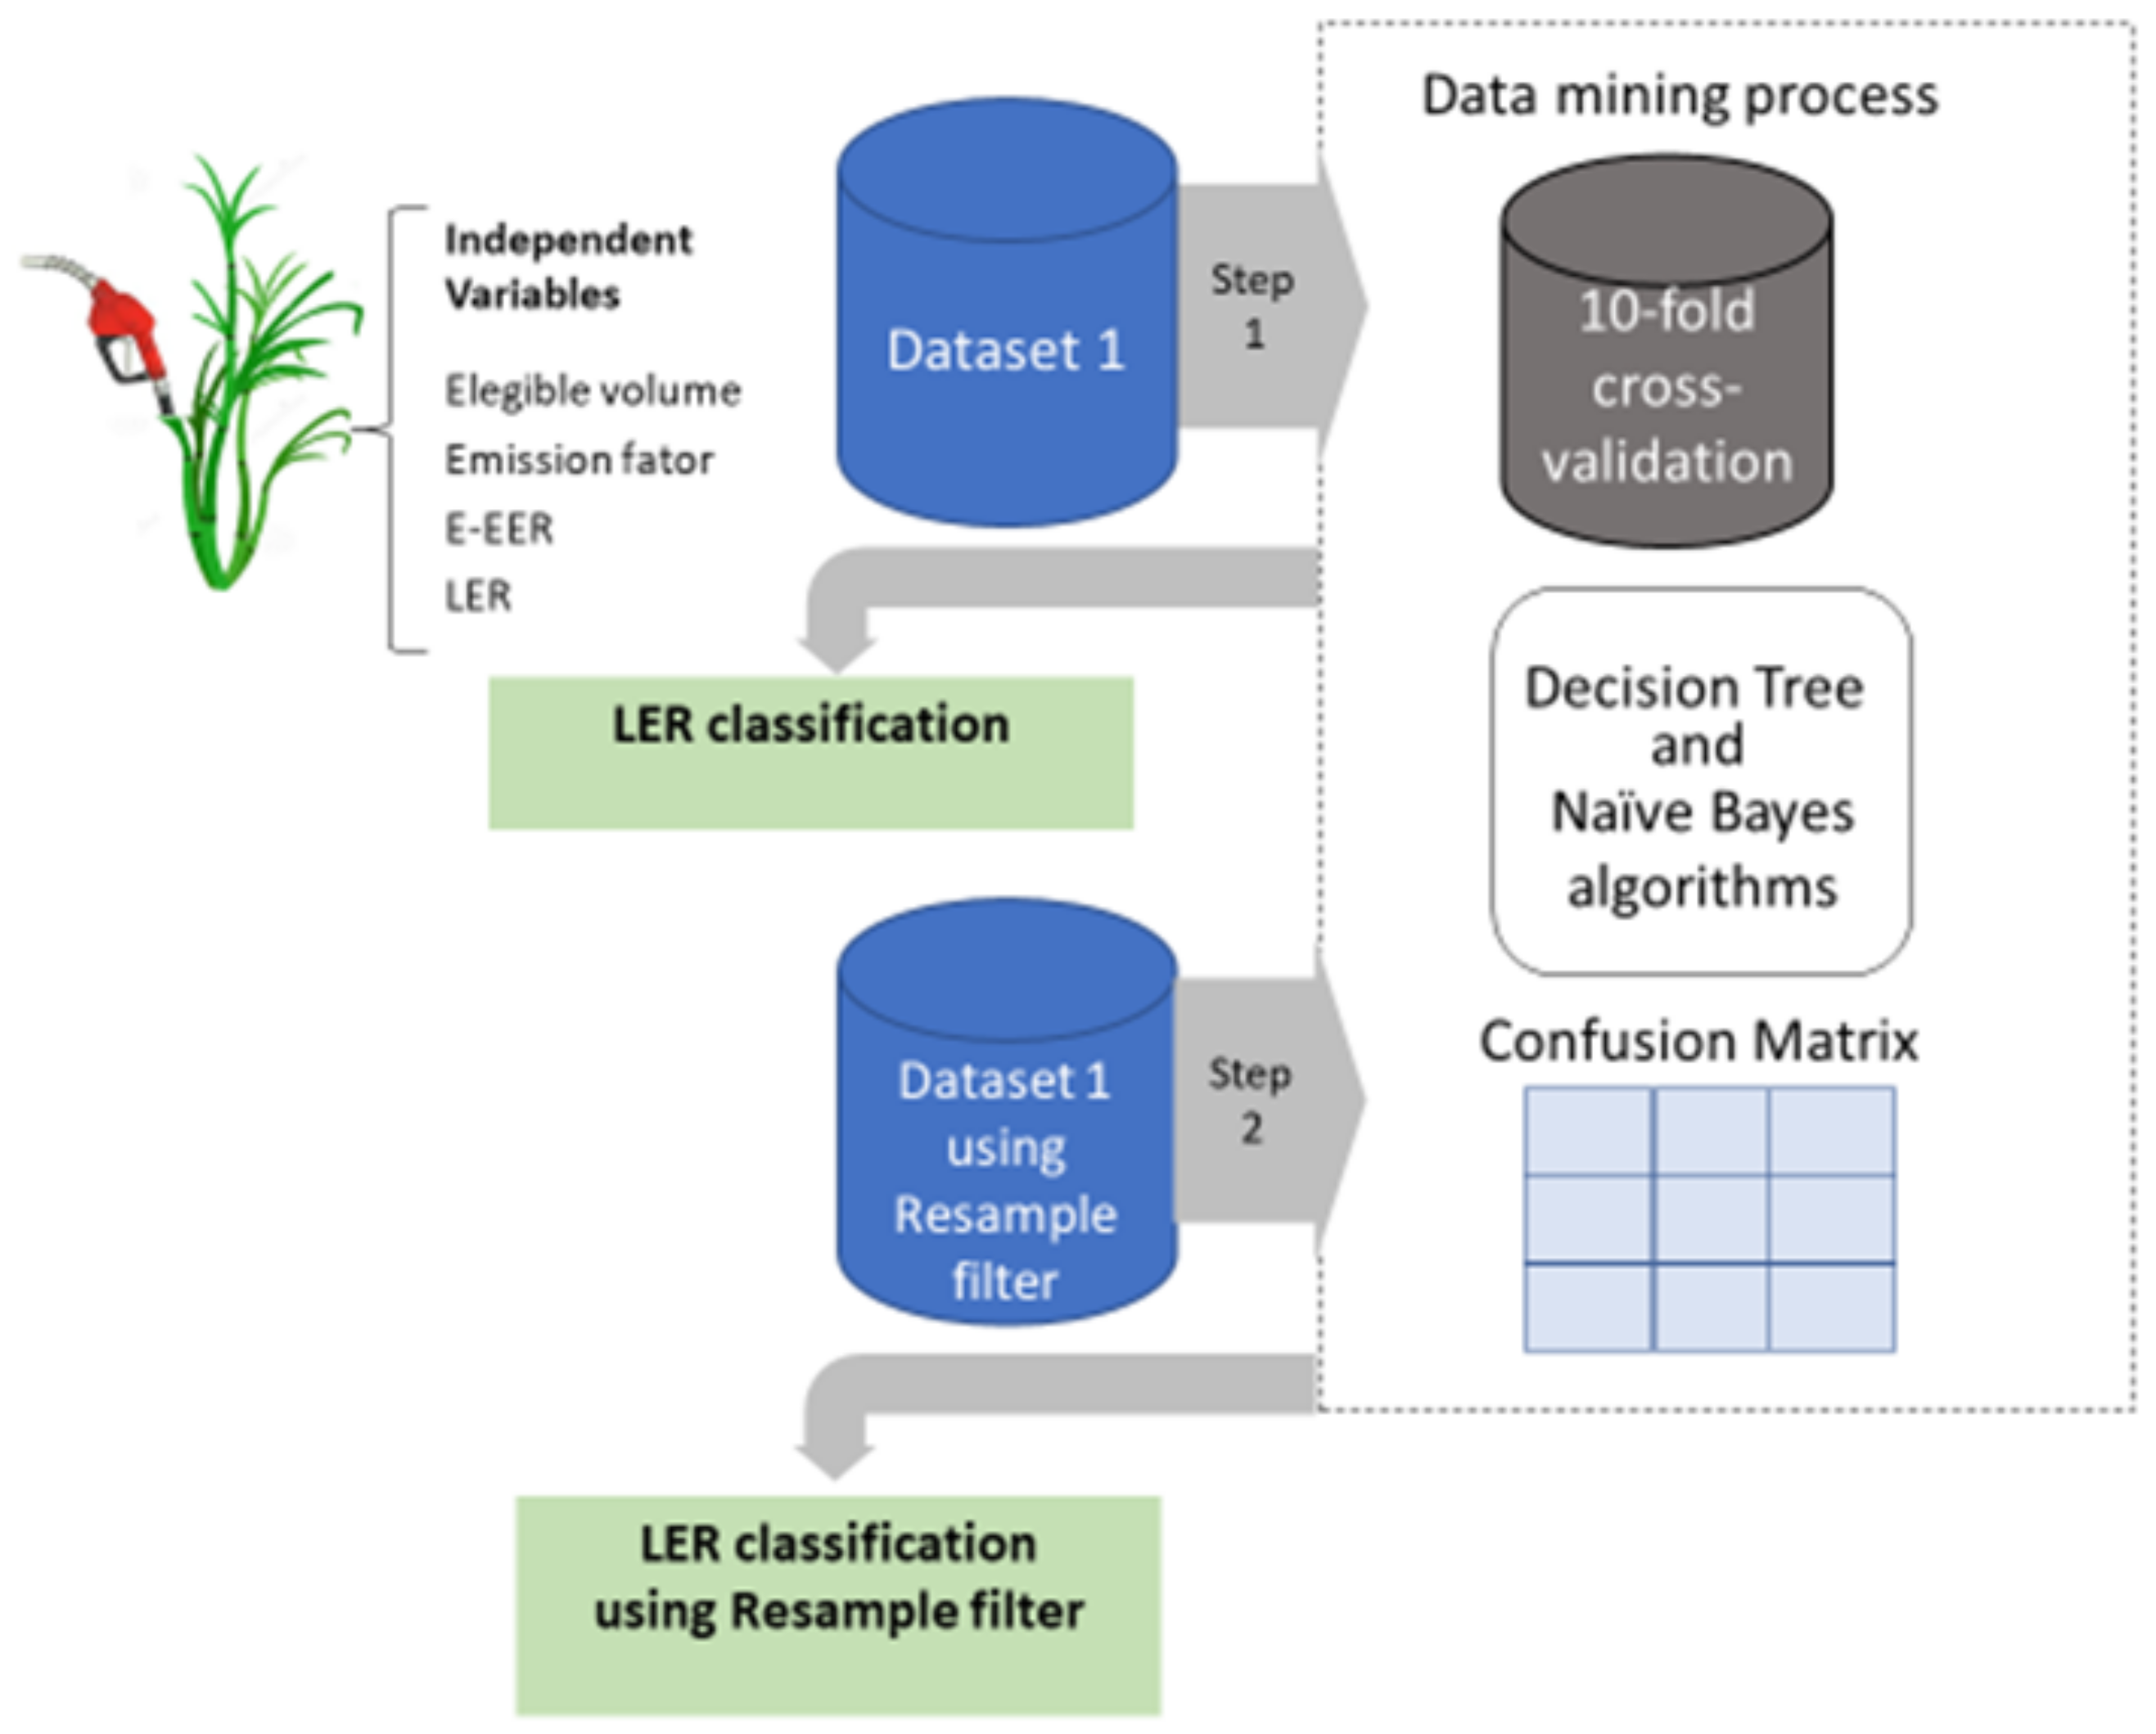
The RenovaBio Program allows producers and importers to be able to declare the energy-environmental efficiency of their product, which is economically attractive for decarbonization and the competitiveness of biofuels in the oil market, with a complex and solid structure (Figure 2) [2,12,18,33,34]. The label may be shown at fuel pumps to consumers with a validity of one to three years, a validity that is applied to the Certification of Efficient Production of Biofuels when approved by the ANP. It can also endorse the information and increase transparency in the biofuel market at the consumer level, helping to make a purchase decision. The objective of energy-environmental labeling is to encourage Brazilian sugar and alcohol industries to develop innovations and improvements beyond the minimum levels of efficiency. However, it is expected that more ethanol producers will be able to adhere to the ANP certifications of RenovaBio [2,12,19,33,34], and consequently, the labeling system can be improved with the inclusion of more data on the platform.

2.3. Classification of Model Prediction

Data mining applies to this study, through techniques (algorithms), for the classification of the levels (classes) of energy-environmental efficiency in the search of strategic information that allows the extraction of implicit information existing in the databases, contributing to the process of identifying and classifying new patterns [35,36,37]. The steps of the data mining method were selection, pre-processing, data mining, and post-processing (knowledge filtering, interpretation and explanation, evaluation, and knowledge integration) for knowledge discovery from the classifiers [36,37]. The results obtained could be used in information management, information processing, decision making, and process control.
The data contained in the databases could be used to learn a specific target concept [35,36,37,38]. The tasks performed by data mining techniques and machine learning, the classification, build models that can be applied to unclassified data to categorize them into classes, to relate the meta attribute (whose value will be predicted) and a set of forecasting attributes [35,36,37,38].
The data were assessed in the ANP database for the registration of certificates of the production or efficient import of biofuels approved and included in the RenovaBio program in 2019 [12,33,34]. We considered only anhydrous ethanol and hydrated ethanol products, generating two products for the same biofuel producer and importer. The data pre-processing was performed in Excel spreadsheets for further processing in the data mining software Weka © (Waikato Environment for Knowledge Analysis) Version 3.8.4 [39,40,41,42]. The attributes used to build the predictive model were: “biofuel-type”, “state”, “eligible-volume (%)”, “emission factor”, “Energy-Environmental Efficiency Rating”, and “LER” (Level of Efficiency Rating). 
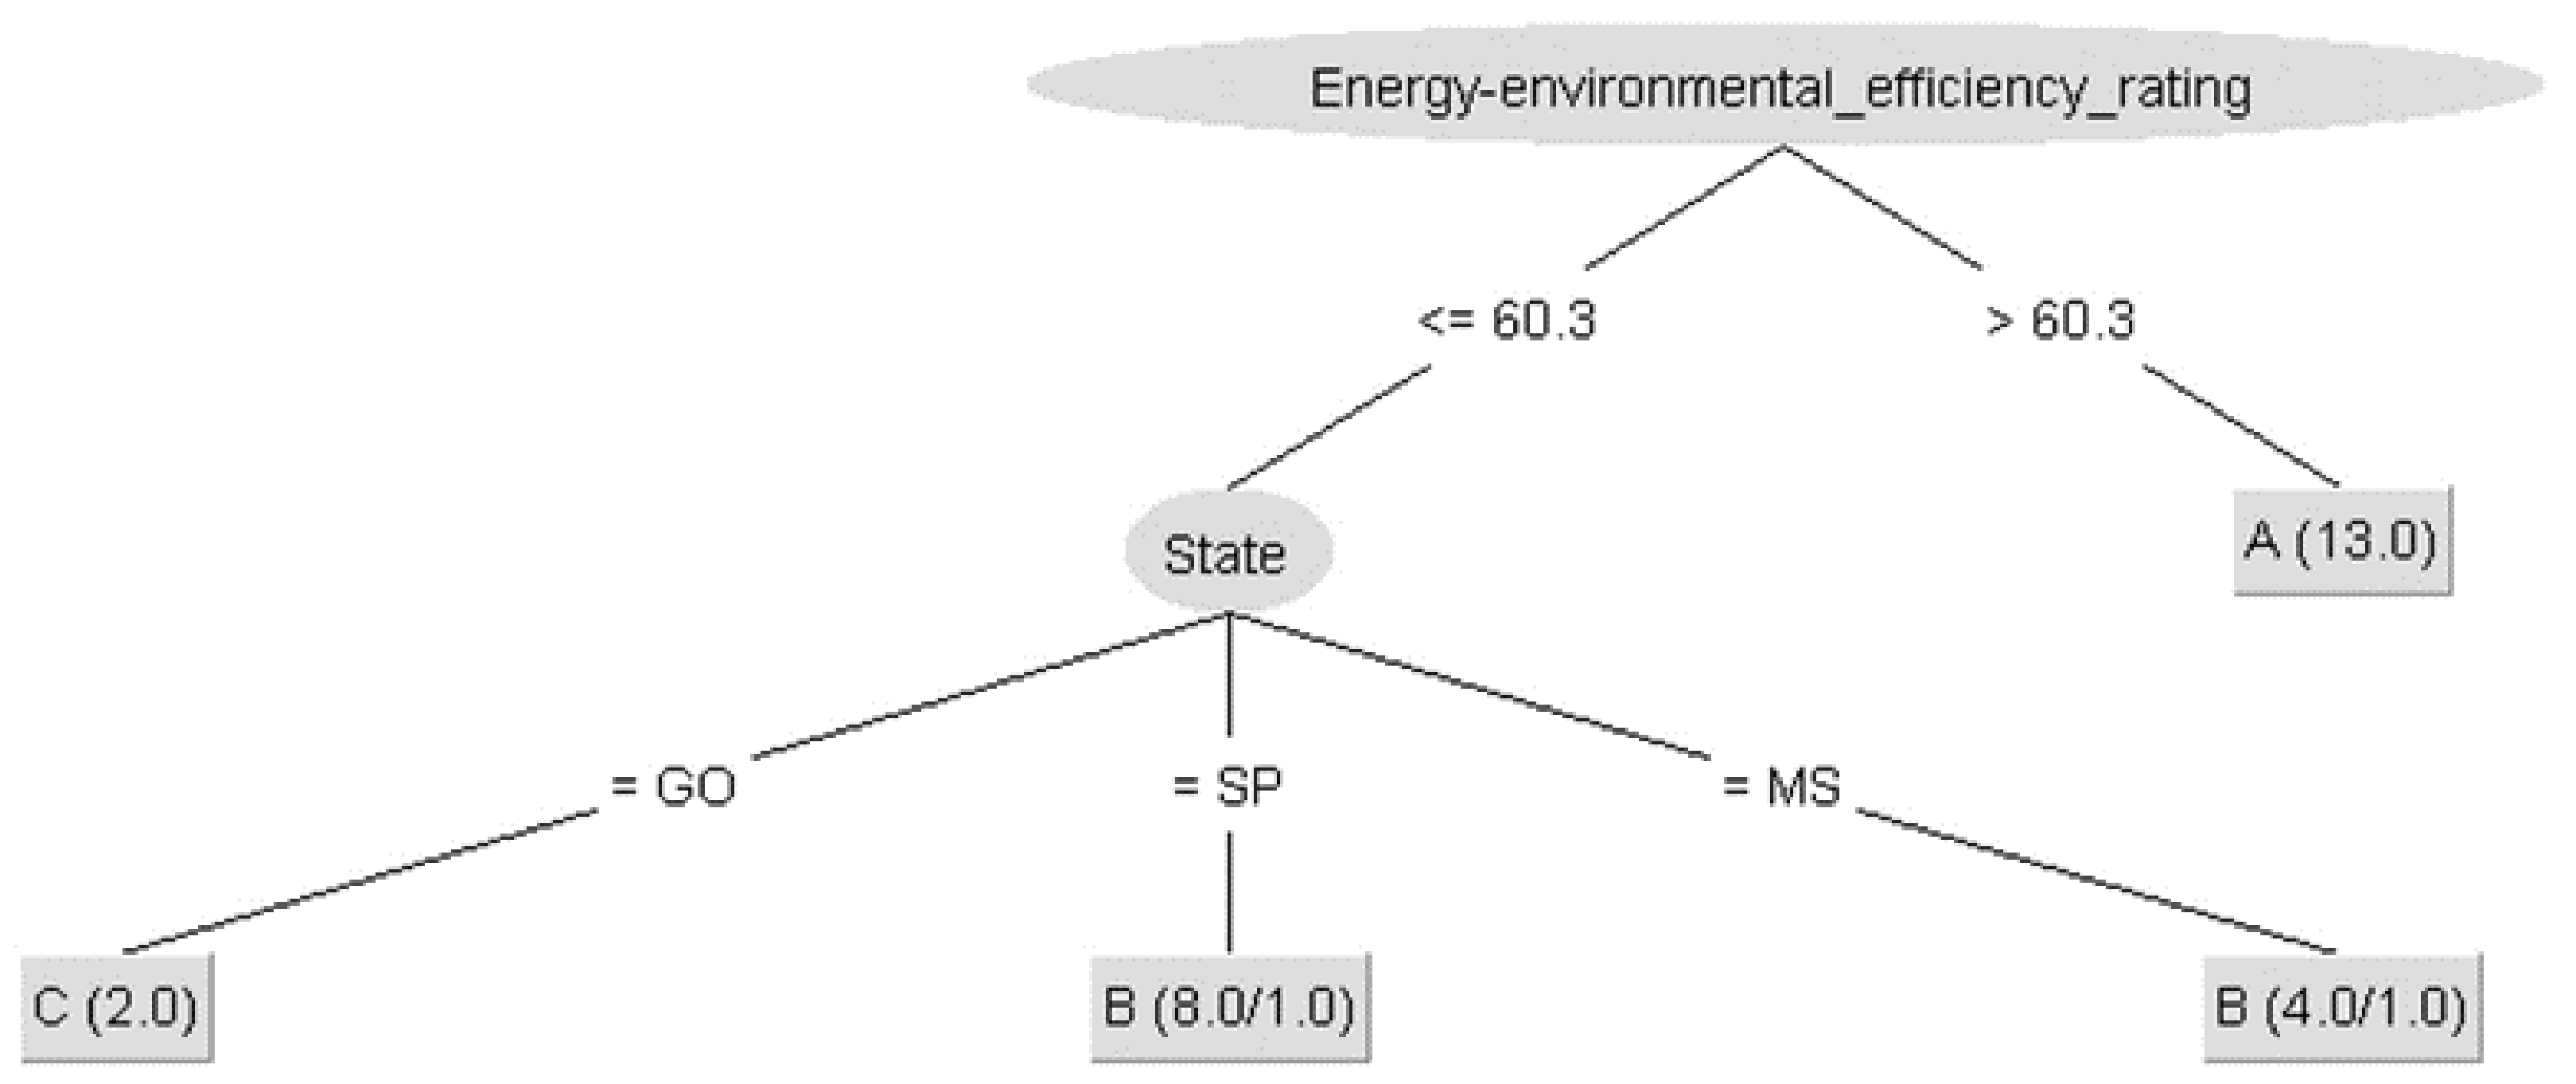
Figure 3 presents the modeling process used to classify the Energy-Environmental Efficiency Rating.
A classifier is a mapping from unlabeled instances to (discrete) classes. Classifiers have a form (classification tree) plus an interpretation procedure (including how to handle unknown values). Most classifiers also can provide probability estimates (or other likelihood scores), which can be thresholded to yield a discrete class decision, thereby taking into account a cost/benefit or utility function [43,44].
During the pre-processing of the data, the dataset was extracted from the RenovaBio Program (ANP) platform, selecting only the data on the ethanol product and organized in a spreadsheet. The implementation of the supervised filter Resample was applied to maintain the distribution of classes in the subsample and to reach a uniform distribution for comparing the data not submitted to the filter (noResample). The filter Resample produces a random subsample of a dataset using either sampling with replacement or without replacement. The filter was made to maintain the class distribution in the subsample or to bias the class distribution toward a uniform distribution.
The J48 decision tree classification algorithms (“ w e k a . c l a s s i f i e r s . t r e e s . J 48 - C 0.25 - M 2 ” without the filter and in relation to “ d a t a - b i o f u e l - w e k a . f i l t e r s . s u p e r v i s e d . i n s t a n c e . R e s a m p l e - B 0.0 - S 1 - Z 100.0 ” using the resample filter) and the naive Bayes algorithm (“ w e k a . c l a s s i f i e r s . b a y e s . N a i v e B a y e s ” without the filter and in relation to “ d a t a - b i o f u e l - w e k a . f i l t e r s . s u p e r v i s e d . i n s t a n c e . R e s a m p l e - B 0.0 - S 1 - Z 100.0 ” using the resample filter) were used. The model validation was done using cross-validation (10 folds) applied to the dataset of 27 instances and six attributes (“biofuel-type”, “state”, “eligible-volume (%)”, “emission-factor”, “energy-environmental-efficiency-rating”, and “LER” (Level of Efficiency Rating)). For each sample, the known class label was compared with the prediction of the learned class model.
In supervised learning, each data input object is preassigned a class label. The main task of supervised algorithms (J48 and naive Bayes) is to learn a model that produces the same labeling for the provided data [43,44,45]. The decision tree algorithm is a widely used algorithm for classification, which uses attribute values to partition the decision space into smaller subspaces in an iterative manner, and the decision processes can be represented graphically as a tree. Each possible decision is covered and represented as a branch, and a complete decision process is essentially a path or branch from the root node to a leaf [43,44]. Naive Bayes is a classification algorithm widely used in problems due to its simplicity, effectiveness, and robustness, being a probabilistic approach based on assumptions that resources are independent of each other and that their weights are equally important [46]. They can better represent the complex relationships between input variables found in real problems [46]. Probabilistic inference can be studied as an approach based on the assumption that decision variables follow probable distributions. The essence of a Bayesian classifier is to estimate the probabilities of all alternative models or hypotheses, given data as evidence, and then to find the most probable classification to be assigned to each new input [44,46].
In the step of the post-processing for filtering, interpretation and explanation, evaluation, and knowledge integration generated by the algorithms for knowledge discovery from the classifiers, the metrics of the performance of the algorithms were used. Post-processing procedures usually include various pruning routines, rule quality processing, rule filtering, rule combination, model combination, or even knowledge integration [47].
The last step is to evaluate the prediction, and such an analysis was made based on the performance values obtained through the test of the prediction model [48]. The performance evaluation measures of the prediction models used were the confusion matrix, accuracy, precision, and recall and the correlation coefficient between classes (Matthews Correlation Coefficient (MCC)) for testing with the resample filter. The Kappa statistic measured the learning capacity of the algorithm.
The confusion matrix presented a matrix with results obtained during the test phase of the model, and it was used in models that used classification algorithms. Considering a confusion matrix of a hypothesis, it offered an adequate measure of the classification model, by showing the number of correct classifications versus the predicted rankings for each class, over a set of instances. The number of correct answers, for each class, was located on the main diagonal of the matrix, and the other elements represented errors in the classification.
The precision represents what has been classified correctly. The values obtained in correctly classified instances and incorrectly classified instances are determinant for predicted accuracy, since they display the values of correct classification and incorrect classification obtained by the algorithm (Equation (1)).
P r e c i s i o n = T P ( T P + F P )
where TP = True Positive; FP = False Positive. The sensitivity (recall) signifies the proportion of wrong classifications or the occurrence of defects. In addition to accuracy and precision, its value varies from 0 to 1, with values closer to 1 being indicators of a good performance prediction model obtained by Equation (2).
S e n s i t i v i t y ( R e c a l l ) = T P ( T P + F N )
where TP = True Positive; FN = False Negative.
The Kappa statistic is a metric that compares an observed precision with an expected precision (random chance). It is a measure used to deal with multi-class and unbalanced class problems. The Kappa statistic can be defined as a measure of the degree of agreement between two categorized datasets. The Kappa result varies between 0 and 1. The higher the Kappa value, the stronger the bond [49] (Equation (3)).
K a p p a s t a t i s t i c = P O P E 1 P E
where P O = proportion of observed agreements; P E = proportion of agreements expected by chance.
The Matthews Correlation Coefficient (MCC) is a correlation coefficient between the dependent classes and represents a measure of quality. Unlike accuracy, precision, and sensitivity, its value ranges from −1 to 1, where values closer to −1 are indicators of a poor prediction model, values equal to 0 indicate that the prediction model is entirely random, and values closer to 1 are indicators of a prediction model with good performance (Equation (4)).
M C C = T P T N F P F N ( T P + F P ) ( T P + F N ) ( T N + F P ) ( T N + F N )
where TP = True Positive; TN = True Negative; P = False Positive; FN = False Negative.

3. Results

Classification of the Energy-Environmental Efficiency Level for Biofuels

The If-Then classification rules are presented related to the energy-environmental efficiency level for biofuels.
The decision tree generated by the J48 algorithm presented the following classification rules (Figure 4): If the energy-environmental efficiency deficiency (E-EER) was higher than 60.3, then the classification was A (high efficiency). If the Energy-Environmental Efficiency Rating (E-EER) was less than or equal to 60.3, then the rating depended on the state where the ethanol was produced. If the state was Goiás (GO), then the classification was C (standard efficiency). If the state was São Paulo (SP), then the classification was B (average efficiency). If the state was Mato Grosso do Sul (MS), then the rating was B (average efficiency). The results indicated that the model classified with precision above 60.
The performance of the classifiers in predicting the classes of the E-EER level using the J48 decision tree algorithm (Table 2) showed 74.07% of instances classified correctly and 25.93% for those classified incorrectly, and the learning capacity of the algorithm was 0.56 for the Kappa statistic. Class A showed the best 100% True Positive (TP) rate, with a 0.07 False Positive (FP) rate, a precision of 0.93, and high recall. However, for Class C, the precision was zero, not classifying any.
The performance of the naive Bayes algorithm showed 81.48 of instances correctly classified and 18.52% for those classified incorrectly, with a learning capacity of 0.70 for the Kappa statistic. It classified Classes A and B with high performance, with an accuracy of 1.00 and 0.73, respectively (Table 3). Comparing the two algorithms, naive Bayes presented better performance indexes concerning the J48 decision tree.
The decision tree generated by the J48 algorithm for the dataset with the application of the resample filter (Figure 5) presented the following classification rules (Figure 4). If the Energy-Environmental Efficiency Rating (E-EER) is higher than 60.1, then the classification is A (high efficiency). If the Energy-Environmental Efficiency Rating (E-EER) is less than or equal to 60.1, then the classification depends on the eligible volume (%) of the biomass. If the eligible volume is higher than 97.43, then the rating is B (average efficiency). If the eligible volume is less than or equal to 97.43, then the rating is C (standard efficiency) (Figure 5). The results indicated that the use of the resample filter had higher weight for the appropriate attribute volume during the evaluation of the E-EER and that ethanol production depended directly on this volume.
The performance of the classifiers in the prediction of the classes of the E-EER level using the J48 decision tree algorithm and with the application of the resample filter (Table 4) presented 81.48% of instances correctly classified and 18.52% for those classified incorrectly, and the algorithm learning ability was 0.70 for the Kappa statistic. Classes A and B showed high prediction with values of 1.00 and 0.78, respectively. However, the forecast for the C class was 0.40.
The performance of the naive Bayes algorithm showed 77.78% of instances classified correctly and 22.22% for those classified incorrectly, with a learning capacity of 0.64 for the Kappa statistic (Table 5). It classified Classes A and B with high performance, with an accuracy of 0.77 and 0.90, respectively (Table 5). The J48 decision tree showed better performance indexes when compared to naive Bayes.
The confusion matrix for the J48 decision tree algorithm presented results with positive gains for the classes when the resample filter was applied, going from 20 to 22 strikes, specifically for Class C (Table 6). This gain in the resample increased the normal balance or distribution of the dataset, shown in Table 4. The results of the Matthews Correlation Coefficient (MCC) proved this gain with values of 1.00 for A, 0.85 for B, and 0.79 for C.
The confusion matrix for the naive Bayes algorithm also showed results with positive gains for the classes when the resample filter was applied, going from 20 to 21 hits, specifically for Class C, with two hits (Table 7). However, this gain did not have good accuracy when we observed the results of Matthews Correlation Coefficient (MCC) (Table 5), which presented values of 0.80 for A, 0.64 for B, and 0.41 for C, when compared to the J48 decision tree algorithm in the same analysis condition, which performed better.
The results showed that the classification using the naive Bayes algorithm was better than J48, in the approach without the resample filter. It classified the minority class (C) better and presented a higher degree of agreement (Kappa statistic). It also indicated high performance by the Matthews correlation coefficient concerning the J48 decision tree algorithm. However, the use of the resample filter in both algorithms improved the distribution of classes in the confusion matrix (Table 6 and Table 7), especially Class C.

4. Discussion

The decision tree signalized the production state importance. The E-EER value was higher for the most productive states (SP, MS). However, Brazilian ethanol producers’ certification was still small concerning the high number of states and the volume of ethanol produced in Brazil. The classification of the energy-environmental efficiency of Goiás state did not show its status as one of the states that produces the most ethanol in Brazil [50]. The number of certified producers was still less than it should be. Such a public policy (RenovaBio) was implemented in 2018, so far with little adhesion by the producers and importers in producing states.
The comparison of the J48 decision tree and naive Bayes algorithms, applied to the dataset without using filters, showed differences in the performance indicators. The naive Bayes algorithm, when compared to the J48 decision tree, presented better performance results, predicted Class C better (50% higher in the TP rate), and had better learning capacity (higher Kappa statistic value), indicating that the prediction model had a good performance with this algorithm. However, the sensitivity of the model decreased. The application of the Resample filter in the pre-processing of data for classification with the J48 decision tree algorithm was the one that showed the best performance compared to naive Bayes, as the Kappa statistic was high and the MMC for all classes was higher, indicating that the prediction model performed well.
The data mining technique is also applied in the area of environmental impacts of sugarcane production, for predicting the energy produced and the environmental impacts. Artificial intelligence methods, artificial neural networks, and adaptive neural fuzzy inference system models are also used to predict the environmental impacts of the life cycle and energy output of sugarcane production on planted farms [51].
Integrated approaches based on complex systems for forecasting the growth of sugarcane based on meteorological parameters using extreme machine learning and neural networks were able to show a more generalized model of forecasting for the growth of sugarcane, bringing benefits to industry and the community [52].
Brazil is a major producer of sugarcane and a major consumer of ethanol, with intensive production in order to meet the demands of biofuel (clean energy) and to reduce the use of fossil fuel (oil). However, several efforts in public policy must come into synergy regarding the growing consumption of biofuel and the sustainable development of the sugarcane chain, mainly regarding its energy-environmental efficiency, use of inputs, and agricultural processes [5]. The ethanol energy-environmental performance labels are applicable in this context, as they would help consumers understand how the chain is evaluated mainly in terms of environmental impact and also collaborating with the transparency of public sector policies.
The most evaluated and used energy efficiency labels are for buildings, appliances, equipment, and lamps. These labeling systems are part of public energy-saving policies; since their implementation, there have been improvements in the evaluation standard, and they have also impacted consumption behavior [53,54,55,56,57,58,59,60]. The implementation of energy efficiency measures can guarantee a sustainable economy. In this context, the energy efficiency labeling program for buildings is generally designed with performance processes and standards, with a rigorous database. Eco-labeling is another system with an approach based on the environmental performance of products that also influences consumer choice [61]. Batista et al. [57] investigated the contribution of labeling to reducing the electricity consumption of buildings and noted that conventional buildings that adopt measures such as painting walls and ceilings white, in addition to using smoked glass, were sufficient to raise the rating to an A level.
The evaluation of buildings generally includes energy classification schemes and shows the difference between the Brazilian scheme and those applied by other countries to improve the labeling method [62]. Other studies have included a review of international building energy efficiency codes and labeling schemes to establish standards for the assessment and classification of buildings in terms of energy performance [63]. Lopes et al. [60] reviewed studies on energy efficiency policies and regulations for buildings, highlighting how the Brazilian program can be improved compared to the American and Portuguese programs; however, this labeling system does not inform about the reduction of GHG emissions.
Another study evaluated two new proposals for an energy efficiency label and a new method for assessing the energy efficiency of public lighting systems. The main difference between the proposals was the number of parameters evaluated. However, the current evaluation system evaluates only one parameter (energy efficiency index), and the study’s proposals recommend five parameters: lamps, energy efficiency index, light pollution, renewable energy contribution, and light dimming [64].
All of these studies demonstrated that the labeling system can be implemented and improved for consolidation and active contribution to consumer behavior. However, it could also increase the contribution of the ethanol production sector with greater participation with the goal of reducing greenhouse gases and reducing energy use. The biofuel sector could benefit from the implementation of an energy-environmental labeling system. With a successful approach, it could increase adherence to the RenovaBio program and consequently increase the sector’s decarbonization credits.

5. Conclusions

The Brazilian National Biofuel Policy (RenovaBio) is one of the main strategies to encourage the reduction of pollutants in the renewable energy sector from sugarcane. For this reason, the implementation of simple labeling can impact consumer behavior and increase the transparency of the incentive program to reduce environmental impacts.
After testing two classifiers, the best model evaluated was naive Bayes without the use of the resample filter compared to the J48 decision tree, also with the use of the resample filter. The classification of the Energy Efficiency Note (RenovaBio) levels using a Bayesian classifier, the naive Bayes algorithm, produced a model capable of predicting the efficiency level of Brazilian ethanol producers and importers certified to create labeling. The rules generated by the models were capable of estimating the classes according to the scale discretized into high efficiency (Classification A), average efficiency (Classification B), and standard efficiency (Classification C), with more accurate forecasts for the observed classes. These results could generate an ethanol energy-environmental efficiency label for the end consumers and resellers of the product.
However, RenovaBio’s database of ethanol was small, concerning the records of efficiency scores registered in the program, as adherence to the program is still voluntary, and the implementation is recent, hindering deeper learning in the classification of labels. Besides, a more in-depth analysis could improve the model’s forecast in the generation of energy-environmental labels for biofuels.

Author Contributions

Conceptualization, N.D.d.S.L. and J.G.M.d.R.; methodology, N.D.d.S.L. and I.d.A.N.; software, N.D.d.S.L. and I.d.A.N.; validation, N.D.d.S.L., I.d.A.N., J.G.M.d.R., and R.B.T.R.d.S.; formal analysis, N.D.d.S.L. and I.d.A.N.; investigation, N.D.d.S.L., J.G.M.d.R., and R.B.T.R.d.S.; resources, I.d.A.N. and R.B.T.R.d.S.; data curation, N.D.d.S.L. and J.G.M.d.R.; writing, original draft preparation, N.D.d.S.L. and I.d.A.N.; writing, review and editing, I.d.A.N., J.G.M.d.R., and R.B.T.R.d.S.; visualization, I.d.A.N., J.G.M.d.R., and R.B.T.R.d.S.; supervision, I.d.A.N. and J.G.M.d.R.; project administration, N.D.d.S.L. and R.B.T.R.d.S.; funding acquisition, I.d.A.N. All authors have read and agreed to the published version of the manuscript.

Funding

This research was funded by Brazilian funding organizations: Coordenação de Aperfeiçoamento de Pessoal de Nível Superior - Capes Grant Number: 88882315049/2019-01, and Conselho Nacional de Desenvolvimento Científico e Tecnológico - CNPQ Grant Number: 159842/2019-0

Conflicts of Interest

The authors declare no conflict of interest.

References

  1. Cabral, O.M.; Freitas, H.C.; Cuadra, S.V.; de Andrade, C.A.; Ramos, N.P.; Grutzmacher, P.; Galdos, M.; Packer, A.P.C.; da Rocha, H.R.; Rossi, P. The sustainability of a sugarcane plantation in Brazil assessed by the eddy covariance fluxes of greenhouse gases. Agric. For. Meteorol. 2020, 282–283, 107864. [Google Scholar] [CrossRef]
  2. Grassi, M.; Pereira, G. Energy-cane and RenovaBio: Brazilian vectors to boost the development of Biofuels. Ind. Crop. Prod. 2019, 129, 201–205. [Google Scholar] [CrossRef]
  3. Tucki, K.; Orynycz, O.; Wasiak, A.; Świć, A.; Dybaś, W. Capacity Market Implementation in Poland: Analysis of a Survey on Consequences for the Electricity Market and for Energy Management. Energies 2019, 12, 839. [Google Scholar] [CrossRef] [Green Version]
  4. Filoso, S.; Carmo, J.B.d.; Mardegan, S.F.; Lins, S.R.M.; Gomes, T.F.; Martinelli, L.A. Reassessing the environmental impacts of sugarcane ethanol production in Brazil to help meet sustainability goals. Renew. Sustain. Energy Rev. 2015, 52, 1847–1856. [Google Scholar] [CrossRef]
  5. de Andrade Junior, M.A.U.; Valin, H.; Soterroni, A.C.; Ramos, F.M.; Halog, A. Exploring future scenarios of ethanol demand in Brazil and their land-use implications. Energy Policy 2019, 134, 110958. [Google Scholar] [CrossRef] [Green Version]
  6. Cardozo, N.P.; de Oliveira Bordonal, R.; La Scala, N. Sustainable intensification of sugarcane production under irrigation systems, considering climate interactions and agricultural efficiency. J. Clean. Prod. 2018, 204, 861–871. [Google Scholar] [CrossRef]
  7. Kumar, A.; Ogita, S.; Yau, Y.Y. (Eds.) Biofuels: Greenhouse Gas Mitigation and Global Warming; Springer: New Delhi, India, 2018. [Google Scholar] [CrossRef]
  8. Sarangi, P.K.; Nanda, S.; Mohanty, P. (Eds.) Recent Advancements in Biofuels and Bioenergy Utilization; Springer: Singapore, 2018. [Google Scholar] [CrossRef]
  9. Isabella, G.; Yu, A.S.O.; Silva, A.M.d.; Pegetti, A.L. Another driver of the Brazilian fuel ethanol supply chain: The consumers’ preferences. Rev. De Adm. 2017, 52, 304–316. [Google Scholar] [CrossRef]
  10. Souza, S.P.; Seabra, J.E. Environmental benefits of the integrated production of ethanol and biodiesel. Appl. Energy 2013, 102, 5–12. [Google Scholar] [CrossRef]
  11. Santos, A.S.; Gilio, L.; Halmenschlager, V.; Diniz, T.B.; Almeida, A.N. Flexible-fuel automobiles and CO2 emissions in Brazil: Parametric and semiparametric analysis using panel data. Habitat Int. 2018, 71, 147–155. [Google Scholar] [CrossRef]
  12. ANP. Política Nacional de Biocombustíveis. Available online: http://www.anp.gov.br/producao-de-biocombustiveis/renovabio (accessed on 10 December 2019).
  13. Brito, T.L.F.; Islam, T.; Stettler, M.; Mouette, D.; Meade, N.; Moutinho dos Santos, E. Transitions between technological generations of alternative fuel vehicles in Brazil. Energy Policy 2019, 134, 110915. [Google Scholar] [CrossRef]
  14. Brazilian Ministério do Meio Ambiente. Plano Setorial de Mitigação e de Adaptação às Mudanças Climáticas para a Consolidação de uma Economia de Baixa Emissão de Carbono na Agricultura. Available online: http://www.mma.gov.br/images/arquivo/80076/Plano_ABC_VERSAO_FINAL_13jan2012.pdf. (accessed on 10 December 2019).
  15. UNICA. Política Nacional de Biocombustíveis (RenovaBio). Available online: http://unicadata.com.br/index.php (accessed on 10 December 2019).
  16. Pischke, E.C.; Solomon, B.; Wellstead, A.; Acevedo, A.; Eastmond, A.; De Oliveira, F.; Coelho, S.; Lucon, O. From Kyoto to Paris: Measuring renewable energy policy regimes in Argentina, Brazil, Canada, Mexico and the United States. Energy Res. Soc. Sci. 2019, 50, 82–91. [Google Scholar] [CrossRef]
  17. Tucki, K.; Orynycz, O.; Świć, A.; Mitoraj-Wojtanek, M. The Development of Electromobility in Poland and EU States as a Tool for Management of CO2 Emissions. Energies 2019, 12, 2942. [Google Scholar] [CrossRef] [Green Version]
  18. Salina, F.H.; de Almeida, I.A.; Bittencourt, F.R. RenovaBio Opportunities and Biofuels Outlook in Brazil. In Renewable Energy and Sustainable Buildings; Sayigh, A., Ed.; Springer International Publishing: Cham, Switzerland, 2020; pp. 391–399. [Google Scholar] [CrossRef]
  19. Klein, B.C.; Chagas, M.F.; Watanabe, M.D.B.; Bonomi, A.; Maciel Filho, R. Low carbon biofuels and the New Brazilian National Biofuel Policy (RenovaBio): A case study for sugarcane mills and integrated sugarcane-microalgae biorefineries. Renew. Sustain. Energy Rev. 2019, 115, 109365. [Google Scholar] [CrossRef]
  20. Novato, M.; Lacerda, M.I. RenovaBio-Towards a New National Biofuel Policy and a Truly Sustainable World. Innov. Energy Res. 2017, 6. [Google Scholar] [CrossRef]
  21. Santini, G.A.; Pinto, L.d.B.; Queiroz, T.R. Cana-de-açúcar como base da matriz energética nacional. Rev. PolíTica AgríCola 2011, 20, 89–99. [Google Scholar]
  22. Benites-Lazaro, L.; Giatti, L.; Sousa Junior, W.; Giarolla, A. Land-water-food nexus of biofuels: Discourse and policy debates in Brazil. Environ. Dev. 2020, 100491. [Google Scholar] [CrossRef]
  23. Moreno, A.D.; Susmozas, A.; Oliva, J.M.; Negro, M.J. Overview of bio-based industries. In Biobased Products and Industries; Elsevier: Amsterdam, The Netherlands, 2020; pp. 1–40. [Google Scholar] [CrossRef]
  24. Benites-Lazaro, L.L.; Giatti, L.; Giarolla, A. Sustainability and governance of sugarcane ethanol companies in Brazil: Topic modeling analysis of CSR reporting. J. Clean. Prod. 2018, 197, 583–591. [Google Scholar] [CrossRef]
  25. Caldarelli, C.E.; Gilio, L. Expansion of the sugarcane industry and its effects on land use in São Paulo: Analysis from 2000 through 2015. Land Use Policy 2018, 76, 264–274. [Google Scholar] [CrossRef]
  26. Taheripour, F.; Hertel, T.W.; Liu, J. The role of irrigation in determining the global land use impacts of biofuels. Energy Sustain. Soc. 2013, 3. [Google Scholar] [CrossRef] [Green Version]
  27. Alkimim, A.; Clarke, K.C. Land use change and the carbon debt for sugarcane ethanol production in Brazil. Land Use Policy 2018, 72, 65–73. [Google Scholar] [CrossRef] [Green Version]
  28. Nogueira, L.A.H.; Souza, G.M.; Cortez, L.A.B.; Brito Cruz, C.H.d. Biofuels for Transport. In Future Energy; Elsevier: Amsterdam, The Netherlands, 2020; pp. 173–197. [Google Scholar] [CrossRef]
  29. Pereira, A.O.; Pereira, A.S.; La Rovere, E.L.; Barata, M.M.d.L.; Villar, S.d.C.; Pires, S.H. Strategies to promote renewable energy in Brazil. Renew. Sustain. Energy Rev. 2011, 15, 681–688. [Google Scholar] [CrossRef]
  30. Wang, M.; Liu, Z.; Ali Baig, M.H.; Wang, Y.; Li, Y.; Chen, Y. Mapping sugarcane in complex landscapes by integrating multi-temporal Sentinel-2 images and machine learning algorithms. Land Use Policy 2019, 88, 104190. [Google Scholar] [CrossRef]
  31. Militante, S.V.; Gerardo, B.D.; Medina, R.P. Sugarcane Disease Recognition using Deep Learning. In Proceedings of the 2019 IEEE Eurasia Conference on IOT, Communication and Engineering (ECICE), Yunlin, Taiwan, 3–6 October 2019; pp. 575–578. [Google Scholar] [CrossRef]
  32. Cevallos, J.C.; Villagomez, J.A.; Andryshchenko, I. Convolutional Neural Network in the Recognition of Spatial Images of Sugarcane Crops in the Troncal Region of the Coast of Ecuador. Procedia Comput. Sci. 2019, 150, 757–763. [Google Scholar] [CrossRef]
  33. ANP. Resolução ANP N° 758 de 2018—Regulamenta a CertificaçãO da ProduçãO ou ImportaçãO Eficiente de BiocombustíVeis de que trata o art. 18 da lei N° 13.576, de 26 de Dezembro de 2017, e o Credenciamento de Firmas Inspetoras. Available online: http://legislacao.anp.gov.br/?path=legislacao-anp/resol-anp/2018/novembro&item=ranp-758-2018 (accessed on 10 December 2019).
  34. Brazil. Decreto N° 9.308, 15 de Março de 2018. Metas CompulsóRias Anuais de Redução de Emissões de Gases Causadores do Efeito Estufa para a Comercialização de Combustíveis de que trata a Lei n° 13.576, de 26 de Dezembro de 2017. Available online: http://www.planalto.gov.br/ccivil_03/_ato2015-2018/2018/Decreto/D9308.htm (accessed on 18 March 2019).
  35. Larose, D.T.; Larose, C.D. Data Mining and Predictive Analytics, 2nd ed.; Wiley Series on Methods and Applications in Data Mining; John Wiley & Sons Inc.: Hoboken, NJ, USA, 2015. [Google Scholar]
  36. Frank, E.; Hall, M.; Holmes, G.; Kirkby, R.; Pfahringer, B.; Witten, I.H.; Trigg, L. Weka-A Machine Learning Workbench for Data Mining. In Data Mining and Knowledge Discovery Handbook; Maimon, O., Rokach, L., Eds.; Springer: Boston, MA, USA, 2010; pp. 1269–1277. [Google Scholar] [CrossRef]
  37. Ngai, E.W.T.; Xiu, L.; Chau, D.C.K. Application of data mining techniques in customer relationship management: A literature review and classification. Expert Syst. Appl. 2009, 36, 2592–2602. [Google Scholar] [CrossRef]
  38. Naik, A.; Samant, L. Correlation Review of Classification Algorithm Using Data Mining Tool: WEKA, Rapidminer, Tanagra, Orange and Knime. Procedia Comput. Sci. 2016, 85, 662–668. [Google Scholar] [CrossRef] [Green Version]
  39. Holmes, G.; Donkin, A.; Witten, I.H. WEKA: A machine learning workbench. In Proceedings of the ANZIIS ’94—Australian New Zealnd Intelligent Information Systems Conference, Brisbane, Australia, 29 November–2 December 1994; pp. 357–361. [Google Scholar] [CrossRef] [Green Version]
  40. Witten, I.H.; Frank, E.; Trigg, L.E.; Hall, M.A.; Holmes, G.; Cunningham, S.J. Weka: Practical machine learning tools and techniques with Java implementations. In Working Paper; University of Waikato, Department of Computer Science: Hamilton, New Zealand, 1999. [Google Scholar]
  41. Markov, Z.; Russell, I. An introduction to the WEKA data mining system. ACM SIGCSE Bull. 2006, 38, 367–368. [Google Scholar] [CrossRef]
  42. Hall, M.; Frank, E.; Holmes, G.; Pfahringer, B.; Reutemann, P.; Witten, I.H. The WEKA data mining software: An update. ACM SIGKDD Explor. Newsl. 2009, 11, 10. [Google Scholar] [CrossRef]
  43. Provost, F.; Fawcett, T. Data Science for Business: What You Need to Know about Data Mining and Data-Analytic Thinking, 1st ed.; O’Reilly: Beijing, China, 2013. [Google Scholar]
  44. Yang, X.S. Introduction to Algorithms for Data Mining and Machine Learning; Academic Press: London, UK, 2019. [Google Scholar]
  45. Pérez-Ortiz, M.; Jiménez-Fernández, S.; Gutiérrez, P.; Alexandre, E.; Hervás-Martínez, C.; Salcedo-Sanz, S. A Review of Classification Problems and Algorithms in Renewable Energy Applications. Energies 2016, 9, 607. [Google Scholar] [CrossRef]
  46. Arar, M.F.; Ayan, K. A feature dependent Naive Bayes approach and its application to the software defect prediction problem. Appl. Soft Comput. 2017, 59, 197–209. [Google Scholar] [CrossRef]
  47. Maimon, O.; Last, M. Post-Processing of Data Mining Results. In Knowledge Discovery and Data Mining; Series Title: Massive Computing; Springer: Boston, MA, USA, 2001; Volume 1, pp. 53–59. [Google Scholar] [CrossRef]
  48. Bowes, D.; Hall, T.; Gray, D. Comparing the performance of fault prediction models which report multiple performance measures: Recomputing the confusion matrix. In Proceedings of the 8th International Conference on Predictive Models in Software Engineering—PROMISE ’12, Lund, Sweden, 21–22 September 2012; pp. 109–118. [Google Scholar] [CrossRef] [Green Version]
  49. Sim, J.; Wright, C.C. The Kappa Statistic in Reliability Studies: Use, Interpretation, and Sample Size Requirements. Phys. Ther. 2005, 85, 257–268. [Google Scholar] [CrossRef] [Green Version]
  50. ANP. Dados Estatísticos. Available online: http://www.anp.gov.br/dados-estatisticos (accessed on 20 March 2020).
  51. Kaab, A.; Sharifi, M.; Mobli, H.; Nabavi-Pelesaraei, A.; Chau, K.W. Combined life cycle assessment and artificial intelligence for prediction of output energy and environmental impacts of sugarcane production. Sci. Total. Environ. 2019, 664, 1005–1019. [Google Scholar] [CrossRef] [PubMed]
  52. Taherei Ghazvinei, P.; Hassanpour Darvishi, H.; Mosavi, A.; Yusof, K.B.W.; Alizamir, M.; Shamshirband, S.; Chau, K.W. Sugarcane growth prediction based on meteorological parameters using extreme learning machine and artificial neural network. Eng. Appl. Comput. Fluid Mech. 2018, 12, 738–749. [Google Scholar] [CrossRef] [Green Version]
  53. Vine, E.; du Pont, P.; Waide, P. Evaluating the impact of appliance efficiency labeling programs and standards: Process, impact, and market transformation evaluations. Energy 2001, 26, 1041–1059. [Google Scholar] [CrossRef]
  54. Wiel, S.; McMahon, J.E. Energy-Efficiency Labels and Standards: A Guidebook for Appliances, Equipment, and Lighting, 2nd ed.; Technical Report LBNL–45387—2nd-Edition, LBNL-45387, 877316; Collaborative Labeling and Appliance Standards Program (CLASP): Washington, DC, USA, 2005. [Google Scholar] [CrossRef] [Green Version]
  55. Lee, S.E.; Rajagopalan, P. Building energy efficiency labeling programme in Singapore. Energy Policy 2008, 36, 3982–3992. [Google Scholar] [CrossRef]
  56. Mills, B.; Schleich, J. What’s driving energy efficient appliance label awareness and purchase propensity? Energy Policy 2010, 38, 814–825. [Google Scholar] [CrossRef] [Green Version]
  57. Batista, N.d.N.; Rovere, E.L.L.; Aguiar, J.C.R. Energy efficiency labeling of buildings: An assessment of the Brazilian case. Energy Build. 2011, 43, 1179–1188. [Google Scholar] [CrossRef]
  58. Lopes, M.N.; Iwamoto, G.; Riella, H.L.; Lamberts, R.; Campos, L.M.S. The building simulation as an alternative method in brazilian energy efficiency labeling of commercial buildings. In Proceedings of the Building Simulation 2011 Conference, Sydney, Australia, 14–16 November 2011. [Google Scholar]
  59. Newell, R.G.; Siikamäki, J. Nudging Energy Efficiency Behavior: The Role of Information Labels. J. Assoc. Environ. Resour. Econ. 2014, 1, 555–598. [Google Scholar] [CrossRef]
  60. Lopes, A.d.C.P.; Oliveira Filho, D.; Altoe, L.; Carlo, J.C.; Lima, B.B. Energy efficiency labeling program for buildings in Brazil compared to the United States’ and Portugal’s. Renew. Sustain. Energy Rev. 2016, 66, 207–219. [Google Scholar] [CrossRef]
  61. Banerjee, A.; Solomon, B.D. Eco-labeling for energy efficiency and sustainability: A meta-evaluation of US programs. Energy Policy 2003, 31, 109–123. [Google Scholar] [CrossRef]
  62. Scalco, V.A.; Fossati, M.; de Souza Versage, R.; Sorgato, M.J.; Lamberts, R.; Morishita, C. Innovations in the Brazilian regulations for energy efficiency of residential buildings. Archit. Sci. Rev. 2012, 55, 71–81. [Google Scholar] [CrossRef]
  63. Fossati, M.; Scalco, V.A.; Linczuk, V.C.C.; Lamberts, R. Building energy efficiency: An overview of the Brazilian residential labeling scheme. Renew. Sustain. Energy Rev. 2016, 65, 1216–1231. [Google Scholar] [CrossRef]
  64. Gutierrez-Escolar, A.; Castillo-Martinez, A.; Gomez-Pulido, J.M.; Gutierrez-Martinez, J.M.; González-Seco, E.P.D.; Stapic, Z. A review of energy efficiency label of street lighting systems. Energy Effic. 2017, 10, 265–282. [Google Scholar] [CrossRef] [Green Version]
Figure 1. Energy-environmental efficiency label design for performance certificates.
Energies 13 02067 g001
Figure 2. Plan of the emission and trade of decarbonization credits (CBios) created by the RenovaBioProgram, adapted by Klein et al. [19].
Energies 13 02067 g002
Figure 3. Schematic of the modeling process used to classify the Energy-Environmental Efficiency Rating of Brazilian ethanol. E-EER, Energy-Environmental Efficiency Rating; LER, Level of Efficiency Rating.
Energies 13 02067 g003
Figure 4. Decision tree for classifying the level of the energy-environmental efficiency of biofuels.
Energies 13 02067 g004
Figure 5. Decision tree for the energy-environmental level classification of biofuels using the Resample filter. GO, Goiás; SP, São Paulo; MS, Mato Grosso do Sul.
Energies 13 02067 g005
Table 1. Parameters of the level of the Energy-Environmental Efficiency Rating.
Energy-Environmental Efficiency Rating 1EC 2Description
81–100A+High efficiency + (highest efficiency)
61–80AHigh efficiency
51–60BAverage efficiency
31–50CStandard efficiency
1–30DLower efficiency
1 Based on the RenovaBio; 2 Efficiency Classes.
Table 2. Classifier performance (J48 decision tree) for scale class prediction models of the level of the energy-environmental efficiency of biofuel.
Classifier ModelMetrics
Correctly Classified Instances (%)Incorrectly Classified Instances (%)Kappa StatisticTest Mode
J48 Decision Tree74.0725.930.5610-Fold Cross-Validation
Detailed Accuracy by Class-Classifier Performance
ClassTP RateFP RatePrecisionRecallMCC
A1.000.070.931.000.93
B0.700.230.640.700.46
C00.09000.12
WA0.7400.1300.6800.7400.600
WA = Weighted Average. TP rate = True Positive rate. FP rate = False Positive rate. MCC = Matthews Correlation Coefficient.
Table 3. Naive Bayes classifier performance for scale class prediction models of the level of the energy-environmental efficiency of biofuel.
Classifier ModelMetrics
Correctly Classified Instances (%)Incorrectly Classified Instances (%)Kappa StatisticTest Mode
Naive Bayes81.4818.520.710-Fold Cross-Validation
Detailed Accuracy by Class-Classifier Performance
ClassTP RateFP RatePrecisionRecallMCC
A0.9201.000.920.93
B0.800.180.730.800.61
C0.500.090.500.500.41
WA0.810.080.820.810.73
WA = Weighted Average. TP rate = True Positive rate. FP rate = False Positive rate. MCC = Matthews Correlation Coefficient.
Table 4. Classifier performance for scale class prediction models of the level of the environmental efficiency of biofuel with the resample filter.
Classifier ModelMetrics-Classifier Performance
Correctly Classified Instances (%)Incorrectly Classified Instances (%)Kappa StatisticTest ModeFilters
J48 decision tree81.4818.520.7010-fold cross-validationsupervised instance resample
Detailed Accuracy by Class-Classifier Performance
ClassTP RateFP RatePrecisionRecallMCC
A1.0001.001.001.00
B0.700.120.780.700.85
C0.500.130.400.500.79
WA0.810.060.830.810.91
WA = Weighted Average. TP rate = True Positive rate. FP rate = False Positive rate. MCC = Matthews Correlation Coefficient.
Table 5. Classifier performance (naive Bayes) for scale class prediction models of the level of the environmental efficiency of biofuel using the resample filter.
Classifier ModelMetrics-Classifier Performance
Correctly Classified Instances (%)Incorrectly Classified Instances (%)Kappa StatisticTest ModeFilters
Naive Bayes77.7822.220.6410-fold cross-validationsupervised instance resample
Detailed Accuracy by Class-Classifier Performance
ClassTP RateFP RatePrecisionRecallMCC
A0.77010.770.80
B0.900.230.690.900.64
C0.500.090.500.500.41
WA0.780.100.810.780.68
WA = Weighted Average. TP rate = True Positive rate. FP rate = False Positive rate. MCC = Matthews Correlation Coefficient.
Table 6. Confusion matrix of the classification of the level of energy-environmental efficiency with the J48 decision tree.
Classifier Model No Instance Filter-J48 Decision Tree
ABCTotalClassified as
130013A
17210B
0404C
1411227
Classifier Model with the Supervised-Filter Instance: ResampleClassified as
130013A
07310B
0224C
139527
Table 7. Confusion matrix of the classification of the level of energy-environmental efficiency with naive Bayes.
Classifier Model No Instance Filter-Naive Bayes
ABCTotalClassified as
130013A
17210B
0404C
1411227
Classifier Model with the Supervised-Filter Instance: ResampleClassified as
1013A
09110B
0224C
1013427

