Abstract
The battery pack is the core component of a new energy vehicle (NEV), and reducing the impact of vibration induced resonance from the ground is a prerequisite for the safety of an NEV. For a high-performance battery pack design, a clear understanding of the structural dynamics of the key part of battery pack, such as the battery module, is of great significance. Additionally, a proper computational model for simulations of battery module also plays a key role in correctly predicting the dynamic response of battery packs. In this paper, an experimental modal analysis (EMA) was performed on a typical commercial battery module, composed of twelve 37Ah lithium nickel manganese cobalt oxide (NMC) prismatic cells, to obtain modal parameters such as mode shapes and natural frequencies. Additionally, three modeling methods for a prismatic battery module were established for the simulation modal analysis. The method of simplifying the prismatic cell to homogenous isotropic material had a better performance than the detailed modeling method, in predicting the modal parameters. Simultaneously, a novel method that can quickly obtain the equivalent parameters of the cell was proposed. The experimental results indicated that the fundamental frequency of battery module was higher than the excitation frequency range (0–150 Hz) from the ground. The mode shapes of the simulation results were in good agreement with the experimental results, and the average error of the natural frequency was below 10%, which verified the validity of the numerical model.
1. Introduction
The development of new energy vehicles (NEVs) is imminent, due to the urban air pollution and crude oil consumption in China [1] and the rest of the world [2]. However, the core component of an electric vehicle is the battery pack, which has two critical parts, the battery management system (BMS) and the lithium-ion batteries (LIBs). If BMS is considered to be the brain of NEVs, then the LIBs can be considered to be the heart. LIBs are the first choice of an NEV power battery due to their high-energy density [3]. However, these characteristics also lead to more serious accidents than traditional fuel vehicles. The vehicle is subject to random vibration when driving on the road [4]. If the excitation frequency is close to the natural frequency of the battery pack it would cause resonance, which would seriously damage the electrical and mechanical components inside the battery pack [5,6], reduce its fatigue life, and ultimately increase the possibility of severe accidents. Therefore, it is essential to figure out the vibration mechanism of the battery pack through experiments and simulations. As the most important part of the battery pack, the battery module is becoming a standard component like the battery cell [7]. Thus, it is necessary to comprehend the structural dynamics of the battery module for designing a qualified battery pack.
A new NEV must satisfy vibration tests of relevant laws and legislation before it is officially put on the market [8]. The proper finite element analysis can provide design guidance for the vehicle manufacturers, accelerating the product development speed, and saving manpower and material resources. However, the internal structure of the cell is complex, which is mainly composed of three basic components, an anode, a cathode, and a separator. In general, the cell can be regarded as a very weak composite in the study of mechanical integrity [9], and the separator is sandwiched between metal oxide and graphite, which are adhered by a binder. The different binders, such as starch [10], cellulose [11], chitosan [12], and casein [13], to a large extent determine the mechanical properties of a cell. The multi-layer system of jellyroll and the different kind of materials of electrode and binder make it difficult to build the real cell finite element model. Hence, it is very important to establish an appropriate equivalent finite element model of the cell for correct simulations of the battery module and the battery pack. At present, regarding the crashworthiness analyses [14], relevant scholars have done a lot of tests at the cell [15,16,17,18] and the module [19,20,21] level, and these test results can validate finite element models [22,23,24]. However, for vibration analysis, there are only a few studies at the cell level [7,16,25,26,27] but no research on battery modules. The structural dynamics of a battery module needs urgent elaboration. Additionally, a simple and effective finite element model for a battery module also needs to be put forward for the correct battery pack vibration analysis.
2. Related Research
Many mechanical tests such as three-point bending and hemispherical punch indentation were performed to discuss the mechanical behavior of the casing [28], the separator [29], and the jellyroll [30] of cylindrical lithium-ion cells. From these kinds of experiments, an effective computational model was established to predict the onset of short circuit [18], [31], and compressible foam material was proposed to represent the jellyroll fracture, thereby, reducing the calculation cost in the simulation process [30]. Some similar tests were also applied to pouch lithium-ion batteries, obtaining the stress–strain curve for the anode, the cathode, and the separator [9]. These test results could justify the finite element models for different loading conditions. In order to make a thorough inquiry about the buckling phenomenon of a pouch cell under a constrained compression test, relevant experiments and simulations were set up [9,15]. Besides the mechanical abuse analysis of a cell, vibration behaviors were also studied by some researchers. Hyung et al. [16] performed refined finite element modeling on a pouch cell. The 205-layer structure of the cell was represented by 126,256 finite elements. Shaker table tests and impact hammer tests were set up to get frequency response curves, and the test results agreed well with the simulation results. However, the established finite element model was so complicated that it did not find any application in practical engineering. Hooper et al. [7] conducted a modal test on a pouch cell and found that the natural frequency and modal damping did not vary with the different values of the state of charge (SOC). Contrary to Hooper’s conclusion, Popp et al. established frequency response tests on pouch cells with different values of SOC at different temperatures, and concluded that the SOC value could be obtained by measuring the frequency response curve of the cell if the temperature is known [25]. Based on the research of Hooper and Popp, Berg et al. [26,27] did a series of research on the structural dynamics of lithium-ion pouch cells and prismatic cells. They established a test bench for the experimental modal analysis (EMA) and found the sensitivity of structural response at the excitation level due to the non-linearity of the cell. The sensitivity of natural frequency and the damping ratio from the varied value of SOC and temperature were also interpreted. However, most of the literature takes cell as an example for EMA, not involving the battery module.
For designing a qualified battery pack, it essential to clearly understand the mechanical properties and modal parameters of battery modules. Lai et al. [32] conducted constrained compression tests from different directions, on battery module representative volume element (RVE) specimens. The experimental results indicated that the module RVE specimens were anisotropic. A homogenized 18650 Li-ion battery module model was established for NEV crashworthiness simulation and the battery cell was represented by an orthotropic homogenous material [33]. Hong et al. [34] found that battery cell structural variations due to manufacture errors could cause severe stress localization at high modal density, affecting the life of the battery module. Following the study by Hong et al., Nam et al. [35] considered that the variations of the cell electrode during the charging and discharging process as another cause of structural variations.
However, for the battery cell and module, most of the above literature only considered the mechanical properties under the collision conditions, ignoring the dynamic performance under vibration conditions. In this research, EMA was performed on a typical commercial prismatic battery module to obtain the dynamic properties, such as mode shapes and natural frequencies. Compared with the experimental results, three modeling methods for prismatic cells were established for simulation modal analysis.
3. Description of Experiments and Results
This section consists of four parts, respectively, introducing the mathematics associated with EMA, which includes the assumptions and mathematical derivation of the EMA, connections of the experimental equipment, the experimental methods, and the results.
3.1. Experimental Modal Analysis Theory
When using the impulse excitation method to extract the modal parameters of the object to be measured, the entire system needs to meet four major assumptions [36]:
- The linear assumption, which implies that the output caused by any combination of inputs is equal to the combination of the respective outputs and that the modal parameters of the system satisfy the superposition theorem. Before the experiments start, a linearity check should be performed on a test object. The specific method should impact the object to be measured with different magnitudes of force and observe whether the frequency response curve obtained is consistent.
- The time-invariant assumption, which requires the modal parameters of the structure to not change with time. This requires that the mass of the sensor is much smaller than that of the measured object, and during the measurement, the support stiffness and temperature of the test environment does not change significantly.
- The observability assumption, which requires that the incentive needs to fully arouse all modal modes in the band of interest.
- The reciprocity assumption, which implies that the structure should follow the Maxwell reciprocity principle
The equation of motion for the multiple degree of freedom (MDOF) system in the matrix form, is as follows [36]:
where is the mass matrix, is the damping matrix, is the stiffness matrix, is the force vector, and is the vector of displacements. Modal analysis is to solve the eigenvalues and eigenvectors of this equation and get the modal parameters such as damping, natural frequency, and mode shape. The equation 1 in Laplace domain is as follows:
where s is the Laplace variable, and the system transfer function can be obtained in fraction form, as follows [36]:
where is the pole of the system and is the residue matrix. In the EMA, the measured function is the system transfer function evaluated at between two points, which is also called the frequency response function (FRF). The FRF of the MDOF system is a linear superposition of the single degree of freedom (SDOF). The FRF for a particular location can be represented as follows [36]:
where is the pole of the system that is related to the natural frequency and damping, is the scaling factor, is the value of the mode shape at the i DOF (output response location) and is the value of the mode shape at j DOF (input excitation location). The point-to-point FRF indicated that the residue of the function, , depended on the location of input and output but the poles remained constant. Therefore, theoretically, all of the poles could be obtained by a single FRF, which implied that the damping and natural frequency could be measured by the data of one measurement point, and the mode shape depended on the different measurement points and needed to be described uniquely by enough measuring points. In reality, only one row or one column of the FRF matrix information was needed, and then all modal parameters of interest could be obtained by an inverse solution. More details about the theory of experimental modal analysis can be found in [36].
3.2. Experimental Equipment
The experimental equipment included an impact hammer, accelerometer, battery module, LMS SCADA mobile, and a computer. The connection is shown in Figure 1. The module to be measured consisted of 12 cells in series. The main load-bearing components of the module were aluminum end plates and 1.2 mm thick side plates, which were connected by welding. The part of the bottom surface that extended inward through the side plate bore the gravity of the battery cell, and there were insulating sheets between the battery cells. The specific parameters of the module are shown in Table 1.
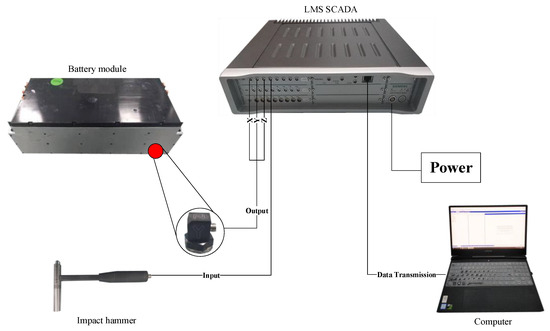
Figure 1.
The connection of the battery module impulse excitation experiment.

Table 1.
Module specification.
Its dimensions and composition are shown in Figure 2. The impact hammer was made by the piezoelectric company and its corrected sensitivity was 96.8 mv/N. The accelerometer type was 356A16-LW224520, and the corrected sensitivity in the X, Y, and Z directions were 96.8 mv/g, 100.6 mv/g, and 94.3 mv/g, respectively. The LMS Test Lab 17 was used as the analysis software.
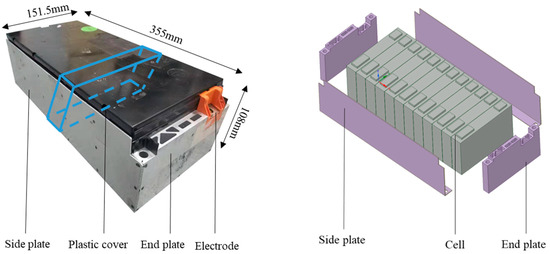
Figure 2.
The composition of the battery module: (a) Actual appearance with dimensions; and (b) a simplified model.
3.3. Experimental Method
There are two general modal test methods, one uses the roving impact hammer and the other uses the shaker to rove the accelerometer [36]. According to the reciprocity assumptions of modal analysis, the modal parameters measured by these two methods should be consistent. The difference was that the roving impact hammer test was to get one of the rows of the FRF matrix, whereas the shaker test was to obtain one of the columns of the FRF matrix. However, the exciter required equipment such as a signal source and a power amplifier, which were difficult to install. In addition, the energy generated during the experiments by the exciter was higher, and compared to the use of the impact hammer, the data had a better consistency and more uniform energy distribution, which was suitable for more complex mechanical structures. The battery cell and module structures were relatively simple, so the method of the roving hammer was used for EMA. In the aspect of the signal acquisition, the laser doppler vibrometer (LDV) could realize non-contact measurement. Compared to the accelerometer, it had a higher accuracy and could eliminate the influence of the additional mass of the accelerometer on the measurement results [37]. However, its price was relatively high, and the mass of the accelerometer was far lesser than that of the battery module, so it could be ignored. Therefore, the accelerometer was used to obtain the signal in this experiment.
The analysis performed on the battery module was a free–free modal analysis. Ideally, the measured object needed to be completely free floating, but this was impossible to achieve in the actual testing process. In this experiment, the battery module was suspended with a nylon rope to simulate the free boundary conditions. Generally, the highest rigid body frequency of the supporting structure was required to be lower than the lowest elastic frequency of the measured object, which could reduce the effect of the suspension system on the modal test of the battery module [36]. From the test results, it could be seen that this suspension support met the requirements. According to the literature [38], the metal hammer tip with a greater rigidity was chosen for this analysis. Generally, the exponentially decaying window needed to be implemented to minimize the leakage effect for a lightly damped structure, but no window was applied to the measurement data in this experiment due to the relatively high damping of battery module. The experimental parameters used in this test, are shown in Table 2 and the test process is shown as Figure 3.
Table 2.
The experimental parameters.
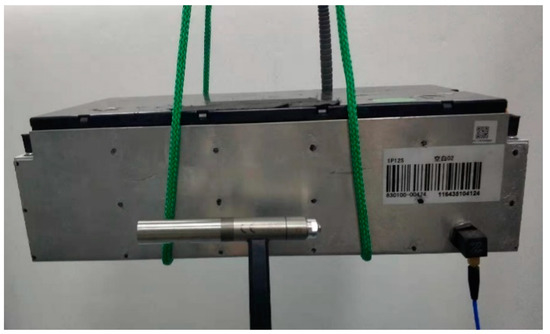
Figure 3.
The impulse excitation experiment performed on a battery module.
Twelve test points were arranged on the side plate of the module, and 9 test points were arranged on the two end plates, for a total of 42 test points. The position of the test points and the sensors are shown in Figure 4. The experiment was repeated three times and the average of the measurement results was used in the analysis.
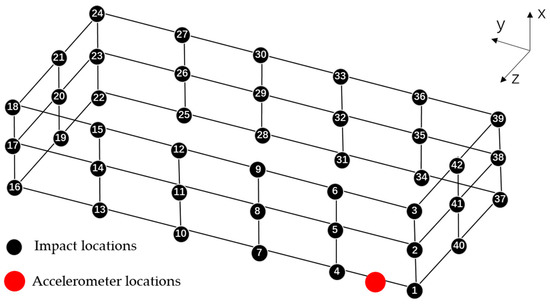
Figure 4.
The point layout for impulse excitation tests.
3.4. Experimental Results
In order to show the reliability of the experimental results, the variance of natural frequencies and damping ratios were adopted, which was calculated using Equations (5) and (6).
The experimental results, and the variance and average of these results are shown in Table 3. The maximum spread of the natural frequency was = 0.7%, and the maximum spread of the damping ratio was = 10.44%.
Table 3.
Experimental Results.
4. Simulation Modal Analysis and Comparison with the Experimental Modal Analysis
The first two parts of this section introduce how the finite element model of the cell and the battery module were established and the comparison of the experimental and simulation results are elaborated in the last part.
4.1. The Finite Element Model of Cell
As shown in Figure 5, the prismatic cells used in this study were composed of a thin aluminum shell, an upper cover, and two jellyrolls. In general, the equivalent physical parameters of the linear materials could be obtained through an impulse excitation test [39]. However, due to the gaps between the aluminum shell and the jellyroll, the microscopic gaps between the layers of jellyroll and porosity of jellyroll, the prismatic cell has a strong non-linearity [26,27].
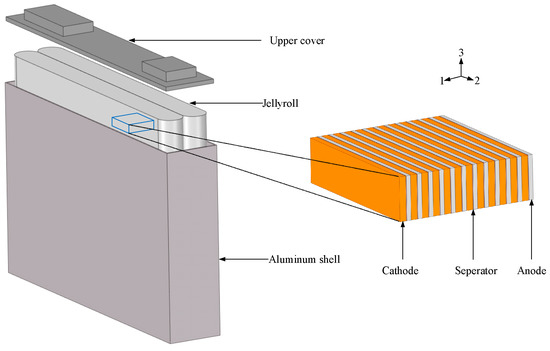
Figure 5.
Composition of the prismatic cell.
The frequency response curve of the same point changed with the size of the knocking force. The experimental results are shown in Figure 6, which were consistent with the conclusion of Berg [27]. Therefore, the equivalent physical parameters of the prismatic cell could not be obtained through the impulse excitation test [39]. As shown in Figure 5, the jellyroll, a kind of multi-layer system, could be regarded to be a transversely isotropic material [33]. The equivalent physical parameters of the material could be obtained through compression tests in different directions.
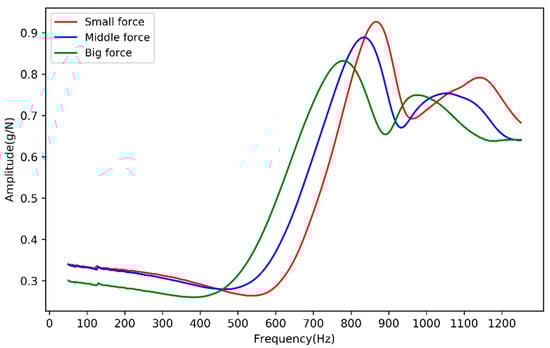
Figure 6.
The frequency response curve of prismatic cells at same point with different knocking force.
There are three modeling methods for the prismatic cell.
- When considering the structure of the aluminum shell, the jellyroll is regarded as a transversely isotropic material.
- Without considering the structure of the aluminum shell, the cell is regarded as a transversely isotropic material.
- Without considering the structure of the aluminum shell, the cell is regarded as an isotropic material.
According to the above methods, the finite element model of a prismatic cell is built as shown in Figure 7 in Ansys. The aluminum shell was discretized using shell181 element with a square shape and the solid185 element with a hexahedron shape was applied to the upper cover and jellyroll. The size of both the shell and the solid elements was 5 mm, when considering the computation time and precision. The numerical models of battery module were established in the next section, and the results of the experimental battery module modal analysis were compared to find the most suitable equivalent method for the cell.
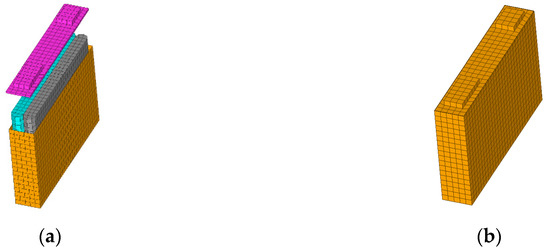
Figure 7.
The finite element model of the prismatic cell: (a) The structure of the aluminum shell was considered; and (b) the structure of the aluminum shell was not considered.
Three parameters—density, Poisson’s ratio and modulus of elasticity—were needed to define the isotropic materials. However, for the transversely isotropic material, in addition to the density, five parameters were still needed to be defined in the stress–strain matrix [40]. The matrix equation of stress and strain was as follows:
Therefore, it could be concluded that this kind of material had a total of 5 independent parameters. During the compression test, no dimensional variation was observed in the two transverse directions perpendicular to the loading direction, which could make the Poisson’s ratio 0.01 [17]. Hence, three parameters,, , and were needed to be determined. Lai et al. [15] performed compression tests on the cell RVE specimens in the in-plane and out-of-plane directions to obtain = 350 Mpa, = 188 Mpa. In addition, the actual measured natural frequencies and modal shapes of the module were compared with the simulation results to verify that = 145 Mpa.
4.2. The Finite Element Model of the Battery Module
The main components of the battery module were the side plate, the end plate, and the cell. In the modal analysis of the battery module, it was necessary to simplify the structure which had a little influence on the modal parameters. Therefore, the plastic cover, electrical components, and the electrodes were removed, leaving the side plate, the end plate, and the cell. The connection type in the finite element model was bonding, as the components of the simplified module were bonded with AB glue. Three different numerical battery module models with different cells were established and the cell was discretized separately, as described in Section 4.1. Due to its irregular shape, the tetrahedral-shaped solid185 element was used for the end plate and the side plate had the same element type as the aluminum shell. Model 1 considered the structure of the aluminum shell of the cell and the number of finite element meshes was 103,914. In model 2 and model 3, the cell was treated as a homogeneous body, and the number of finite element meshes was 85,890. However, Model 2 considered the multi-layer system of the cell and made the cell a transversely isotropic material. Differing from Model 2, Model 3 was equivalent to isotropic material. The final finite element mesh for Model 1 is shown in Figure 8.
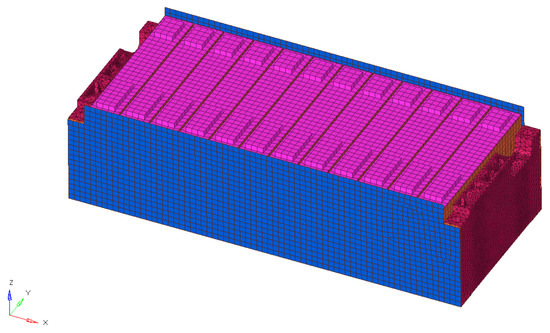
Figure 8.
The finite element mesh for Model 1.
Model 3 used a completely equivalent modeling method. Neither the structure of the aluminum shell nor the multi-layer structure of the jellyroll was considered. Instead, the cell was regarded as a homogenous isotropic material. The density and Poisson’s ratio used in Model 3 were the same as those in Model 2. The parameter to be determined was elastic modulus. In order to make the simulation results and the experimental results match each other better, the range of the elastic modulus could be set between 250 Mpa and 370 Mpa. The next step was to find the best equivalent value of the elastic modulus of the cell in this range. Therefore, the objective function could be determined:
where represents the measured order natural frequency and represents the order natural frequency obtained by simulation. As the application value of the actual natural frequency in engineering decreases with a decreasing order, the coefficients in front of each order decrease step by step, in the objective function, to ensure a good prediction in the first few natural frequencies. The global surface method (GRSM) was used to iterate 100 times between the upper and lower limits of E to find the minimum value of L, so as to obtain the optimal value of the equivalent elastic modulus. The material parameters for Model 1, 2, and 3 could be summarized as Table 4. The Block Lanczos method was used to obtain the first six mode shapes and natural frequencies of the battery module. The obtained data were compared with the experimental results, for analysis in the next section.
Table 4.
Material parameters for Model 1, 2, and 3.
4.3. Comparison between the Experimental and Simulation Results
After the simulation results were obtained, it was found that the mode shape results of Model 1 considering the aluminum shell structure could not match the experimental results, and the first six natural frequencies obtained were obviously larger than the experimental results. This meant that this detailed modeling method for the cell could not properly characterize the dynamic performance of the module. The mode shape results of Model 2 obtained by simulation are shown in Figure 9, which perfectly matched the experimental results. The animations for experimental and simulation mode shape of Model 2 could be found in supplementary materials.
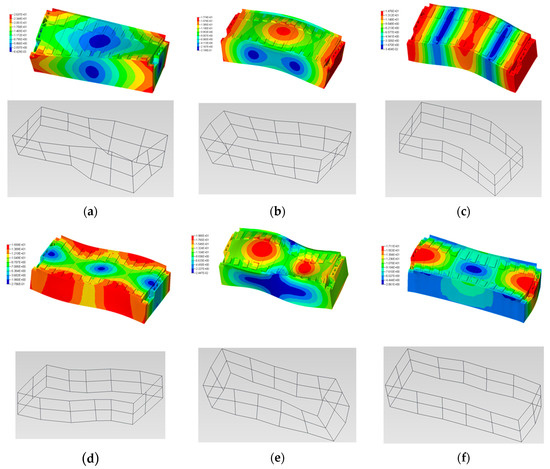
Figure 9.
The comparison of mode shapes between the simulation and experimental results: (a) The first-order mode shape; (b) the second-order mode shape; (c) the third-order mode shape; (d) the fourth-order mode shape; (e) the fifth order mode shape; and (f) the sixth-order mode shape.
Figure 10 shows the curve of the objective function value L as the equivalent elastic modulus of the cell changes. It can be seen from the curve that at E = 297 Mpa, the value of the objective function reached a minimum, and the mode shape results matched the experimental results. This meant that E = 297 Mpa was the global optimal value for the objective function. Another interesting result is shown in Figure 11. The natural frequency of each mode of the battery module increased linearly with the increase of the elastic modulus, and the smallest slope was the second order, followed by the first order, and the fourth order was the largest. The mathematical expression between the natural frequency of the battery module and the elastic modulus of the cell could be obtained. In practical application, this kind of mathematical expression was able to offer guidance for engineers to find the optimal equivalent elastic modulus of the cell, without spending too much computing resources and performing repeated finite element calculations.
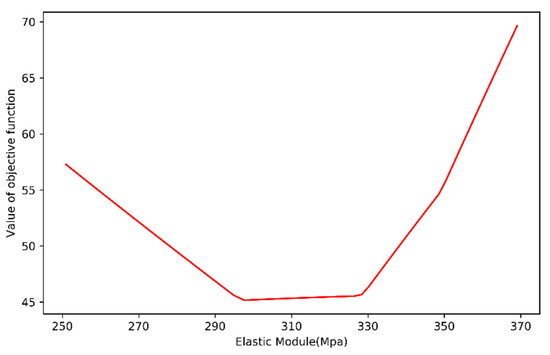
Figure 10.
The objective function value L changes with the value of the equivalent elastic modulus.
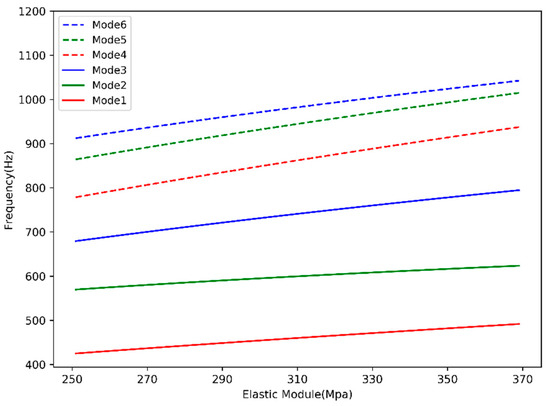
Figure 11.
The natural frequency of each mode of the battery module increased linearly with the increase of the equivalent elastic modulus.
The comparison among the natural frequency obtained by Model 2, Model 3, and the experimental results is shown in Table 5. It can be seen from the table that the largest error of natural frequency was the third-order of Model 3, which was 14.98%, and the smallest error of natural frequency was the fourth-order of Model 3, which was 0.12%. The first-order natural frequency errors of Model 2 and Model 3 were 7.28% and 5.82%, respectively. It could also be calculated that the average error of the first six orders for Model 2 was 9.17% and 7.57% for Model 3. Model 3 was superior to Model 2 in the natural frequency prediction of the first, fourth, fifth, and sixth orders, and was worse than model 2 in the second and third orders. In general, the mode shapes of both Model 2 and Model 3 agreed well with the experimental results. Although Model 2 used a detailed modeling method for the battery cells, considering the layered structure of the jellyroll, the accuracy of prediction of the natural frequency was generally worse than that of Model 3. Therefore, from the perspective of simplicity and accuracy of prediction, Model 3 using the isotropic material could make a more accurate prediction of the modal parameters of the battery module than the Model 2, using the transversely isotropic material.
Table 5.
Comparison of natural frequencies between the experimental and simulation results.
4.4. Error Analysis
The mode shape results obtained through simulation and experiment in this study were completely consistent, but there were some errors in the prediction of natural frequency. The causes of errors might be as follows:
- The gaps between cells and between side plates and cells were observed, which might cause the nonlinearity of the module. However, the experimental and simulation modal analysis in this article were both linear due to the superposition theorem, and the nonlinearity of the module would bring errors to both the experimental and simulation results.
- The different SOC of the cell could cause different measured modal parameters [26]. However, the influence of the SOC of the battery module was not considered in this study.
- The mass of the sensor attached to the module might have caused inaccurate measurement results, and the LDV could be used to obtain more accurate results if the experimental conditions permitted.
- Due to the complexity of the cell, one of the goals of this study was to find an optimized universal numerical model in the simulation modal analysis. The simplified process of the model would inevitably produce some errors.
5. Further Work
In order to understand and solve the vibration problem of battery pack of the NEVs, it was necessary to carry out experimental and simulation analysis, respectively, from the level of cell, battery module, and battery pack. In this paper, the research work was completed at the cell and battery module level. With respect to the standard components of a battery pack, a clear understanding about the cell and battery module could provide guidance for vibration analysis on different types of battery pack. Future work could take a typical commercial battery pack as the research object. The method of determining the parameters of an equivalent elastic modulus of the cell used in this study could be applied to find the optimal equivalent elastic modulus of a battery module when simulating a battery pack. This would allow the finite element model to better interpret the dynamic performance of the battery pack, and the computational resource during the modal and random vibration simulation can be saved. In this way, the simulation results would be more reliable and the development speed of battery packs in engineering could be accelerated. This study did not provide a solution for the prediction of electrochemical performance and failure mechanisms, and the correlation between modal parameters and electrical parameters, such as an SOC, of a battery module was not studied.
6. Conclusions
This study carried out experimental and simulation modal analysis on a typical commercial battery module that fully set forth the dynamic performance of the battery module, and provided guidance for vehicle manufacturers on the design and production of battery modules and battery packs. In addition, an effective modeling method for prismatic cells was proposed, which solved the problem of the material parameters of the cell, which were difficult to determine during the vibration simulation of battery packs, due to the complexity of the cell structure. The main conclusions could be summarized as follows:
- The fundamental frequency of the battery module was greater than the excitation frequency from the ground. The structure of the battery module met the vibration requirements [4].
- Three modeling methods were proposed. The first method was a detailed modeling method that considered the structure of the aluminum shell of the battery cell. However, the obtained modes and frequencies could not match the simulation results. In the second model, the RVE was considered, and it was regarded as a transversely isotropic material, whose parameters were obtained through experiments in the relevant literature [15]. The mode shapes obtained by Model 2 were in good agreement with the experimental results. The error of the third frequency was a maximum of 14.04%, and the others were less than 10%. Model 3 further simplified the structure, and the cell was equivalent to an isotropic material. The optimal equivalent value of the cell’s elastic modulus E = 297 Mpa was obtained by optimizing the objective function. The mode shapes and natural frequencies matched well with the experimental results, and matched even better with Model 2, in the frequency prediction of the first, fourth, fifth, and sixth.
- The battery cell and module are considered to be anisotropic material in crashworthiness analysis, in some of the research. However, in the simulation modal analysis of the module, it was proved that the modeling of the cell did not need to consider the inner complex structure. The vibration behavior of the battery module could be predicted more accurately when the cell was treated as a homogenous isotropic material. It could safely be derived that it was better to treat the module as a homogenous isotropic material when performing the vibration simulation on battery packs.
- It could be observed that the natural frequencies of the battery module varied linearly with the equivalent elastic modulus of the cell in Model 3. This feature could be used in the engineering field without spending a lot of computing resource on repeated finite element calculations, and can be used to quickly find the effective equivalent parameters.
Supplementary Materials
The following are available online at https://www.mdpi.com/1996-1073/13/8/2046/s1, Video: Comparison of mode shape animations between experiment and simulation.
Author Contributions
B.X. and F.L. design the experiments and analyzed the data; F.L. and C.X. performed the experiments; Y.L. provided simulation guidance; Y.L., W.Z., and W.W. prepared necessary materials for experiments; F.L. wrote the paper. All authors have read and agreed to the published version of the manuscript.
Funding
This research was funded by the Shenzhen Economic, Trade, and Information Commission of Shenzhen Municipality Strategic Emerging Industries and Future Industrial Development “Innovation Chain + Industrial Chain” Project (2017) and the National Natural Science Foundation of China (Grant No. 51877120).
Conflicts of Interest
The authors declare no conflict of interest.
Abbreviations
| NEV | New energy vehicle | Residue matrix | |
| EMA | Experimental modal analysis | FRF for a particular ij location | |
| NMC | Nickel manganese cobalt oxide | Scaling factor | |
| BMS | Battery management system | Value of mode shape at the i DOF | |
| Li-ion | Lithium-ion | Value of mode shape at j DOF | |
| SOC | State of charge | Residue | |
| RVE | Representative volume element | Variance of natural frequency (Hz) | |
| MDOF | Multiple degree of freedom | Variance of damping ratio | |
| SDOF | Single degree of freedom | Elastic modulus (Mpa) | |
| FRF | Frequency response function | Shear modulus (Mpa) | |
| LDV | Laser doppler vibrometer | Shear strain | |
| GRSM | Global surface method | Shear stress (Mpa) | |
| Mathematical notation-symbols and units | Tensile strain | ||
| Mass matrix (Kg) | Tensile stress (Mpa) | ||
| Damping matrix | Poisson’s ratio | ||
| Stiffness matrix (Nm−1) | Density (t/mm3) | ||
| Vector of displacement (m) | Damping ratio | ||
| Laplace variable | Measured natural frequency (Hz) | ||
| Force vector (N) | Natural frequency obtains by simulation (Hz) | ||
| System transfer function | Value of objective function | ||
| Pole of system | |||
| Mode shape vector | |||
| Equivalent mass (Kg) | |||
References
- Du, J.Y.; Meng, X.F.; Li, J.Q.; Wu, X.G.; Song, Z.Y.; Ouyang, M.G. Insights into the characteristics of technologies and industrialization for plug-in electric cars in China. Energy 2018, 164, 910–924. [Google Scholar] [CrossRef]
- Weiller, C.; Neely, A. Using electric vehicles for energy services: Industry perspectives. Energy 2014, 77, 194–200. [Google Scholar] [CrossRef]
- Axsen, J.; Burke, A.F.; Kurani, K.S. CHAPTER SIXTEEN-Batteries for PHEVs: Comparing Goals and the State of Technology. In Electric and Hybrid Vehicles; Pistoia, G., Ed.; Elsevier: Amsterdam, The Netherlands, 2010; pp. 405–427. [Google Scholar] [CrossRef]
- Hooper, J.M.; Marco, J. Understanding Vibration Frequencies Experienced by Electric Vehicle Batteries. In Proceedings of the IET Hybrid and Electric Vehicles Conference 2013 (HEVC 2013), London, UK, 6–7 November 2013; pp. 1–6. [Google Scholar]
- Zhang, L.; Ning, Z.; Peng, H.; Mu, Z.; Sun, C. Effects of Vibration on the Electrical Performance of Lithium-Ion Cells Based on Mathematical Statistics. Appl. Sci. 2017, 7, 802. [Google Scholar] [CrossRef]
- Brand, M.J.; Schuster, S.F.; Bach, T.; Fleder, E.; Stelz, M.; Glaser, S.; Muller, J.; Sextl, G.; Jossen, A. Effects of vibrations and shocks on lithium-ion cells. J. Power Sources 2015, 288, 62–69. [Google Scholar] [CrossRef]
- Hooper, J.M.; Marco, J. Experimental modal analysis of lithium-ion pouch cells. J. Power Sources 2015, 285, 247–259. [Google Scholar] [CrossRef]
- Ruiz, V.; Pfrang, A.; Kriston, A.; Omar, N.; Van den Bossche, P.; Boon-Brett, L. A review of international abuse testing standards and regulations for lithium ion batteries in electric and hybrid electric vehicles. Renew. Sustain. Energy Rev. 2018, 81, 1427–1452. [Google Scholar] [CrossRef]
- Sahraei, E.; Hill, R.; Wierzbicki, T. Calibration and finite element simulation of pouch lithium-ion batteries for mechanical integrity. J. Power Sources 2012, 201, 307–321. [Google Scholar] [CrossRef]
- Jezowski, P.; Kowalczewski, P.L. Starch as a Green Binder for the Formulation of Conducting Glue in Supercapacitors. Polymers 2019, 11, 1648. [Google Scholar] [CrossRef]
- Boeckenfeld, N.; Jeong, S.S.; Winter, M.; Passerini, S.; Balducci, A. Natural, cheap and environmentally friendly binder for supercapacitors. J. Power Sources 2013, 221, 14–20. [Google Scholar] [CrossRef]
- Choudhury, N.A.; Northrop, P.W.C.; Crothers, A.C.; Jain, S.; Subramanian, V.R. Chitosan hydrogel-based electrode binder and electrolyte membrane for EDLCs: Experimental studies and model validation. J. Appl. Electrochem. 2012, 42, 935–943. [Google Scholar] [CrossRef]
- Varzi, A.; Raccichini, R.; Marinaro, M.; Wohlfahrt-Mehrens, M.; Passerini, S. Probing the characteristics of casein as green binder for non-aqueous electrochemical double layer capacitors’ electrodes. J. Power Sources 2016, 326, 672–679. [Google Scholar] [CrossRef]
- Liu, B.; Jia, Y.; Yuan, C.; Wang, L.; Gao, X.; Yin, S.; Xu, J. Safety issues and mechanisms of lithium-ion battery cell upon mechanical abusive loading: A review. Energy Storage Mater. 2020, 24, 85–112. [Google Scholar] [CrossRef]
- Ali, M.Y.; Lai, W.J.; Pan, J. Computational models for simulations of lithium-ion battery cells under constrained compression tests. J. Power Sources 2013, 242, 325–340. [Google Scholar] [CrossRef]
- Choi, H.Y.; Lee, I.; Lee, J.S.; Kim, Y.M.; Kim, H. A study on mechanical characteristics of lithiumpolymer pouch cell battery for electric vehicle. In Proceedings of the 23rd International Technical Conference on the Enhanced Safety of Vehicles, Seoul, Korea, 27–30 May 2013. No. 13-0115. [Google Scholar]
- Lai, W.-J.; Ali, M.Y.; Pan, J. Mechanical behavior of representative volume elements of lithium-ion battery cells under compressive loading conditions. J. Power Sources 2014, 245, 609–623. [Google Scholar] [CrossRef]
- Sahraei, E.; Campbell, J.; Wierzbicki, T. Modeling and short circuit detection of 18650 Li-ion cells under mechanical abuse conditions. J. Power Sources 2012, 220, 360–372. [Google Scholar] [CrossRef]
- Ali, M.Y.; Lai, W.J.; Pan, J. Computational models for simulation of a lithium-ion battery module specimen under punch indentation. J. Power Sources 2015, 273, 448–459. [Google Scholar] [CrossRef]
- Amodeo, C.M.; Ali, M.Y.; Pan, J. Computational models for simulations of lithium-ion battery modules under quasi-static and dynamic constrained compression tests. Int. J. Crashworthiness 2017, 22, 1–14. [Google Scholar] [CrossRef]
- Fangyuan, S.; Huili, Y.; Xianqing, C.; Taisong, C.; Hui, Z.; Xiangnan, S. Mechanical Performance Study of Lithium-ion Battery Module Under Dynamic Impact Test. In Proceedings of the 19th Asia Pacific Automotive Engineering Conference & SAE-China Congress 2017, Shanghai, China, 24–26 October 2017; pp. 1–11. [Google Scholar]
- Abada, S.; Marlair, G.; Lecocq, A.; Petit, M.; Sauvant-Moynot, V.; Huet, F. Safety focused modeling of lithium-ion batteries: A review. J. Power Sources 2016, 306, 178–192. [Google Scholar] [CrossRef]
- Kermani, G.; Sahraei, E. Review: Characterization and Modeling of the Mechanical Properties of Lithium-Ion Batteries. Energies 2017, 10, 1730. [Google Scholar] [CrossRef]
- Zhu, J.; Wierzbicki, T.; Li, W. A review of safety-focused mechanical modeling of commercial lithium-ion batteries. J. Power Sources 2018, 378, 153–168. [Google Scholar] [CrossRef]
- Popp, H.; Glanz, G.; Alten, K.; Gocheva, I.; Berghold, W.; Bergmann, A. Mechanical Frequency Response Analysis of Lithium-Ion Batteries to Disclose Operational Parameters. Energies 2018, 11, 541. [Google Scholar] [CrossRef]
- Berg, P.; Soellner, J.; Herrmann, M.; Jossen, A. Structural dynamics of lithium-ion cells—Part II: Investigation of large-format prismatic cells and method evaluation. J. Energy Storage 2020, 28, 101246. [Google Scholar] [CrossRef]
- Berg, P.; Soellner, J.; Jossen, A. Structural dynamics of lithium-ion cells—Part I: Method, test bench validation and investigation of lithium-ion pouch cells. J. Energy Storage 2019, 26, 17. [Google Scholar] [CrossRef]
- Zhang, X.W.; Wierzbicki, T. Characterization of plasticity and fracture of shell casing of lithium-ion cylindrical battery. J. Power Sources 2015, 280, 47–56. [Google Scholar] [CrossRef]
- Cannarella, J.; Liu, X.Y.; Leng, C.Z.; Sinko, P.D.; Gor, G.Y.; Arnold, C.B. Mechanical Properties of a Battery Separator Under Compression and Tension. J. Electrochem. Soc. 2014, 161, F3117–F3122. [Google Scholar] [CrossRef]
- Wierzbicki, T.; Sahraei, E. Homogenized mechanical properties for the jellyroll of cylindrical Lithium-ion cells. J. Power Sources 2013, 241, 467–476. [Google Scholar] [CrossRef]
- Greve, L.; Fehrenbach, C. Mechanical testing and macro-mechanical finite element simulation of the deformation, fracture, and short circuit initiation of cylindrical Lithium ion battery cells. J. Power Sources 2012, 214, 377–385. [Google Scholar] [CrossRef]
- Lai, W.-J.; Ali, M.Y.; Pan, J. Mechanical behavior of representative volume elements of lithium-ion battery modules under various loading conditions. J. Power Sources 2014, 248, 789–808. [Google Scholar] [CrossRef]
- Tang, L.; Zhang, J.; Cheng, P. Homogenized modeling methodology for 18650 lithium-ion battery module under large deformation. PLoS ONE 2017, 12. [Google Scholar] [CrossRef]
- Hong, S.-K.; Epureanu, B.I.; Castanier, M.P. Parametric reduced-order models of battery pack vibration including structural variation and prestress effects. J. Power Sources 2014, 261, 101–111. [Google Scholar] [CrossRef]
- Nam, W.; Kim, J.-Y.; Oh, K.-Y. The characterization of dynamic behavior of Li-ion battery packs for enhanced design and states identification. Energy Convers. Manag. 2018, 162, 264–275. [Google Scholar] [CrossRef]
- Avitabile, P. Modal Testing: A practitioner’s Guide; John Wiley & Sons: Hoboken, NJ, USA, 2017; pp. 1–544. [Google Scholar]
- Praticò, L.; Galos, J.; Cestino, E.; Frulla, G.; Marzocca, P. Experimental and numerical vibration analysis of plates with curvilinear sub-stiffeners. Eng. Struct. 2019, 209, 109956. [Google Scholar] [CrossRef]
- Tim.Mila. What Modal Impact Hammer Should I Use. Available online: https://community.sw.siemens.com/s/article/what-modal-impact-hammer-tip-should-i-use (accessed on 21 February 2020).
- ASTM E1876-15. Standard Test Method for Dynamic Young’s Modulus, Shear Modulus, and Poisson’s Ratio by Impulse Excitation of Vibration; ASTM International: West Conshohocken, PA, USA, 2015. [Google Scholar]
- Buiochi, F.; Andrade, M.A.B.; Perez, N.; Adamowski, J.C. 2.04-Ultrasonic Characterization of Anisotropic Materials. In Comprehensive Materials Processing; Hashmi, S., Batalha, G.F., Van Tyne, C.J., Yilbas, B., Eds.; Elsevier: Oxford, UK, 2014; pp. 65–81. [Google Scholar] [CrossRef]


© 2020 by the authors. Licensee MDPI, Basel, Switzerland. This article is an open access article distributed under the terms and conditions of the Creative Commons Attribution (CC BY) license (http://creativecommons.org/licenses/by/4.0/).