Article

Replacement Strategy of Insulators Established by Probability of Failure

1
College of Information and Communication Engineering, Sungkyunkwan University, Suwon 16419, Gyeonggi-Do, Korea
2
2KEPCO Research Institute, Daejeon 34056, Korea
*
Authors to whom correspondence should be addressed.
Energies 2020, 13(8), 2043; https://doi.org/10.3390/en13082043
Submission received: 10 March 2020 / Revised: 9 April 2020 / Accepted: 16 April 2020 / Published: 20 April 2020

Abstract

:
Insulators comprise only 5% of the capital cost of transmission lines; they are accountable for 70% of line interruptions and 50% of maintenance costs of transmission lines. Major transmission lines situated in different parts of the world were mostly all constructed 30 years ago. These lines have either completed or are approaching the active life at 30 years. It is not possible to replace all insulators at a time in any utility. From a standpoint of consistency, it is quite important to locate insulators that require replacement prior to the occurrence of failure. Recalling these issues, a replacement strategy was modeled on insulator samples, operated at 154 kV, mechanical and electrical rating (M+E) 25,000 lbs and within the 10–50 years (Y) age group, collected in bulk for laboratory evaluation, based on the probability of mechanical failure (P(F)) of insulators. For conducting these studies, tensile load test such as combined electrical and mechanical failing load test was performed on selected 30 new and aged porcelain insulator samples from bulk to access recent condition. It was observed that insulators under service for 50 years manifested a decrease of 89.3% in quality factor (K), as compared to insulators within 10 years of service. A micro-structural study was carried out by using an optical microscope (OM) and a scanning electron microscope (SEM) for the further confirmation of previous evaluations. P(F) was derived by implementing Weibull distribution on the experimental observations. It was observed that insulators with an age of 50 years depicted a 2.7% increase in P(F), as compared to insulators with an age of 10 years. This article discussed a strategy for accessing the recent condition of new, aged bulk samples and the criteria of the replacement of the insulator string based on P(F).

1. Introduction

Insulators serve the bi-fold function of supporting conductor and provide isolation electrically from the ground. The mechanical strength is dependent on the porcelain body and bonding between the hardware and porcelain. Electrical strength depends on operating voltage and transient over voltages that occur during lightning or switching operations. Major transmission lines situated in different parts of the world have been mostly constructed over 30 years ago [1]. The performance of insulators has been considerably successful up until now, in South Korea. The rate of failure is lower than 5% annually. The reliability and durability of insulators are quite essential for the efficient performance of lines. Although insulators comprise only 5% of capital cost, they are accountable for 70% of line interruptions and 50% of maintenance costs of transmission lines [2,3,4,5,6,7]. More than 90% of studies have reported the active life of insulators to be approximately 30 years. Transmission lines have either completed or are approaching active life at 30 years [7]. It is not possible to replace all insulators at a time in any utility. Locating deteriorated insulators before failure has been proven to be quite critical. Annual inspection of utilities is quite common. Only insulators with external damages can be located through visual inspection. Internal damages will increase with the aging of porcelain insulators, which lead to the final failure of insulators.
In the past, electrical defects in insulators were detected by the measurement of insulation resistance and the measurement of the electric field of the defective insulator with a normal one [8,9,10]. In order to locate mechanical defects, techniques such as ultrasonic wave method with ultrasonic probes, measurement of noise using contactless microphones and measurement of temperature by implementing infrared cameras were discussed in the literature [11,12,13,14]. Recently, damage assessment through the imaging of an insulator by using an unmanned aerial vehicle, frequency response signals, computed tomography and magnetic resonance imaging were also investigated [15]. First of all, these techniques are highly dependent on illumination, temperature, humidity and solar flux. Moreover, they are quite costly, complex and time consuming. Consequently, these techniques neither evaluate the intensity of damage nor provide any reference for replacement of insulators. To deal with this problem, a replacement strategy was outlined, based on the probability of mechanical failure (P(F)) of insulators.
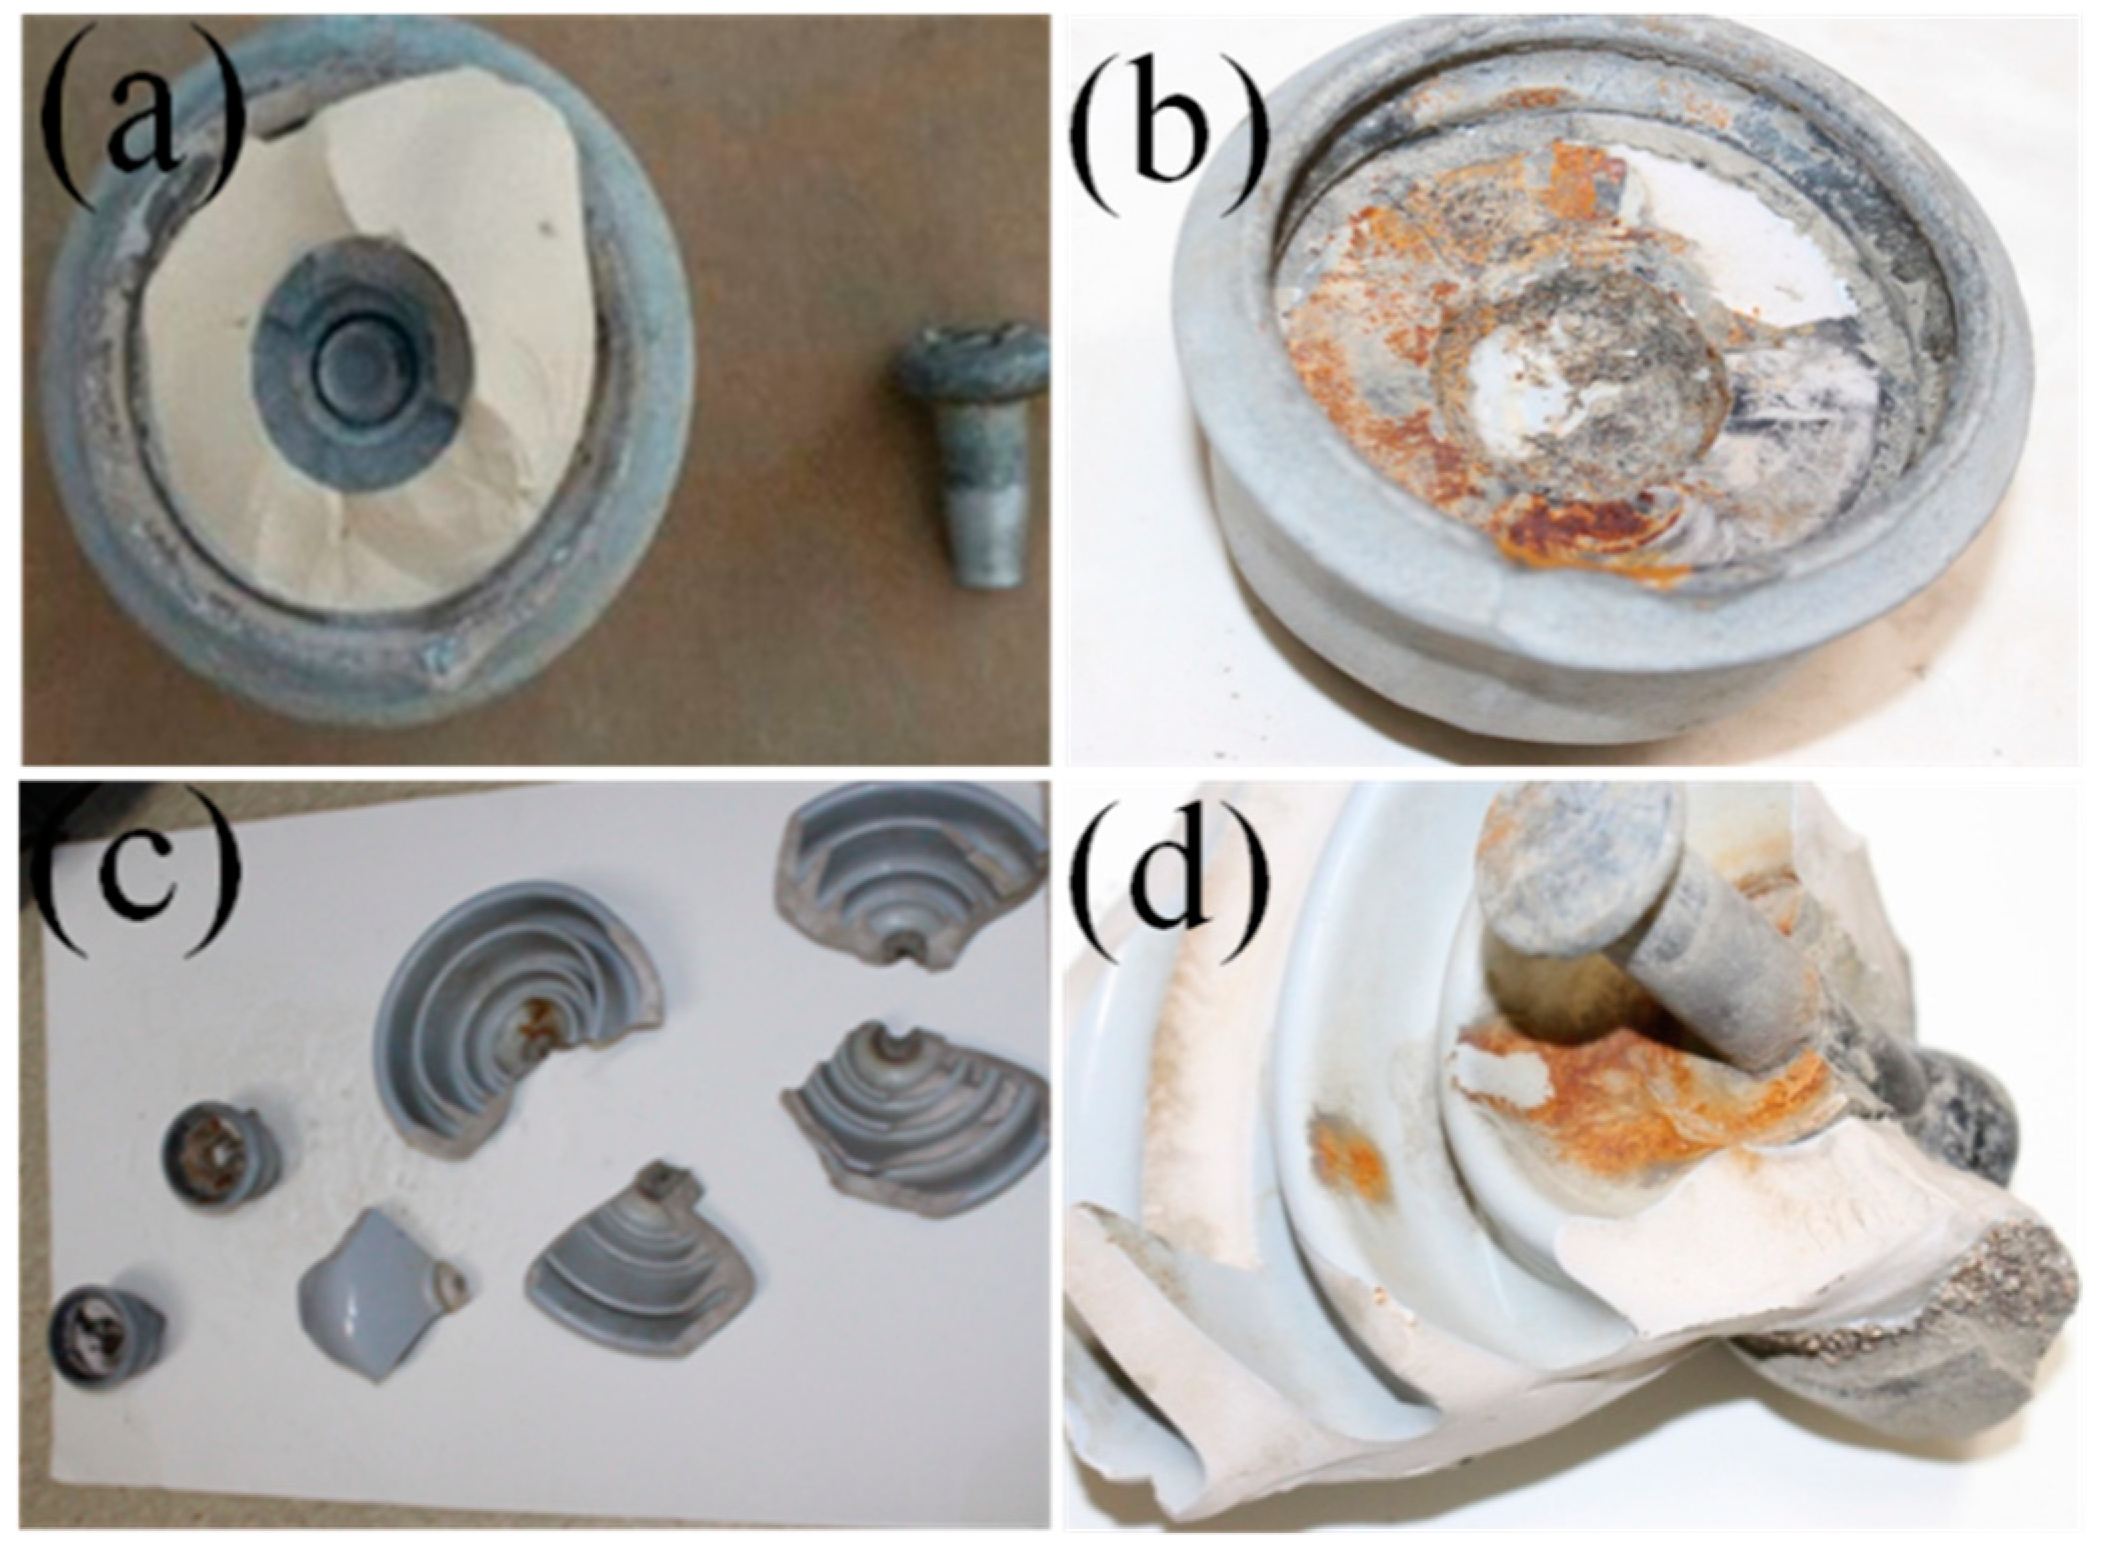
To begin with, porcelain insulator samples which required laboratory evaluation were collected in bulk from different utilities operating at 154 kV, within the age group of 10–50 Y, located in South Korea. A failure mechanism study was performed on 30 selected porcelain insulator samples from bulk collected samples, with traces of visual damage. The insulators selected showed different types of visual damage. Few depict heavy rust on metal cap; in some cases, the porcelain body is damaged, others show heavy rust on pin and few show a damaged cement surface. Some samples of the insulator can be seen in Figure 1. The specifications of collected samples were shown in Table 1, where South Korea was denoted by S.K.A tensile load test was implemented on collected new and aged insulators, for accessing the recent condition. A micro-structural study was carried out further to justify mechanical failure results. The mechanical strength of insulators depends on porcelain body and interface between cement, hardware and porcelain. Thus, the microstructure study of metal parts and cement is equally important as the porcelain body one [16].
Furthermore, Weibull was implemented to calculate P(F), as it is impossible to evaluate aging from a couple of trials. Thus, Weibull distribution was adapted with experimental ones. According to Dr. Robert B, the primary advantage of Weibull analysis is the capability to anticipate failure analysis with quite small samples. Besides, solutions are achievable at the initial indications of the problem. Another benefit associated with Weibull analysis is that it contributes a simple and feasible graphical plot of the failure data. The data plot analysis is extremely important to the researchers [17,18,19,20,21]. As reported by Dr. Robert, the two significant parameters of the Weibull plot are the slope i.e., α, and the characteristic life or scale factor, β. The slope of the line, α, is specifically significant and may provide a trace to the physics of the failure. This tool can also be applied to predict a number of failures that will occur in a future period of time.
The failure study of randomly collected porcelain insulators was reported earlier. Past works reported failure studies in collected insulators from different places, by implementing different experiments like power arc, tensile load test, dielectric puncture test and microstructural studies, to evaluate the present condition of collected insulators. However, these authors have not commented on whether the parent population of deteriorated insulators should be removed or not. Cherney et al. reported an article related to the replacement of porcelain insulators. Failure studies were performed on collected insulators, based on mechanical tests. The normal distribution was implemented on experimental data, to decide whether the replacement of the parent population was required or not. The average of the mechanical and electrical (M+E) rating of insulators from different manufacturers were calculated and compared with rated M+E. However, they did not provided any reference (limit), nor did they generalize their research strategy. This article analyzes the recent condition of new and aged bulk samples based on mechanical load test and microstructural studies. Weibull distribution was implemented on experimental results to calculate the probability of mechanical failure P(F). The criteria for the replacement of parent insulator strings based on probability of mechanical failure P(F) were established. This article is focused on outlining a strategy for deciding the replacement of insulator strings when large samples are available for laboratory evaluation [22]. The first part of this article studied different mechanical failure modes and the relation between mechanical strength and microstructural changes based on aging. The later part was focused on the calculation of P(F), the relation between failure load, P(F) and the replacement strategy based on reference P(F).

2. Experimental Methods

Aging is a complex procedure for high-voltage (HV) insulators, due to the merged response of the individual components of the insulator from electrical, mechanical and environmental stresses. Utilities are showing high concerns regarding the evaluation of insulators to prevent sudden failure.
Insulators depicting external damage, such as huge cracks, shattered shells, or highly corroded metal parts, could be easily visible. However, some severe internal damages could be invisible. Thus, experiments are usually necessary for a conclusive evaluation. First of all, for laboratory evaluation purposes, bulk samples were collected from different utilities in South Korea. All collected samples were removed from utilities operated at 154 kV, aged 10–50 Y and M+E rating 25,000 lbs. Thirty samples were selected from bulk, based on visual traces of damage. These samples were divided into three age groups, such as 10 Y, 30 Y and 50 Y. Tensile load tests were conducted on 30 selected samples to evaluate the recent mechanical strength of samples. Tensile load test was conducted on each service group i.e., 10 Y, 30 Y and 50 Y, as per international standards (ANSI). The set up for the tensile load test is shown in Figure 2. An Instron TM hydraulic machine with a maximum capacity of 45,000 lbs was used. The maximum load was exceeded to 25,000 lbs and fixed for one minute, after that load was increased smoothly until the failure of the insulators. The result of the experiment was tabulated in Table 2, along with the location of the failure. Overall, 50% of the samples within the age group 50 Y, and 20% within the age group 30 Y were failed below rated value. All the samples that completed only 10 years of age failed above the rated value. Even 20% of samples within age 50 years failed the proof load test. The mechanical strength in the age group of 50 Y has been degraded more, as compared to other cases. Varieties of failure mode can be observed, such as separation of cap from body, separation of pin and shattering of porcelain body, as shown in Figure 3.
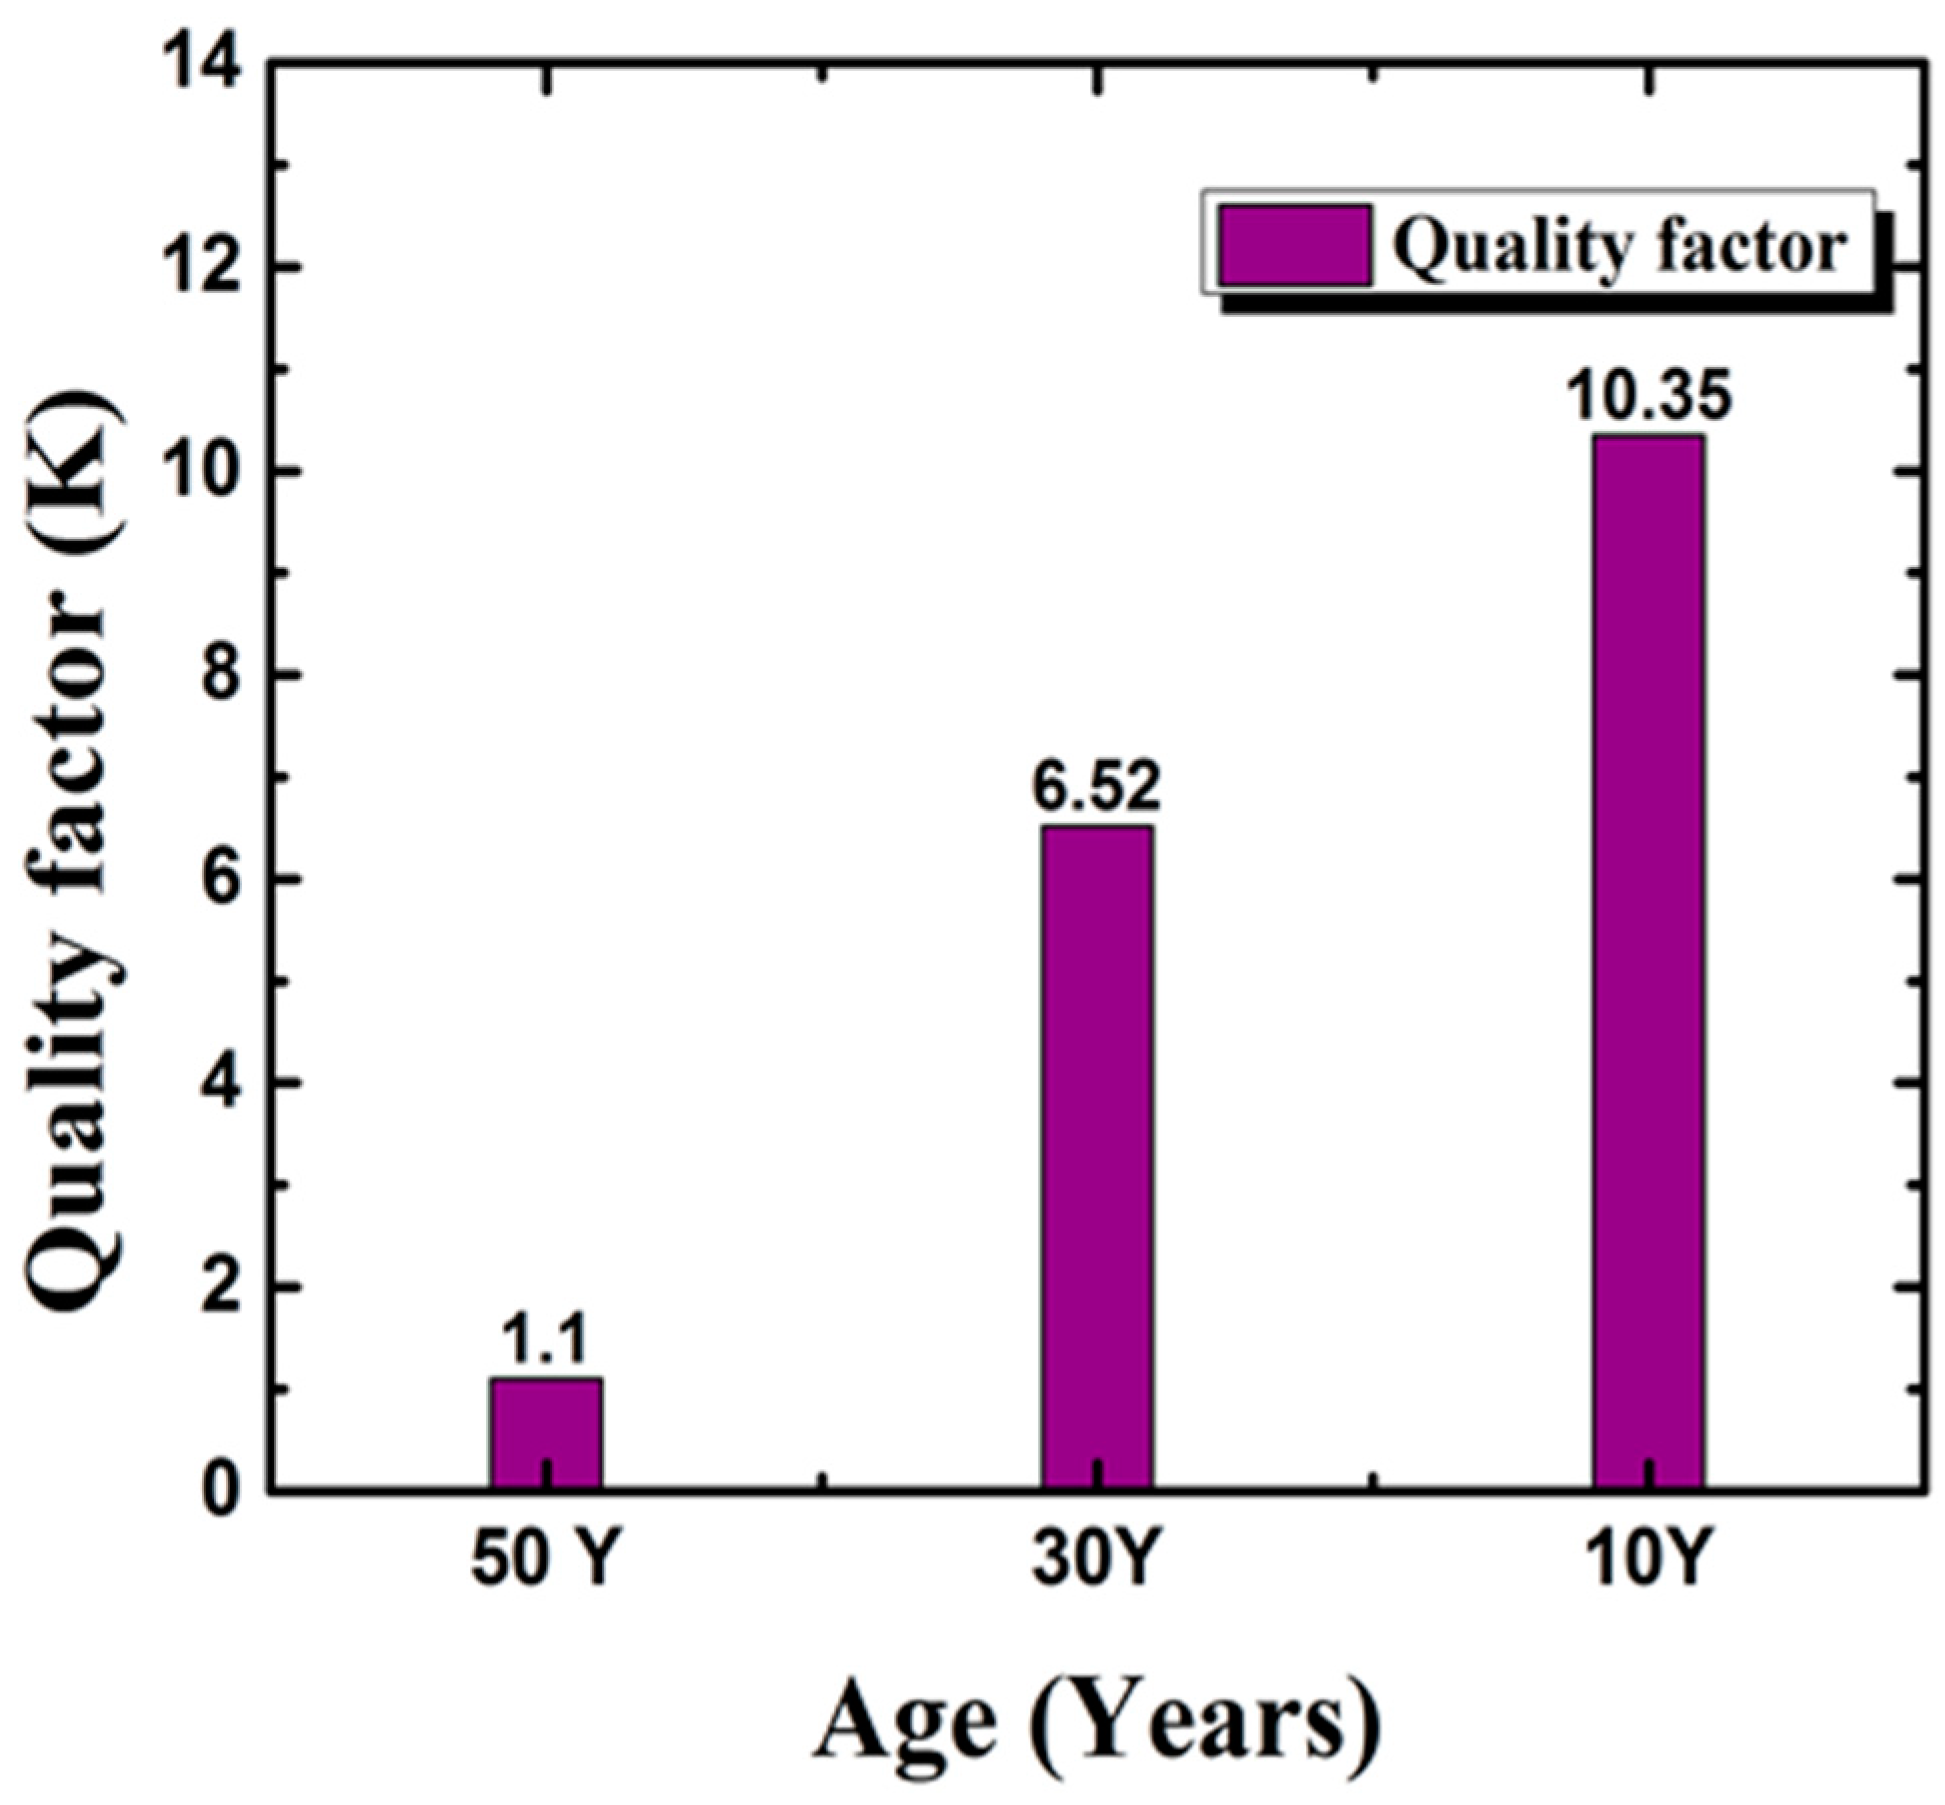
The factors responsible for mechanical strength are porcelain body and the interface between cement, hardware and porcelain. The Korea Electric Power Research Institute (KEPRI) reported a reference factor known as quality factor (K), to evaluate the mechanical strength of porcelain insulators [23,24,25,26,27,28,29]. K, which evaluates porcelain insulators mechanically and electrically, was calculated by using Equation (1) for all age groups of samples, for the prevention of sudden mechanical failure of insulators.
K = Q M Q A Y U
where QM is the initial quality index, QA is the current quality index, and Yu is the remaining lifetime, for passing the mechanical load test K ≥ 3. For insulators with the age group 50 Y, K was calculated as 1.10. For insulators with the group 10 and 30 Y, K was calculated as 10.35 and 6.52, respectively. It is clear from the K value of Figure 4 that insulators within the age group 50 Y failed the load test, unlike that of insulators within the age group 10–30 Y.
However, for the calculation of K three factors such as QM: initial quality index, QA: current quality index and Yu: the remaining lifetime should be known. These factors are not universally known and basically used in Korea. Therefore, K could not be employed as a reference for mechanical failure.

3. Results and Discussions

3.1. Microstructural Study of Aged Porcelain Insulator

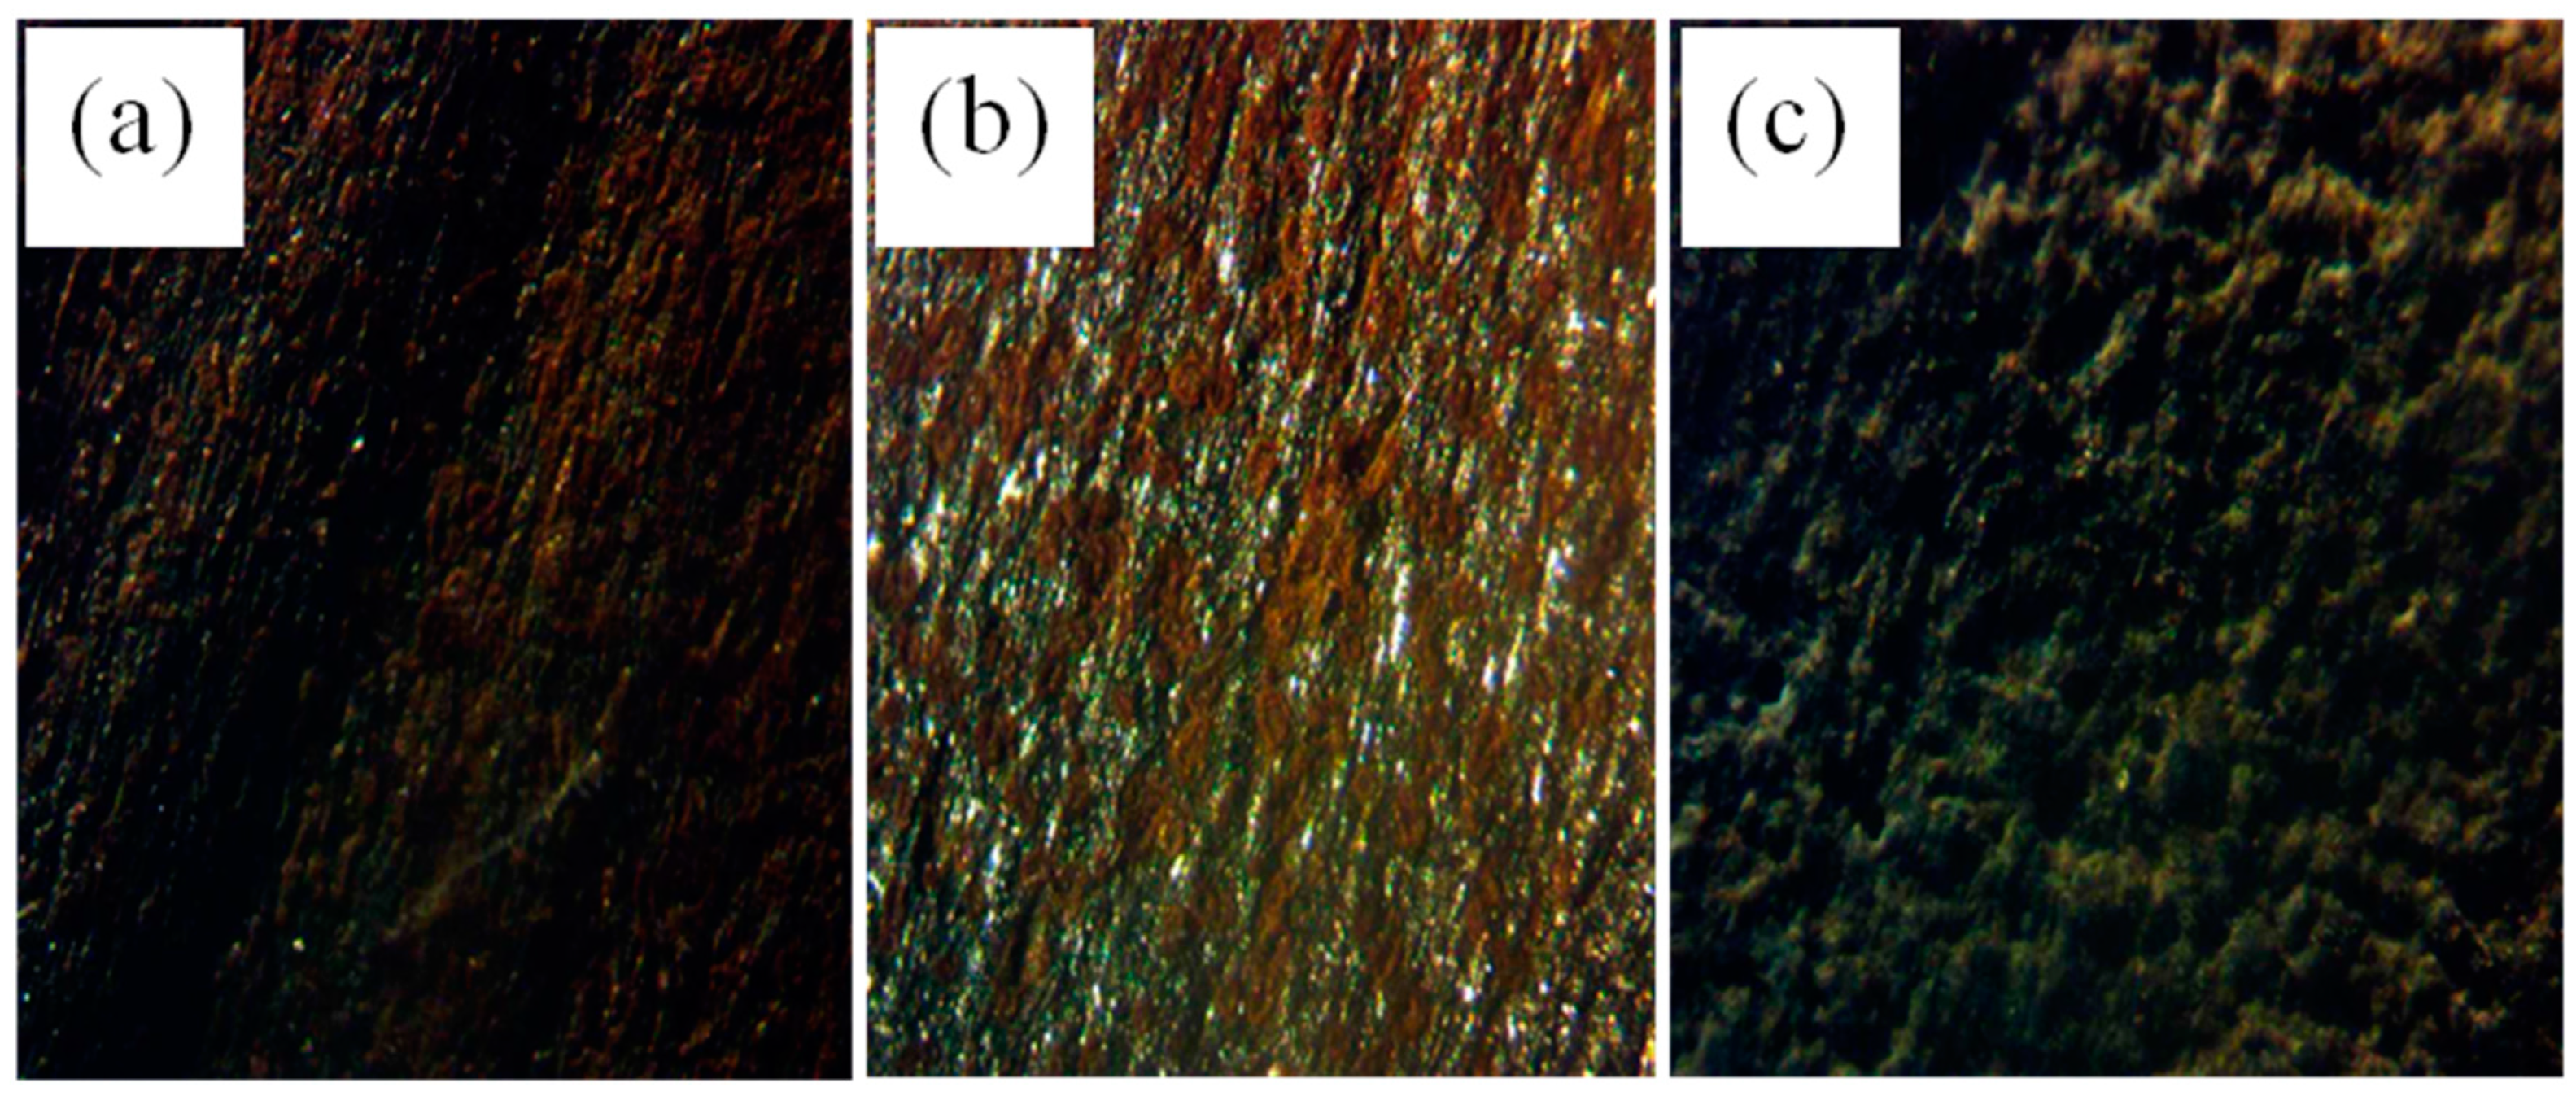
For many years, porcelain insulators have been exposed to constant mechanical and electrical stresses. These stresses can cause defect formation, degradation of electrical performance and reduction of mechanical strength in porcelain insulators. A micro-structural study was performed to understand the degree of deterioration in new and aged porcelain insulators. The motive for microstructural study was to understand the reason of failure of highly aged insulators. Aging leads to microstructural deformation. OM and SEM images were used to study the microstructural defects of samples due to aging. The porcelain insulator consists of the metal cap, porcelain, cement and pin. Damage in any part of the porcelain insulator can lead to the failure of the insulators [30,31,32]. Corrosion in metallic parts weakens the bonding between metallic parts with cement. This could lead to the separation of the metal cap or pin from porcelain insulators during surge conditions. Randomly insulator samples from each age group within 30 selected samples were chosen to capture OM images of the metal cap, cement surface and SEM images of porcelain body of porcelain insulators. The metal caps of samples aged 50 years show the highest amount of rust on metal cap surface as compared to other insulator samples. Figure 5 depicts the OM images of the metal cap of the porcelain insulator within the age groups 50, 30 and 10 Y.
Cement provides basically mechanical support and binds all parts of the insulator together. The volume expansion of cement can lead to high stress inside the pin cavity of the insulator. This stress can generate radial cracks in the shell and cracks in cement. Initially, cracks could be seen in the cement surface, and will transmit to the shell eventually. These cracks were developed after many years of service, due to the accumulation of moisture in the cement [33]. Moreover, cracks in the cement start to weaken the bonding between the pin, dielectric shell and cement, that lead to separation of the parts during the surge condition.
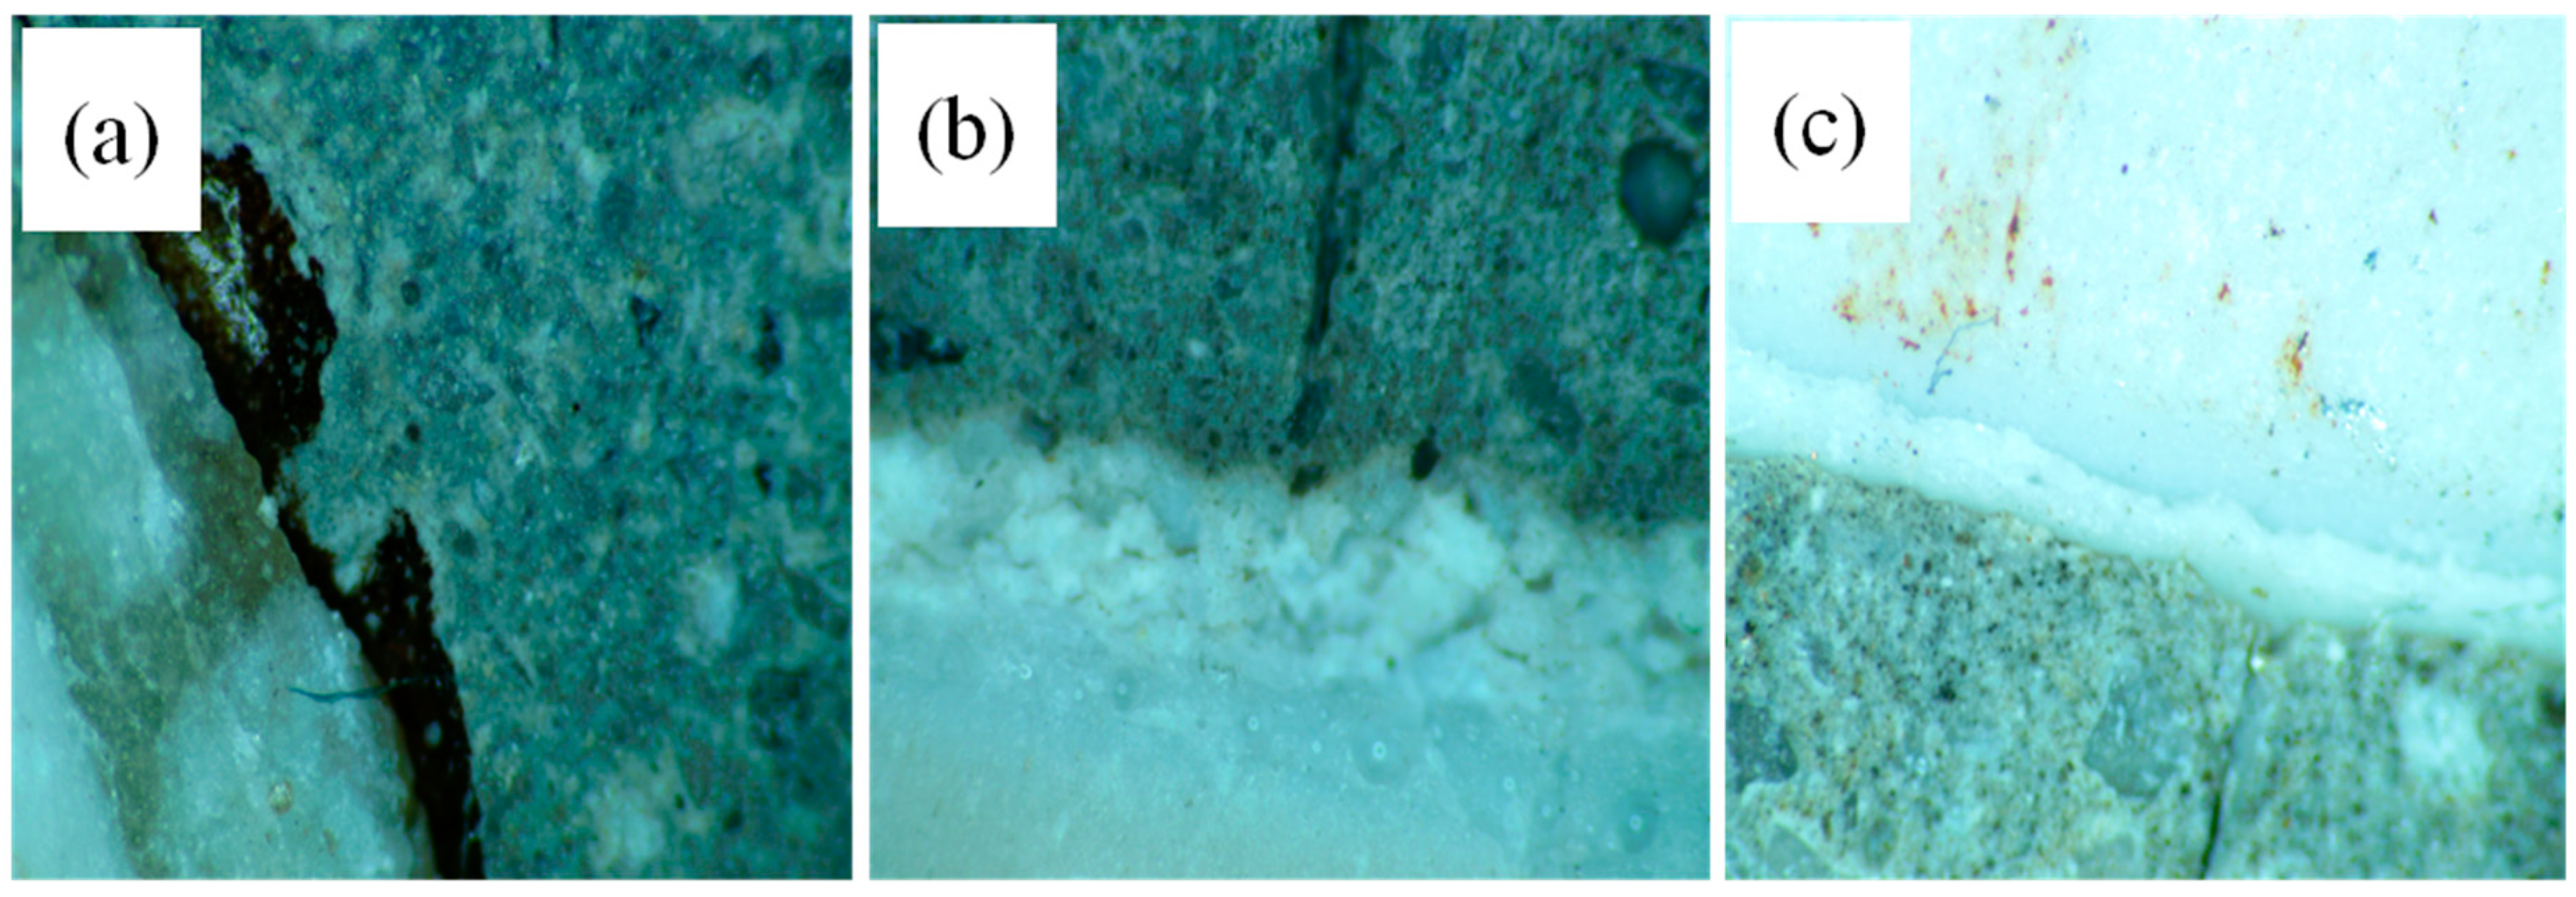
Cement surrounding the metal parts and porcelain-cement interface were studied by an optical microscope. Figure 6 depicts an insulator aged 50 Y, showing interconnected cracks with a combined length of 2200.61 µm and widths of 129.48 µm, 211.88 µm, and one void of length 442.86 µm and width 449.54 µm, in the cement surface. Insulators within 30 years of age show smaller cracks of length; 101.52 µm, 178.17 µm and 242.8 µm. A higher number of cracks and voids in the cement surface make insulators more vulnerable to mechanical failure.
Figure 7 depicts the OM images of the porcelain-cement interface of three cases of porcelain insulators. In the case of the 50 years sample, there are wide cracks in the porcelain-cement interface, which can lead to detachment of the metal cap and shell during surge conditions. However, insulators spent 30 years of service depicting traces of cracks in the interface. Newly aged insulators that have completed only 10 years of service did not show any cracks in the porcelain-cement interface.
Sometimes, lightning and switching surge impulses experienced by insulators could be higher than their flashover voltage. This could lead to a dielectric puncture. Generally, punctures were developed inside the inner portion of the shell head, due to the highest electric stress across it. These punctures or pores could be transformed into cracks with increasing electric stress or surge conditions. Even moisture accumulation in the shell could be a reason for the transformation of the puncture into cracks. Randomly, samples within each of the groups10 Y, 30 Y and 50 Y were selected and studied by SEM, Hitachi and Horiba/S4800. For preparation of the sample, porcelain is cut into 1 cm3 with the help of a water jet. Samples were coated with 10–15 nm thick platinum layers. Figure 8 shows the SEM images of the porcelain surface of aged and new porcelain insulators.
The insulators which had completed 50 years of service were highly porous as compared to the insulators which had completed 10 years of service. The lifetime of the porcelain insulator is highly dependent on the local environment of the installation site. The nature of pollutants, direction of wind, temperature, occurrence of rain or snow fall all affect the lifetime of porcelain insulators. These factors are responsible for the extent and rate of degradation of insulators. It is highly possible that two insulators possessing the same rating, age and manufacturing specifications, however different their installation site (rural and industrial), will reveal different lifetimes [34].

3.2. Statistical Assessment of Porcelain Insulators to Decide Guidelines Based on Experimental Observations

This section is focused on replacement strategy based on the calculation of P(F). The in-service inspection of aged lines is generally carried to diagnose the recent condition of the aged line, to decide whether replacement is required, or not, to prevent sudden failure. Obviously, in case the visual inspection depicts a large number of excessively damaged units, the line will be considered dead and a replacement will be suggested without lab evaluation. However, if visual damages are not very high or prominent, but the age of the utility is approaching 30 or beyond, the line has faced an extensive surge condition, the location of the installation is highly humid and polluted, or component failure cases occur. A laboratory evaluation of such utilities is quite essential. The concern of this article deals with modeling a replacement strategy for a later situation. P(F) was calculated for all selected 10 samples from each service group.
Weibull distribution was adapted to calculate P(F). The best advantage of Weibull distribution is that it predicts accurately, even with a smaller number of samples (n < 20). In this article, 10 samples of each age group, 50, 30 and 10 Y, were studied. For the proper statistical study, a strategy should be followed. First of all, data should be arranged in ascending order. A rank was assigned to each data from i = 1 to n. The adequacy of the Weibull plot could be checked by plotting a cumulative percent failure with a failure load. Data distributed by following Weibull distribution should lie approximately on a straight line. Some random variations from the straight line are acceptable, as the study was performed on only 10 samples. Shape (α) and scale (β) are two significant parameters of Weibull distribution [35].
F ( t ) = Q ( t ) = 1 e ( t α ) β
For the calculation of the probability of failure, a simple approximation was used
F ( i , n ) = i 0.44 n + 0.25 × 100 %
For each failure load ti, a value was assigned.
Y i = ln ( t i ) .
For expressing the probability of failure in a percentage
X i = ln ( ln ( 1 F ( i , n ) 100 ) )
α = slope of the Weibull plot
b = α ln ( β )
i = Rank of observations
In the case of two-parameter Weibull, unreliability or failure probability is calculated by using Equation (7). F(t) stands for probability of failure, t is the failure load, α is shape factor, β is scale factor and n specifies the number of samples.
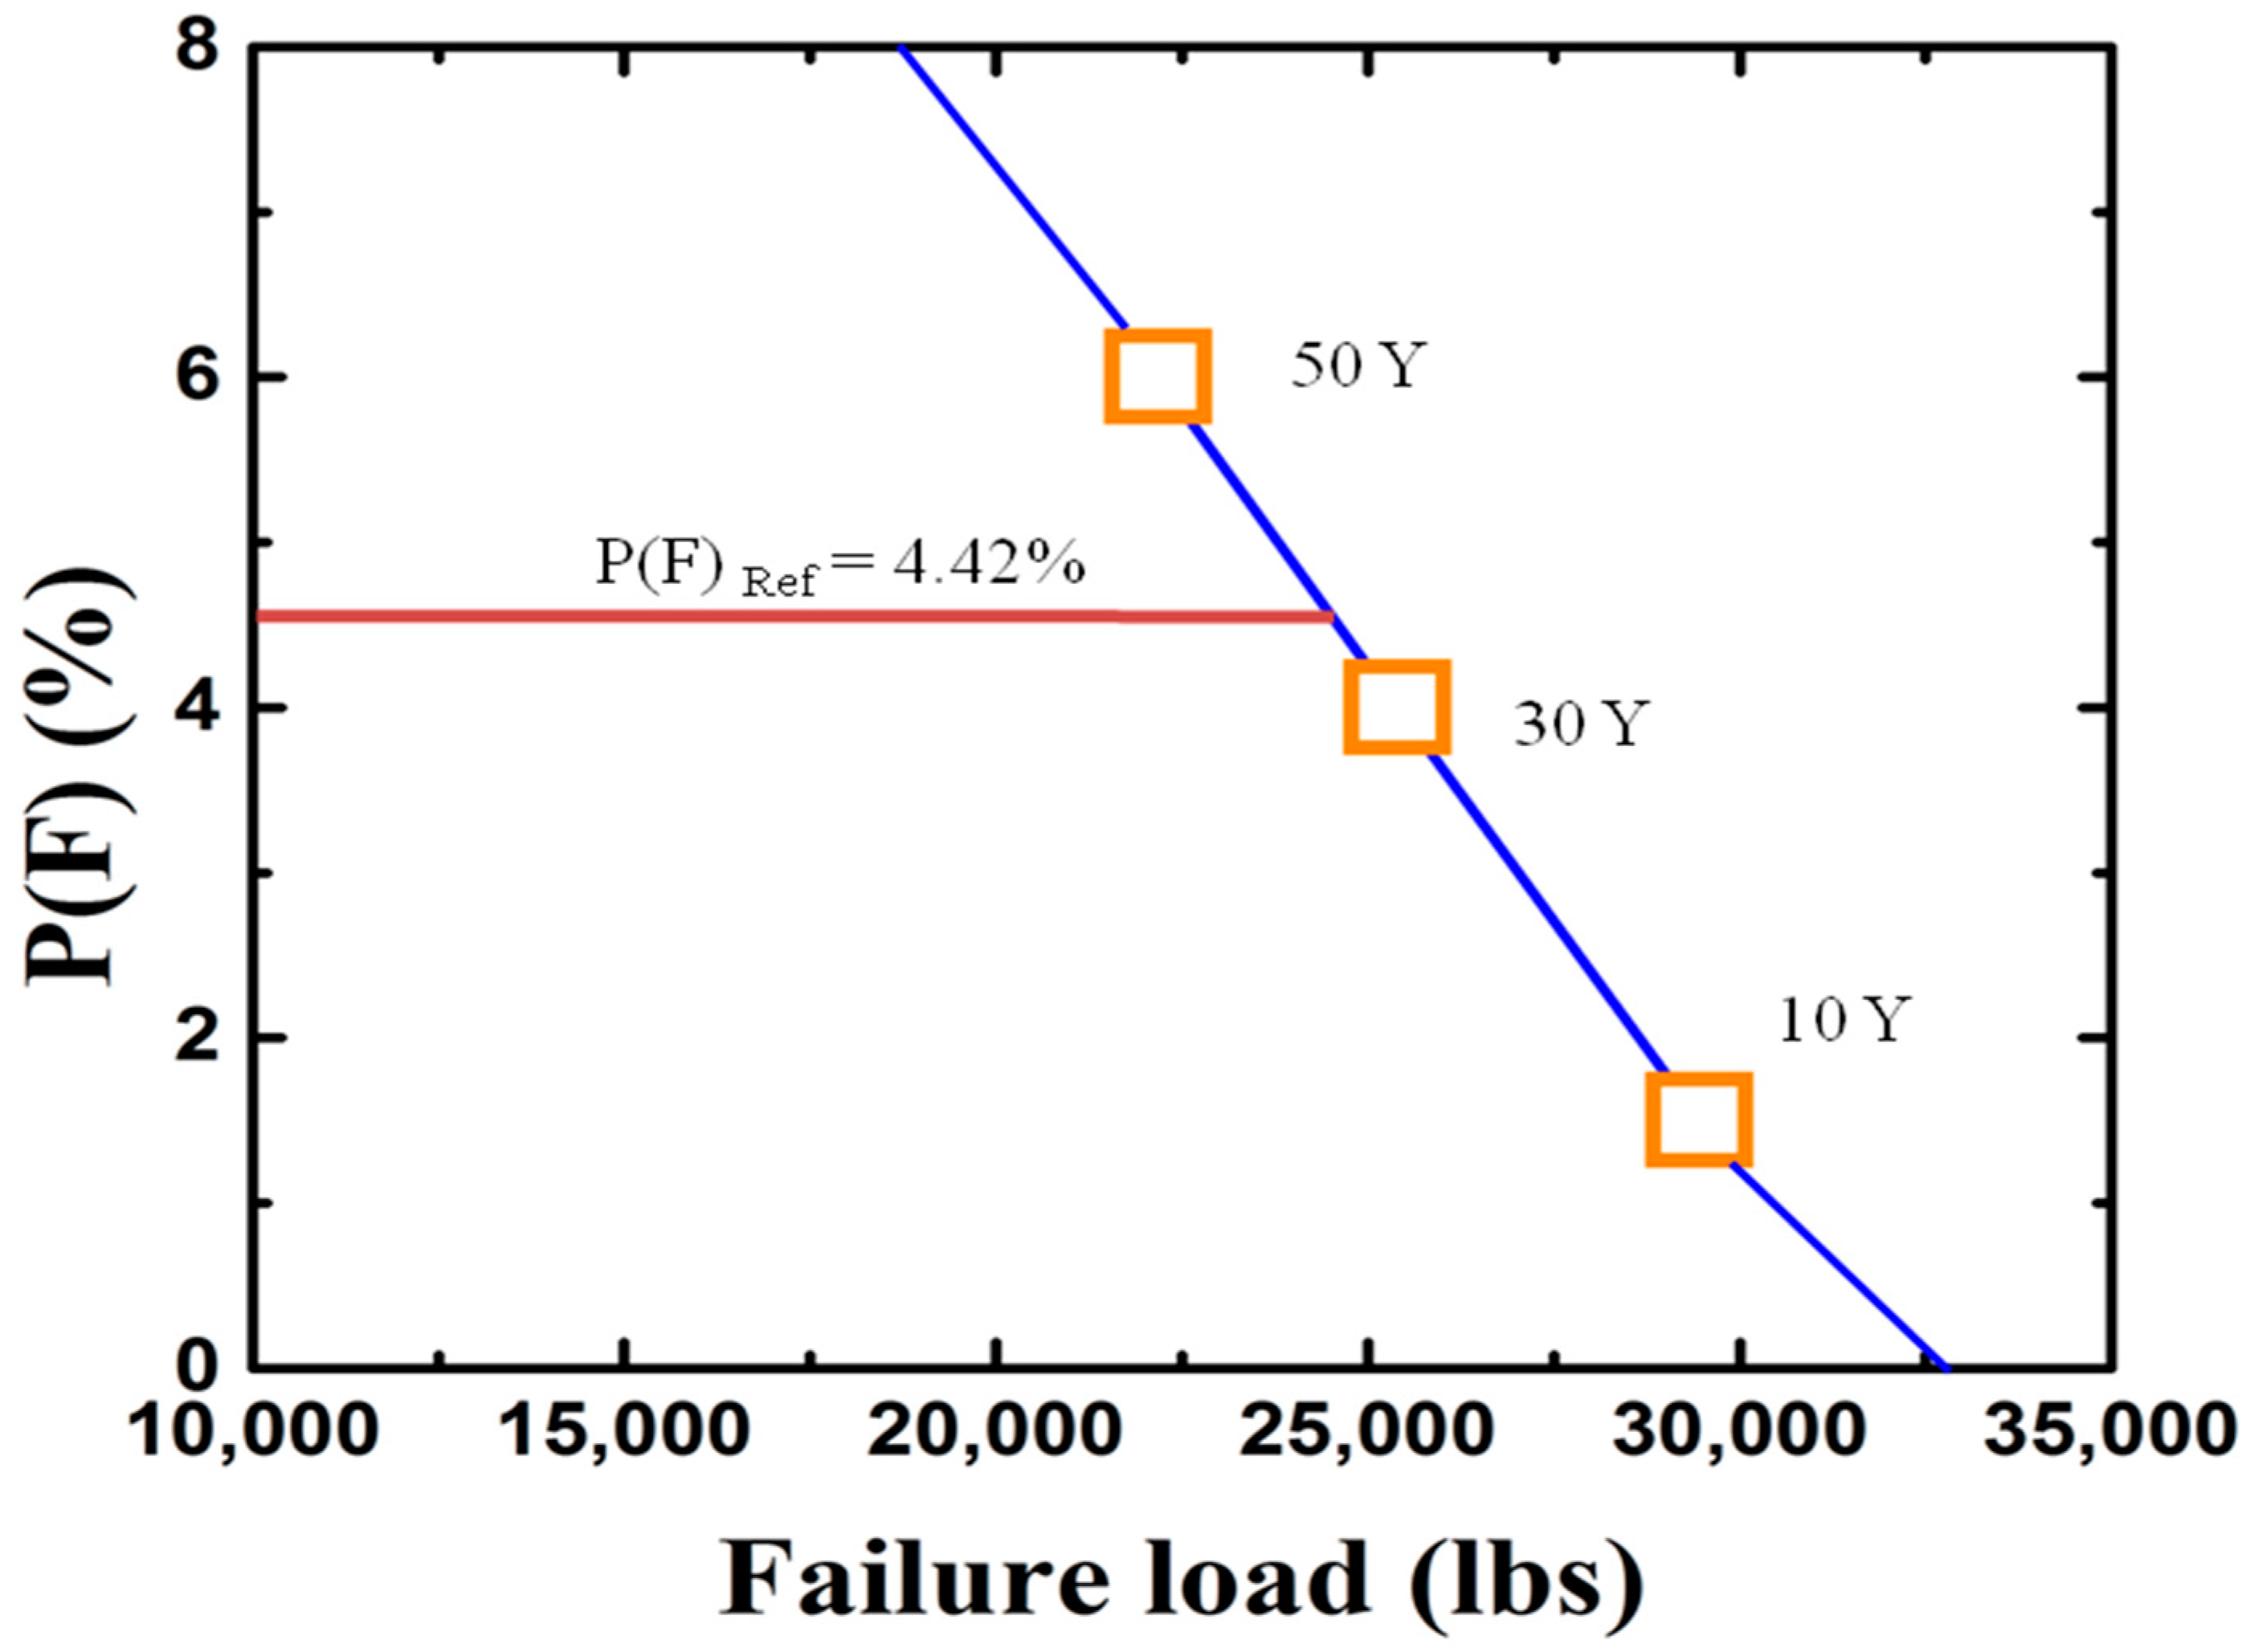
Figure 9 depicts the adequacy of the Weibull plot for samples completed at 50, 30 and 10 years of service. Adequacy was checked only for two extreme conditions of samples. It is quite obvious that samples completed at 30 years will also be distributed according to Weibull distribution. An alternative technique to check the adequacy of Weibull distribution is to calculate the correlation coefficient. The correlation coefficient was calculated to be 0.64, 0.84, and 0.95 for the three cases 50 Y, 30 Y and 10 Y, respectively. The correlation coefficient was determined by using the inbuilt function of the spreadsheet. The value should be greater than 2 / n ; n specifies the number of samples. In the case of the 50 Y insulators, the correlation coefficient was smaller as compared to the other two cases. The α and β were determined as α = 7.69, β = 20,952.22, α= 32.27, β = 22,378.61 and α = 45.66, β = 22,743.4 respectively, for all three cases. P(F) was calculated by using Equation (7) and the Weibull in built function of the spreadsheet. For the insulator samples which were in service for 50 years, P(F) was 5.55%. For the insulators which were active for 30 years, P(F) was 4.35%. The insulators which spent only 10 years in service showed the lowest P(F), at 1.5%. All Weibull calculations considered a confidence limit of 95%. The average loads observed, at which failure occurred in 50Y, 30 Y and 10 Y samples, were 22,186 lbs; K = 1.1, 25,401 lbs; K= 6.52 and 29,454 lbs; K= 10.35 respectively. The corresponding P(F) calculated were 5.55%, 4.35% and 1.5%, respectively. It could be observed from Figure 9 that failure load and P(F) shared a linear relationship. Thus, it could be modeled as Equation (8).
P ( F ) % = | 19.67 ( 0.00,061 × F a i l u r e l o a d ) |
For security purposes, the insulators must withstand a rated load to survive surge conditions. At rated load (25,000 lbs), P(F)Ref was calculated as 4.42%. Alternately, it could be considered that healthy porcelain insulators should have P(F) ≤ 4.42%, otherwise replacement of the string is preferable. Figure 10 depicts the probable guideline based on P(F), to evaluate the mechanical strength of porcelain insulators.
This reference could be applied to all insulators collected for evaluation, as age specifications were provided. For this specific study, the insulators which completed 50 years of service are not mechanically fit, and it is preferable to replace their parent population. The microstructural studies performed also defend the decision of the replacement of insulators with an age of 50 years. However, this statement is not universally true for all insulators with the same age group worldwide. This is because various factors, like the location of installation, humidity, temperature and other environmental condition affect aging. It is possible that insulators with an age of 40 years are showing the same characteristics in some other countries, as insulators with an age of 50 years in South Korea. However, for porcelain insulators operating at 154 kV and with an M+E rating 25,000 lbs, P(F)Ref will be completely true.
Based on the rated load value, P(F)Ref will vary. Such a kind of methodology could be developed easily when bulk samples were available for evaluation, and performing experiments on each one is not possible. In such cases, based on the available failure load data and rated load, P(F)Ref could be selected and all collected samples could be evaluated based on it. In this article, classification was done on the basis of aging. This classification can be replaced with a different one as required.

4. Conclusions

Porcelain insulators were put through constant stresses. Thus, the aging accelerated in insulators, which reduced their strength mechanically and electrically. In some cases, the visual inspection was quite indicative of their future failure, even for surety experimental and statistical evaluations are obligatory to prevent sudden failure. Unfortunately, there is no exact reference for predicting the replacement of insulators in the service. This article is focused on outlining a strategy for deciding the replacement of insulator strings when large samples are available for laboratory evaluation. In such cases, performing experiments on each sample is not possible. For this article, 30 insulators, operated at 154 kV and having an M+E rating of 25,000 lbs, were selected based on visual damage from bulk collected insulators. These bulk insulators were 25,000 lbs, 154 kV, and aged within 10–50 Y, and were collected from different places in South Korea for a laboratory evaluation. The samples were divided into three categories of age, and a tensile load test was performed on all samples. Overall, 50% of the samples within the age group 50 Y and 20% within the age group 30 Y were failed below rated value. The insulators which completed 50 years of service depicted a 24.7% decrease in average failure load, as compared to newly aged insulators (10 years). The K of such insulators (50 years) was below 3. Microstructural studies were carried out on all three categories, to re-evaluate previous experiments and study changes in micro-structure with aging. The metal caps of samples aged 50 years showed the highest amount of rust on the metal cap surface, as compared to other insulator samples. The same category showed interconnected cracks as having a combined length 2200.61 µm and widths of 129.48 µm, 211.88 µm, and one void of length 442.86 µm and width 449.54 µm in cement surface, and wide cracks in the porcelain-cement interface, unlike the other two categories. Even the insulators which completed 50 years of service were highly porous porcelain shells, as compared to insulators which completed 10 years of service. Next to this, P(F) was calculated by implementing Weibull distribution. For insulator samples which were in service for 50 years, P(F) was 5.55%. For insulators which were active for 30 years, the P(F) was 4.35%. For insulators which spent only 10 years in service, the P(F) was the lowest, at 1.5%. It was observed that failure load and P(F) shared a linear relationship. Based on Equation (8), it was calculated that with rated load P(F)Ref = 4.42%. For security reasons, insulators should withstand at least their rated load, to prevent sudden failure. Thus, it could be considered that healthy porcelain insulators should have P(F) ≤ 4.42%, otherwise replacement of the string would be preferable. For this specific study, insulators which completed 50 years of service were not fit mechanically and it is preferable to replace their parent population. However, this statement regarding age group is not universally true for all insulators with the same age group worldwide, as the aging of insulator is highly dependent on environmental conditions. However, for porcelain insulators operating at 154 kV and with M&E rating of 25,000 lbs, P(F)Ref will be completely true. In this article, classification was done on the basis of aging. This kind of strategy could also be explored to predict the reference for the probability of total failure, not only the mechanical, by carrying out more experiments.

Author Contributions

Formal analysis, S.S. and T.K.; data curation, J.-B.K., J.-A.S. and I.-H.C.; writing—original draft preparation, S.S.; writing—review and editing, T.K.; supervision, J.Y. and I.-H.C.; project administration, J.-B.K., J.-A.S., C.-S.-S. and I.-H.C. All authors have read and agreed to the published version of the manuscript.

Funding

This research was funded by Korea Electric Power Corporation R16TA29.

Conflicts of Interest

The authors declare no conflict of interest.

References

  1. Sierra, R.C.; Trespalacios, O.; Candelo, J.E.; Soto, J.D. Assessment of the risk of failure of high voltage substations due to environmental conditions and pollution on insulators. Environ. Sci. Pollut. Res. 2015, 22, 9749–9758. [Google Scholar] [CrossRef] [PubMed] [Green Version]
  2. Choi, I.H.; Kim, T.K.; Yoon, Y.B.; Kim, T.; Nguyen, H.T.T.; Yi, J. A Study on the Lifetime Assessment Ways and Various Failure Types of 154 kV Porcelain Insulators Installed in South Korea. Trans. Electr. Electron. Mater. 2018, 19, 188–194. [Google Scholar] [CrossRef]
  3. Han, S.-W.; Cho, H.-G.; Choi, I.-H.; Lee, D.-I. Failure Characteristics of Suspension-Type Porcelain Insulators on a 154kV Transmission Line. In Proceedings of the IEEE International Symposium on Electrical Insulation, Toronto, ON, Canada, 11–14 June 2006; pp. 118–121. [Google Scholar]
  4. Chen, C.; Jia, Z.; Ye, W.; Guan, Z.; Li, Y. Condition assessment Strategies of Composite Insulators Based on Statistic Methods. IEEE Trans. Dielectr. Electr. Insul. 2016, 23, 3231–3241. [Google Scholar] [CrossRef]
  5. ES (Technical Standards of KEPCO). Testing Methods for Insulators; Korea Electric Power Corporation: Daejon, Korea, 2014. [Google Scholar]
  6. Gorur, R.S.; Shaner, D.; Clark, W.; Vinson, R.; Ruff, D. Utilities Share Their Insulator Field Experience. Transm. Distrib. World 2005, 57, 17–27. [Google Scholar]
  7. Jeon, S.H.; Kim, T.Y.; Lee, Y.J.; Shin, J.J.; Choi, I.H.; Son, J.A. Porcelain Suspension Insulator for OHTL: A Comparative Study of New and Used Insulators using 3D-CT. IEEE Trans. Dielectr. Electr. Insul. 2019, 26, 1654–1659. [Google Scholar] [CrossRef]
  8. Ostendorp, M. Assessing the integrity and remaining service life of vintage high voltage ceramic insulators. In Proceedings of the 2003 IEEE 10th International Conference on Transmission and Distribution Construction, Operation and Live-Line Maintenance, Orlando, FL, USA, 6–10 April 2003; pp. 169–175. [Google Scholar]
  9. Vaillan court, G.H.; Carignan, S.; Jean, C. Experience with the detection of faulty composite insulators on high-voltage power lines by the electric field measurement method. IEEE Trans. Power Deliv. 1998, 13, 661–666. [Google Scholar] [CrossRef]
  10. Jabbari, M.; Farzaneh, M.; Duvillaret, L. New method for in live-line detection of small defects in composite insulator based on electro-optic E-field sensor. IEEE Trans. Dielectr. Electr. Insul. 2013, 20, 194–201. [Google Scholar]
  11. Raghavan, V.S. Analysis of insulation degradation in Insulators using Partial Discharge analysis. In Proceedings of the 2011 3rd International Conference on Electronics Computer Technology, Kanyakumari, India, 8–10 April 2011; pp. 110–114. [Google Scholar]
  12. Park, K.C.; Motai, Y.C.; Yoon, J.R. Acoustic fault detection technique for high-power insulators. IEEE Trans. Ind. Electron. 2017, 64, 9699–9708. [Google Scholar] [CrossRef]
  13. Ha, H.; Han, S.; Lee, J. Fault detection on transmission lines using a microphone array and an infrared thermal imaging camera. IEEE Trans. Instrum. Meas. 2012, 61, 267–275. [Google Scholar] [CrossRef]
  14. Kim, T.Y.; Jeon, S.H.; Lee, Y.J.; Yi, J.S.; Choi, I.H.; Son, J.A.; Choi, C.W. Three-Dimensional Computed Tomography and Composition Analysis of Porcelain Insulators for 154-kV Power Transmission Lines. IEEE Trans. Dielectr. Electr. Insul. 2019, 26, 115–119. [Google Scholar] [CrossRef]
  15. Miao, X.R.; Liu, X.Y.; Chen, J.; Zhuang, S.B.; Fan, J.W.; Jiang, H. Insulator Detection in Aerial Images for Transmission Line Inspection Using Single Shot Multibox Detector. IEEE Access 2019, 7, 9945–9956. [Google Scholar] [CrossRef]
  16. Cherney, E.A.; Baker, A.C.; Kuffel, J.; Lodi, Z.; Phillips, A.; Powell, D.G.; Stewart, G.A. Evaluation of and Replacement Strategies for Aged High Voltage Porcelain Suspension-Type Insulators. IEEE Trans. Power Deliv. 2014, 29, 275–282. [Google Scholar] [CrossRef]
  17. Choi, I.H.; Koo, J.B.; Woo, J.W.; Son, J.A.; Bae, D.Y.; Yoon, Y.G.; Oh, T.K. Damage Evaluation of Porcelain Insulators with154 kV Transmission Lines by Various Support Vector Machine (SVM) and Ensemble Methods Using Frequency Response Data. Appl. Sci. 2020, 10, 84. [Google Scholar] [CrossRef] [Green Version]
  18. Abernethy, R. An Overview of Weibull Analysis, 5th ed.; Robert Abernethy: West Palm Beach, FL, USA, 1983; pp. 1–11. [Google Scholar]
  19. Fabiani, D.; Simoni, L. Discussion on application of the weibull distribution to electrical breakdown of insulating materials. IEEE Trans. Dielectr. Electr. Insul. 2005, 12, 11–16. [Google Scholar] [CrossRef]
  20. Gorur, R.S. Failure Modes of Porcelain and Toughened Glass Suspension Insulators. In Proceedings of the IEEE Electrical Insulation Conference, Annapolis, MD, USA, 5–8 June 2011; pp. 221–225. [Google Scholar]
  21. Han, S.W. Thermal mechanical performance test on suspended insulators for transmission line. In Proceedings of the Conference Record of the 2004 IEEE International Symposium on Electrical Insulation, Indianapolis, IN, USA, 19–22 September 2004; pp. 300–303. [Google Scholar]
  22. Rawat, A.; Gorur, R.S. Microstructure based evaluation of field aged and new porcelain suspension insulators. IEEE Trans. Electr. Insul. 2009, 16, 107–115. [Google Scholar] [CrossRef]
  23. Hettich, P.; Schell, K.G.; Oberacker, R.; Bucharsky, E.C.; Schulte Fischedick, J.; Ho_mann, M.J. Failure behavior of high performance porcelain insulators. Mater. Sci. Eng. Technol. 2017, 48, 792–799. [Google Scholar] [CrossRef]
  24. Riahi Noori, N.; Sarraf Mamoory, R.; Mehraeen, S. Effect of Materials Design on Properties of Porcelain Insulators. Am. Ceram. Soc. Bull. 2007, 86, 9201–9205. [Google Scholar]
  25. Baker, A.C.; Bernstorf, R.A.; Cherney, E.A.; Gorur, R.S.; Hill, R.J.; Lodi, Z.; Marra, S.; Powell, D.G.; Schwalm, A.E.; Shaffner, D.H.; et al. High voltage insulators mechanical load limits—Part I: Overhead Line load and strength requirements. IEEE Trans. Power Deliv. 2012, 27, 1106–1115. [Google Scholar] [CrossRef]
  26. Baker, A.C.; Bernstorf, R.A.; Cherney, E.A.; Gorur, R.S.; Hill, R.J.; Lodi, Z.; Marra, S.; Powell, D.G.; Schwalm, A.E.; Shaffner, D.H.; et al. High voltage insulators mechanical load limits—Part II: Standards and recommendations. IEEE Trans. Power Deliv. 2012, 27, 2342–2349. [Google Scholar] [CrossRef]
  27. Sanyal, S.; Kim, T.; Yi, J.; Koo, J.B.; Son, J.A.; Choi, I.H. Failure trends of high voltage porcelain insulators depending on the constituents of the porcelain. Appl. Sci. 2020, 10, 694. [Google Scholar] [CrossRef] [Green Version]
  28. Meng, Y.; Gong, G.; Wu, Z.; Yin, Z.; Xie, Y.; Liu, S. Fabrication and microstructure investigation of Ultra-high-strength porcelain insulator. J. Eur. Ceram. Soc. 2012, 32, 3043–3049. [Google Scholar] [CrossRef]
  29. Mishra, A.P.; Gorur, R.S.; Venkataraman, S.; Kingsbury, D. Condition assessment of porcelain and toughened glass insulators from residual strength tests. In Proceedings of the IEEE Conference on Electrical Insulation and Dielectric Phenomena, Kansas City, MO, USA, 15–18 October 2006; pp. 413–416. [Google Scholar]
  30. Cho, J.Y.; Jin, W.C.; Bae, S.H.; Park, C. Evaluation of Microstructure, Phases, and Mechanical Properties of Aged Porcelain Insulator. Korean J. Mater. Res. 2019, 3, 137–142. [Google Scholar] [CrossRef]
  31. Veshki, M.R.; Mirzaie, M.; Sobhani, R. Reliability assessment of aged SiR insulators under humidity and pollution conditions. Electr. Power Energy Syst. 2019, 117, 132–138. [Google Scholar]
  32. Awad, M.S. Reliability Assessment for Overhead Power Transmission Lines using Failure Rate Analysis. Aust. J. Basic Appl. Sci. 2016, 10, 34–39. [Google Scholar]
  33. Giri, A.; Mitra, B. Condition Monitoring and Faulty Insulator Locating using Park’s Transformation. Int. Res. J. Eng. Technol. 2019, 6, 1641–1644. [Google Scholar]
  34. Kim, T.; Lee, Y.J.; Sanyal, S.; Woo, J.W.; Choi, I.H.; Yi, J. Mechanism of Corrosion in Porcelain Insulators and Its Effect on the Lifetime. Appl. Sci. 2020, 10, 423. [Google Scholar] [CrossRef] [Green Version]
  35. ANSI/IEEE Std 930: IEEE Guide for the Statistical Analysis of Electrical Insulation Voltage Endurance Data; IEEE: Piscataway, NJ, USA, 1987.
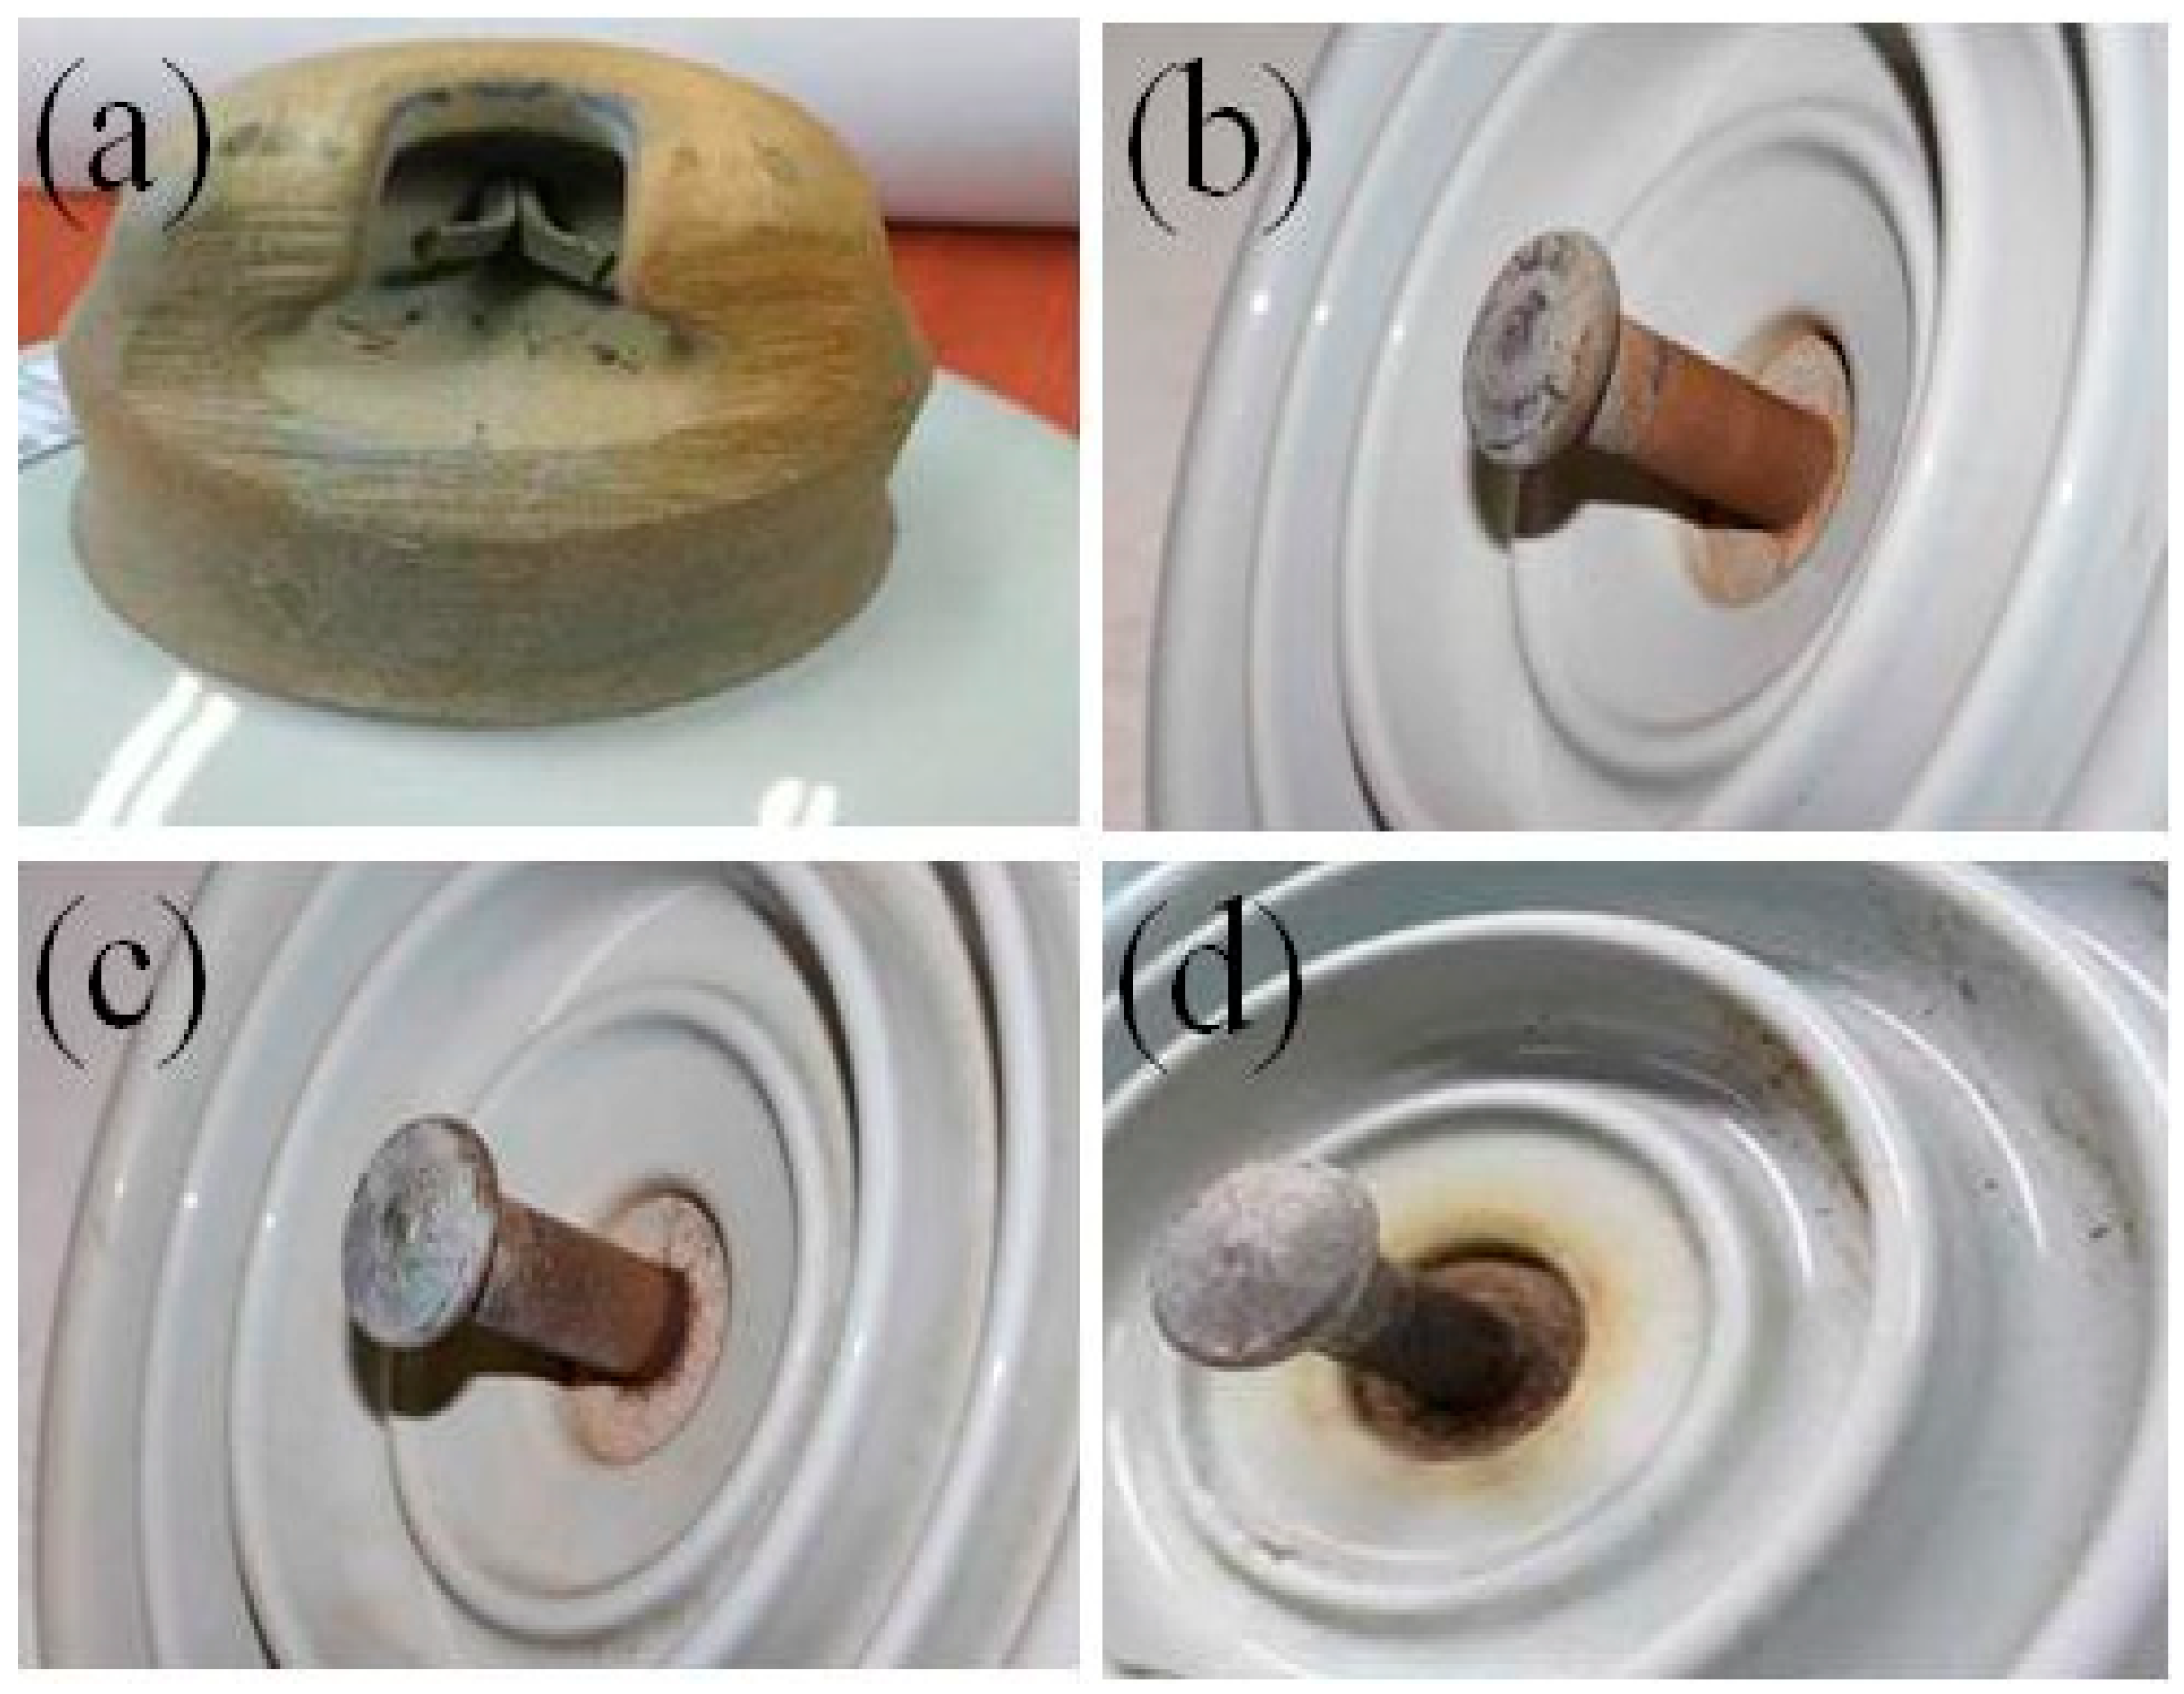
Figure 1. (a) Heavily rusted metal cap, (b) Heavily rusted pin, (c) Damaged cement surface, (d) Damaged porcelain body.
Energies 13 02043 g001
Figure 2. Experimental set up for tensile load test.
Energies 13 02043 g002
Figure 3. (a) Separation of pin, (b) Separation of metal cap, (c) Shattered porcelain insulator, (d) Fractured porcelain insulator.
Energies 13 02043 g003
Figure 4. Quality factor calculated based on load test on porcelain insulators.
Energies 13 02043 g004
Figure 5. Optical images of metal cap of porcelain insulators; (a) 50 years, (b) 30 years, (c) 10 years.
Energies 13 02043 g005
Figure 6. Optical images of cement of porcelain insulators (a) 50 years (b) 30 years (c) 10 years.
Energies 13 02043 g006
Figure 7. Optical images of porcelain-cement interface of insulators (a) 50 years (b) 30 years (c) 10 years.
Energies 13 02043 g007
Figure 8. SEM images of porcelain of porcelain insulators; (a) 50 years, (b) 10 years.
Energies 13 02043 g008
Figure 9. Cumulative probability of failure of porcelain insulator samples with ages.
Energies 13 02043 g009
Figure 10. Probable guideline to evaluate porcelain insulator based on the probability of mechanical failure (P(F)).
Energies 13 02043 g010
Table 1. Specifications of porcelain insulators under evaluation.
Insulator IdFailure Load (lbs)
50 YMechanical and Electrical Rating (M+E) (lbs)30 YM+E (lbs)10 YM+E (lbs)
1East S.K25,000East S.K25,000North S.K25,000
2East S.K25,000North S.K25,000West S.K25,000
3North S.K25,000East S.K25,000South S.K25,000
4West S.K25,000East S.K25,000East S.K25,000
5South S.K25,000South S.K25,000East S.K25,000
6East S.K25,000North S.K25,000South S.K25,000
7North S.K25,000West S.K25,000North S.K25,000
8East S.K25,000South S.K25,000West S.K25,000
9East S.K25,000East S.K25,000South S.K25,000
10South S.K25,000East S.K25,000North S.K25,000
Table 2. Summary of Tensile load tests.
Insulator IdFailure Load (lbs)
50 YRemarks30 YRemarks10 YRemarks
120,980Neck26,960Pin25,760Pin
212,010Neck25,400Pin28,860Neck
322,160Pin25,010Pin30,000Pin
425,820Pin27,010Pin28,710Pin
522,180Pin22,450Neck27,540Neck
627,680Neck22,690Pin29,270Pin
712,040Shattered28,750Pin30,990Pin
825,160Pin25,480Neck29,940Pin
928,030Shattered24,960Pin30,870Pin
1025,800Shattered25,300Pin32,600Pin