1. Introduction
In recent decades, both climate change and depleting conventional energy sources in relation to a growing increase in energy demand have led to the development of high-efficiency energy conversion technologies. Indeed, according to data from the International Energy Agency (IEA) [
1], primary energy production increased by about 50% over the past 20 years, resulting in an increase in carbon dioxide (CO
2) emissions by approximately 43%. In particular, according to the IEA, the building sector accounts for almost 41% of the world’s energy consumption, about half of which is caused by air conditioning systems, generating approximately one-third of annual greenhouse gas emissions [
2]. In this framework, the concept of micro-grid is one of the most attractive key aspects in research efforts to attain a global energy reduction based on an efficient use of interconnected devices in a network [
3]. Generally, a micro-grid is composed of distributed generators as well as load, energy storage, and protection control devices, with the aim of becoming an integrated system of energy generation, transmission, distribution, and use. In this scenario, the viability of renewable energy sources as a desirable solution to overcome environmental issues becomes evident. However, an efficient use of non-programmable renewable energy sources needs an integration of proper thermal energy storage (TES) units, due to their intermittent and variable nature [
4].
Thermal energy storage systems can be based on sensible, latent, or thermo-chemical heat [
5]. Typically, these systems are based on sensible heat thermal energy storage (SHTES) systems, including the use of rocks and pebbles, but SHTES systems require large volumes because of their relatively low volumetric energy density [
6]. Hence, latent heat thermal energy storage (LHTES) systems represent a very attractive option, owing to their higher energy storage density and the nearly isothermal behavior during the phase change process [
5,
7]. A TES cycling process involves three steps, namely charge, storage, and discharge. In the charge process of an LHTES system, the high amount of energy (heat of fusion) developed during the phase transition of a selected material, namely phase change material (PCM), is stored in a reservoir [
8]. Subsequently, after a more or less prolonged storing period, the stored energy is released during the discharge, once more through the inverse phase transition, to the user. Thus, the basic idea of LHTES systems is to store the energy when it is cheap or in excess and to further release it when it is not available or more expensive.
The implementation of LHTES systems for the reduction in energy consumption in the building sector is currently one of the most challenging research topics [
9,
10,
11]. Concerning the integration of these systems for air conditioning applications, the packed-bed storage is the most used configuration, due to its ease of construction and its efficient heat transfer during both charge and discharge processes. Velraj et al. [
12] presented a parametric study on the performance of a packed-bed storage unit filled with encapsulated PCM for low-temperature solar air heating applications. They found that the size of the PCM spheres, inlet temperature, and mass flow rate of the heat transfer fluid (HTF) affect the heat transfer area in the packed bed, temperature distribution, and convective heat transfer coefficient between the HTF and PCM. Saffar-Avval et al. [
13] evaluated system performance and energy saving by carrying out the hourly simulation of a thermocline hot water storage tank coupled with a combined heat and power system and a district heating network. The results showed an increase in overall efficiency of 1.1% and a reduction in fuel consumption and in CO
2 emissions of 2.6% each. Sánchez et al. [
14] numerically analyzed the integration of two LHTES systems for cold accumulation and heat dissipation with a heat pump-based HVAC system, obtaining an energy saving of 19.0%. Zhai et al. [
15] numerically and experimentally investigated the performance of a packed-bed cold storage unit, using composite PCM capsules for high-temperature solar cooling applications. They found that the inlet HTF temperature has more influence over the charging rate and maximal charging capacity, whereas it has less effect on exergetic efficiency. Conversely, the HTF flow rate has a limited influence on the charging rate, but it significantly affects exergetic efficiency. Li et al. [
16] numerically studied a TES unit based on multiple PCMs for use in conventional air conditioning systems. The results showed that the TES system based on multiple PCMs leads to a total charging capacity up to approximately 32% higher than the TES system based on a single PCM. Yao et al. [
17] presented a numerical simulation of a building-coupled cogeneration system, based on both a photovoltaic-thermal heat pump and a build-in PCM heat storage system. They found that the LHTES system improves the electrical, thermal, and overall efficiencies by 17.8%, 55.8%, and 75.5%, respectively, while the coefficient of performance (COP) reached values that were 70% higher than those of the conventional air conditioning systems. Dardir et al. [
18] presented a comprehensive review of the utilization of PCM-to-air heat exchangers for building free cooling applications. In this application, the outdoor air is used as an ambient heat sink for building cooling purposes by ventilation. Results show how the PCM materials, airflow rate, and air inlet temperature have a great influence on storage system performance. Cheng and Zhai [
19] reported the numerical analysis of a cascaded packed-bed TES unit using multiple PCMs for cold storage air conditioning systems. They found that the proposed system allows both a reduction in the charging time and an increase in the average charging rate in comparison with the single-stage unit. Belmonte et al. [
20] numerically investigated the integration of a fluidized bed TES unit containing PCM into solar air-based systems for heating application in the building sector. The results show a significant reduction in building heating requirements, providing efficient energy storage for solar air collectors. Allouche et al. [
21] presented a numerical analysis of solar-driven air conditioning systems integrated with a low-temperature storage system based on the PCM, showing that the LHTES system contributes to improving the COP and the value of the solar thermal ratio. Said and Hassan [
22] presented an experimental study based on integrating plates of the PCM with the condenser of a conventional air conditioning system. They found that the PCM plates decrease the condenser pressure and increase the evaporator cooling capacity, leading to a higher COP. Kutlu et al. [
23] proposed a novel control method of the TES systems based on PCMs. They developed a transient thermodynamic model of an integrated system based on a solar collector, a heat pump, and an LHTES system, using water as HTF. Results show a reduction in daily domestic hot water energy consumptions by about 12% to 13%, depending on weather conditions.
In this framework, this paper investigated the performance of an LHTES system based on a packed bed of encapsulated spherical PCM integrated into a micro-grid to be built in a Research Center located in Sardinia (Italy). The micro-grid also consisted of a photovoltaic (PV) plant (geographical coordinates: 39°09′31″ N, 8°30′39″ E) with a total installed peak power slightly lower than 90 kW and of an air conditioning system based on a geothermal water–water heat pump fed by the PV plant or by the electrical grid. The TES unit allowed for optimal management of the micro-grid, storing the surplus thermal energy produced by the heat pump fed by the PV plant during the weekend. The main purpose was to use this stored energy to integrate the air conditioning system supply during the weekdays, to improve self-consumption of renewable electrical energy and self-sufficiency of the micro-grid.
2. Micro-Grid Configuration and Performance
Starting from the hourly values of normal global irradiance and ambient temperature, obtained from the Meteonorm software (version 7.3, Meteotest AG, Bern, Switzerland) [
24] with reference to a standard year, the hourly electrical energy produced by the PV system was estimated. An analysis of the electrical consumption of the Research Center was also performed, allowing the evaluation of the hourly consumption during the whole year. Consequently, it was possible to define, for each month, the average electricity consumption of both a typical weekday and a weekend. The Center is usually closed during the weekend, resulting in a much lower demand for electrical energy with respect to what it obtains on weekdays, with a consequent surplus electricity production by the PV plant. Conversely, during weekdays, the electricity demand of the Center exceeds the PV plant production and, consequently, it is necessary to compensate the deficit through the electricity grid.
Therefore, the basic idea of this work was to use a heat pump, partially fed by the PV plant during the weekend, to produce thermal energy to be stored in a TES system and then to exploit it during the weekdays, thereby avoiding or integrating the heat pump operation for a given period. This situation occurs throughout the year, but, during the summer, the hypothetical thermal energy stored during the weekend would be difficult to exploit during the weekdays, because the PV plant is able to fully satisfy the electricity demand. Conversely, during the winter, since the solar energy available is definitely lower, it is possible to use the stored thermal energy to meet, in part, the request of the user during the weekdays, reducing the absorption of electricity from the grid to feed the heat pump. In particular, the micro-grid operates according to the following criteria:
- (a)
the PV plant directly feeds the air conditioning system during the hours of both high radiation and energy demand (the central hours of the weekdays);
- (b)
the PV plant feeds the heat pump for storing thermal energy in the case of high solar radiation and low energy demand (the central hours of the weekend);
- (c)
the TES system directly feeds the air conditioning system in the case of low PV production and high energy demand (early morning and late afternoon of the weekdays).
Figure 1 shows a simplified functional scheme of the air conditioning system integrated with the TES system. A groundwater well supplies cold water at 24 °C to the heat pump evaporator (cold source), where it is cooled down to 18 °C. On the user’s side, under nominal conditions, the HTF (water) enters and exits the condenser (hot source) at 40 °C and 45 °C, respectively. During the weekend, the charge phase occurs and the thermal energy provided by the heat pump through the circulating water is transferred to the TES system. Conversely, during the weekdays, the flow is reversed and the TES system is discharged providing thermal energy to the user, while the heat pump is off.
Figure 2a–d reports for the winter months (from November to March):
A monthly average (day-type) of PV electricity production obtained on the basis of forecast (
Figure 2a).
The average hourly electricity consumption of a weekday (
Figure 2b).
The daily profile of the surplus electricity available, with respect to the user demand, during a generic weekend day (
Figure 2c).
The daily profile of the electricity deficit to be filled up for a generic weekday (
Figure 2d).
The average hourly electricity consumption of the weekend is not reported in
Figure 2a–d, as it is fairly constant during the entire day and close to the base value of the corresponding weekday.
Although the PV plant is characterized by an average power peak higher than 50 kW in summer [
25],
Figure 2a shows that lower peak values are reached in autumn and winter (40–45 kW in March, 30–35 kW in February, and 25–30 kW from November to January). In these months, PV production starts at 7 to 8 a.m. and ends by 6 to 7 p.m.
As can be seen from
Figure 2b, the electricity consumptions show a meaningful base value, between 6 and 16 kW, when the Research Center is closed. During morning and afternoon of the weekdays, electricity requirements are much higher than the base values, but major monthly differences can be observed, depending mainly on the air conditioning system. In particular, the electricity consumption reaches a peak of about 85 kW in January, settling above 70 kW for the entire working time (7 a.m. to 5 p.m.). Other winter months are characterized by lower consumptions, between 35 and 50 kW in March.
Figure 2c shows that the peak values of the electricity surplus range from a minimum of about 16 kW in January to a maximum of almost 32 kW in March. Moreover,
Figure 2c shows that, with the exception of March, the other months exhibit a similar trend. As shown in
Figure 2d, the daily profile of the deficit is more dependent on hour and month than the surplus one, with two peaks in early morning and late afternoon.
Water–water heat pumps of different sizes were considered in this study, assuming a nominal electrical power
coinciding with the corresponding peak value of the PV surplus for each winter month. The thermal power
Qth produced by the heat pump was evaluated starting from the electrical power
using Equation (1):
A COP of 5.5 was assumed, corresponding to the value of a similar-size commercial heat pump operating with the same water outlet temperatures at both the evaporator and the condenser (18 °C and 45 °C, respectively). Moreover, the heat pump is equipped with an inverter, so that the COP can be considered as a constant until the thermal load reaches the minimum load condition, assumed equal to 50% of the nominal one. The mass flow rate of circulating water
was calculated using Equation (2), by setting a temperature difference Δ
T = 5 °C across the condenser, kept constant during the overall process in both charge and discharge phases.
Table 1 reports the electrical and thermal power and the HTF mass flow of the heat pump for the different winter months (from November to March) and for a generic winter averaged month.
As shown in
Table 1, the heat pump sized with reference to March conditions is about two times larger than the one sized with reference to January conditions.
3. Modeling of the TES System
The TES system simulated in this study was constituted by a cylindrical steel tank filled with spherical capsules filled by a PCM, using water as the heat transfer fluid. During the charge phase, hot water provided by the heat pump entered from the top of the tank, releasing thermal energy to the PCM, and exited from the bottom at a lower temperature. On the contrary, during the discharge phase, the flow was reversed, and the water entered from the bottom and exited from the top, absorbing the thermal energy released by the PCM. Minimum and maximum nominal operating temperatures were 40 °C and 45 °C, respectively. For this application, Rubitherm’s RT44HC [
26] was used as PCM, held in capsules 20 mm in diameter, whose main thermophysical properties are reported in
Table 2. In addition, RT44HC is a paraffin and, consequently, as other organic PCMs, it does not show sub-cooling [
27]. Moreover, the degree of filling of the material inside the beads is equal to 0.85 to allow the volumetric expansion during melting. A specific numerical simulation model in the MATLAB-Simulink environment was developed for this TES system, using a transient one-dimensional (1-D) two-equation local thermal non-equilibrium (LTNE) model, which involves calculating the temperatures of the heat transfer fluid and the PCM separately. The model allows predicting the shape of the thermocline generated within the packed bed along the axis of the tank, by considering the radial temperature profile as constant.
The packed bed is considered homogeneous and isotropic. Equations (3) and (4) refer, respectively, to the water (HTF) and the PCM contained in the capsules:
A detailed description of the model, with the expression of the different terms presented in Equations (3) and (4), has been reported in previous works by the same authors [
28,
29]. The melting process was modeled by modifying the overall heat capacity of the PCM to account for the large amount of energy provided by the latent heat of fusion L. Consequently, during the melting process, the specific heat of the PCM on the left-hand side of Equation (4) is described by Equation (5):
The parameter
D(T), expressed by Equation (6), is a Gaussian function that accounts for the latent heat of fusion absorbed during the melting process:
Observing Equation (6), its value is zero everywhere except within the interval between the solid phase temperature and the liquid phase temperature , while is their mean value. Moreover, its integral over the range of all temperatures is equal to 1 to ensure the energy balance through the phase transition by multiplying D(T) by L.
Finally, the peak value is attained when the temperature is equal to
. This function makes the phase change smoother, close to the reality with respect to the enthalpy model. The effective thermal conductivity
is calculated separately for both phases, taking into account the porosity of the bed [
28]. The convective heat transfer coefficient
depends mainly on the Nusselt number, calculated according to a well-known correlation based on experimental literature data [
30]. This coefficient also includes the effect of the Biot number, not negligible in this case, given the low thermal conductivity of the PCM and the relatively large diameter of the capsules [
31]. In the model, a typical void fraction value ε of 0.4 is set. Due to the reduced thickness of the capsules, the effect of PCM capsule materials on the performance of the TES system during both charge and discharge phases has been neglected [
32]. The parameter
in Equation (1) takes into account the overall thermal losses toward the environment during charge, discharge, and standby periods [
33]. It is calculated according to Equation (7), considering the resistances to the convective heat transfer inside and outside the tank and to the conductive heat transfer through the tank wall and the thermal insulation material [
34]:
In Equation (7),
,
, and
are the inner and outer radii of the steel tank (without insulation) and the overall external diameter of the tank (including the insulation), respectively. The thermal conductivity of the tank
and that of the insulation material
are assumed equal to 15 W/mK and 0.04 W/mK, respectively. Finally,
and
are the convective heat transfer coefficients with reference to the inner and the outer side of the tank, respectively.
is about 3.5 W/m
2K, whereas
depends on the HTF mass flow [
33]. The external temperature is set at 10 °C, a winter average temperature of the site concerned.
4. Sizing and Performance of the TES System
The TES system was properly sized for storing the thermal energy produced by the heat pump. With the aim of exploiting higher solar radiation, the charge phase takes place only in the central hours of the two weekend days (5 h for each day, excluding March characterized by 6 h), reducing the energy acquired from the electricity grid. The discharge phase starts on Monday at 7 a.m. and it ends when the water temperature at the top of the bed drops to 42.5 °C, set as the acceptable minimum for the user.
The sizing of the TES was carried out following an iterative path. At the beginning, the theoretical available thermal energy to be stored was simply calculated by multiplying the nominal thermal power supplied by the heat pump by the number of working hours. The corresponding theoretical bed volume of the TES is reported in
Table 3.
On the other hand, preliminary simulations demonstrated that the thermal power transferred to the TES was not constant during the charge process and that it was lower than the nominal value for most of it. Indeed, the temperature increase inside the heat pump changed during operation, as well as the thermal power transferred to the circulating water, making the heat pump operate at partial load, acceptable up to 50% of full load, as mentioned before. At the end, the TES would become oversized, being the actual energy storable lower than the theoretical one. Consequently, the size of the TES was reduced iteratively until the lowest volume of the bed able to store the actual available thermal energy was found for each case analyzed. To this end, the numerical simulations were decisive, because the storage capacity depends on several aspects such as, in particular, the shape of the thermocline and the thermal losses toward the environment. In addition, as is shown later in detail, the water returning from the user can drop below the nominal minimum operating temperature of 40 °C, due to the thermal behavior of the user. For example, in November, the theoretically available thermal energy is equal to about 1200 kWh corresponding to a bed volume of about 40 m
3. However, in accordance with the previous considerations, simulations showed that the actual available thermal energy was lower than the predicted one of about 25%, resulting in a bed volume of about 31 m
3. Thus, the TES size and its geometrical dimension, assuming an aspect ratio equal to 1, were assessed for the different cases and the results are reported in
Table 3.
Starting from these considerations, the behavior of the TES system was studied with reference to three distinct cases, namely the most favorable month (March), the least favorable one (January), and the generic winter averaged month (Average).
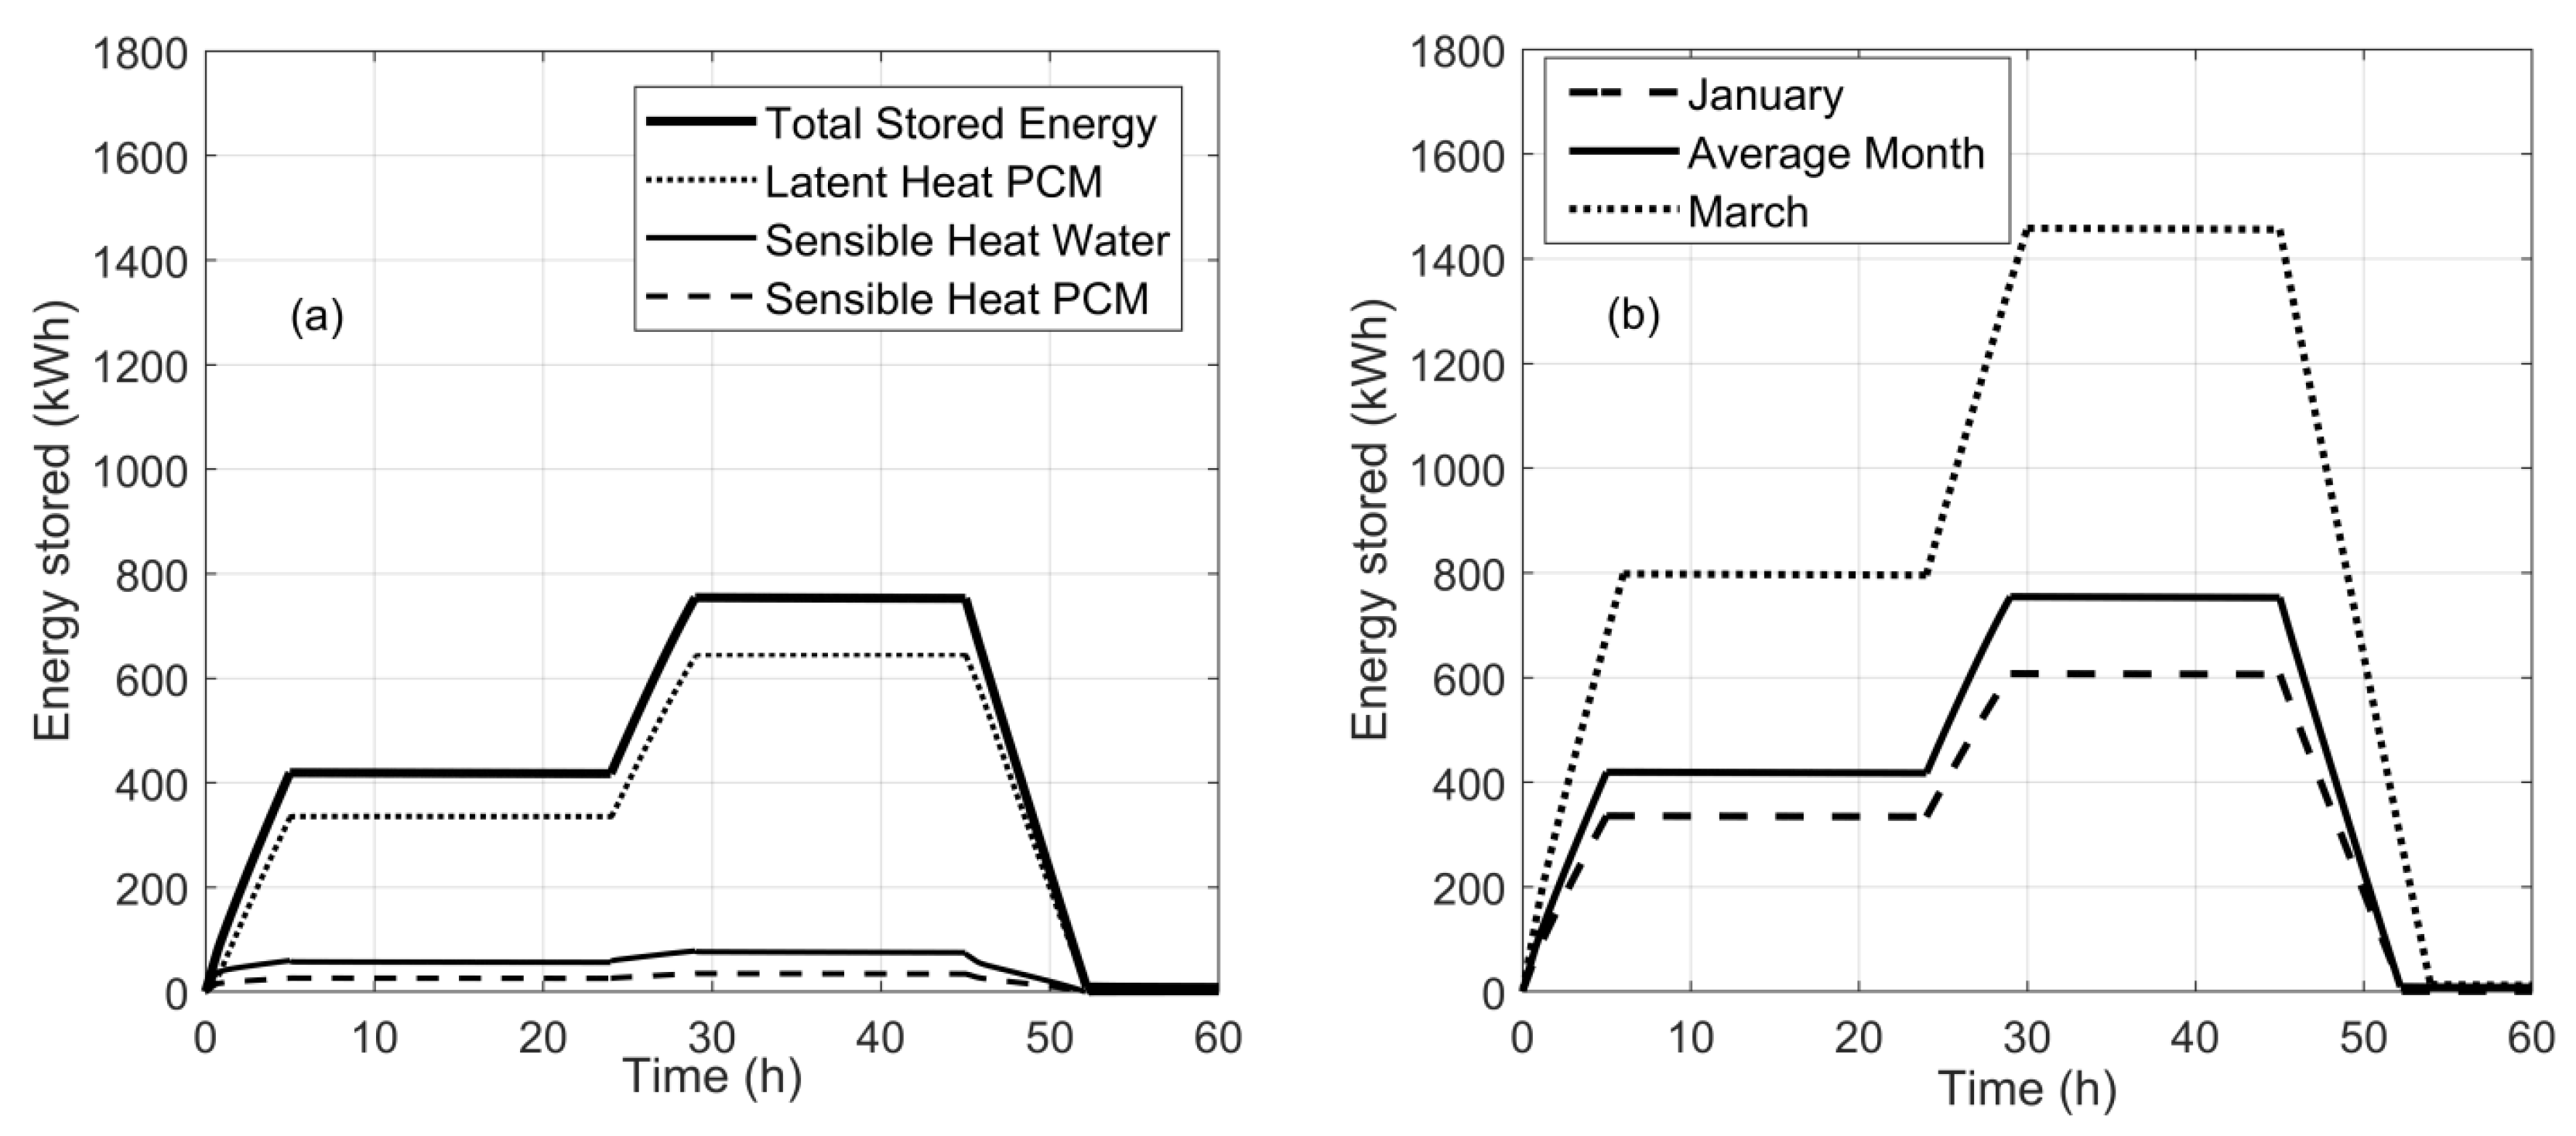
Figure 3a shows the state of charge of the TES during the overall process with respect to the average winter month. In the same manner,
Figure 3b compares the state of charge of the TES systems sized for the three different cases.
The process involves two consecutive charge phases of 5 h (rising segments), occurring during the weekend, separated by an idle period (almost steady segment) that lasts 19 h, when the energy stored slightly decreases owing to thermal losses. Then, after a further idle period of 16 h, the discharge phase starts (descending segment) and the TES is discharged almost completely. In the same
Figure 3a, the amounts of thermal energy stored by the PCM both in the form of sensible and latent heat and by the HTF (water) are reported separately. It is evident that the thermal energy is mainly absorbed by the PCM through its phase change, which represents about 75%–80% of the overall stored energy. Meanwhile, due to its higher specific heat and density, water is able to store a greater amount of thermal energy as sensible heat with respect to the PCM. In
Figure 3b, the state of charge of the TES system designed with reference to the average months is compared with those of March and January. In March, the maximum value of about 1400 kWh of stored energy was obtained due to a higher availability of thermal energy and to a longer working time (12 h) of the heat pump. In the average month and in January, the energy stored in the storage system reached a maximum value of about 750 and 600 kWh, respectively. Once completely discharged, the TES is not used until the subsequent weekend when a new phase of charge occurs.
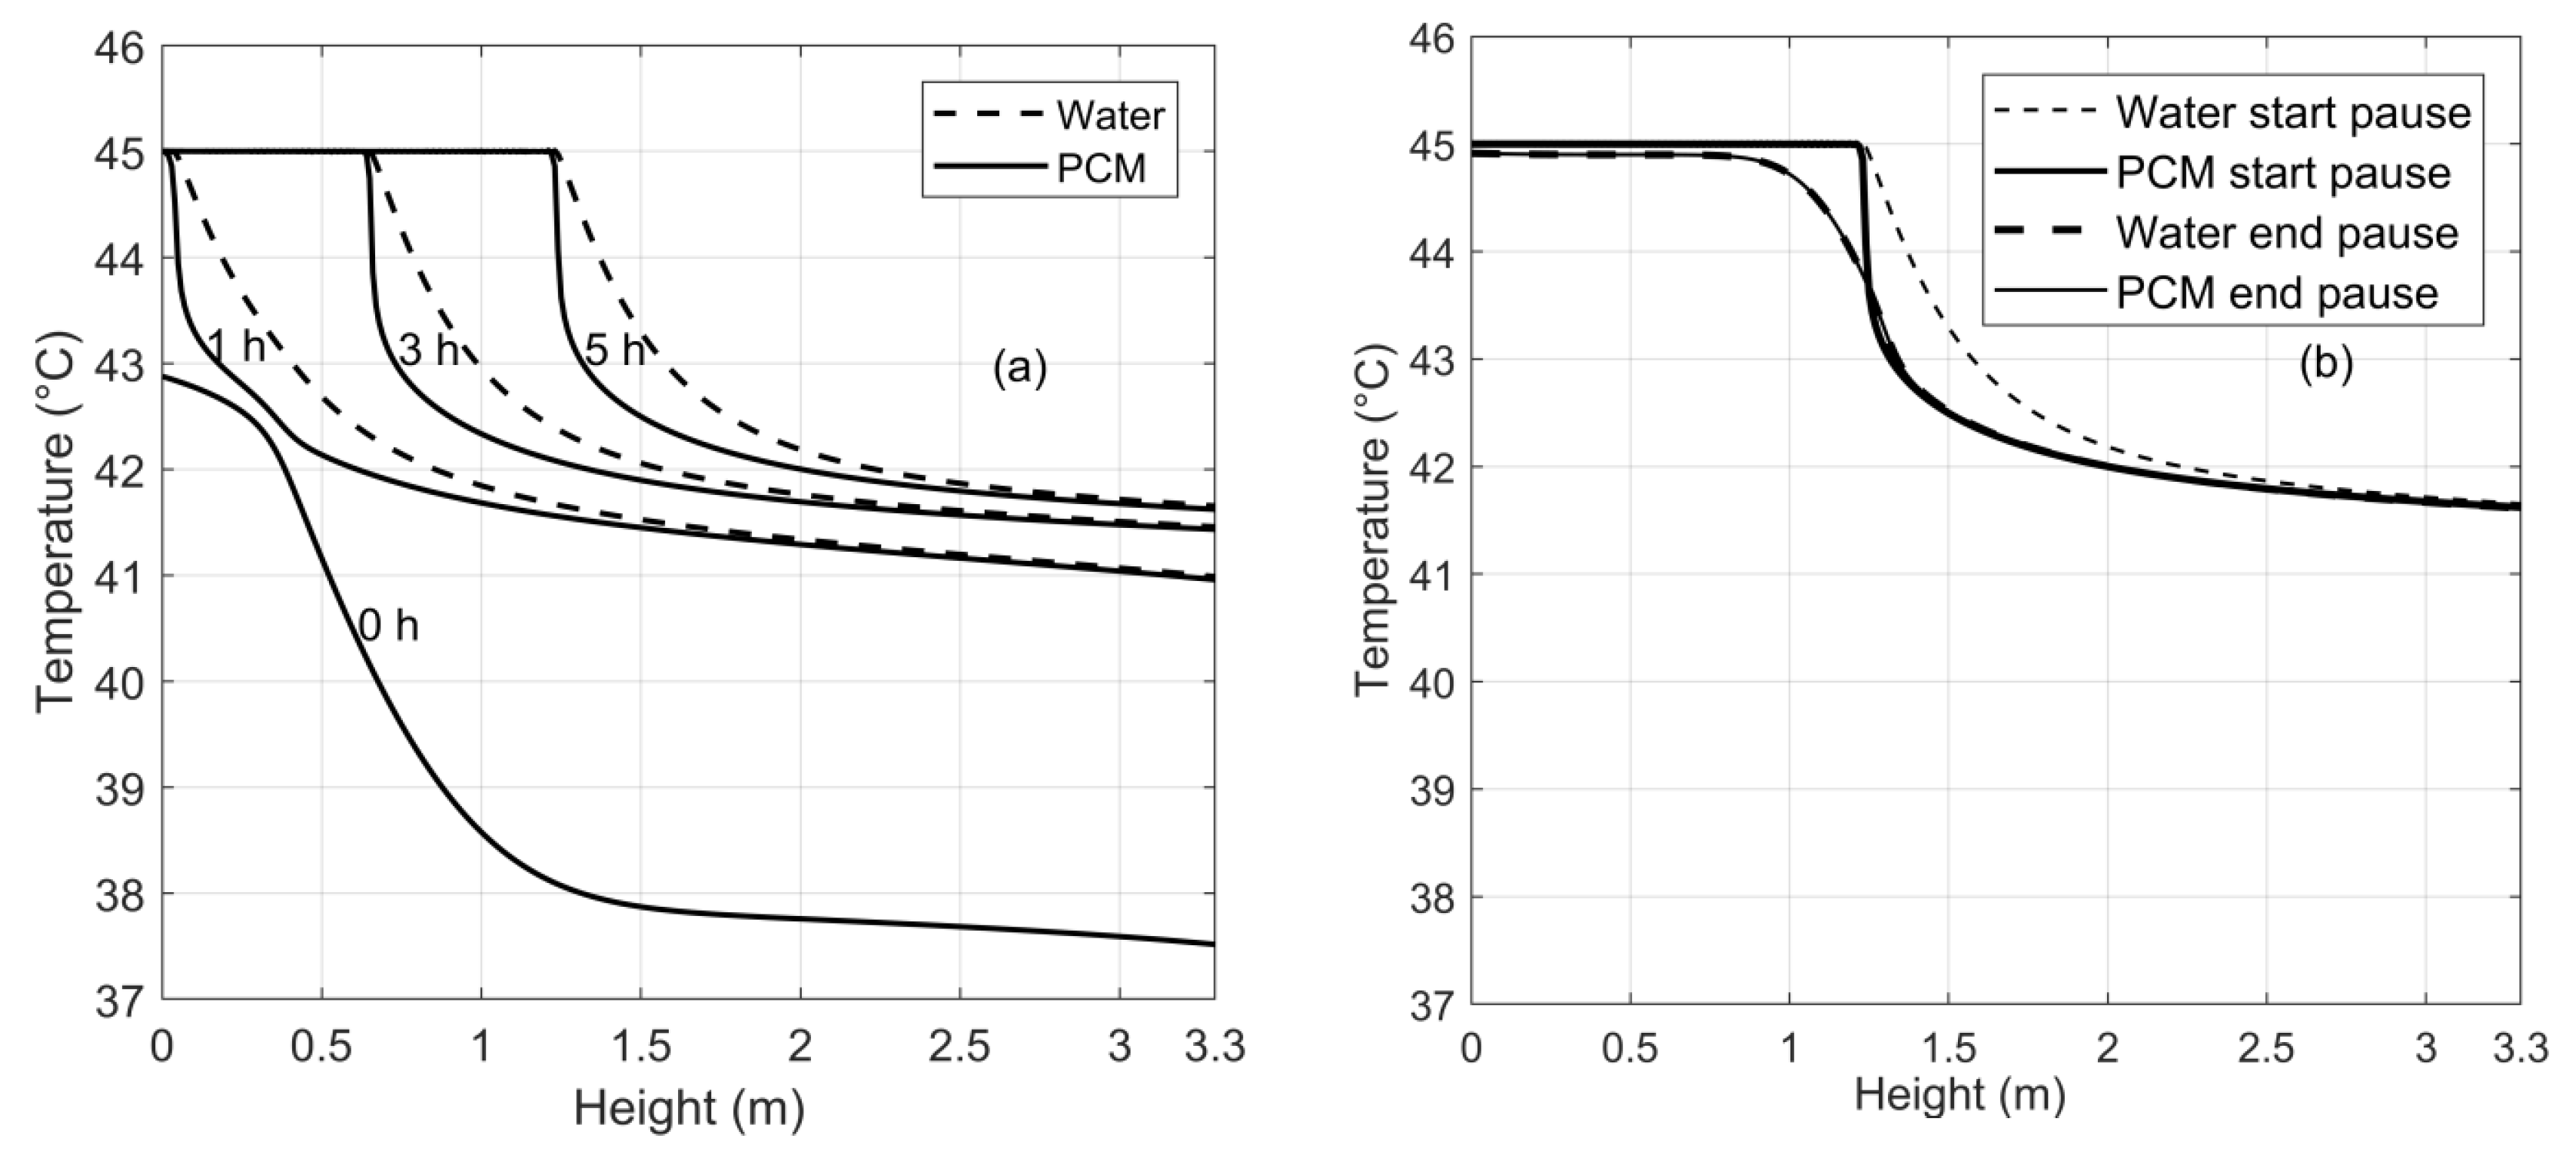
Concerning the temperature distribution within the storage system,
Figure 4a shows the evolution of the thermocline during the first charge phase on Saturday, whereas
Figure 4b shows the evolution of the thermocline during the first idle period. The system is considered under regime conditions; therefore, the starting temperature profile is the result of the previous discharge phase followed by the idle period during the weekdays.
The water temperature profile (dashed line) coincides with the PCM profile (continuous line) at the beginning of the process (0 h). After 1 h, all PCM undergoes phase transition, whereas after 5 h, at the end of this first charge, about one-third of the bed has already melted and the PCM is at the maximum temperature of 45 °C. The high Biot number accentuates the temperature difference between the water and the PCM, due to the low thermal conductivity of the PCM.
At the end of the first charge phase, the HTF stops circulating and the TES is in the idle state. In this situation, two combined effects occur, namely the thermal dispersion inside the bed and the thermal losses toward the environment. The first effect generates a degradation of the thermocline with a smoothing of the temperature profile, due to the heat exchange between zones of the bed at different temperatures. The second one involves the whole bed causing a reduction in its temperature. Finally, at the end of this standby period, both water and PCM temperature profiles coincide. This state is assumed as the initial condition of the second charge phase that occurs during Sunday with the same duration of the first.
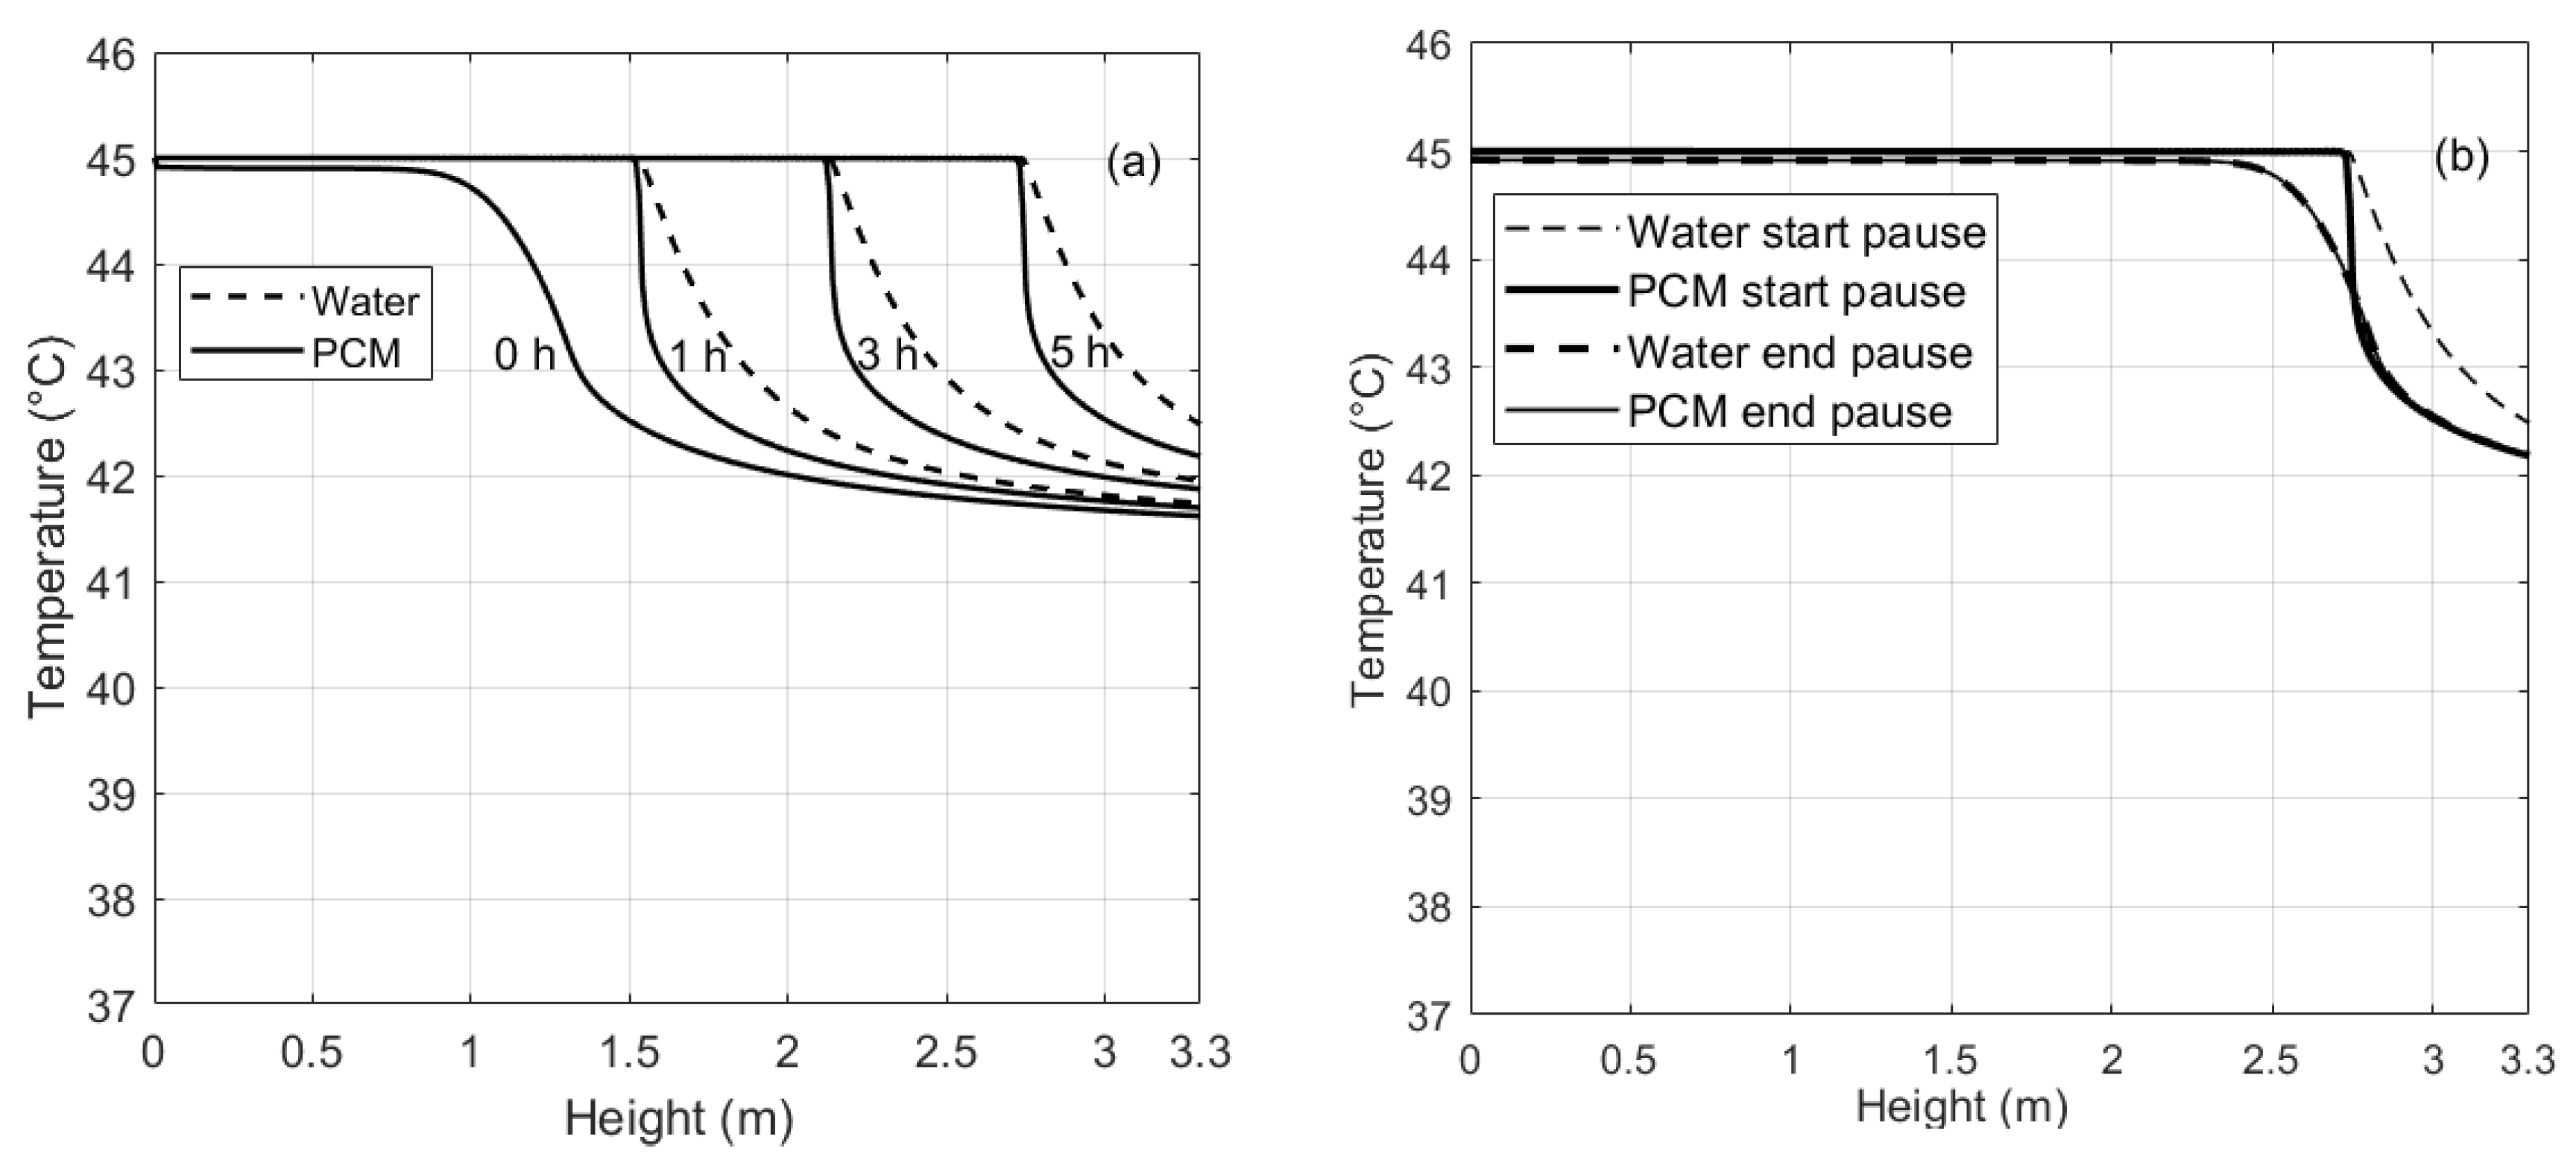
Figure 5a,b shows the evolution of the thermocline during the second charge phase and the second idle period, respectively.
As can be seen in
Figure 5a, starting from the end of the first idle period (0 h) the thermocline moves towards the bottom of the bed and at the end of the second charge phase (5 h) the TES is almost fully charged, then a new standby period of 16 h begins. Analogously to the first one, the idle period modifies the thermocline shape as shown in
Figure 5b, leading to a reduction in both the slope and the value of the bed temperature. After this second idle period, the discharge phase starts.
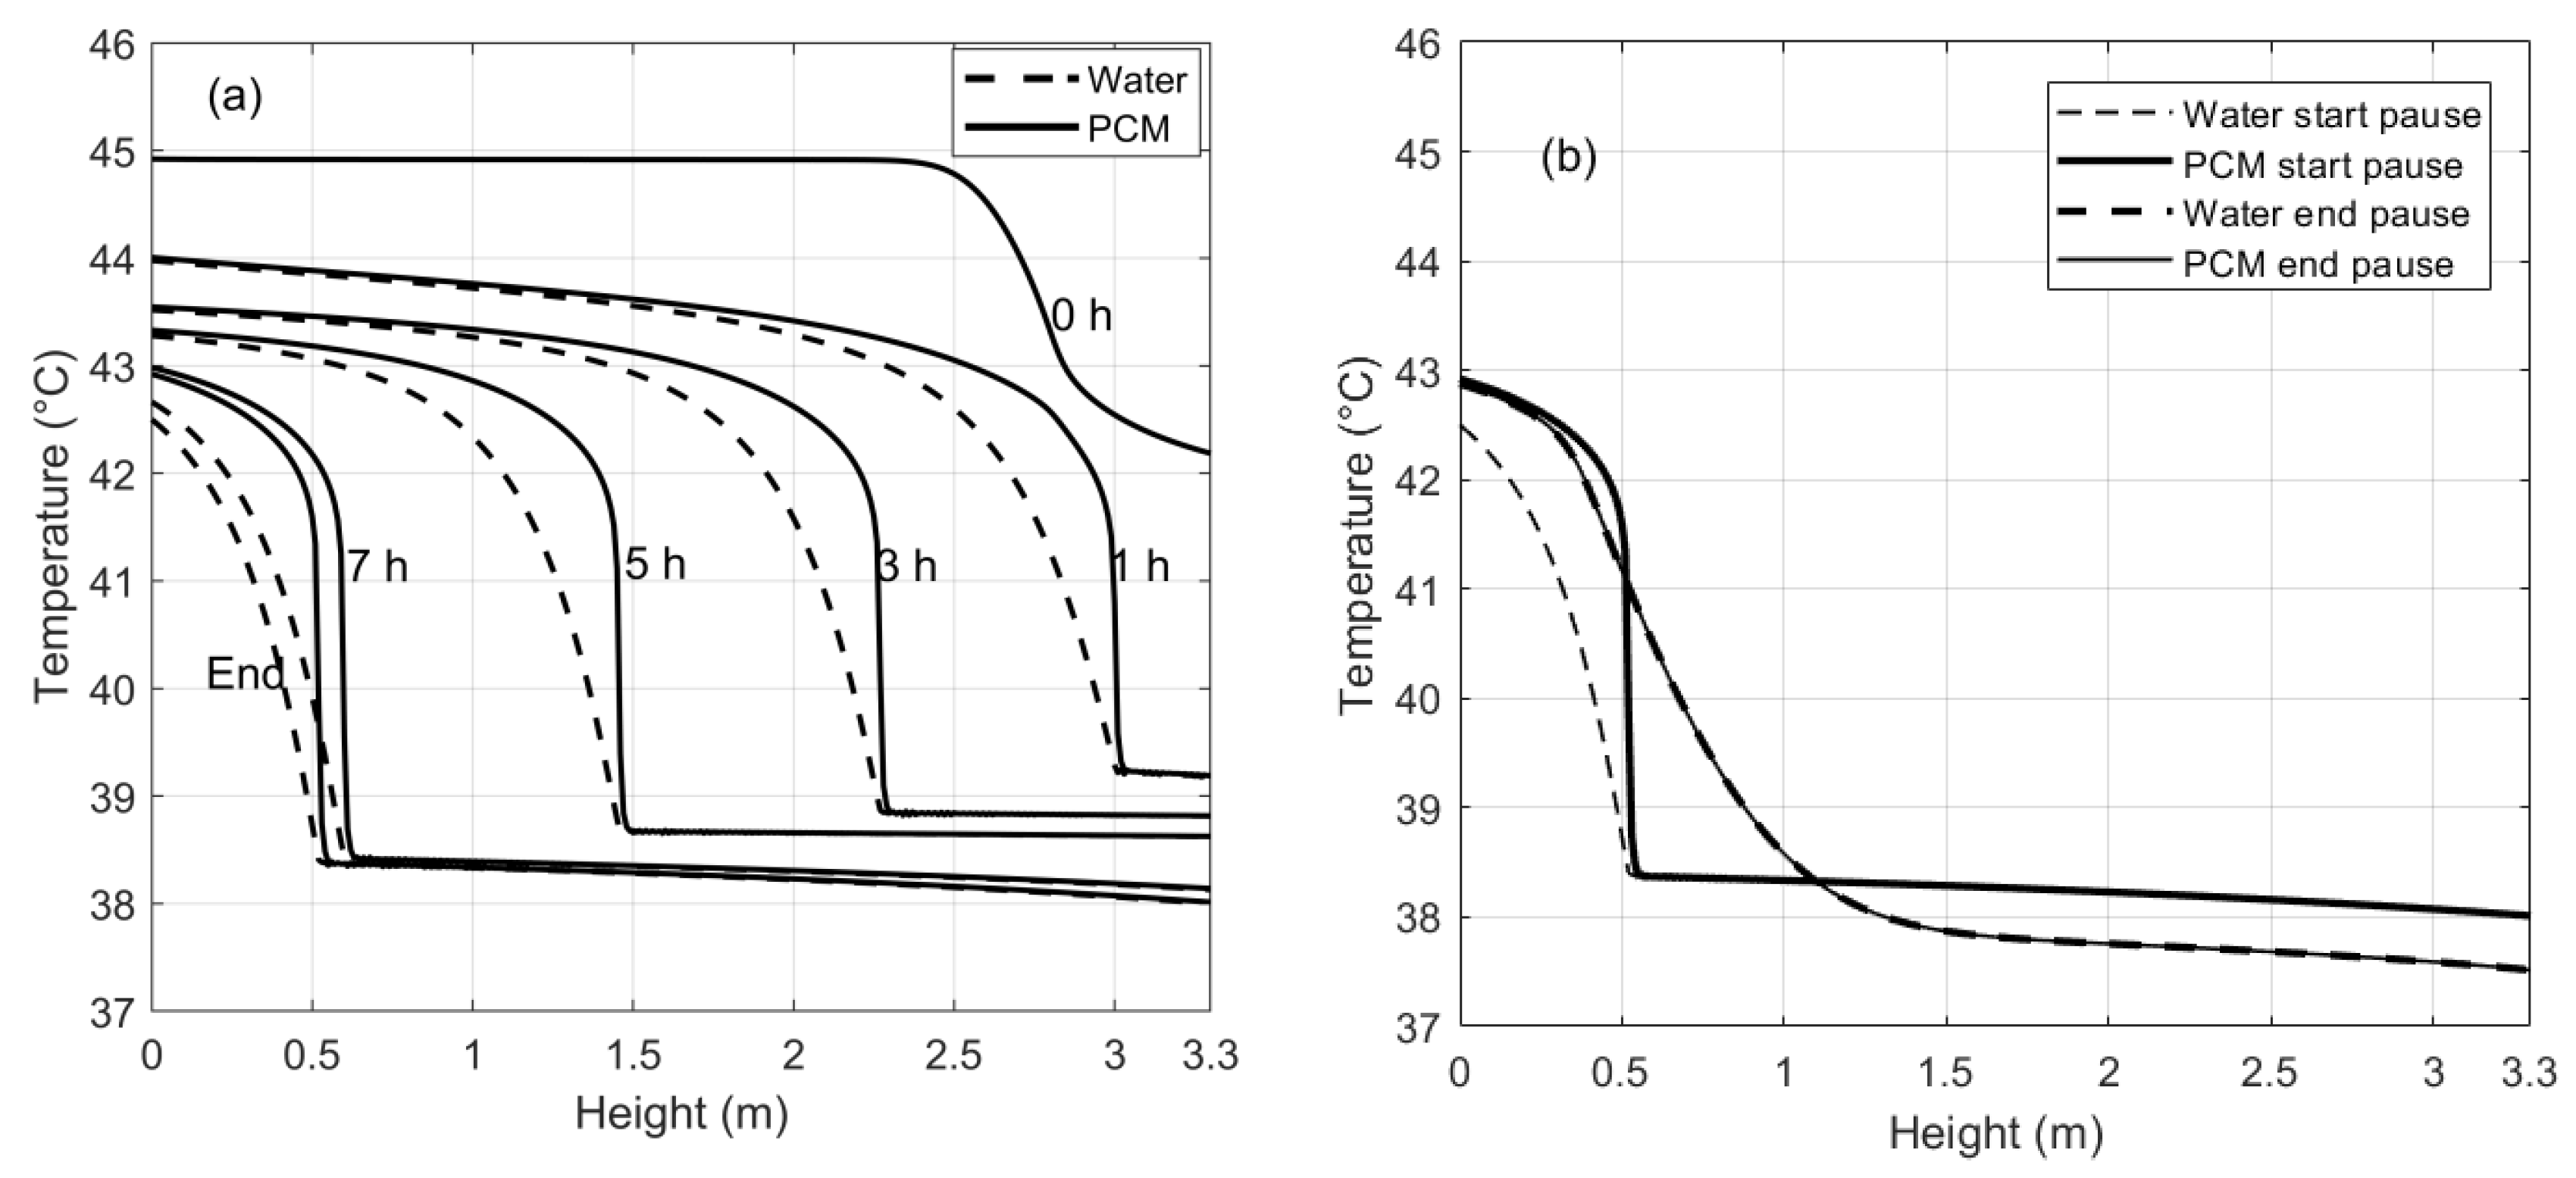
Figure 6a,b shows the evolution of the thermocline during the discharge phase and the weekday idle period, respectively.
At the beginning of the discharge phase (0 h), about three-quarters of the bed is at 45 °C, while the residual undergoes phase transition. As the discharge process progresses, the temperature of both the water and the PCM decreases. The end of the discharge is settled when the water outlet temperature at the top of the bed drops to a minimum acceptable value, set at 42.5 °C. This temperature limit is reached after about 7.5 h. As can be seen in
Figure 6a, during the discharge phase, the circulating water returns from the user to the TES system, entering at the bottom of the bed at a temperature that can be lower than 40 °C. This is because the outlet water temperature at the top of the bed and the inlet temperature at the bottom are related to each other. Indeed, when the outlet water temperature at the top decreases, the inlet temperature at the bottom also decreases, with a temperature difference between them slightly lower than 5 °C at the end of the phase.
After the complete discharge, the bed remains in the idle state for more than four days (until the next weekend) and the thermocline shape changes, as shown in
Figure 6b. The final profile of the water temperature coincides with that of the PCM and it also represents the starting condition of the charge phase of the following weekend (see
Figure 4a).
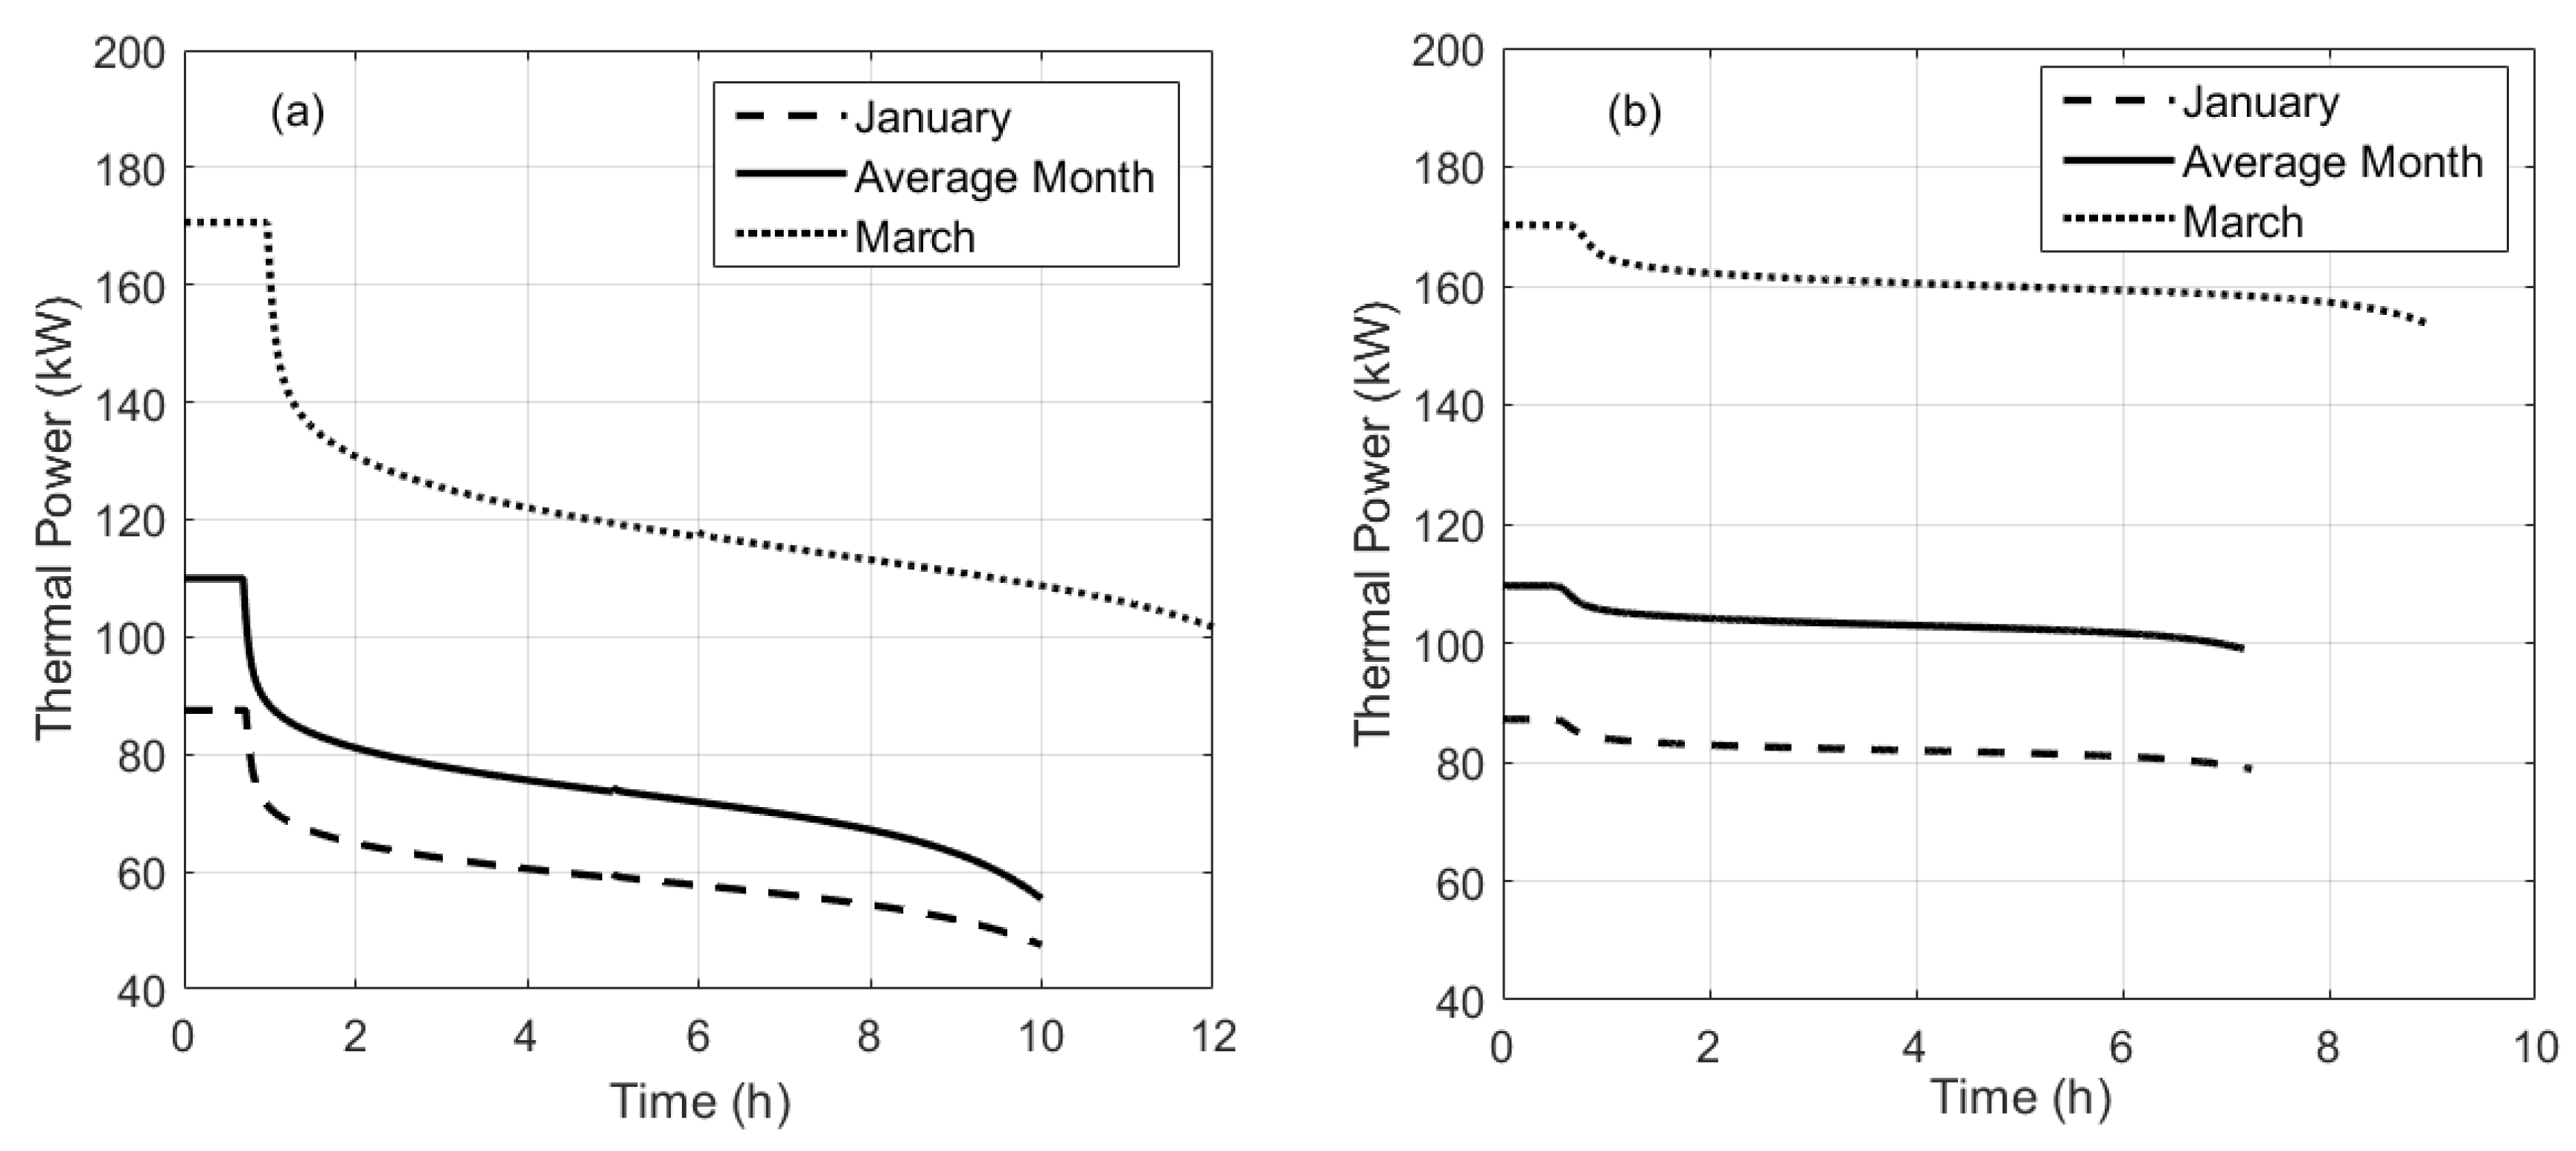
Figure 7a shows the thermal power transferred to the TES system over time during the overall charge phase for the three cases analyzed, whereas
Figure 7b shows the thermal power released by the TES system during the discharge phase. The thermal power is proportional to the temperature difference between the outlet and inlet temperatures of the water, the water mass flow rate kept being as constant.
At the beginning of the charge phase, the thermal power is constant at the maximum value for less than one hour, as the temperature difference between the inlet and outlet sections of the TES does not change. After this period, the thermal power transferred to the water drops according to the reduction in the temperature difference (
Figure 4a). First, this reduction is sharp, because at the bottom of the bed the temperature rises rapidly, since under the phase transition temperature the PCM exchanges only sensible heat. The PCM temperature rises more slowly as soon as it attains the range of phase transition, slowing the reduction in the thermal power transferred to the TES. In
Figure 7a, the idle period is omitted, since the thermal power is obviously equal to zero, leading to a slight discontinuity in the curves after 5 h (6 h for March). In any case, the overall charge phase ends before the heat pump reaches the minimum load allowed.
Figure 7b shows the thermal power released by the TES during the discharge phase. It can be seen that its behavior has a slope that is less sharp with respect to the charge phase, since the temperature difference drops less than during charge phase. The duration of the discharge phase depends on the temperature at the top of the bed and it lasts about 7.5 h in January and in the average month and about 9 h in March. Since the actual request of the user during weekdays is not known, the mass flow rate set in the discharge phase was conservatively assumed equal to that of the charge one.
5. Performance Evaluation
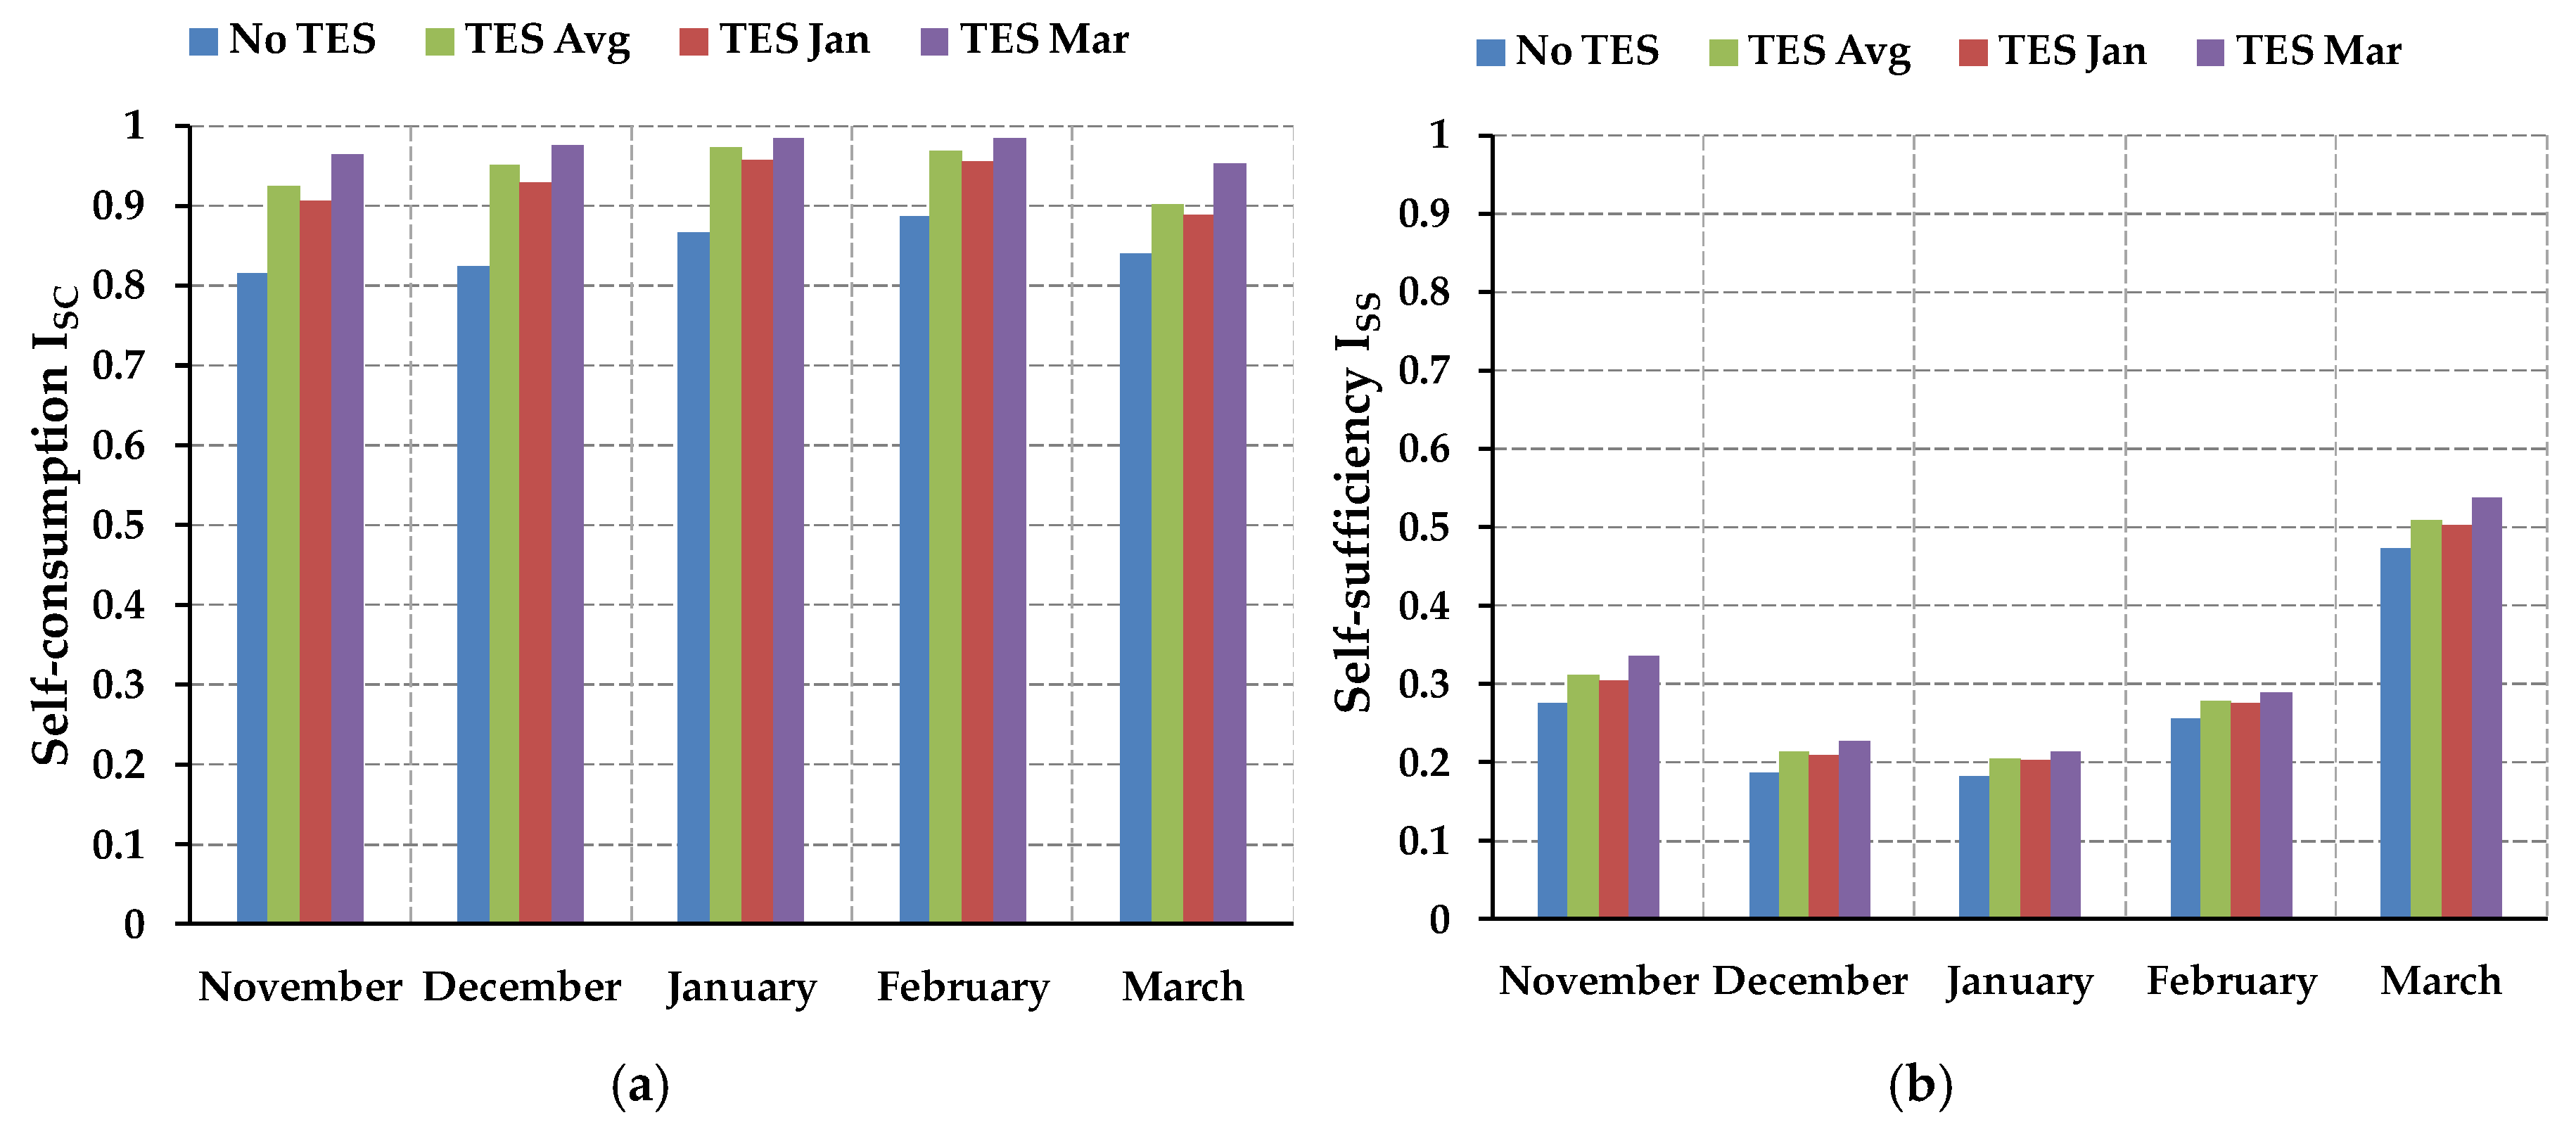
To evaluate the effect of the LHTES on the overall system performance, two characteristic indexes of the PV system were introduced, namely the self-consumption index (
and the self-sufficiency index
) (Equation (8)):
where
is the electricity sold to the utility grid,
is the
PV energy production,
is the electricity purchased from the grid, and
is the energy exploited by the user. Both indexes are calculated for each month of winter operation, considering a base case without a TES system and the three different TES systems sized according to the previously specified criteria (January, March, and the average month).
Figure 8a,b reports
and
as a function of month and sizing criterion.
Figure 8a shows that the
index assumes a high value (above 0.8) for each winter month, even in the base case without TES integration. The integration with the TES system leads to significant benefits on the
value, which increases in the range of 6%–18% (by about 0.05–0.15). In particular, the value of
is strongly influenced by the TES size, increasing with the tank dimension and reaching a maximum of about 0.985 during February in the case of a TES system sized with reference to March conditions. In fact, a greater tank allows storing almost all the energy produced by the PV during the weekend, reducing the energy sold to the utility grid to a value near to zero.
Figure 8b shows that the
index assumes low values (below 0.3 in the base case) for all the winter months except March (around 0.5). The lowest values result in December and January, when the PV production is the lowest. The integration with a TES system leads to benefits also on the
, with an increase ranging between 6% and 22% (about 0.02 and 0.06), depending on month and sizing criterion. In particular, the
value increases with the tank size; as a matter of fact, a greater TES system allows users to better exploit the PV energy, reducing the total electricity acquired monthly from the grid, despite an increase in the amount of energy acquired during the weekend for operating the heat pump under nominal conditions. Globally, the high value of
together with a low value of
indicate an undersizing of the PV system compared with the needs of the users.
6. Conclusions
In this paper, a numerical investigation was carried out to evaluate the performance of an LHTES system based on a packed bed of encapsulated spherical PCM integrated into a micro-grid to be built in a Research Center located in Sardinia (Italy). The main purpose was to exploit a heat pump fed by a PV plant during the weekend to produce thermal energy to be stored in a TES system. Then, during the weekdays, the TES system was used to provide the stored energy to satisfy the users, integrating the existing air conditioning plant and improving the self-consumption of renewable electrical energy and self-sufficiency of the micro-grid. The PCM-TES behavior caused the heat pump to operate under nominal conditions for a limited period of time during charge and discharge phases. Consequently, the TES system was not sized with reference to the theoretically storable energy, but to the actual one (about 25% lower). Three different sizing criteria were adopted. In particular, the TES system was sized with reference to the energy available for storage: (a) on the less favorable month of January, (b) on an averaged winter month, and (c) on the most favorable month of March. The numerical simulations showed that most of the available thermal energy was absorbed by the PCM during its phase transition and that it corresponded to about 80% of the overall energy stored by the TES. The remaining part was stored in the form of sensible heat by both the PCM and the water. The results also showed that the TES system sized with reference to the energy available on March was able to store slightly above 1400 kWh, while sizing with reference to the average month and January led to an amount of energy stored of about 750 and 600 kWh, respectively. Obviously, a greater amount of energy stored is strictly related to a greater volume of the TES system (54 m3 and 23 m3, for March and January sizing, respectively). Furthermore, the simulations returned the temperature profiles of both the water and the PCM within the TES system separately, during charge and discharge phases and idle periods. During most of the overall process, the HTF temperature difference between the inlet and outlet sections of the bed was lower than the nominal one (5 °C), proportionally affecting the thermal power transferred to the TES.
The integration with the TES system leads to significant benefits, on both the self-consumption and self-sufficiency indexes of the PV plant, leading to a reduction in electricity exchanges with the utility grid. In conclusion, the choice of a PCM-TES system requires a notably lower volume than other devices based on sensible heat. On the other hand, the ideal size of the storage system can be assessed only by providing a detailed analysis of the operating and capital costs that could be considerably greater in the case of a PCM-TES and of the possible savings due to the reduction in the electricity exchanges with the utility grid.


