Article

A Holistic Framework for Supporting Maintenance and Asset Management Life Cycle Decisions for Power Systems

1
Perusahaan Listrik Negara, Ketintang Baru No. 11, Surabaya 60231, Indonesia
2
Department of Mechanical, Aerospace and Civil Engineering (MACE), University of Manchester, Manchester M1 3NJ, UK
*
Author to whom correspondence should be addressed.
Energies 2020, 13(8), 1937; https://doi.org/10.3390/en13081937
Submission received: 4 March 2020 / Revised: 10 April 2020 / Accepted: 11 April 2020 / Published: 15 April 2020
(This article belongs to the Special Issue Future Maintenance Management in Renewable Energies)

Abstract

:
The outburst of population as well as increasing industrialisation have triggered a very prominent imbalance between electricity demand and supply in emerging economies such as Indonesia. Based on this premise, electricity generation and distribution firms such as Perusahaan Listrik Negara (PLN) are faced with an urgent need to enhance availability and reliability through capacity expansion as well as the institutionalisation of cost-effective maintenance and asset management (MAM) principles. Some of the principles recommended here involve embedding customised overall health index (OHI) and total life cycle cost (LCC) estimation principles into engineering decisions that relate to asset renewal and/or replacement. While discussions about the fundamental theories and estimation approaches for OHI and LCC for power transformers (PTs) already exist in the current body of literature, however, they are mostly in a generic form which has somewhat limited proper implementation of these valuable principles in practice. This study is unique because it provides a very systematic framework towards achieving cost-effective MAM through a case study. Additionally, the proposed framework is all-encompassing, as it also assesses the impacts of human unreliability through the application or proven risk assessment techniques. The proposed framework commences with the evaluation of existing decision support system at PLN through a MAM audit, whereby the performance of the West Java arm of PLN with regards to critical MAM elements was examined.

1. Introduction

An aftermath of the mid-eighteenth century industrial revolution through to the twentieth century is the ability of humans to generate electricity by exploiting various energy sources [1,2]. The emergence of electricity generation resulted to what can be described as the causal loop of energy whereby advancements in electricity led to the development and operation of several heavy and complex industrial activities, which then contributed to the outburst of global economy. The availability of reliable, sufficient and affordable energy services are vital enablers for economic growth as well as averting most of the challenges currently facing the world, especially inequality, health, education and poverty. Within the past two decades, routine analyses conducted by regulatory agencies such as World Bank have continuously emphasized the correlation between economic growth and electricity consumption [3,4,5,6,7], especially among the non-Organization for Economic Cooperation and Development (non-OECD) countries [8]. In 2012, the non-OECD electricity generation represented more than 50% of the world’s total electricity demand which is projected to further rise to 61% in 2040 (i.e., 11.3 trillion kWh in 2012 to 22.3 trillion kWh in 2040).
A very prominent group of non-OECD countries based on their combined population and economy size is the Association of South East Asian Nations (ASEAN). The combined population of ASEAN is estimated at 638.24 million [8], making it the world’s third largest market. Among ASEAN, Indonesia alone accounts for more than 40% (261.115 million out of 638.624 million) and 36% (932.259 billion out of 1.62 trillion US dollars) of the combined population and gross domestic product (GDP) respectively [9], which makes it one of the most critical nations in the region. Previous studies [6] suggest that energy consumption by ASEAN is projected to rise from 280 million tons of oil equivalent (MTOE) in 2000 to approximately 583 MTOE in 2020, which has triggered a growing level of interest among public policy makers in Indonesia to adequately understand the correlation between electricity generation and economic growth. The same study [6] also suggests that a significant chunk of the estimated 323 billion US dollars investment required to cope with this surge in energy demand in the region could be invested in the electricity generation sector in Indonesia which makes the understanding of asset life cycle costing imperative.
Several studies in the existing body of literature have clearly showed that the top-level issues that often hinder the availability of sufficient, reliable and affordable power to non-OECD countries are well-known and could be classified into infrastructural financing, planning, leadership and institutional capabilities [9]. While it is unreasonable to ignore the magnitude of the fundamental issues that have plagued power industry in these countries, it is equally important to ask the question “has enough been done to preserve and optimize currently held plant assets so as to guarantee that investments in newer assets will be worthwhile?” The natural response would significantly cling on the effectiveness of maintenance and asset management (MAM) strategies. Maintenance can be described as the combination of technical, administrative and managerial endeavours that ensure that industrial assets cost-effectively and safely perform their designated tasks [10,11,12,13,14,15]. Maintenance philosophies can be broadly classified into breakdown maintenance (BM), planned periodic maintenance (PPM) and condition based maintenance (CBM).
A MAM dominated by BM is often characterized by heavy investment in spare parts, huge reactive labour and high failure rates, owing to minimal planning [16,17,18]. The high cost of downtime and safety implications of BM as the sole asset management strategy shifted the paradigm towards PPM which was based on plant run-time and job planning [17,18]. However, the realization that most plant components fail randomly through the emergence of reliability-centred maintenance (RCM) studies by the airline industry in the 1970s triggered the need for CBM [19]. Field and academic experts in maintenance engineering believe that CBM is currently one of the most effective approaches for enhancing the reliability of plant machinery [20,21,22]. While this may be true, it should also be noted that the cost of implementing and continuously operating a typical CBM program could be very significant, depending on the size, complexity and criticality of the considered plant. In order to be truly cost-effective, a plant’s overall MAM strategy would naturally be a combination of CBM (for the most critical assets), PPM (for assets that exhibit definite correlation between failure rates and run-time) and BM (for assets with very low criticality either due to built-in redundancies or low cost implications) [23]. Figure 1 provides a schematic summary of the characteristics of the three main classes of maintenance philosophies.
As impressive as the tremendous growth in the recognition of industrial CBM seems, the guidelines of the recently launched asset management standards - ISO 55000 series (initially a publicly available specification published by the British Standards Institution in 2004) in 2014 makes it crystal clear that asset performance and condition data alone are no longer sufficient for making robust MAM engineering decisions in capital intensive sectors such as power [24]. This is based on the premise that the role of MAM is changing from the classical “problem-fixer” to a very important aspect of asset life cycle management through the incorporation of the following key themes [24]:
  • Clear alignment of organisational objectives (including asset design, operation, decommissioning, disposal and renewal) with MAM strategies and plans
  • Enhance overall asset value through complete asset life cycle MAM planning and cross-functional collaborations
  • Risk-based decision analyses
  • Emphasis on leadership as well as understanding the requirements of all stakeholders
Unfortunately, despite widespread consensus that MAM is a necessity for the cost-effectiveness of any plant, some decision-makers within several organisations still view the maintenance function as a mere cost centre or necessary evil [23,24], which is perhaps why maintenance as a function has struggled to attain the same level of recognition attributed to other vital plant functions such as finance [25,26,27,28,29,30,31,32], production planning [33,34,35,36,37,38,39,40], marketing [41,42,43,44], etc. Searches within several top percentile energy-related journals clearly show a contrariety between the scanty number of academic publications advocating MAM optimisation and the abundant resources on topics such as energy policy and finance. It must be admitted that several researchers [45,46,47] and industry professionals in plant condition monitoring/industrial maintenance have over the years produced commendable studies on power systems. However, most of the currently available studies are usually specific to a particular approach or failure mode which in turn reduces the attractiveness of such individualized approaches to field experts that would most often prefer a systematic, practical and all-encompassing framework that is based on a case study.
The purpose of this paper is, therefore, to practically evaluate the robustness of MAM for power transformers and its potential to serve as a true business partner in the generation and distribution company of a selected non-OECD country, Indonesia. Power transformers within Perusahaan Listrik Negara (PLN) in West Java were chosen for this investigation because they are the single highest value assets installed in high-voltage substations and could account for well over 50% of the total investment [48]. Besides the aforementioned premise of this study, it is also worth noting that a fundamental value of the study lies in the development of a systematic process for assessing and managing critical industrial assets. Through such frameworks and processes, organisations would possess a platform that supports coherence and repeatability of analysis, irrespective of whom performs such or when it was performed. Therefore, the quantitative analysis incorporated here based on an extract of available data from the case study was done to test the applicability and practicality of the proposed framework, bearing in mind that similar analysis can be performed in the future (once new data sets become available). Additionally, the significant rise in consumer demand for enhanced performance from power utilities has triggered the need to base business and engineering investment decisions on a justifiable balance among capital investments, maintenance and operating costs [48,49,50]. The remainder of the paper is organized as follows; Section 2 and Section 3 respectively provide a brief overview of energy scenarios in Indonesia and different maintenance regimes. A description of the methodology adopted and data employed for the study are presented in Section 4. The penultimate section describes a framework for estimating maintenance life cycle cost.

2. A Brief Overview of the Energy Scenarios in Indonesia and MAM Challenges

Projection results have indicated that Indonesia’s electric power demand (EPD) will double from its current 219 trillion Watt-hours (TWh) to approximately 464 TWh in 2024, which corresponds to an electric power demand rate of 8.7% per annum [51,52]. Additionally, the national electrification ratio (NER) which is defined as the percentage of the total population with access to electricity was 87% in 2016 but targeted to reach 99.4% in 2024 [51,52]. Table 1 presents detailed projections of Indonesia’s current and projected NERs over 11 years [51,52] where it can be seen that the government-owned Perusahaan Listrik Negara (PLN) Company dominates the production, transmission and distribution of electricity.
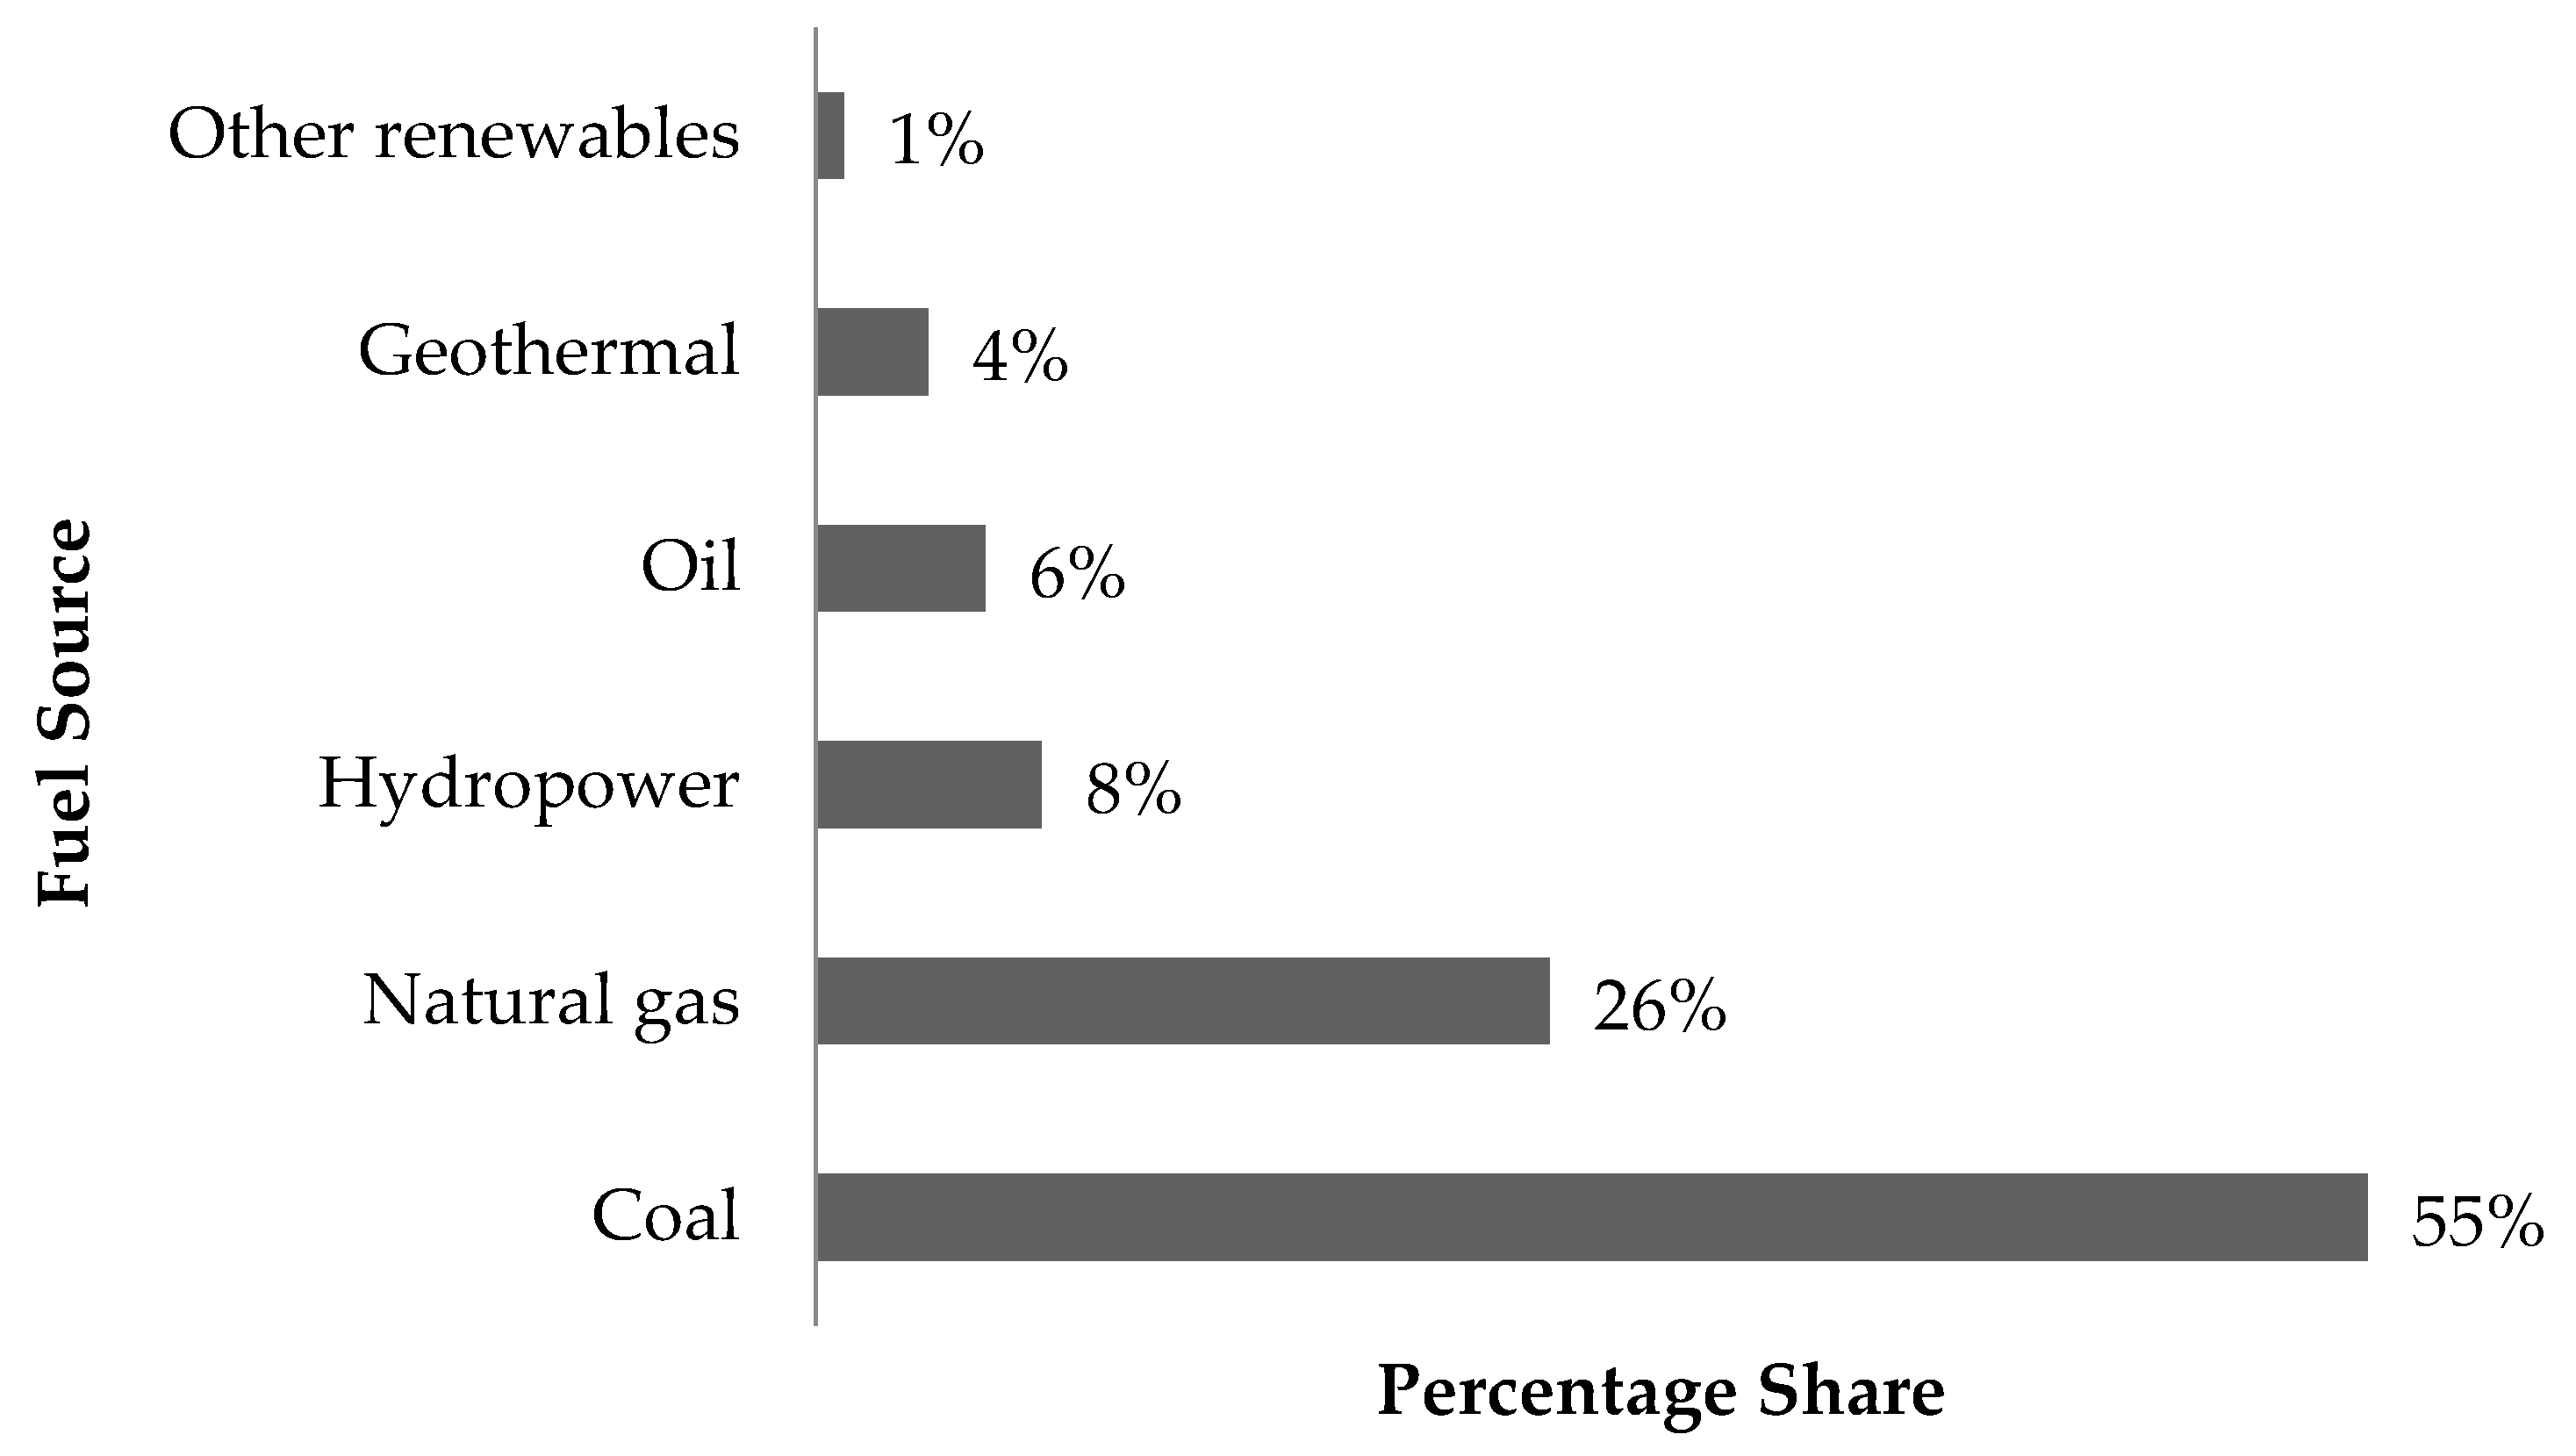
The main sources of energy to PLN are shown in Figure 2, with a split of 87% and 13% for non-renewable and renewable sources respectively. Over the last eight years, the contribution of renewable energy sources has remained relatively constant (i.e., 11% in 2009, 15% in 2010, 12.2% in 2011, 11.35% in 2012, 12.31% in 2013, 11.25% in 2014, 10.47% in 2015 and 12.45% in 2016). However, crude oil as an energy source significantly dropped from 23.7% to 6.5% while that of coal rose to 54.6% from 43.6% within the same period. PLN process architecture as illustrated by 
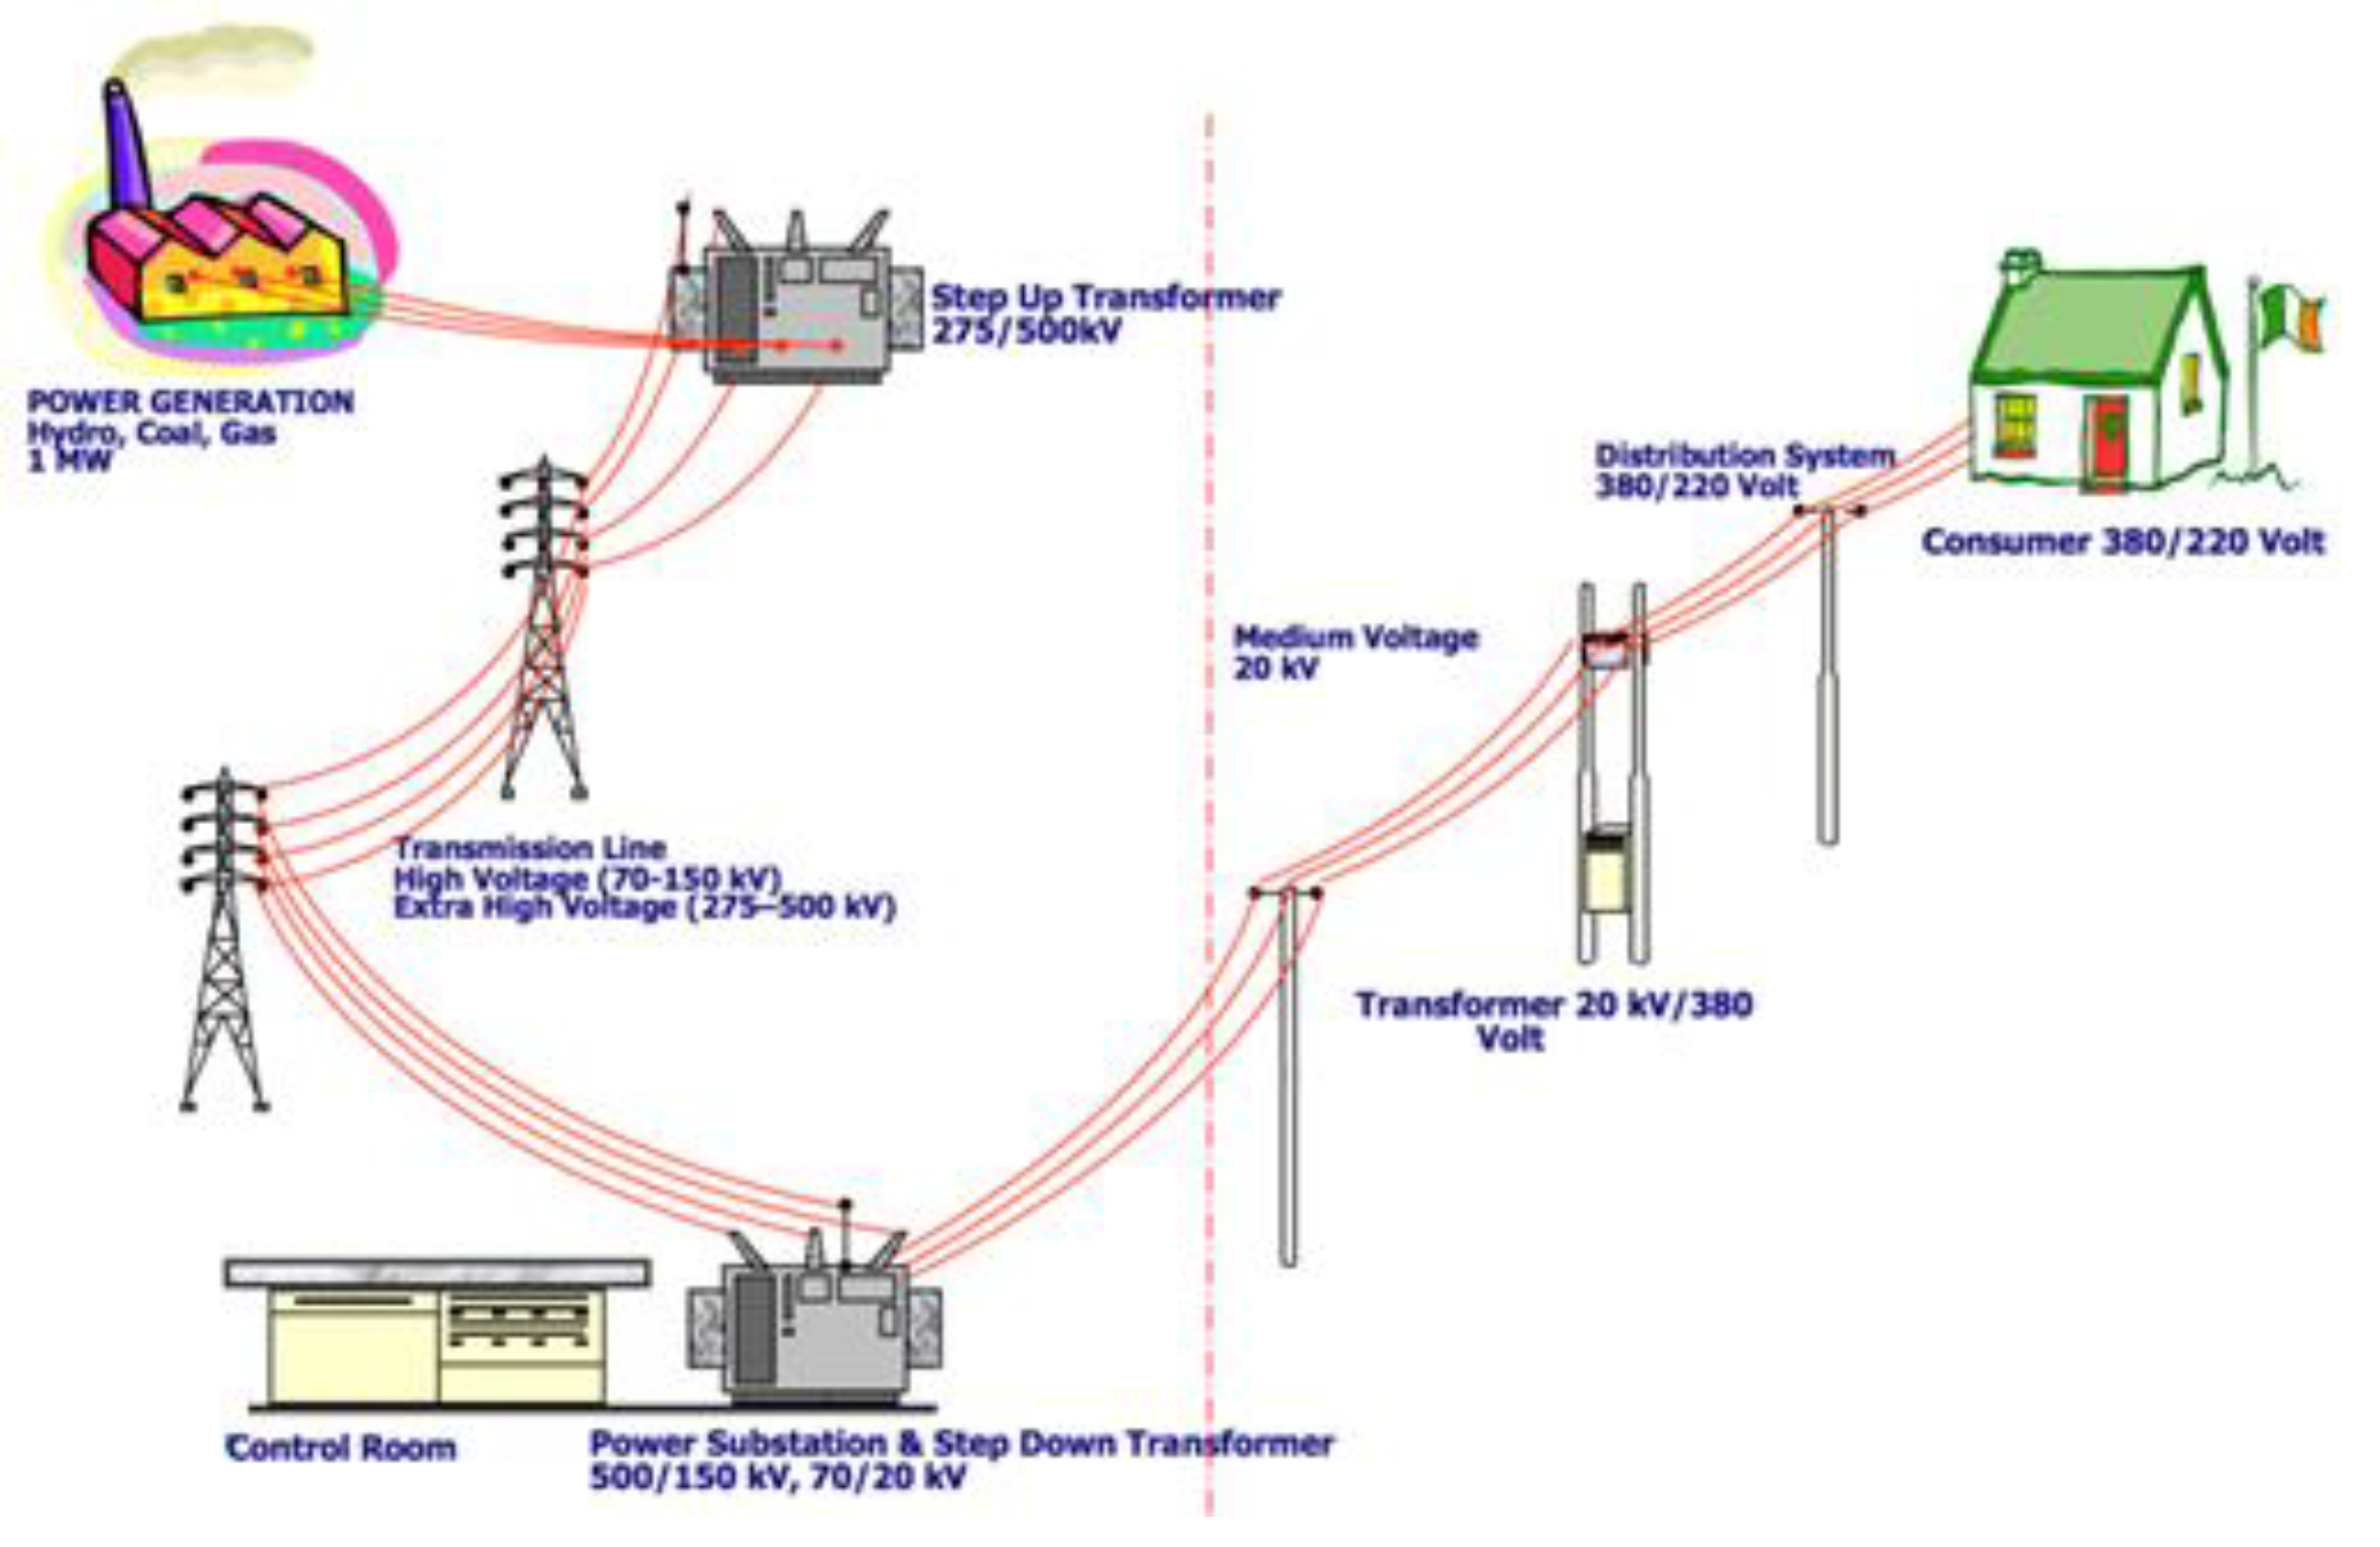
Figure 3 consists of generators that generate power from the various energy sources, transmission system that transfers the generated power and distribution system that manages supplies to the consumers.
Owing to the fact that transformers represent the core of most planned capacity expansions within electricity utility processes, PLN has steadily upgraded the population as well as capacities of its transformers since 2011 as depicted by Table 2. However, despite this steady growth in capital expenditures (CAPEX) and acquisition of new equipment, the disparity between installed and actual outputs has been correspondingly plagued by incessant failures due to lapses in the current MAM strategies. It is thus reasonable to infer that in addition to expanding capacity through the installation of new equipment, improving the reliability of existing assets through enhanced MAM practices provides opportunities for sustainable operations.

3. Maintenance Regimes and Their Interdependence

A significant aspect of MAM is in-depth understanding of the various maintenance strategies deployed and how they influence each other. Figure 1 already provided a brief description of the main classes of maintenance strategies and their individual characteristics. While knowledge about the different types of maintenance philosophies (i.e., BM, PPM and CBM) is widely available within literature [16,53,54,55], their relationships/influence on each other is often neglected. In this section, a very brief overview of each of the popular maintenance philosophies is revisited but with emphasis on the impacts they have on one another and the overall maintenance workload which is vital for MAM planning.
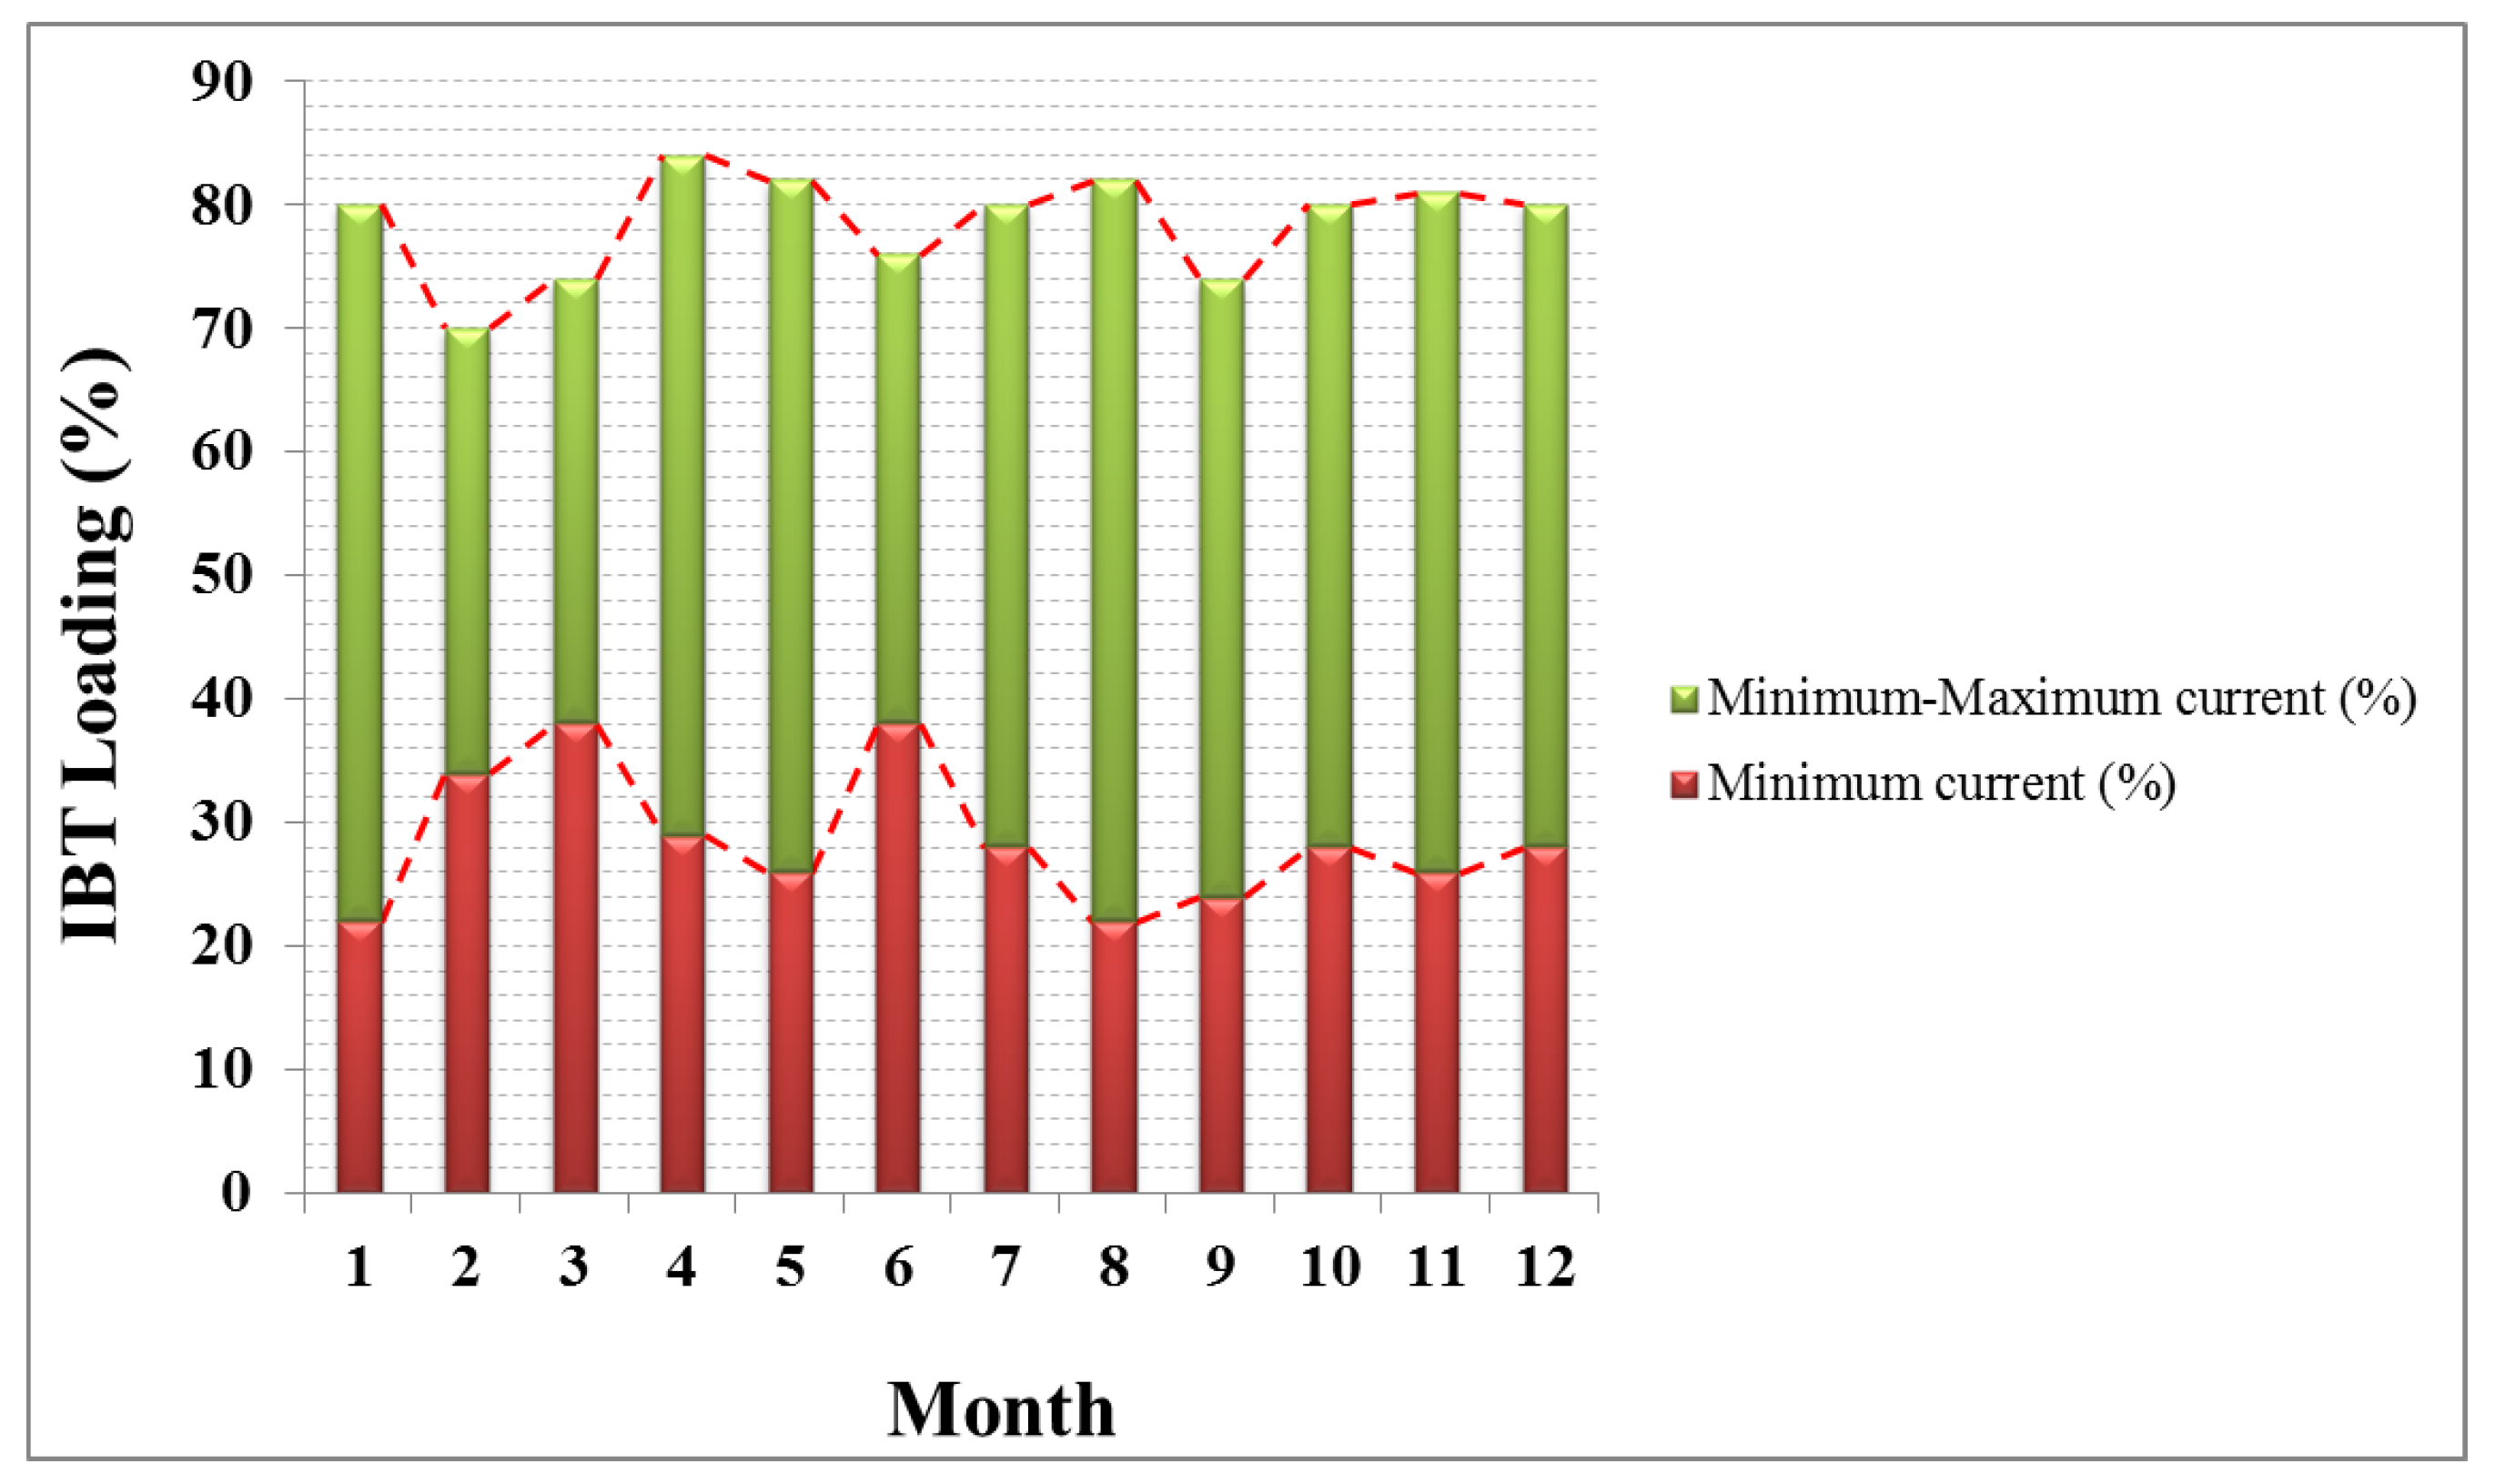
Figure 4 shows that there are three main classes of maintenance (i.e., BM, PPM and CBM). CBM significantly relies on measured parameters and human senses for the determination of asset health. Important aspects of CBM implementation are the monitoring interval and lead time to failure. A well-implemented CBM program should only generate PPMs and non-urgent BMs (lines 1 and 2, respectively). Besides inflating maintenance man-hours, a poorly estimated CBM monitoring interval often leads to urgent BMs (line 3) because asset health would have deteriorated significantly before next measurement.
PPM is based on the premise that assets steadily deteriorate with time. The three main sources of PPMs are original equipment manufacturer (OEM) recommendations, legal requirements and operating experience. A significant number of PPM activities as well as the specific spare parts required for their execution are usually extracted from OEM manuals especially for assets that the plant team are unfamiliar with. Since OEMs are in the business of selling spare parts, asset owners should always explore the possibilities of re-validating the effectiveness and sustainability of initial OEM maintenance recommendations once the operating experience of the plant team increases. However, care must be taken so as not to violate the originally specified operating context. The third and arguably most crucial source of PPM activities is based on legal requirements. Owing to historical cases of industrial accidents, there is a class of PPM activities that are legally binding. For instance, companies are required to certify that the integrity of their pressure vessels is intact at all times through regular inspections. At best, delayed PPM activities increase the need for non-urgent BMs (line 4) and urgent BMs at worst (line 8). For example, a delay in the inspection of pressure vessels could lead to loss of wall thickness which then requires urgent replacement.
BM is the type of maintenance philosophy whereby no repair/replace actions are initiated until failure occurs. Depending on how much time is available for repairs and the criticality of the failure, BM could be further divided into urgent and non-urgent sub-classes. A typical example of a non-urgent BM action is the replacement of the electric motor of a standby cooling water pump that had been previously fitted onto the duty cooling water pump. Under this scenario, such a maintenance action may continue to be non-urgent until a failure occurs on the duty pump. Therefore, delays in non-urgent BMs increase the risks of generating several urgent BMs (line 6). Urgent BMs naturally lack planning due to the limited amount of time available for their implementation which in turn disorganise and delay the implementation of other non-urgent BMs and PPMs (lines 5 and 7).

4. Proposed MAM Framework

The proposed approach entails the fusion of several plant asset reliability enhancement tools into a holistic and practical framework (Figure 5) that will sustainably address the issues identified from the MAM audit, so that engineering decision makers at PLN (West Java) region can have a better understanding of the usefulness of maintenance life cycle costs analysis of new assets from historical information. In this study, the proposed framework (Figure 5) commences with the evaluation of the current state of MAM activities through a plant-based audit. In practice however, audits can also constitute the final stage of the framework whereby audit findings are used to improve the quality of system inputs. Once a reasonable understanding of the current state is gained, the next step involves identifying the relevant standards for PT health management, estimation of health index, failure analysis (including failure investigation using FTA, RBD and FMECA approaches) [51,56,57,58,59,60,61,62], useful age and cost estimations. The final stages of the framework involve the harmonization of the acquired information to improve engineering decision-making as well as the routine evaluation of the suitability of such decisions.

4.1. Information Gathering and Triangulation

The authors of the current study decided on the application of a case study owing to the need to obtain an all-encompassing but yet in-depth practical understanding of MAM activities in PLN West Java, with particular emphasis on the power transformers through audit and benchmarking. The fundamental aim of a typical MAM audit is to generate and possibly institutionalise a systematic process that helps identify the areas of strengths and weaknesses of the existing system so as to easily identify where specific efforts need to be focused [63,64].
Data from various sources including plant documentation, questionnaires, interviews, direct observation and archival records were acquired. The selection of several information sources is based on the premise that no single data source is absolute; rather, the strengths of one source might complement the weaknesses of others. The questionnaire (see Appendix A) was divided into five main parts, called audit elements (AE). The first audit element (i.e., maintenance strategy and planning, AE1) sought information regarding general management of MAM activities, including; frequency and planning of maintenance, maintenance tasks criticality classifications, and the role of criticality ratings on strategies (i.e., BM, PPM and CBM) selection. The remaining audit elements (i.e., AE2–5) respectively sought information about critical failures and their investigation (AE2), staff competence and development (AE3), performance evaluation (AE4) and MAM life cycle cost evaluation (AE5).

4.1.1. AE1: Maintenance Strategy and Planning Activities

MAM activities are mainly managed by a computerised maintenance management system (CMMS) known as the Legacy System Application (LSA). The LSA comprises of 3 integrated applications, namely; Pekerjaan Instalasi Penyaluran (also known as JALUR), CBM and forced outage information system (FOIS). Though integrated, but each application handles a different aspect of maintenance. For instance, JALUR is only concerned with PPM (i.e., daily, weekly, monthly, 3-monthly, yearly and 2-yearly maintenance schedules) while CBM is a predictive maintenance application designed to acquire both visual inspection and measured transmission equipment data from operators. The FOIS and JALUR modules of the LSA are actively implemented but same cannot be said about the CBM module. Further examination of maintenance planning and their frequencies revealed that the so-called predictive maintenance activities as indicated by the LSA system were never done in advance but on a needs basis (usually when failures occur so as to obtain evidence for root cause failure analysis) which raised the question as to whether this is actually CBM or BM. According to the plant’s most recent MAM records (i.e., 2016), the approximate annual split between the different classes of maintenance philosophies is 1176 h of BM (45%), 1320 h of PPM (51%) and 96 h of CBM (4%). FOIS also revealed that as many as 1018 (of which 433 and 585 were classified outage and non-outage respectively) individual Java-Bali transmission system total failures were recorded within the last two years alone, which resulted in 14,846 MWh of energy not served (ENS). The transformer category of equipment accounted for 30% (305) of total failures and 97% of ENS (14,431 MWh). Table 3 provides a breakdown of the failures and the class of contributing equipment.

4.1.2. AE2: Critical Failures and Investigation

Since the transformer category of equipment are the most critical based on their failure frequency and impact on ENS, a further review of 8-year (2008–2016) statistical data of transformer failures revealed that winding, bushing and OLTC respectively accounted for 83%, 13% and 4% of total failures. These failures and their corresponding periods are further illustrated in Table 4. It is quite clear from the failure records that winding and bushing failures are chronic in nature, which raises significant questions about the existing failure investigation approach within PLN.
To further confirm this assertion, a combination of two very popular risk assessments tools (fault tree analysis and reliability block diagram) was used to investigate one of the most recent power transformer bushing failures. Fault tree (FTA) [15,53,54,65,66,67,68,69,70,71] and reliability block diagrams (RBD) [53,54,72,73,74,75] are very illustrative performance evaluation tools that have been immensely used for investigating critical plant failures across a variety of industries within the last five decades.
The connections between the different events of a classical FTA is done using logic gates such as AND, OR, k-out-of-n, exclusive OR, inhibit, etc. However, since the relationships that exist between most real-life events can be comfortably represented by either AND or OR gates, the same approach is adopted here. The success of industry-based FTAs is often a function of the experience of the investigating team, which is why a brainstorming element is often recommended. Based on this premise and to foster practical knowledge transfer, a team-based FTA was employed at PLN.
It is vital to note that besides visually representing the relationships between various causal factors of an FTA, it is also possible to estimate the probability of occurrence of the “unwanted” or “top event” using Equations (1) and (2) [53,54,65,66,67,68,69,70,71,76];
OR gate:
P ( X O R   g a t e ) = 1 k = 1 n ( 1 P ( X k ) )
where n denotes the number of input fault events, P ( X O R   g a t e ) is the probability of occurrence of OR gate’s output fault event X O R   g a t e and P ( X k ) is the probability of occurrence of input fault event X k (for k = 1, 2, 3, …, n).
AND gate:
P ( X A N D   g a t e ) = k = 1 n P ( X k )
where P ( X A N D   g a t e ) is the probability of occurrence of AND gate’s output fault event X A N D   g a t e .
The FTA and RBD for the catastrophic failure of the power transformer 1 (PT 1) failure are respectively shown in Figure 6 and Figure 7 where G1–G7 are the logic gates, IE1–IE6 are the intermediate events and b1–b10 are basic events. The results of the investigation shown in Figure 6 and Figure 7 were then compared to the findings obtained from the RCFA earlier conducted in-house which only identified incompatible design as the cause of failure. Based on the RCFA recommendations, PT1 bushing was replaced but the replacement bushing only lasted four days. However, in addition to incompatible design (i.e., b1), the FTA also captured people and system lapses (i.e., b3–b10) which makes the current investigation more holistic despite similarities in team composition.
In addition to the FTA, an equivalent RBD (Figure 7) was generated so as to further expose the vulnerabilities of the entire system. An RBD is a collection of logical representations that either illustrates combinations of system elements that could lead to failure or success [53,54]. It is evident from both Figure 6 and Figure 7 that people issues play a very significant role in the recurrent failures that have plagued the ability of PLN to realise its ENS targets.

4.1.3. AE3: Maintenance Staff Competence and Development

The plant management team at PLN (West Java) recognizes the relevance of staff development, especially owing to the growing design and operational complexities associated with crucial industries such as power. The organisation has occasionally invested heavily in staff development programmes at different levels, including instances of maintenance staff attending master’s level courses at some of the best institutions in the world. Despite these efforts, the general audit responses and failure investigations still indicate that some of the core derelictions hinge on lack of adequate, systematic and up-to-date MAM training programmes. The fault tree in Figure 6 categorically attributed several causes of failure to staff skill levels. For instance, wrong installations, extended plant downtimes due to poor maintainability, poor maintenance procedures, etc. Some of the auditees further explained that the maintenance team made very negligible contributions to the design and installation of new plant assets but rather inherit them along with their design flaws from the project team after commissioning. The incorporation of plant operators and maintainers into capital projects core teams could serve as:
  • A means of promoting asset ownership, since all parties would have contributed their respective ideas to the various stages of the design, installation and commission
  • An avenue for incorporating maintenance awareness into the very early stages of design and installation so as to avoid costly retrofitting. For instance, the audit and fault tree analysis revealed that accessibility issues were significant causes of poor maintainability.
  • An on-the-job training platform for plant operators and maintainers, whereby they can actively participate in the development of the standard operating procedures.

4.1.4. AE4: Maintenance Performance Evaluation

Performance evaluation is very vital to the sustainability of any MAM system, especially when it relates to assets within a capital intensive industry such as power. Routine audits and benchmarking are some of the most widely applied industrial performance evaluation tools. For an organisation like PLN with multiple plants across different regions in Indonesia, it would be expected that internal benchmarking activities are well-established since the different regional plants perform differently with regards to performance indicators such as ENS, MAM strategies split and maintenance workload allocation. According to historical data, a combination of CMMS records and response from auditees revealed that there is a significant sense of false economy at PLN with regards to maintenance workload tracking. The contributions of internal maintenance labour is not tracked and hence doesn’t form part of the downtime cost estimation based on the premise that PLN maintenance staff are integral parts of the organisation and would always be available. Despite these limitations, the performance of PLN (West Java) with regards to AE4 was far better than it did in the other elements, owing to evidence of a recently concluded audit for ISO 55000 certification conducted by members of the Institute of Asset Management (IAM). This audit only focussed on establishing failure modes and effects analysis (FMEA) principles as a means of creating a criticality rating scheme that would help determine what assets to prioritise. Unlike the audit performed as a part of this study, that performed by IAM was a one-off exercise that did not cover all of the elements of a typical MAM system, but could provide a basis for future comparisons.

4.1.5. AE5: Maintenance and Asset Management Life Cycle Cost Evaluation

Despite the availability of relevant and sufficient data, there is no established framework for estimating maintenance life cycle cost of currently held assets which implies that this does not contribute significantly towards the engineering decision-making and budgeting process for plant assets.

4.2. Identification of Relevant Standards

There are various guidelines stipulated by well-known electrical standards organisations such as International Electro-technical Commission (IEC), Institute of Electrical and Electronics Engineers (IEEE) and American Society for Testing and Materials (ASTM) for individual parameters during in-service and shutdown measurements. For instance, ASTM D3612-02-2009/IEEE C57 104 2008/IEC 60599 2007 for dissolved gas analysis (DGA); IEC62021-1 for acidity level; IEC60814 for water content; IEC 60156-02 for dielectric strength; IEC 60247 for tan delta and metal in oil; etc. Table A1 in Appendix B provides a detailed summary of some commonly applied standards, which have also been consulted during this study.

4.3. Principles of PT Condition Assessment Using Overall Health Index (OHI) Approach

An accurately conducted OHI estimation can help quantify asset condition based on several criteria that provide reasonable indications of how close such an asset is to its end-of-life. OHI estimation is quite popular amongst academics and professionals in the power industry, with several academic publications [48,77] already stipulating their full details. However, our focus here is to develop a framework that can potentially help energy providers such as PLN to shift the paradigm from just performing OHI because it is a recommendation (which has not adequately promoted process ownership, based on the MAM audit results) to a true value addition tool that is adequately incorporated into engineering decision-making processes. The accurate estimation of OHI is quite critical and often necessitates the inclusion of two basic test classes; electrical and insulating oil tests [48]. The electrical tests are basically conducted to ascertain the insulation integrity of PT windings which also establishes the power factor (PF) for overall insulation of windings and bushings. The PF for a typical PT is estimated based on measured values of voltage (V), current (I) and power (P), using Equation (3) [77]:
% PF = P VI × 100
A chart of the commonly used classifications of PF and the corresponding PT health is provided in Table A2 in Appendix B.
Insulating oil tests on the other hand are conducted to determine the suitability of the insulating oils. This evaluation of oil integrity often entails the monitoring of condition indicators such as dissolved gas analysis (DGA), furfural and oil quality. The respective limit values of scoring and weighting for each of the parameters is often mathematically estimated using Equation (4) and then compared to the standard chart shown in Table A3 (Appendix B). For example, the score for DGA is divided into six grades, with one denoting good/fit-for-purpose and six denoting poor. For the weighting factor on the other hand, factor importance increases with the allocated number (i.e., lowest number indicates least important and vice versa). In practice, it is crucial to note that DGA information by itself may or may not be self-sufficient for accurately establishing the health status of a PT, owing to the fact that normal operation could generate some of the gases. It is therefore vital to integrate all other historical information such as previous faults, maintenance, OEM data and loading routine [48]:
% DGAF = i = 1 7 S i × W i i = 1 7 W i × 100
The oil quality factor (OQF) can be similarly estimated using the approach described for DGAF in Equation (4) but the scoring and weighting regimes differ as clearly depicted in Table A4 (Appendix B). Table A4 (Appendix B) provides the grading methods for estimating OQF based on IEEE C57.106-2006. Though not conducted on a periodic basis for PTs, furan tests can be very useful post-diagnostic estimators for the amount of polymerisation associated with the paper insulation within PT oils. Typical furan compounds that emerge from such polymerisations include 2-furaldehyde (2-FAL), 2-acetylfuran (2-ACF), 2-furfuryl alcohol (2-FOL), 5-methyl-2-furaldehyde (5-MEF) and 5-hydroxymethyl-2-furadehyde (5-HMF). Extensive information with regards to measurement and classifications of furanic compounds are available in an earlier study by Pahlavanpour and Martins [78]. Furan tests are often recommended for ageing PTs (typically those more than 25 years old) or if signs of overheating are observed. If reliable furan measurement data is available, then such data can be included in the OHI calculation of the monitored PT. However, if the PT oil has been changed or reclaimed, furan measurements will not provide any meaningful information about the insulation paper degradation [48].
The final stage of PT health assessment is the estimation of the OHI by harmonizing the values obtained from each of the condition assessment criteria. Despite the availability of ample information [48,77] with regards to the application of OHI for PT health monitoring, a significant number of electricity generation and distribution companies including the case study PLN (West Java), prefer to implement a more simplistic approach of failure probability estimation. This approach as currently implemented at PLN (West Java) is based on a ( n SI × n CI ) matrix of susceptibility (SI) and condition indexes (CI), whereby SI and CI both vary from 1–3 respectively. CI parameters directly relate to the PT while SI parameters on the other hand relate to external factors such as load type, true fault current, etc. The SIs and CIs are classified according to known standards, whereby values ranging from 7–9, 4–6 and 1–3 respectively correspond to good, fair and poor. Equation (5) further provides a description of the matrix configuration for better clarity:
OHI = [ CI 1 CI 2 CI 3 SI 1 a ( SI 1 , CI 1 ) a ( SI 1 , CI 2 ) a ( SI 1 , CI 3 ) SI 2 a ( SI 2 , CI 1 ) a ( SI 2 , CI 2 ) a ( SI 2 , CI 3 ) SI 3 a ( SI 3 , CI 1 ) a ( SI 3 , CI 2 ) a ( SI 3 , CI 3 ) ]
The product of the indexes are then used to classify the PT into grades A (<10% probability of failure), B (10–30% probability of failure), C (30–70% probability of failure), D (70–90% probability of failure) and E (>90% probability of failure). While this approach is quick and simple, its proneness to high levels of subjectivity makes it unsuitable for critical engineering decision analysis, especially when such decisions involve huge capital expenditures (CAPEX). As an illustration, a PT with condition index of 1 (i.e., poor) that operates in a good environment (i.e., susceptibility index = 9) will have the same probability of failure as another PT with condition index of 9 (i.e., good) that operates in a poor environment (i.e., susceptibility index = 1). Such generalised classifications often lead to the wrongful allocation of maintenance actions and resources, which at best increases overall maintenance cost and at worst leads to catastrophic failures. In order to significantly minimise subjectivity that has contributed to some of the failures shown in Table 4, the current study explores practical implementation of OHI estimation model reported in Jahromi et al. [48] which considers many more factors relating to PT health. During OHI estimation, the total condition score of each component is divided by its maximum condition score and then multiplied by 100 so as to always maintain a band of scores that lies between 0 (i.e., totally deteriorated) and 100 (i.e., perfect state of health). The A-E condition ratings shown in Table A11 (Appendix C) are converted to a factor between 4 and 0, respectively, referred to as health indication factor (HIF). Equation (6) provides the mathematical relationship of the various condition assessment parameters:
OHI = [ 0.6 ( j = 1 21 K j HIF j j = 1 21 4 K j ) + 0.4 ( j = 22 24 K j HIF j j = 22 24 4 K j ) ] × 100
The usual practice is to directly obtain recommended values of Kj and HIFj from standard tables such as that shown in Table A11 (Appendix C). These values are solely based on a comprehensive international survey conducted by a working group of CIGRE on large PT failures, where it was adjudged that approximately 40% of failures were associated with OLTC and the remaining 60% were attributed to the PT [79]. Since these percentage allocations are based on broad and generalised surveys, they may or may not accurately represent the true situations within every plant. In order to generate OHI that accurately represents the PTs within the case study, plant failure records were used to modify the weighting factors shown in Equation (6). According to the 8-year failure records examined during the MAM plant audit (also shown in Table 4), PT and OLTC associated failures respectively accounted for approximately 80% and 20% of total failures within the studied period. Hence, Equation (7) has been modified accordingly to generate the proposed representative OHI shown in Table 5.
OHI PLN = [ 0.8 ( j = 1 21 K j HIF j j = 1 21 4 K j ) + 0.2 ( j = 22 24 K j HIF j j = 22 24 4 K j ) ] × 100
For the purpose of practical illustration, the OHI results in Table 5 have been computed for just PT1 Kembangan that encountered the catastrophic failure investigated using the FTA and RBD in Figure 6 and Figure 7. The OHIs for all three phases (R, S and T) were estimated to be 53, 44 and 45 which correspond to fair, poor and poor conditions respectively.

4.4. Systematic Determination of Remaining Useful Life Using OHI and Failure Distribution

While the MAM patterns and requirements may differ, it is generally understood that all plant assets (including PTs) obey the different stages of a typical life cycle framework. Based on this premise, asset owners aiming for cost-effect business operations must have good understanding of how to predict the end of useful life of their assets, so as to proactively plan for replacement or upgrade. The estimation of OHI in itself is just a means to an end when it comes to CAPEX decisions; however, it provides valuable indications as to when a capital asset such as PT is approaching the end of its useful life. PTs are characterised by a certain level of design strength which diminishes in proportion to the wear and tear associated with routine operation. It can therefore be assumed that the probability of PT failure is equivalent to the probability of the stress generated from routine operation exceeding the characteristic strength [48]. Figure 8 provides a graphical illustration of how OHI and failure probability of the Kembangan PT at PLN (West Java) can be used to estimate its effective age.
Critical plant assets are often a fusion of both maintainable and non-maintainable items. During the process of remaining useful life estimation, the maintainable items can be excluded (i.e., setting their OHIs to zero) based on the assumption that this class of items have the ability to return to “as new condition” through the initiation of appropriate maintenance interventions. Hence, by removing the maintainable items from the OHI list in Table 5, the resultant OHIs for the Kembangan PT are 35 (phase R), 30 (phase S) and 30 (phase T) respectively. It should be noted that OHI computed here are based on actual heath indexes (HIs) for each of the PT condition assessment parameters provided in Table A5, Table A6, Table A7, Table A8, Table A9, Table A10 and Table A11 and Figure A1 in Appendix C. Once the OHIs are known, the corresponding probability of failures for each PT phase can be easily obtained by reading-off the values from the standard curve as shown in Figure 9, which is equivalent to 0.125, 0.15 and 0.15 for R, S and T respectively.
Since the standard chart provided in Figure 8 was generated from a survey of PTs under different operating contexts, the results obtained from it are most suited for ballpark estimates. Therefore, by plotting the failure rates obtained from Figure 8 onto Figure 9a, the effective age for each phase was obtained as 29.5, 39.6 and 39.6 for R, S and T, respectively.
Table 6 years (i.e., in-service age) and its effective age per phase based on OHI/failure rate relationship are 29.5, 39.6 and 39.6 years. Therefore, the ageing rates per phase can be obtained by dividing the latter by the former which is equivalent to 4.91, 6.6 and 6.6 respectively, as the relationship in Equation (8) shows:
γ P = A e f f , P A O
where γ P represents the ageing rate for the studied PT phase (i.e., R, S or T), while A e f f , P and A O are respectively the effective and operational ages.
Once the ageing rate ( γ P ), effective age ( A e f f , P ) and the age ( A T F ) at which the probability of failure will equal 99% (i.e., approximately 56 years from Figure 9b) are known, the remaining useful life ( μ L i f e ) per phase were estimated in accordance with Equation (9) and the corresponding results are summarised in Table 6:
μ L i f e = ( A T F A e f f , P ) γ P
It is crucial to highlight that the remaining useful life estimated based on 99% probability of failure is very conservative and unlikely to be implemented indubitably in practice, as it may leave no room for reaction to catastrophic plant downtime. However, it provides good basis upon which asset owners can plan as well as manage their MAM budgets cost-effectively.

5. MAM Life Cycle Cost Mapping

The current body of literature holds substantial guidance on asset life cycle costing analysis (LCCA) [80,81,82,83,84]. However, the practical integration of LCCA approaches into routine plant management systems especially MAM cannot be described as widespread. One fundamental limitation of the conventional LCCA approaches is lack of full acknowledgement of the interdependence that exists between system reliability and cost [81,82,83,84]. The current study proposes a MAM life cycle cost (MAMLCC) for PTs, based on item structure and maintenance regimes (i.e., BM, PPM & CBM for which their respective intervals are shown in column 3 of Table 5). For easy identification of the materials and spares required, the PT system is broken down into electromagnetic circuit, current carrying circuit, dielectric, mechanical structure, protection/relay system, cooling system, bushing and tap changer.
The approach to the maintenance costing adopted here is based on the maintenance regimes namely BM, PPM and CBM [85,86,87]. However, the maintenance costing strategy at PLN (West Java) recognises two main maintenance regimes (i.e., preventive and BM). BM represents maintenance costs incurred post-failure while the preventive integrates both PPM and CBM [88,89,
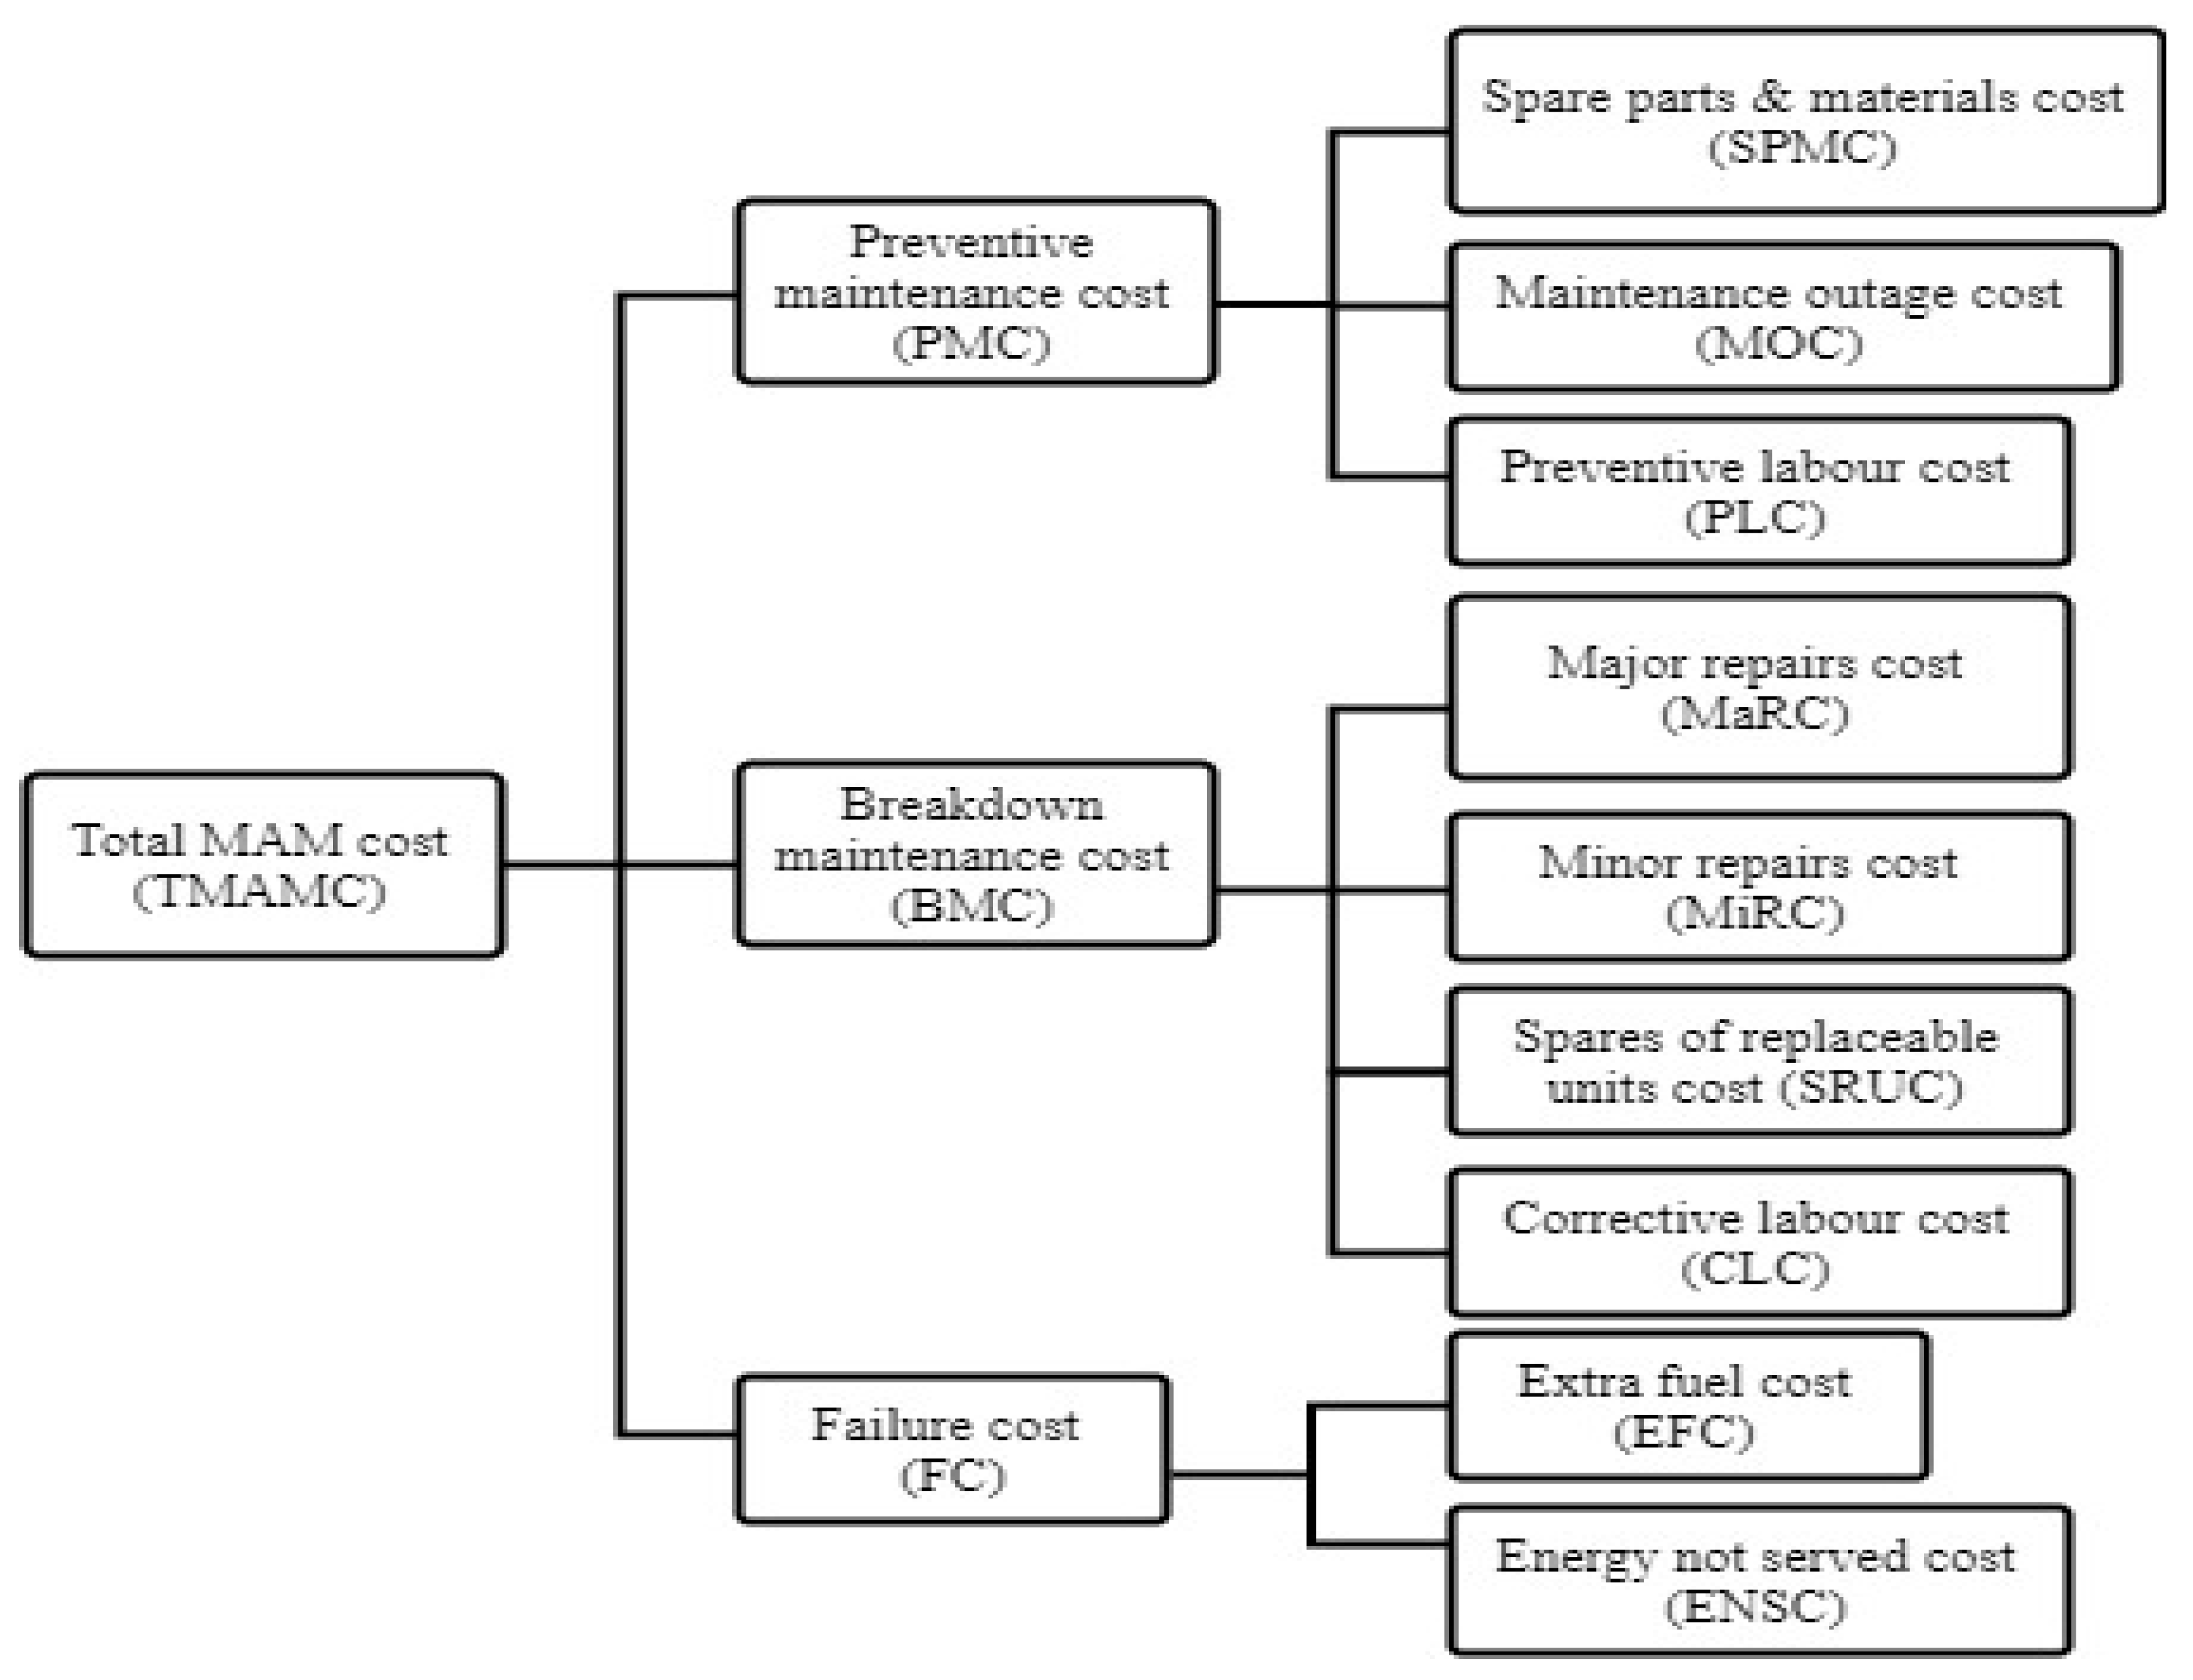
90] into a common class owing to the fact these are activities performed pre-failure. In addition to the cost components of the individual maintenance regimes (e.g., spare parts/materials, maintenance outage cost, major repairs cost, minor repairs cost and labour), a significant percentage of total MAM cost can be attributed to failure cost (i.e., extra fuel cost and cost of ENS). For clarity, Figure 10 provides a flowchart of the major MAM cost elements for a typical PT. It should be noted that other vital cost elements such as safety and logistics/supply chain costs are not standalone elements of the total MAM cost because they have been integrated into the materials and labour costs.
Based on the cost elements mapped in Figure 10, the annual TMAMC of PLN’s (West Java) PT can be estimated using Equation (10):
TMAMC = PMC + BMC + FC
where PMC, BMC and FC denote preventive maintenance, corrective maintenance and failure costs, respectively, as already shown in Figure 10, which were individually estimated for the case study according to Equations (11)–(14):
PMC = SPMC + MOC + PLC
BMC = λ ( t ) [ ( ρ ( t ) MaRC ) + ( 1 ρ ( t ) ) ( MiRC + SRUC + CLC ) ]
MaRC = c = 1 4 ρ ( t ) CEC
FC = λ ( t ) ( EFC + ENSC )
In Equations (11)–(14), λ ( t ) , ρ ( t ) , CEC and c respectively represent the equipment failure rate, probability of major repairs, critical equipment costs and critical equipment.
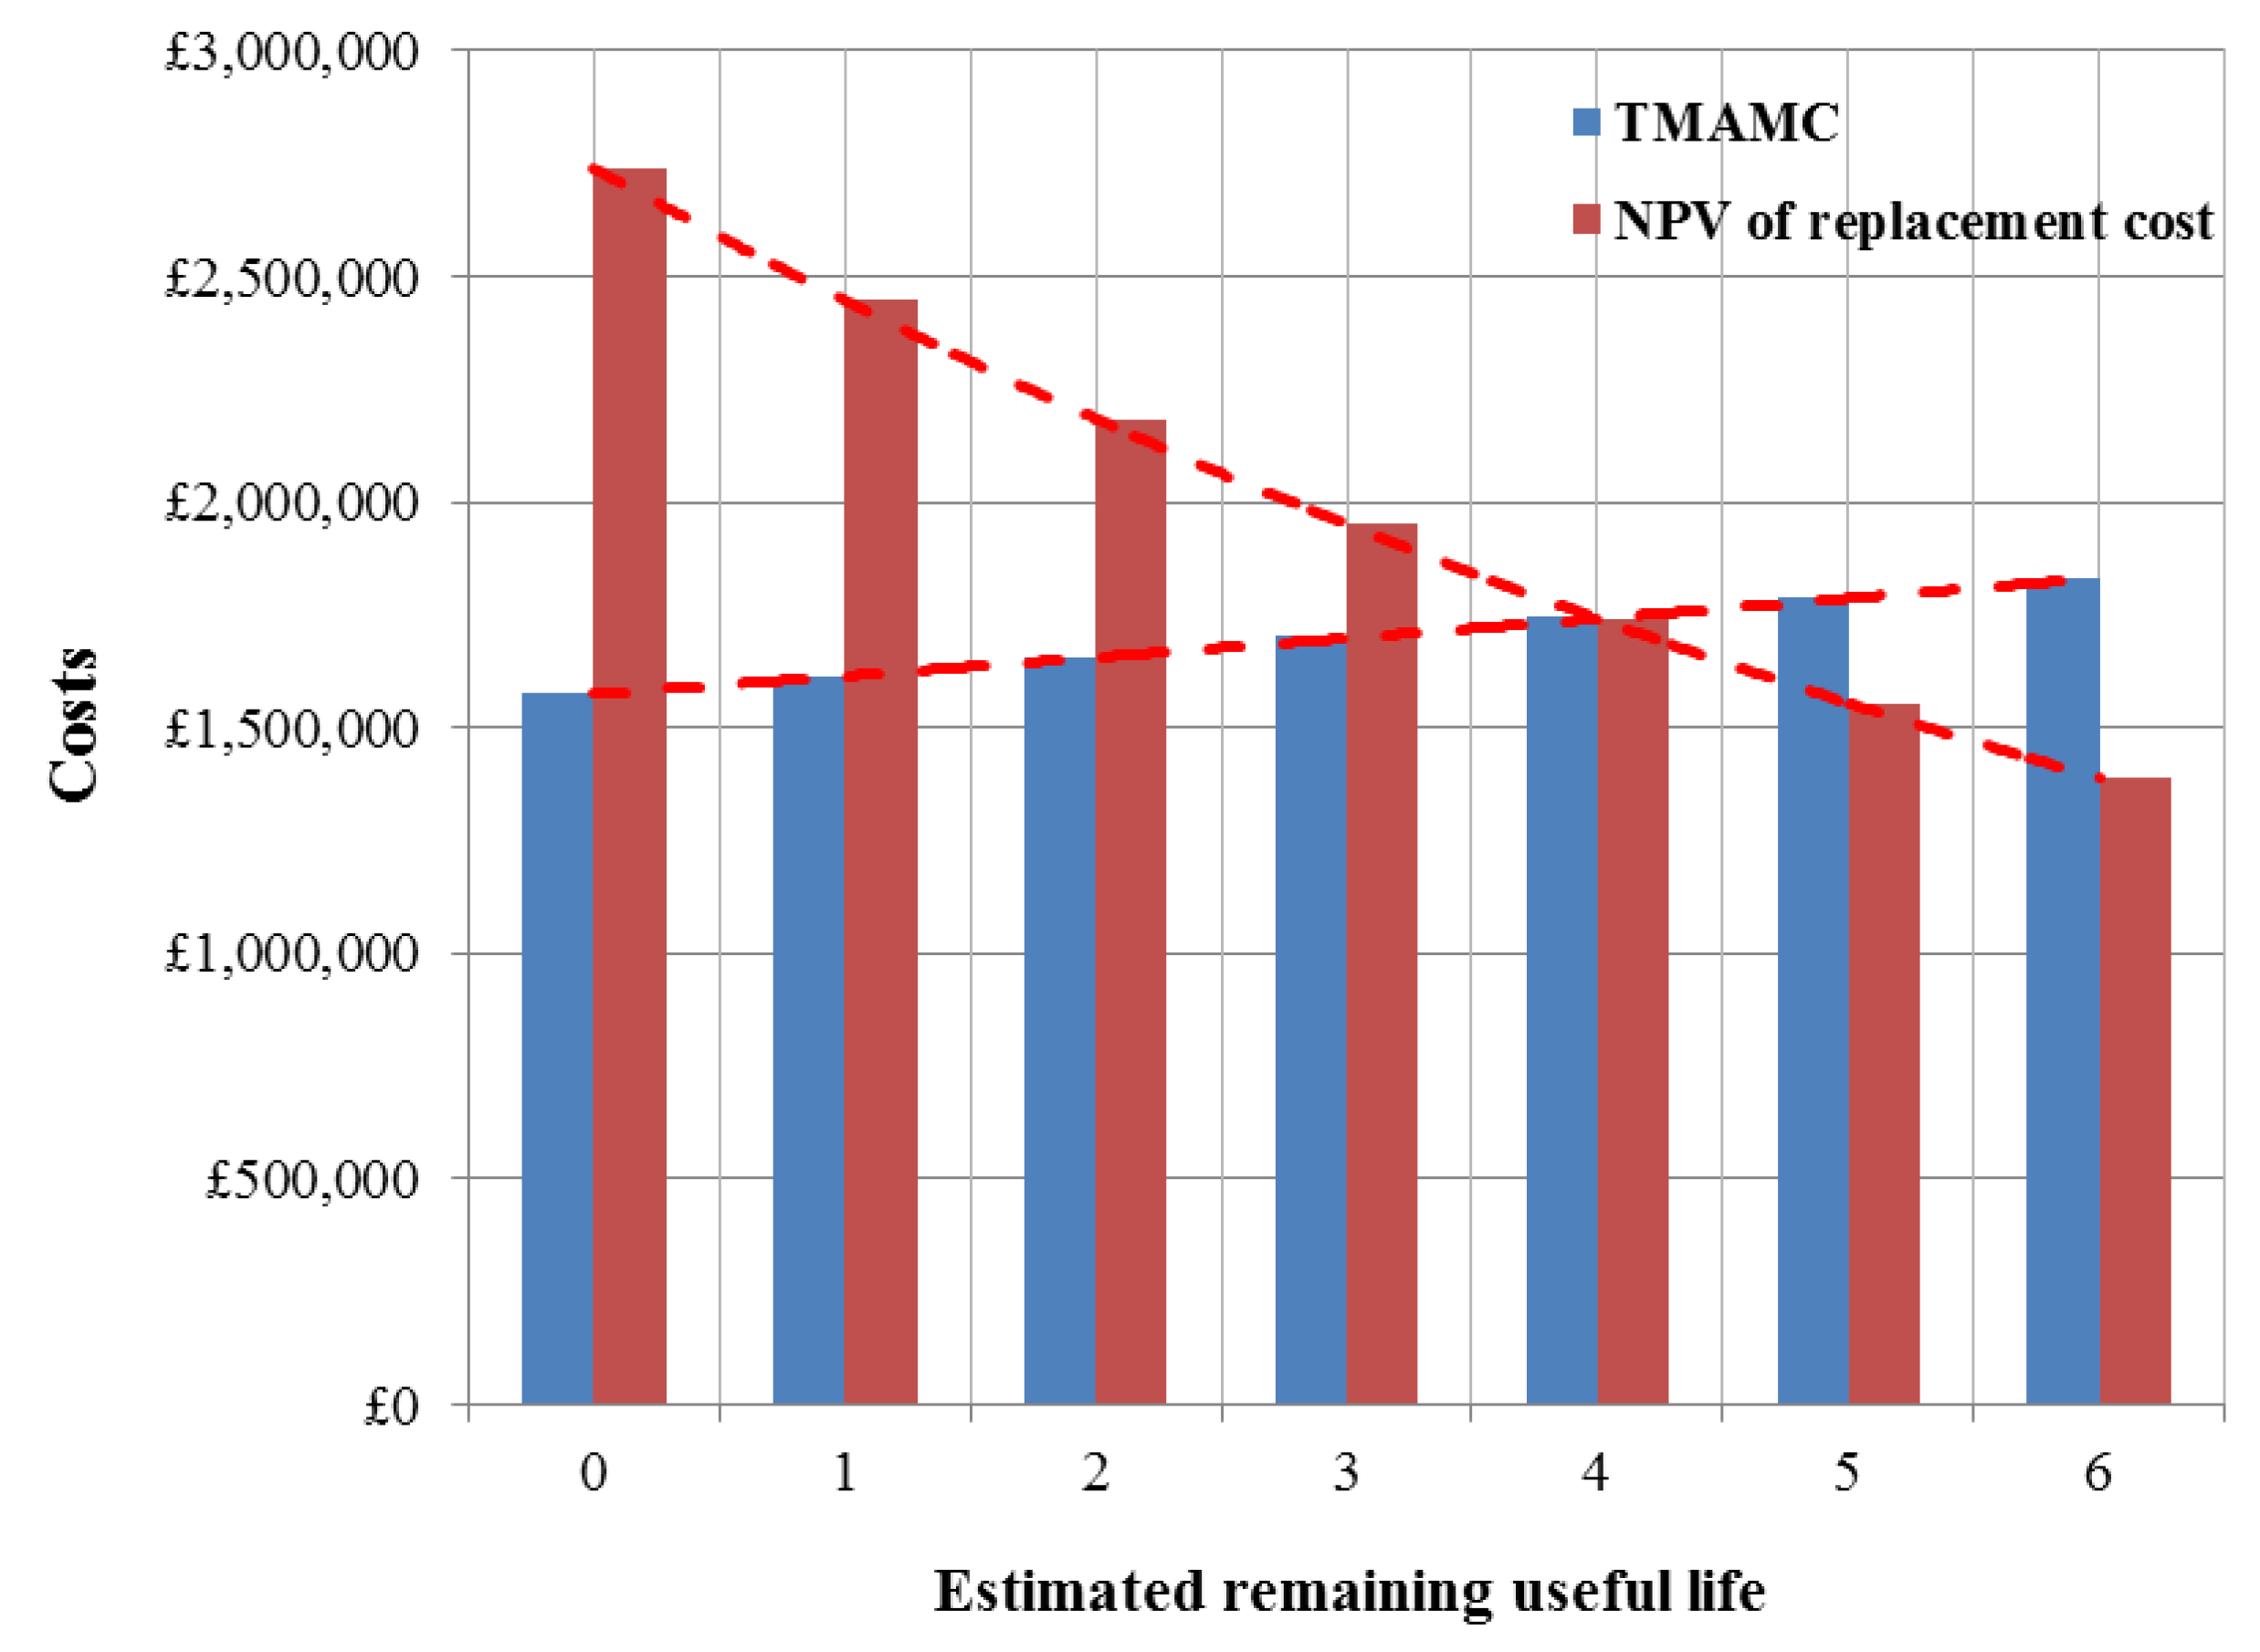
The historical and present values for each of the critical maintenance cost elements that constitute TMAMC were then mapped and estimated for the entire remaining useful life so as to predict potential asset renewal stage. In order to maintain the coherence of text within the study, complete details of the mapped PLN (West Java) cost data used for estimating the optimum replacement periods shown in Figure 11 are also provided in Appendix D. The optimum period (i.e., after 4 years) was determined based on the intersection between TMAMC and the net present value (NPV) of replacement costs over the entire remaining useful life. While the PT may still be capable of performing its specified activities over the remainder of its useful life, the maintenance cost associated with such an asset becomes enormous which then calls cost effectiveness into question. It is well acknowledged that asset replacement decisions are far from easy, owing to the huge CAPEX associated, especially for critical assets such as PTs. However, such analysis allows decision-makers to adequately understand the implications of existing MAM strategies and plan for the future. With reference to the MAM audit results and Figure 6 and Figure 7, immediate actions could include the following:
  • Reducing the dominance of BM activities through prudent enhancement of CBM activities so that unnecessary failure costs (i.e., EFC and ENSC) can be eliminated.
  • Thorough assessment of maintainability issues (i.e., events IE6, b1, b5, etc.) during equipment design and commissioning stages as these may significantly increase downtime, which negatively impact MAM cost-effectiveness.

6. Implementation Action Plan and Concluding Remarks

The need to understand the cost implications of owning plant assets, particularly operation and maintenance, is often assumed to be common knowledge amongst academics and industry professionals. However, practical engagement with some of the most critical industries such as power and manufacturing has indicated that this philosophy is not as widespread as initially anticipated, which is perhaps due to the existence of numerous cost mapping tools and fragmentary information. The current body of literature contains various studies that individually describe the theories and implementation of asset management principles such as life cycle costing, reliability/maintainability analysis, failure modes & effects analysis, overall health index (OHI) analysis, fault tree analysis, etc. However, to the best understanding of the authors of the current study, very limited studies provide an avenue by which the collective strengths of these proven tools can be adequately synergized in practice. The uniqueness of the current study lies in the fact that it provides a very systematic and easy-to-implement framework towards achieving cost-effective MAM, using a case study. Owing to the fact that human reluctance to change is one of the main limiters to learning new principles, the fundamental rationale here is to significantly minimise the steepness of the learning curve for industry professionals in maintenance management by encouraging the optimisation of tools that are reasonably popular to them.
Besides simplifying but at the same time harmonising the cost mapping process for critical power generation and distribution plant assets, the proposed framework also provides a means of querying the existing practice through the use of proven risk assessment tools such as fault tree analysis (FTA) and reliability block diagrams (RBDs). The proposed framework commences with a plant-based audit of the case study (i.e., PLN West Java) so as to develop in-depth practical understanding of how MAM activities feed into overall company strategy for asset replacement. Particular focal points of the audit include failure investigation, maintenance policy, overall health assessment, maintenance systems, customer satisfaction (with regards to energy not served) and skills development. During our initial interactions with the auditees, our team was made to believe that all high impact plant failures are adequately investigated using standard root cause analysis (RCA) principles after which corrective action plans are generated and tracked along all phases of implementation. However, our investigation of a very recent catastrophic power transformer (PT) explosion using FTA and RBD principles revealed that the previous RCAs are too outward looking (i.e., mainly focusing on design, manufacturing and installation issues) and therefore misses crucial internal lapses, especially the people issues such as maintenance skills shortage, lack of proper understanding of new installations, poor operational maintainability due to internal process delays, poor maintenance procedures and poor assessment skills. This is perhaps why capital intensive failures of bushings and windings have continuously plagued PLN’s (West Java) operations over the last decade.
Once the existing MAM standing of PLN (West Java) was understood, the remainder of the framework focused on determining the vital maintenance cost elements across the remaining useful life of the examined PT, so that this can inform asset owners of the adequacy of existing MAM initiatives or otherwise. The remaining useful life estimation was solely based on plant-specific OHI and failure rate information. It is worth noting that as opposed to the common practice of estimating OHI based on the universal notion that adopts a 60% and 40% allocation of failure causes to load tap changer (LTC) and PT, respectively (based on an international survey of large PT failures), the current study slightly modifies the standard equation to reflect actual PLN (West Java) failure data between 2008 to 2016 which reveals that 80% and 20% of failures are caused by PT and LTC respectively. Finally, the majority of the findings from this study are currently being incorporated into PLN’s (West Java) asset management strategy especially with regards to estimating the potential operation and maintenance cost of new PTs, owing to the surging need to expand the Indonesian power distribution. As a part of continuous improvement, future research endeavours are planned towards reviewing the robustness of this framework, particularly with regards to maintenance costs optimisation, failure investigation, maintenance strategy allocation and systematic maintenance skills upgrade.

Author Contributions

Conceptualization, K.A. and A.Y.-K.; methodology, K.A. and A.Y.-K.; validation, K.A. and A.Y.-K.; formal data analysis, K.A.; investigation, K.A.; writing—original draft preparation, K.A.; writing—review and editing, A.Y.-K.; supervision, A.Y.-K. All authors have read and agreed to the published version of the manuscript.

Funding

No external funding was received to support this work.

Acknowledgments

The authors of this study are immensely grateful to management of PLN (West Java) and the maintenance team for the provision of unrestricted access to their operation and maintenance management data as well as permission to use such data for engineering-related education at the University of Manchester (United Kingdom). Special appreciation is also directed to our anonymous interviewees from the maintenance and reliability team of PLN (West Java) for agreeing to devote time from their extremely busy schedules.

Conflicts of Interest

The authors declare no conflict of interest.

Abbreviations

AISAir Insulated Switchgear
BMBreakdown Maintenance
CBMCondition Based Maintenance
CIGRECouncil on Large Electric Systems
CMCCorrective Maintenance Cost
CMMSComputerised Maintenance Management System
DGADissolved Gas Analysis
DGAFDissolved Gas Analysis Factor
EFCExtra Fuel Cost
EHVExtra High Voltage
ENSEnergy Not Served
ENSCEnergy Not Served Cost
FCFailure Cost
FOISForced Outage Information System
FTAFault Tree Analysis
FTPFast Track Program
GISGas Insulated Switchgear
HIHealth Index
HVHigh Voltage
IECInternational Electro-Technical Commission
IEEEInstitute of Electrical and Electronics Engineers
ISOInternational Standards Organisation
JALURPekerjaan Instalasi Penyaluran
LCCLife Cycle Cost
LFLoad History Factor
MaRCMajor Repair Cost
MCMaterial Cost
MiRCMinor Repair Cost
MOCMaintenance Outage Cost
NPVNet Present Value
OHIOverall Health Index
OLTCOn Load Tap Changer
OECDOrganisation for Economic Cooperation and Development
OQFOil Quality Factor
PDPartial Discharge
PLNPerusahaan Listrik Negara
PMCPreventive Maintenance Cost
PPMPlanned Preventive Maintenance
PTPower Transformer
RBDReliability Block Diagram
SRUCSpare Replaceable Unit Cost

Appendix A. MAM Audit Questionnaire

Please rate the extent to which the following audit elements are established within PLN (West Java region).
PART A: AUDIT ELEMENTS12345
Maintenance strategy and planning (AE1)
What percentage of PLN’s (West Java) plant assets are classified using criticality analysis principles? Energies 13 01937 i001 Energies 13 01937 i001 Energies 13 01937 i001 Energies 13 01937 i001 Energies 13 01937 i001
How would you rate the effectiveness of CBM tasks at PLN (West Java)? Energies 13 01937 i001 Energies 13 01937 i001 Energies 13 01937 i001 Energies 13 01937 i001 Energies 13 01937 i001
How would you rate the level of PPM optimisation at PLN (West Java)? Energies 13 01937 i001 Energies 13 01937 i001 Energies 13 01937 i001 Energies 13 01937 i001 Energies 13 01937 i001
How often are BM tasks directed to PLN’s (West Java) assets with the least impact of downtime? Energies 13 01937 i001 Energies 13 01937 i001 Energies 13 01937 i001 Energies 13 01937 i001 Energies 13 01937 i001
Critical failures and their investigations (AE2)
How would you rate PLN’s (West Java) failure reporting system? Energies 13 01937 i001 Energies 13 01937 i001 Energies 13 01937 i001 Energies 13 01937 i001 Energies 13 01937 i001
What percentage of failures are investigated using reliability or risk assessment tools such as fault tree analysis and reliability block diagrams? Energies 13 01937 i001 Energies 13 01937 i001 Energies 13 01937 i001 Energies 13 01937 i001 Energies 13 01937 i001
What percentage of corrective actions generated from failure investigations are implemented? Energies 13 01937 i001 Energies 13 01937 i001 Energies 13 01937 i001 Energies 13 01937 i001 Energies 13 01937 i001
Staff competence and development (AE3)
How would you rate the frequency and regularity of reliability, maintenance and asset management trainings? Energies 13 01937 i001 Energies 13 01937 i001 Energies 13 01937 i001 Energies 13 01937 i001 Energies 13 01937 i001
What percentage of your plant maintenance team has been trained on reliability-based failure investigation techniques such as fault tree analysis and reliability block diagrams? Energies 13 01937 i001 Energies 13 01937 i001 Energies 13 01937 i001 Energies 13 01937 i001 Energies 13 01937 i001
What is the level of involvement of maintenance staff in major plat projects? Energies 13 01937 i001 Energies 13 01937 i001 Energies 13 01937 i001 Energies 13 01937 i001 Energies 13 01937 i001
Performance evaluation (AE4)
How often is PLN’s (West Java) maintenance strategy reviewed? Energies 13 01937 i001 Energies 13 01937 i001 Energies 13 01937 i001 Energies 13 01937 i001 Energies 13 01937 i001
How would you rate maintenance performance benchmarking activities at PLN (West Java)? Energies 13 01937 i001 Energies 13 01937 i001 Energies 13 01937 i001 Energies 13 01937 i001 Energies 13 01937 i001
How would you rate the frequency and adequacy of maintenance audits in PLN (West Java)? Energies 13 01937 i001 Energies 13 01937 i001 Energies 13 01937 i001 Energies 13 01937 i001 Energies 13 01937 i001
Maintenance and asset management life cycle cost evaluation (AE5)
How much of life cycle principles are incorporated into PLN’s (West Java) asset renewal plans? Energies 13 01937 i001 Energies 13 01937 i001 Energies 13 01937 i001 Energies 13 01937 i001 Energies 13 01937 i001
How much of PLN’s (West Java) asset renewal decisions are based on economic life costing principles? Energies 13 01937 i001 Energies 13 01937 i001 Energies 13 01937 i001 Energies 13 01937 i001 Energies 13 01937 i001
How would you rate the application of power transformers’ overall health monitoring index principles for maintenance life cycle costing at PLN (West Java)? Energies 13 01937 i001 Energies 13 01937 i001 Energies 13 01937 i001 Energies 13 01937 i001 Energies 13 01937 i001
PART B: ADDITIONAL COMMENTS
Please comment on any other factor(s) that influence maintenance and asset management within PLN (West Java).

Appendix B. Standards

Table A1. Some relevant industrial standards for PT health monitoring.
MAM TypeMAM TaskRelevant Standard(s)
In-service measurementOLTC filter replacementDGA: ASTM D3612-02-2009, IEEE C57 104 2008, IEC 60599 2007
General oil: IEC 60422
Acidity: IEC 62021-1, water content: IEC 60814, Dielectric strength: IEC 60156-02, IFT: ASTM D971-99a, water colour: ISO 2049, sediment: IEC 60422-Annex C, flash point: ISO 2719, metal in oil: IEC 60247
ASTM D 1275/1275b
Thermography
Oil sampling for DGA and oil characteristic
Furan
Corrosive Sulphur
Partial discharge
Noise
Sound pressure level
Shutdown measurementTan DeltaCIGRE TB 445, IEEE C57.19.01
SFRADL/T 911-2004
Ratio testC57.125.1991
RDCIEC 60076-1
Water contentIEEE Std. 62-1995
Continuity test, dynamic resistance, diverter switch resistanceCIGRE Report 12-13
Table A2. PF classifications.
ClassificationState
%PF at 20 °CPT Health
%PF < 0.5Good (Grade A)
0.5 ≤ %PF ≤ 1.0Acceptable (Grade B)
1.1 ≤ %PF ≤ 1.5Operate with caution (Grade C)
1.6 ≤ %PF ≤ 2Poor (Grade D)
%PF > 2Very poor (Grade E)
Table A3. Scoring and weighting factors for DGA [42].
S/NGas TypeScore (Si)Wi (1–5)
1 (Good)23456 (Bad)
1H2≤100101–200201–300301–500501–700>7002
2CH4≤7576–125126–200201–400401–600>6003
3C2H6≤6566–8081–100101–120121–150>1501
4C2H4≤5051–8081–100101–150151–200>2003
5C2H2≤34–78–3536–5051–80>805
6CO≤350351–700701–900901–11001100–1400>14001
7CO2≤2500≤3000≤4000≤5000≤6000≤70001
Si and Wi represent the scoring and weighting factors shown in Table A3 for each of the gasses contained in the oil, while DGAF is the dissolved gas analysis factor.
Table A4. Scoring and weighting factors for OQF [37].
Oil Quality ParameterU ≤ 69 kV69 kV < U < 230 kV230 kV ≤ UScore (Si)Weight (Wi)
Dielectric strength kV (2 mm gap)≥45≥52≥6013
35–4547–5250–602
30–3535–4740–503
≤30≤35≤404
IFT
dyne/cm
≥25≥30≥321 2
20–2523–3025–322
15–2018–2320–253
≤15≤18≤204
Acid number≤0.05≤0.04≤0.031 1
0.05–0.10.04–1.00.03–0.072
0.1–0.21.0–0.150.07–0.013
≥0.2≥0.15≥0.104
Water content (ppm)≤30≤20≤151 4
30–3520–2515–202
35–4025–3020–253
≥40≥30≥254
Colour≤1.51 2
1.5–2.02
2.0–2.53
≥2.54
Dissipation factor (%) 25 °C≤0.11 3
0.1–0.52
0.5–1.03
≥1.04

Appendix C. Actual Condition Assessment Results from PLN (West Java)

Table A5. PLN dissolved gas analysis (DGA).
PT PhaseAssessment DateCOCO2CH4C2H6C2H4C2H2H2DGAF
IBT 1 R25/09/201334.849142.50969.79315.6390.0000.00019.4671.0
IBT 1 R07/02/2014115.962886.98232.82533.0620.0000.00051.4371.0
IBT 1 R25/09/2014120.4901643.15022.87043.5200.0000.000213.6001.1
IBT 1 R23/01/20150.0002925.850214.40087.3700.0000.000223.0001.8
IBT 1 R30/01/20150.0002925.853214.4320.00087.3750.000223.0061.8
IBT 1 R27/04/2015252.1351947.210112.27096.3900.0000.0000.0001.8
IBT 1 R23/05/20160.0001957.062115.72667.8650.0000.0000.0001.2
IBT 1 R10/08/20160.0001293.28744.43737.0790.0000.000103.6621.0
IBT 1 R13/10/201655.8962029.99059.30952.8830.0000.0000.0001.0
IBT 1 R19/01/201793.8821395.505260.129112.173103.78666.03429.5023.9
IBT 1 R OLTC07/02/20170.0001273.039131.4730.0003.3590.0000.0001.3
IBT 1 R TOP09/03/2017 34.167 138.9991.1
IBT 1 R BOTTOM09/03/2017 45.823 140.9451.1
IBT 1 S14/06/201067.2414287.6220.00059.2190.0000.0000.0001.2
IBT 1 S25/09/2013151.5001881.70052.00096.2000.0000.000217.3001.9
IBT 1 S07/02/2014137.072939.05458.42062.1960.0000.00021.5841.0
IBT 1 S25/09/2014151.5001881.70051.90096.1800.0000.000217.3301.9
IBT 1 S28/01/2015266.5002912.72080.800194.5003.7000.0000.0001.9
IBT 1 S27/04/2015324.3452039.970154.099226.6290.0000.0000.0002.2
IBT 1 S23/05/201663.9011829.824102.585138.9330.0000.0000.0002.0
IBT 1 S10/08/201688.0001287.53163.90775.6010.0000.000101.9421.0
IBT 1 S13/10/2016117.6802042.24282.407107.7870.0000.0000.0001.8
IBT 1 S07/02/201783.6742520.167102.6310.000166.7970.0000.0001.8
IBT 1 S ATAS09/03/2017 33.147 157.5881.1
IBT 1 S BAWAH09/03/2017 20.284 149.9481.1
IBT 1 T07/02/2013107.911793.52942.29544.9910.0000.0000.0001.0
IBT 1 T25/09/201339.280136.33682.61722.3300.0000.07818.2751.0
IBT 1 T25/09/2014135.9001683.60044.70066.9000.0000.000267.3001.2
IBT 1 T28/01/2015211.8902428.64041.8200.000105.3400.0002.1001.5
IBT 1 T27/04/2015240.9001782.23091.880156.4070.0000.0000.0001.8
IBT 1 T23/05/2016152.5741665.775100.64172.5810.0000.0000.0001.8
IBT 1 T10/08/201689.2181358.12842.33358.5410.0000.000102.7201.0
IBT 1 T13/10/201689.2181358.12842.33358.5410.0000.000102.7201.0
IBT 1 T07/02/201769.0172218.021107.7430.000112.3800.0000.0002.5
IBT 1 T TOP07/02/20170.000341.104215.0430.0000.0000.00052.9881.5
IBT 1 T ATAS09/03/2017 13.121 150.6021.1
IBT 1 T BOTTOM09/03/2017 9.917 152.6841.1
Figure A1. Typical loading profile for IBT in 2016.
Energies 13 01937 g0a1
Table A6. Winding Tan Delta/Dissipation factor.
S/NDateTemperaturePrimarySecondaryTertiary
CHLCHTCHL + CHGCHGCLTCLT + CLGCLGCHT + CTGCTG
IBT 1 R 25/9/16380.120.090.140.140.150.400.530.160.16
IBT 1 S−0.110.150.130.390.540.18
IBT 1 T 0.11−0.080.120.12 0.420.570.170.17
Table A7. Winding capacitance.
PhaseDateTemperaturePrimarySecondaryTertiary
SAT313511.1821.46 3456.782190.72 4026.37 8949.6
IBT 1 R25/9/16383573.1221.468764.565205.612217.056425.524220.95
PF 2%21.72 51%1% 5%
IBT 1 S25/9/16383515.611%8357485.172196.336027.273842.4 898.41
PF 0%830.26 −86%0% −5%8978.985−90%
IBT 1 T25/9/16 3539.563769%8787.525262.172172.456054.583894.77 9120.07
PF 1%821.62 52%−1% −3%9130.262%
Table A8. PLN oil insulating quality measurements.
PhaseDateSampling Temperature (°C)Water Content (ppm)ColourIFTAcidity (mg KOH/g)BDV (kV/2.5 mm)
IBT 1 R17/09/201340.002.840.5034.800.0265.10
IBT 1 R07/02/201430.004.230.5033.500.0288.20
IBT 1 R05/08/201430.004.670.5032.600.1940.70
IBT 1 R19/01/201530.006.590.5033.200.0275.90
IBT 1 R22/04/201532.009.980.5032.100.0267.50
IBT 1 R03/05/201633.0013.370.5035.100.0377.80
IBT 1 R08/08/201632.003.710.5035.600.0855.40
IBT 1 R17/10/201630.007.420.5035.500.0577.40
IBT 1 R OLTC07/02/201727.0016.861.1026.800.159631.40
IBT 1 R (Top)09/03/201728.0015.350.5037.700.125645.10
IBT 1 R (Bottom)09/03/201726.0020.100.5039.100.261561.40
IBT 1 S17/09/201334.002.990.5034.300.0287.10
IBT 1 S07/02/201434.002.500.5031.100.0459.50
IBT 1 S05/08/201430.006.410.5031.900.0246.30
IBT 1 S19/01/201530.004.640.5031.200.0394.30
IBT 1 S22/04/201532.007.830.5029.400.0251.60
IBT 1 S03/05/201633.006.100.6036.200.0956.70
IBT 1 S08/08/201632.003.490.6035.700.0958.20
IBT 1 S07/02/201726.0010.170.6035.200.149856.40
IBT 1 S (Top)07/03/201730.0011.180.6035.100.024651.20
IBT 1 S (Bottom)07/03/201727.007.950.6031.700.033491.60
IBT 1 S (Top)09/03/201748.0015.850.6035.400.154655.20
IBT 1 S (Bottom)09/03/201727.0016.850.5035.100.093166.40
IBT 1 T17/09/201330.002.060.5031.200.0372.50
IBT 1 T07/02/201434.002.110.5031.900.0268.80
IBT 1 T05/08/201430.006.710.5030.600.0343.60
IBT 1 T19/01/201530.007.950.5030.100.0265.80
IBT 1 T22/04/201532.004.730.5030.300.0160.10
IBT 1 T23/05/201633.006.270.5036.300.0971.40
IBT 1 T08/08/201632.007.290.5035.100.0945.20
IBT 1 T07/02/201727.008.940.5035.600.117368.30
IBT 1 T OLTC07/02/201726.0017.501.4028.300.142831.10
Table A9. Turns ratio.
S/NTapNameplateRatioRST
RatioDifference (%)I (amp)RatioDifference (%)I (amp)RatioDifference (%)I (amp)
1195875003.49703.4968−0.0113.50110.12 3.49940.07 2
2185812503.45983.46170.0523.46490.15 23.46470.14
3175750003.42263.42620.103.42930.23.42910.19
4165687503.38543.38960.123.39400.253.39280.22
5155625003.34823.35410.183.35600.233.35650.25
6145562503.31103.31900.243.32230.343.32130.31
7135500003.27383.28270.273.28513.28570.36
8125437503.23663.24740.333.24880.383.24990.41
9115375003.19943.21230.403.21360.443.21420.46
10105312503.16223.17670.463.17480.513.17720.47
1195250003.12503.13990.48−221.3−7182.24 Out of phase3.14150.53
1285187503.08783.10400.52−224.0−7355.013.10560.58
1375125003.05063.06850.59−236.2−7843.083.07060.66
1465062503.01343.03370.67−238.2−8005.713.03480.71
1555000002.97622.99810.74−240.2−8171.392.99890.76
1644937502.93902.96230.79−242.2−8341.952.96360.84
1734875002.90182.92660.86−244.2−8514.132.92790.90
1824812502.86462.89160.94−246.5−8704.742.89220.96
1914750002.82742.85561.00−248.4−8883.752.85651.03
Table A10. Core-to-ground.
PhaseDatePrimary-SecondaryPrimary-GroundSecondary-GroundPrimary-TertiarySecondary-TertiaryTertiary-Ground
1’10’IP1’10’IP1’10’IP1’10’IP1’10’IP1’10’IP
R23/10/1623.933.31.391521.81.4520.431.21.5328.2391.3828.2391.381017.31.73
S29.353.31.8121.331.11.4670.31321.8819.737.42.3125.645.61.4629.1291
T 21.330.11.4170.31321.8819.737.42.3125.645.61.4629.1291
Table A11. Typical PT health index scoring chart.
S/NPT Condition CriteriaKCondition RatingHIF
1DGA10 A,B,C,D,E 4,3,2,1,0
2Load history
3Power factor
4Infra-red
5Oil quality6
6Overall condition8
7Furan or age5
8Turns ratio
9Leakage resistance8
10Winding resistance6
11Core-to-ground2
12Bushing condition5
13Main tank corrosion2
14Cooling equipment
15Oil tank corrosion1
16Foundation
17Grounding
18Gaskets, seals
19Connectors
20Oil leaks
21Oil level
22DGA of LTC6
23LTC oil quality3
24Overall LTC condition5

Appendix D. Cost Elements

Table A12. PT maintenance cost breakdown for estimated remaining useful life.
Discount Rate: 12%
Inflation Rate: 3.6%
Estimated   Remaining   Useful   Life   ( μ l i f e ) :   6   Years
MC Element (£)Year
0123456
PMC124,380124,870133,522138,342143,337148,511153,872
ρ ( t ) 0.850.860.880.90.90.910.92
Bushing cost price (BCP)22,83423,65824,51225,39726,31427,26428,248
ρ ( t ) bushing (OHI 0%)1111111
MaRC bushing22,83423,65824,51225,39726,31427,26428,248
MiRC bushing (0.2BCP)0000000
Winding cost price (WCP)2,283,3402,365,7692,451,1732,539,6602,631,3422,726,3332,824,754
ρ ( t ) winding (OHI 35%)0.650.650.650.650.650.650.65
MaRC winding1,484,1711,537,7501,593,2621,650,7791,710,3721,772,1171,836,090
MiRC winding (0.2WCP)159,834165,604171,582177,776184,194190,843197,733
CLC5867607962986526676170057258
Total MaRC1,507,0051,561,4081,617,7751,676,1761,736,6861,799,3811,864,338
Total MiRC165,700.80171,682.60177,880.34184,301.82190,955.12197,848.60204,990.93
BMC1,427,6671,496,5371,586,4751,680,9561,741,6381,824,4841,911,041
FC22,52522,79023,32023,58023,85024,11524,380
PMC + CMC + FC1,574,5721,648,1971743,3171,843,1481,908,8251,997,1102,089,293
TMAMC1,574,5721,611,3841655,3621,702,3091,743,6121,785,8621,829,209
Replacement NPV (phase R)2,740,0082,446,4362184,3181,950,2841,741,3251,554,7541,388,173

References

  1. Chu, S.; Majumdar, A. Opportunities and challenges for a sustainable energy future. Nature 2012, 488, 294–303. [Google Scholar] [CrossRef] [PubMed]
  2. Banos, R.; Manzano-Agugliaro, F.; Montoya, F.G.; Gil, C.; Alcayde, A.; Gómez, J. Optimization methods applied to renewable and sustainable energy: A review. Renew. Sustain. Energy Rev. 2011, 15, 1753–1766. [Google Scholar] [CrossRef]
  3. Adams, F.; Shachmurove, Y. Modeling and forecasting energy consumption in China: Implications for Chinese energy demand and imports in 2020. Energy Econ. 2008, 30, 1263–1278. [Google Scholar] [CrossRef]
  4. AGECC Energy for a sustainable future: Summary report and recommendations. In Proceedings of the United Nations (UN)/The Secretary-General’s Advisory Group on Energy and Climate Change, New York, NY, USA, 28 April 2010.
  5. Akinlo, A.E. Electricity consumption and economic growth in Nigeria: Evidence from cointegration and co-feature analysis. J. Policy Model. 2009, 31, 681–693. [Google Scholar] [CrossRef]
  6. Yoo, S.H.; Kim, Y. Electricity generation and economic growth in Indonesia. Energy 2006, 31, 2890–2899. [Google Scholar] [CrossRef]
  7. Abraham, A.; Nath, B. A neuro-fuzzy approach for modelling electricity demand in Victoria. Appl. Soft Comput. 2001, 1, 127–138. [Google Scholar] [CrossRef]
  8. United States Energy Information Administration. International Energy Outlook; United States Energy Information Administration: Washington, DC, USA, 2016; Volume 2016, pp. 81–100.
  9. Bazilian, M.; Nussbaumer, P.; Rogner, H.-H.; Brew-Hammond, A.; Foster, V.; Pachauri, S.; Williams, E.; Howells, M.; Niyongabo, P.; Musaba, L.; et al. Energy access scenarios to 2030 for the power sector in sub-Saharan Africa. Util. Policy 2012, 20, 1–16. [Google Scholar] [CrossRef] [Green Version]
  10. Animah, I.; Shafiee, M. Condition assessment, remaining useful life prediction and life extension decision making for offshore oil and gas assets. J. Loss Prev. Process. Ind. 2018, 53, 17–28. [Google Scholar] [CrossRef] [Green Version]
  11. Shafiee, M.; Animah, I. Life extension decision making of safety critical systems: An overview. J. Loss Prev. Process. Ind. 2017, 47, 174–188. [Google Scholar] [CrossRef] [Green Version]
  12. Qingfeng, W.; Wenbin, L.; Xin, Z.; JianFeng, Y.; Qingbin, Y. Development and application of equipment maintenance and safety integrity management system. J. Loss Prev. Process. Ind. 2011, 24, 321–332. [Google Scholar] [CrossRef]
  13. Sacco, T.; Compare, M.; Zio, E.; Sansavini, G. Portfolio decision analysis for risk-based maintenance of gas networks. J. Loss Prev. Process. Ind. 2019, 60, 269–281. [Google Scholar] [CrossRef]
  14. Bertolini, M.; Bevilacqua, M.; Ciarapica, F.E.; Giacchetta, G. Development of Risk-Based Inspection and Maintenance procedures for an oil refinery. J. Loss Prev. Process. Ind. 2009, 22, 244–253. [Google Scholar] [CrossRef]
  15. Peng, X.-Y.; Yao, D.-C.; Liang, G.-C.; Yu, J.; He, S. Overall reliability analysis on oil/gas pipeline under typical third-party actions based on fragility theory. J. Nat. Gas Sci. Eng. 2016, 34, 993–1003. [Google Scholar] [CrossRef]
  16. Luwei, K.C.; Yunusa-Kaltungo, A.; Sha’Aban, Y. Integrated Fault Detection Framework for Classifying Rotating Machine Faults Using Frequency Domain Data Fusion and Artificial Neural Networks. Machines 2018, 6, 59. [Google Scholar] [CrossRef] [Green Version]
  17. Eti, M.; Ogaji, S.; Probert, S. Implementing total productive maintenance in Nigerian manufacturing industries. Appl. Energy 2004, 79, 385–401. [Google Scholar] [CrossRef] [Green Version]
  18. Yunusa-Kaltungo, A.; Sinha, J.K. Generic vibration-based faults identification approach for identical rotating machines installed on different foundations. In VIRM 11-Vibrations in Rotating Machinery; Institution of Mechanical Engineers: London, UK, 2016; Volume 11, pp. 499–510. [Google Scholar]
  19. Tahan, M.; Tsoutsanis, E.; Muhammad, M.; Karim, Z.A.A. Performance-based health monitoring, diagnostics and prognostics for condition-based maintenance of gas turbines: A review. Appl. Energy 2017, 198, 122–144. [Google Scholar] [CrossRef] [Green Version]
  20. Hoeft, R.F.; Janawitz, J.; Keck, R. Heavy duty gas turbine operating and maintenance considerations. In General Electric Company, Gas Turbine Division; GE Power & Water: Atlanta, GA, USA, 1993. [Google Scholar]
  21. Lee, J.; Scott, L.W. Zero-breakdown machines and systems: Productivity needs for next-generation maintenance. Eng. Asset Manag. 2006, 31–43. [Google Scholar] [CrossRef]
  22. Jardine, A.K.; Lin, D.; Banjevic, D. A review on machinery diagnostics and prognostics implementing condition-based maintenance. Mech. Syst. Signal Process. 2006, 20, 1483–1510. [Google Scholar] [CrossRef]
  23. Takata, S.; Kirnura, F.; Van Houten, F.; Westkamper, E.; Shpitalni, M.; Ceglarek, D.; Lee, J. Maintenance: Changing Role in Life Cycle Management. CIRP Ann.-Manuf. Technol. 2004, 53, 643–655. [Google Scholar] [CrossRef]
  24. De Vroedt, M.E.; Hoving, M.P. Changing data needs from a life cycle perspective in the context of ISO 55000. In Proceedings of the Electricity Distribution Conference –South East Asia, Kuala Lumpur, Malaysia, 20–23 May 2014. [Google Scholar]
  25. Yao, X.; Liu, Y.; Qu, S. When will wind energy achieve grid parity in China?—Connecting technological learning and climate finance. Appl. Energy 2015, 160, 697–704. [Google Scholar] [CrossRef]
  26. Han, X.; Zhang, H.; Yu, X.; Wang, L. Economic evaluation of grid-connected micro-grid system with photovoltaic and energy storage under different investment and financing models. Appl. Energy 2016, 184, 103–118. [Google Scholar] [CrossRef]
  27. Wang, X.; Lu, M.; Mao, W.; Ouyang, J.; Zhou, B.; Yang, Y. Improving benefit-cost analysis to overcome financing difficulties in promoting energy-efficient renovation of existing residential buildings in China. Appl. Energy 2015, 141, 119–130. [Google Scholar] [CrossRef]
  28. Bertone, E.; Sahin, O.; Stewart, R.A.; Zou, P.; Alam, M.; Hampson, K.; Blair, E. Role of financial mechanisms for accelerating the rate of water and energy efficiency retrofits in Australian public buildings: Hybrid Bayesian Network and System Dynamics modelling approach. Appl. Energy 2018, 210, 409–419. [Google Scholar] [CrossRef] [Green Version]
  29. Gliedt, T.; Hoicka, C.E. Energy upgrades as financial or strategic investment? Energy Star property owners and managers improving building energy performance. Appl. Energy 2015, 147, 430–443. [Google Scholar] [CrossRef]
  30. Robinson, M.; Varga, L.; Allen, P. An agent-based model for energy service companies. Energy Convers. Manag. 2015, 94, 233–244. [Google Scholar] [CrossRef] [Green Version]
  31. Nihous, G.; Syed, M. A financing strategy for small OTEC plants. Energy Convers. Manag. 1997, 38, 201–211. [Google Scholar] [CrossRef]
  32. He, Y.; Liu, Y.; Xia, T.; Zhou, B. Estimation of demand response to energy price signals in energy consumption behaviour in Beijing, China. Energy Convers. Manag. 2014, 80, 429–435. [Google Scholar] [CrossRef]
  33. Aminloei, R.T.; Ghaderi, S. Generation planning in Iranian power plants with fuzzy hierarchical production planning. Energy Convers. Manag. 2010, 51, 1230–1241. [Google Scholar] [CrossRef]
  34. Arredondo-Ramírez, K.; Ponce-Ortega, J.M.; El-Halwagi, M.M. Optimal planning and infrastructure development for shale gas production. Energy Convers. Manag. 2016, 119, 91–100. [Google Scholar] [CrossRef]
  35. Rong, A.; Figueira, J.R.; Lahdelma, R. An efficient algorithm for bi-objective combined heat and power production planning under the emission trading scheme. Energy Convers. Manag. 2014, 88, 525–534. [Google Scholar] [CrossRef] [Green Version]
  36. Nilsson, K. Industrial production planning with optimal electricity cost. Energy Convers. Manag. 1993, 34, 153–158. [Google Scholar] [CrossRef]
  37. Salahi, N.; Jafari, M.A. Energy-Performance as a driver for optimal production planning. Appl. Energy 2016, 174, 88–100. [Google Scholar] [CrossRef]
  38. Zulkafli, N.I.; Kopanos, G.M. Planning of production and utility systems under unit performance degradation and alternative resource-constrained cleaning policies. Appl. Energy 2016, 183, 577–602. [Google Scholar] [CrossRef] [Green Version]
  39. Mokgonyana, L.; Zhang, J.; Li, H.; Hu, Y. Optimal location and capacity planning for distributed generation with independent power production and self-generation. Appl. Energy 2017, 188, 140–150. [Google Scholar] [CrossRef] [Green Version]
  40. Kopanos, G.M.; Georgiadis, M.C.; Pistikopoulos, E.N. Energy production planning of a network of micro combined heat and power generators. Appl. Energy 2013, 102, 1522–1534. [Google Scholar] [CrossRef]
  41. Muntasser, M.; Bara, M.; Quadri, H.; El-Tarabelsi, R.; La-Azebi, I. Photovoltaic marketing in developing countries. Appl. Energy 2000, 65, 67–72. [Google Scholar] [CrossRef]
  42. Albert, A.; Maasoumy, M. Predictive segmentation of energy consumers. Appl. Energy 2016, 177, 435–448. [Google Scholar] [CrossRef]
  43. Newbery, D.M. Towards a green energy economy? The EU Energy Union’s transition to a low-carbon zero subsidy electricity system – Lessons from the UK’s Electricity Market Reform. Appl. Energy 2016, 179, 1321–1330. [Google Scholar] [CrossRef]
  44. Stenner, K.; Frederiks, E.R.; Hobman, E.V.; Cook, S. Willingness to participate in direct load control: The role of consumer distrust. Appl. Energy 2017, 189, 76–88. [Google Scholar] [CrossRef]
  45. Nilsson, J.; Bertling, L. Maintenance Management of Wind Power Systems Using Condition Monitoring Systems—Life Cycle Cost Analysis for Two Case Studies. IEEE Trans. Energy Convers. 2007, 22, 223–229. [Google Scholar] [CrossRef]
  46. Chattopadhyay, D. Life-Cycle Maintenance Management of Generating Units in a Competitive Environment. IEEE Trans. Power Syst. 2004, 19, 1181–1189. [Google Scholar] [CrossRef]
  47. Besnard, F.; Nilsson, J.; Bertling, L. On the economic benefits of using condition monitoring systems for maintenance management of wind power systems. In Proceedings of the 2010 IEEE 11th International Conference on Probabilistic Methods Applied to Power Systems, Singapore, 14–17 June 2010; IEEE: Piscataway, NJ, USA, 2010; pp. 160–165. [Google Scholar]
  48. Jahromi, A.; Piercy, R.; Cress, S.; Service, J.; Fan, W. An approach to power transformer asset management using health index. IEEE Electr. Insul. Mag. 2009, 25, 20–34. [Google Scholar] [CrossRef]
  49. Wang, M.; Vandermaar, A.; Srivastava, K. Review of condition assessment of power transformers in service. IEEE Electr. Insul. Mag. 2002, 18, 12–25. [Google Scholar] [CrossRef]
  50. Saha, T.K. Review of modern diagnostic techniques for assessing insulation condition in aged transformers. IEEE Trans. Dielectr. Electr. Insul. 2003, 10, 903–917. [Google Scholar] [CrossRef] [Green Version]
  51. Rencana Jangka Panjang PT PLN (Persero) 2015–2019; PT PLN (Persero): Jakarta, Indonesia, 2015.
  52. Rencana Usaha Penyediaan Tenaga Listrik PT Perusahaan Listrik Negara (Persero) 2017–2024; PT PLN (Persero): Jakarta, Indonesia, 2017.
  53. Yunusa-Kaltungo, A.; Kermani, M.M.; Labib, A. Investigation of critical failures using root cause analysis methods: Case study of ASH cement PLC. Eng. Fail. Anal. 2017, 73, 25–45. [Google Scholar] [CrossRef]
  54. Yunusa-Kaltungo, A.; Sinha, J.K.; Nembhard, A.D. A novel fault diagnosis technique for enhancing maintenance and reliability of rotating machines. Struct. Health. Monit. 2015, 14, 604–621. [Google Scholar] [CrossRef] [Green Version]
  55. Yunusa-Kaltungo, A.; Sinha, J.K.; Duffuaa, S.; Parida, A. Effective vibration-based condition monitoring (eVCM) of rotating machines. J. Qual. Maint. Eng. 2017, 23, 279–296. [Google Scholar] [CrossRef] [Green Version]
  56. Mulenga, K.; Zhao, X.; Xie, M.; Chikamba, C. Investigating the root causes of major failures of critical components – With a case study of asbestos cement pipes. Eng. Fail. Anal. 2018, 84, 121–130. [Google Scholar] [CrossRef]
  57. Velásquez, R.M.A.; Lara, J.V.M. Circuit breakers 500 kV degradation in substation reactors caused by inductive current. Eng. Fail. Anal. 2018, 90, 64–81. [Google Scholar] [CrossRef]
  58. Chemweno, P.; Morag, I.; Sheikhalishahi, M.; Pintelon, L.; Muchiri, P.; Wakiru, J. Development of a novel methodology for root cause analysis and selection of maintenance strategy for a thermal power plant: A data exploration approach. Eng. Fail. Anal. 2016, 66, 19–34. [Google Scholar] [CrossRef]
  59. Ahmad, R.; Kamaruddin, S.; Azid, I.A.; Almanar, I.P. Failure analysis of machinery component by considering external factors and multiple failure modes – A case study in the processing industry. Eng. Fail. Anal. 2012, 25, 182–192. [Google Scholar] [CrossRef]
  60. Martinez, V.O.; Fernández, M.I.A.; Gonzalez-Nicieza, C. Failure analysis of subsidence in an effluent treatment plant in a thermosolar power plant. Eng. Fail. Anal. 2018, 91, 419–432. [Google Scholar] [CrossRef]
  61. Mesić, M.; Plavšić, T. The contribution of failure analyses to transmission network maintenance preferentials. Eng. Fail. Anal. 2013, 35, 262–271. [Google Scholar] [CrossRef]
  62. Xie, M.; Tian, Z. A review on pipeline integrity management utilizing in-line inspection data. Eng. Fail. Anal. 2018, 92, 222–239. [Google Scholar] [CrossRef]
  63. Raouf, A.; Ben-Daya, M. Total maintenance management: A systematic approach. J. Qual. Maint. Eng. 1995, 1, 6–14. [Google Scholar] [CrossRef]
  64. Duffuaa, S.O.; Raouf, A.; Campbell, J.D. Planning and Control of Maintenance Systems; John Wiley and Son: New York, NY, USA, 1999. [Google Scholar]
  65. Berrouane, M.T.; Khan, F.; Lounis, Z. Availability analysis of safety critical systems using advanced fault tree and stochastic Petri net formalisms. J. Loss Prev. Process. Ind. 2016, 44, 193–203. [Google Scholar]
  66. Curcurù, G.; Galante, G.; La Fata, C.M. An imprecise Fault Tree Analysis for the estimation of the Rate of OCcurrence Of Failure (ROCOF). J. Loss Prev. Process. Ind. 2013, 26, 1285–1292. [Google Scholar] [CrossRef]
  67. Yuhua, D.; Datao, Y. Estimation of failure probability of oil and gas transmission pipelines by fuzzy fault tree analysis. J. Loss Prev. Process. Ind. 2005, 18, 83–88. [Google Scholar] [CrossRef]
  68. Hauptmanns, U. Semi-quantitative fault tree analysis for process plant safety using frequency and probability ranges. J. Loss Prev. Process. Ind. 2004, 17, 339–345. [Google Scholar] [CrossRef]
  69. Mortazavi, S.M.; Mohamadi, M.; Jouzdani, J. MTBF evaluation for 2-out-of-3 redundant repairable systems with common cause and cascade failures considering fuzzy rates for failures and repair: A case study of a centrifugal water pumping system. J. Ind. Eng. Int. 2017, 14, 281–291. [Google Scholar] [CrossRef] [Green Version]
  70. Makinde, O.; Mpofu, K.; Ramatsetse, B.; Adeyeri, M.K.; Ayodeji, S.P. A maintenance system model for optimal reconfigurable vibrating screen management. J. Ind. Eng. Int. 2017, 14, 521–535. [Google Scholar] [CrossRef] [Green Version]
  71. Sharma, R.K.; Sharma, P. Qualitative and quantitative approaches to analyse reliability of a mechatronic system: A case. J. Ind. Eng. Int. 2015, 11, 253–268. [Google Scholar] [CrossRef] [Green Version]
  72. Kumar, N.; Lather, J.S. Reliability analysis of a robotic system using hybridized technique. J. Ind. Eng. Int. 2017, 14, 443–453. [Google Scholar] [CrossRef] [Green Version]
  73. Aggarwal, A.K.; Kumar, S.; Singh, V. Mathematical modeling and fuzzy availability analysis for serial processes in the crystallization system of a sugar plant. J. Ind. Eng. Int. 2016, 13, 47–58. [Google Scholar] [CrossRef] [Green Version]
  74. Khalaj, M.; Khalaj, F.; Khalaj, A. A novel risk-based analysis for the production system under epistemic uncertainty. J. Ind. Eng. Int. 2013, 9, 35. [Google Scholar] [CrossRef] [Green Version]
  75. Bourezg, A.; Meglouli, H. Reliability assessment of power distribution systems using disjoint path-set algorithm. J. Ind. Eng. Int. 2014, 11, 45–57. [Google Scholar] [CrossRef] [Green Version]
  76. Qarahasanlou, A.N.; Mokhtarei, A.; Khodayarei, A.; Ataei, M. Fault tree analysis of failure cause of crushing plant and mixing bed hall at Khoy cement factory in Iran. Case Stud. Eng. Fail. Anal. 2014, 2, 33–38. [Google Scholar] [CrossRef] [PubMed] [Green Version]
  77. Haema, J.; Phadungthin, R. Condition assessment of the health index for power transformer. In Proceedings of the Power Engineering and Automation Conference (PEAM), Wuhan, China, 18–20 September 2012; IEEE: Piscataway, NJ, USA, 2013; pp. 1–4. [Google Scholar]
  78. Pahlavanpour, P.; Martins, M.A. Insulating paper ageing and furfural formation. In Proceedings of the Electrical Insulation Conference and Electrical Manufacturing & Coil Winding Technology Conference, Indianapolis, IN, USA, 23 September 2003; IEEE: Piscataway, NJ, USA, 2003; pp. 283–288. [Google Scholar]
  79. Bossi, A.; Dind, J.E.; Frisson, J.M.; Khoudiakov, U.; Light, H.F.; Narke, D.V.; Tournier, Y.; Verdon, J. An international survey on failures in large power transformers in service. Cigré Electr. 1983, 88, 21–48. [Google Scholar]
  80. Puglia, G.; Bangalore, P.; Tjernberg, L.B. Cost efficient maintenance strategies for wind power systems using LCC. In Proceedings of the 2014 International Conference on Probabilistic Methods Applied to Power Systems (PMAPS), Durham, UK, 7–10 July 2014; IEEE: Piscataway, NJ, USA, 2014; pp. 1–6. [Google Scholar]
  81. Zhou, L.; Wang, Y.; Li, Y.; Zhu, M.; Du, X. A maintenance decision optimization method based on life cycle cost of converter transformer. In Proceedings of the 2016 IEEE Electrical Insulation Conference (EIC), Montreal, QC, Canada, 19–22 June 2016; IEEE: Piscataway, NJ, USA, 2016; pp. 288–291. [Google Scholar]
  82. Guo-Hua, Q.; Zheng, R.; Lei, S.; Bo, Z.; Jian-Gang, X.; Xiang-Ling, Z. A new life cycle cost model of power transformer and its comprehensive sensitivity analysis. In Proceedings of the 2014 International Conference on Power System Technology (POWERCON), Chengdu, China, 20–22 October 2014; IEEE: Piscataway, NJ, USA, 2014; pp. 1342–1348. [Google Scholar]
  83. Velásquez, R.M.A.; Lara, J.V.M. Life estimation of shunt power reactors considering a failure core heating by floating potentials. Eng. Fail. Anal. 2018, 86, 142–157. [Google Scholar] [CrossRef]
  84. Murugan, R.; Ramasamy, R. Failure analysis of power transformer for effective maintenance planning in electric utilities. Eng. Fail. Anal. 2015, 55, 182–192. [Google Scholar] [CrossRef]
  85. Yunusa-Kaltungo, A.; Labib, A. A hybrid of industrial maintenance decision making grids. Prod. Plan. Control. 2020, 1–8. [Google Scholar] [CrossRef]
  86. Iheukwumere-Esotu, L.O.; Kaltungo, A.Y. Assessment of Barriers to Knowledge and Experience Transfer in Major Maintenance Activities. Energies 2020, 13, 1721. [Google Scholar] [CrossRef] [Green Version]
  87. Yunusa-Kaltungo, A.; Sinha, J.K.; Elbhbah, K. HOS analysis of measured vibration data on rotating machines with different simulated faults. In Advances in Condition Monitoring of Machinery in Non-Stationary Operations; Springer: Berlin/Heidelberg, Germany, 2014; pp. 81–89. [Google Scholar]
  88. Yunusa-Kaltungo, A.; Sinha, J.K. A comparison of signal processing tools: Higher order spectra versus higher order coherences. J. Vib. Eng.Technol. 2015, 3, 461–472. [Google Scholar]
  89. Yunusa-Kaltungo, A.; Nembhard, A.D.; Sinha, J.K. Experimental observations of rotor orbit analysis in rotating machines. In Proceedings of the 9th IFToMM International Conference on Rotor Dynamicsp; Springer: Cham, Swizerland, 2015; pp. 1551–1560. [Google Scholar]
  90. Yunusa-Kaltungo, A.; Sinha, J. Condition Monitoring: A Simple and Practical Approach; LAP Lambert Academic Publishing: Salbrucken, Germany, 2012. [Google Scholar]
Figure 1. Main classes of maintenance philosophies and their respective characteristics.
Energies 13 01937 g001
Figure 2. PLN energy sources and their percentage shares [51,52].
Energies 13 01937 g002
Figure 3. Schematic representation of PLN process architecture [51,52].
Energies 13 01937 g003
Figure 4. Maintenance philosophies and their interdependence.
Energies 13 01937 g004
Figure 5. Integrated engineering decision-making framework for PT.
Energies 13 01937 g005
Figure 6. FTA of HV phase R bushing explosion.
Energies 13 01937 g006
Figure 7. Equivalent RBD for HV phase R bushing explosion.
Energies 13 01937 g007
Figure 8. Standard probability of failure versus OHI curve [48].
Energies 13 01937 g008
Figure 9. Estimation of effective age of PTs using failure distribution curves (a) failure rate versus time (b) unreliability versus time.
Energies 13 01937 g009
Figure 10. Typical relationship between critical cost elements of PTs.
Energies 13 01937 g010
Figure 11. Illustration of optimum replacement period for PT Kembangan.
Energies 13 01937 g011
Table 1. Current and projected NERs from 2014 and 2024 [51,52].
NERYear
20142015201620172018201920202021202220232024
EPD (TWh)202219239260283307332361392427464
NER (PLN)82.485.789.391.693.895.596.597.097.297.497.6
NER (PLN + non-PLN)84.487.791.393.695.897.498.498.999.199.399.4
Table 2. Transformer population and capacities from 2011 and 2016 [51,52].
YearSystemTransformer TypeTotal
500/150 kV275/150 kV150/70 kV150/20 kV70/20 kV
2011Capacity (MVA)21,500410474639,036378469,476
Transformer units4779671961217
2012Capacity (MVA)24,000590474643,473378276,591
Transformer units49510401961292
2013Capacity (MVA)24,000590480646,971395080,317
Transformer units49511201921366
2014Capacity (MVA)26,500770499551,334416587,764
Transformer units52511651921414
2015Capacity (MVA)28,000910502653,850426592,051
Transformer units57912162001482
2016Capacity (MVA)29,0001410512661,5454715101,796
Transformer units591013552161640
Table 3. Java-Bali transmission system failures from 2015 to 2016 [51,52].
CategoryEquipmentNon-OutageOutageENS (MWh)
201520162015201620152016
Transmission line500 kV4540533428385
150 kV204145414534898077
70 kV64463622473398
Bus bar500 kV000000
150 kV20752192270
70 kV00308220
Transformer500/150 kV4912475821511
150/70 kV232610157
150/20 kV43595713411157
Incomer 20 kV (150/20 kV)3663341734673
70/20 kV027910255
Incomer 20 kV (70/20 kV)21676445
Total330255241192213712,727
Table 4. Statistical data of PT failures from 2008 and 2016 [51,52].
SubstationBay TransformerVoltage LevelAge (Years)Failure ComponentFailure Year
GI Cilegon BaruPT 1500/15018Bushing2008
AIS Cawang17 2013
AIS CawangPT 2
GI Cilegon Baru20OLTC2012
GI PulogadungTrafo 7150/204Winding2008
GI BekasiTrafo 229
GI Tangerang4
GI KembanganPT 1500/150182009
GI Cawang13
GI BekasiTrafo 3150/20332010
GI Pasar KemisTrafo 1192012
GI Petukangan18
GI Kemayoran16
GI Gambir BaruTrafo 2
GI CikandeTrafo 1192013
GI PulogadungTrafo 535
GI SerangTrafo 310
GI Cawang LamaPT 5150/70382014
GI Tangerang LamaTrafo 4150/2052015
GI Kelapa GadingTrafo 342014
AIS KembanganPT 2500/150182015
GI AsahimasTrafo 1150/20282016
GI Muarakarang Baru21
Table 5. OHI estimation based on actual failure distribution between 2008 and 2016.
jCondition AssessmentPLN Maintenance IntervalKPhase Condition Rating
RST
1DGAYearly10424
2Load historyDaily10333
3Power factor2-yearly10333
4Infra-redDaily-monthly10444
5Oil qualityYearly/conditional6432
6Overall conditionConditional8444
7Furan or ageAge5444
8Turns ratioConditional5100
9Leakage resistance 0---
10Winding resistance2-yearly6000
11Core-to-groundConditional2333
12Bushing conditionMonthly5000
13Main tank corrosionYearly2222
14Cooling equipmentDaily, monthly, 3-monthly, conditional2222
15Oil tank corrosionYearly1444
16FoundationYearly1444
17GroundingYearly1444
18Gaskets, seals3-monthly1444
19Connectors3-monthly1444
20Oil leaks3-monthly1444
21Oil levelMonthly1444
22DGA of LTCConditional0---
23LTC oil quality 3444
24Overall LTC conditionConditional5444
Internal, OLTC, bushing (20% based on 8-year failure history)181415
Winding (80% based on 8-year failure history)353030
OHI534445
Table 6. Remaining life estimation based on PLN’s failure rate curve.
PhaseOHIProbability of Failure A e f f , P A O γ P μ L i f e
R350.12529.564.915.39
S300.1539.66.62.48
T

