Abstract
Oil wealth can foster social inequality if not properly managed. This is due to the migration of production factors from different economic activities to the oil sector. As a result, unemployment, poverty, political instability, a reduction in development, among other undesirable effects on society, may arise. With that in mind, this research evaluates the government’s role in the socioeconomic development of the oil producing municipalities in Rio Grande do Norte State (RN), the largest onshore producer in Brazil. The research uses panel regression as it allows broad analyses of the space and time dimensions to be performed. In addition, it relies on statistical testing at all stages to make the research analysis more appropriate and consistent. The proposed model revealed better socioeconomic development indicators in municipalities where the local Government made public savings as reserve funds. Furthermore, the results show that appropriate public savings management allows municipal governments to design public policies to provide future generations with socioeconomic benefits, in line with the purpose of royalties.
1. Introduction
Oil is a basic natural resource. As such, activities related to its extraction and their results are connected to various economic sectors, since its expansion requires several activities. However, if not properly managed, the abundance of such resources can foster social inequality as a result of the production factors migration to the oil sector from other economic activities.
The literature shows both proper and inappropriate ways in which oil income has been used. Norway, for example, has developed a management model that brings together three dimensions, i.e., political, commercial, and regulatory, and which has served as a model for other countries [1,2]. Ghana, on the other hand, despite its satisfactory economic results, must deal with a precarious institutional structure which is unable to distribute economic benefits and, thus, ensure social equity [3].
Recognizing that there are different reasons why an oil shock should affect macroeconomic variables [4], the impact on inflation and industrial production growth rates of four different proxies of oil price shocks were measured for some European countries. The authors of [5] measured the impact of oil prices on both inflation and economic growth rates for some Asian countries. The results suggested that oil prices have a significant effect on both economic activity and price indexes, although the impact is limited to the short run and is more significant when oil price shocks are defined in local currencies. The authors of [4,5] indicated the need for further studies to obtain more reliable conclusions.
Given the controversial nature of the aforementioned studies, the need to analyze how oil revenues can be properly managed to ensure both long-term social welfare and the transformation of economic outcomes into benefits for the society becomes evident.
The authors of [6] advocate that income from nonrenewable natural resources be invested in reproductive capital, such as machines and labor, to achieve intergenerational equity. Similarly, the authors of [7,8,9] reinforce that income from these resources should be reinvested to ensure the well-being of society and to offset natural capital consumption.
In the state of Rio Grande do Norte, northeastern Brazil, some municipalities have been facing a decline in oil production due to divestment in onshore activity. This, in turn, has serious consequences for their entire economy, as shown by [10].
The authors of [11] investigated a similar scenario and found that the exploitation of natural resources leads to a reduction in a country’s development levels. Furthermore, the authors stated that, over time, the weaknesses inherent in this reduction manifest as productive activity and competitiveness loss, unemployment, and corruption.
This research proposes that the core of the oil-development issue must be extended beyond the economic dimension. In particular, this article advocates that the Brazilian government should take the socioeconomic development trajectory by integrating oil activity with local activities and by using oil revenues to provide local economies and society with benefits in the pursuit of intergenerational equity.
Hence, the research question arises: “In this scenario of reduced onshore activity, can the Government contribute to the socioeconomic development in the oil producing municipalities of Rio Grande do Norte?”. To answer this question, two development models will be analyzed. The first sustains the hypothesis that development in these municipalities is purely economic, while the other, proposed in the light of a literature analysis, seeks to measure the role of municipal government in local development. The latter advocates for the hypothesis of socioeconomic development with intergenerational equity. Panel regression modeling is used as the analysis technique. This technique suits this research as it deals with both local and temporal data [12]. Panel regression modeling is advantageous over other methodologies in that it increases the amount of information present in the sample, the accuracy of the estimators, and the power of statistical tests [13].
This article is divided into six parts. In addition to this Introduction, it presents the Theoretical Basis of the study, the Materials and Methods, Results and Discussion, and a Conclusion.
2. Theoretical Basis
2.1. Oil and Development
Regarding natural resource management, the literature reveals that the mismanagement of abundant natural resources fosters undesirable effects on society, such as reductions in economic development levels, rentier behavior, and local impoverishment. In [14], citing a pioneer study by [15], the authors point to the decline of industry in Australia after the discovery of gold in the country. Similarly, [16,17,18] asserted that the abundance of natural resources could lead to a reduction in the rate of development. According to [19], the phenomenon brings about a reduction in investments, a drop in production, and unemployment, among other negative consequences for the economy. This phenomenon is known as Dutch Disease.
Among natural resources, oil is particularly prominent as it plays an important role in the political, economic, and social dimensions. However, it tends to generate revenue concentration, which triggers rentier behavior and corruption, thereby reducing the State’s institutional quality [20].
Overall, the oil industry is directly bound to international competitiveness standards. Therefore, in order to properly bind oil activities to those of other sectors, additional local economic activity is required. The authors of [21,22] advocate that activities in the oil sector, although very profitable, are not the key to achieving desirable levels of development. In several producing countries, where oil revenues are not properly used, tough democratic processes, corruption, poor institutional quality, and rentier behavior are some of the problems that must be addressed. The authors of [8] advocate for the need for Government action so that oil activities can be integrated with local activities to promote synergy in local reality, rather than eliminating local activities to benefit oil activities.
There have been many studies on the relationship between oil and development. For example, [18] studied the case of Venezuela and the implications of its dependence on oil. The authors of [23] found that when Norway began developing its North Sea offshore oil reserves, Venezuela was already producing more than 3.6 million oil barrels a day. Nevertheless, the per capita Venezuelan income represents only 15% that of Norway. The authors of [3] state that Ghana has been able to adequately address the problems of Africa’s oil economies, but that the country’s political and social problems are, to some extent, an obstacle to the distribution of economic gains across society. This means that the core of the oil-development issue must be extended beyond the economic dimension, i.e., by including the political and social dimensions in analyses. In particular, this article advocates that governments should plot socioeconomic development trajectories by integrating oil activity with local activities and by using oil revenues to provide local economies and society with benefits in the pursuit of intergenerational equity.
2.2. Analytical Tools
The relationship between natural resources and development has been analyzed using various analysis models. Noteworthy is the model by [11], which provided evidence for slow development in countries with large amounts of natural resources. Their model was based on estimation by ordinary least squares. These authors based their approach on those of [19,24], who first made the observation that in countries with many tradable natural resources, real exchange rate appreciation occurs, causing investment displacement from other sectors, and thus, decreasing competitiveness.
The authors of [25] used a panel regression model, which took studies to another level. Among the results, it should be noted that the abundance of natural resources has a positive relationship with economic growth.
The authors of [26,27] used different methodologies and found the need to study the Government’s role in that context. The authors of [26] used cointegration and error correction vectors, and found a positive relationship between exchange rate appreciation and government consumption. Another important result was that corruption reduces currency appreciation. The authors of [27] used a computable general equilibrium model and found that public investments contribute to reducing deindustrialization, increasing Gross Domestic Product (GDP) growth, and incomes among the poor.
The studied models then shifted their emphasis. In this regard, the authors of [28] stated that the role of government is crucial in determining the relationship between natural resources and development. The authors used a vector error correction model and found that the growth of government expenditure eliminates production. In addition, the authors found that when the government uses proper fiscal policy, the result is a rise in production.
Regarding the theoretical specification of the tools used for this analysis, the authors of [29] stated that the appropriate tools can usually be structured into two groups: computable general equilibrium models and econometric models, estimated by ordinary least squares. The authors of [30] advocate that the autoregressive vector methodology is more commonly used because it allows both predictions of interrelated temporal series and analyses of dynamic impacts of random disturbances on the model’s variables to be made. In order to perform an analysis, a system of equations was constructed in which the value of each variable is expressed as a linear function of its own lagged values and of those of all other variables included in the model.
Computable general equilibrium models are very limited in their ability to perform the analyses discussed in this research. It must be noted that such models require complex techniques which require a large volume of calculations, many conditions, and assumptions. This, in turn, requires more time and more subjective control over the required operations, for example, in the combination of information from input–output matrices and national accounting, in order to identify how the model responds to price and quantity changes [31]. Moreover, it should be noted that these models are not probabilistic, and that it is very hard to obtain all the necessary data for their proper application.
Regarding the other cited models, in general, they are part of time series econometrics. Unlike the computable general equilibrium models, they are probabilistic, have a more formal specification, and their analyses have a statistical framework. Yet, their restrictions could make their application to this research impossible. Among the constraints, it should be noted that while time series consider only the time dimension in the analysis, the local dimension cannot be addressed. In time series analysis, it is necessary to ensure series stationarity, and the criteria to choose the techniques to analyze this stationarity are subjective. This means that there is no way to use statistical tests to find out which technique is most appropriate [32].
Unlike these categories of analysis models, the panel regression model is much better suited for this research. A very relevant aspect is the fact that this model addresses the series in the spatial and temporal dimensions. This greatly increases the quality of information in the data [12].
In addition, if necessary, it is possible to make robust corrections to the appropriate model and test them [33].
3. Materials and Methods
3.1. Municipal Development
The methodological path adopted consists of proposing two models of municipal development. One of them is based on the prevailing concepts in the literature, in which predominantly economic aspects stand out: the Purely Economic Development Model. The other, in contrast, proposes that economic development should be extended to the whole of society, in the pursuit of intergenerational equity: the Socioeconomic Development Model.
The measurement of municipal development measurement based on the IFDM-Firjan Municipal Development Index is proposed as an indicator of socioeconomic development. In this regard, IFDM seeks to represent how municipalities operate in three dimensions: employment and income; education, and health. IFDM measures aspects related to municipal government performance. Furthermore, it has annual periodicity, which makes evolution monitoring easier, and allows equal use to be made with other important, annual periodicity indicators within the scope of this research. In addition, IFDM suits the purposes of this research better than the other indicators, which, despite serving the same purpose, do not have annual periodicity, do not strictly address municipal aspects, and predominantly cover economic dimensions [34].
The IFDM is in line with the United Nations (UN) position that development indicators address not only economic aspects [35]. Moreover, it uses statistical tests to confirm theoretical hypotheses and to evaluate index weight structures, and follows international standards regarding variables and on how to measure them to ensure that the role of the municipality is being effectively measured. IFDM addresses equally well-established areas of human development, namely Employment and Income, Education, and Health [36].
Employment and Income represents both the economic environment and the structural characteristics of the labor market (Table 1).

Table 1.
Employment and Income Area - Weights of Variables.
Regarding Education, it was designed to represent the provision of early childhood education and the quality of education provided in elementary school (Table 2).
Table 2.
Education Area - Weights of Variables.
The Health area focuses on basic health, which is the municipal government’s obligation (Table 3).
Table 3.
Health Area - Weights of Variables.
Therefore, the IFDM of a municipality consolidates local socioeconomic development levels through the simple average of the results obtained in each of the three highlighted areas. Their final value ranges from zero to one.
Regarding their use, [37] used development and public expenditure indicators to measure the public efficiency of welfare. Their conclusions showed that IFDM plays an important role in public service evaluations. The authors of [38] note that IFDM represents a reference for updating municipal socioeconomic development. The authors emphasize the efficiency of IFDM in municipal management evaluations regarding plotting development trajectories.
In addition, this research proposes the public savings variable as a possible measure to guarantee social welfare for future generations [39,40]. Since oil is a nonrenewable resource and is associated with a cost-dependent income [41], public savings emerge as a possibility to help the municipal government manage oil exploration and, thus, foster the implementation of a more diverse local economy, reduce oil activity dependency, make its consumption sustainable over time, and ensure intergenerational equity [6]. There is legislation in Brazil that subordinates the transfer of royalties to municipalities. Public savings are a necessity, especially in Brazil, where municipal governments have not yet properly applied revenues from oil exploration to socioeconomic development [42].
Public savings are explanatory of IFDM in the model proposed in this research. In fact, the incorporation of the public savings variable into the analysis seeks to ensure intergenerational equity, as it is the Government’s role to provide society and the local economy with equity [8].
Finally, this research seeks to contribute to advancing studies in the investigated area by proposing to analyze municipalities, instead of countries, as previous studies on this theme have traditionally done. It should be noted that people live in municipalities and that this is where the government needs to ensure adequate conditions for society and the economy to develop. It should also be noted that Brazilian municipalities have been receiving more and more responsibilities while, contradictorily, revenues have not increased at the same rate. This, in turn, indicates the need for better public management by municipal governments [43].
This research investigated municipalities, rather than countries, as has frequently been studied, as the authors understand that broader national data tend to be less representative. Moreover, aggregating local data naturally increases data heterogeneity because of the increasing deviation between those data. This results from the geographic, economic, cultural, social, and political conditions which are inherent to municipal local realities.
Finally, it should be noted that the present research will focus on the oil producing municipalities of the state of Rio Grande do Norte, the largest onshore producer in Brazil for the past 20 years [44,45].
3.2. Analysis Technique
The analysis technique used is panel regression, which, according to the author of [33], presents objective procedures which are based on statistical tests to ensure the consistency of the analysis and to combine both temporal and local series data. The author also recommend the use of pooled analysis, fixed effects, and random effects models. He points out the necessity of running diagnostic tests to make sure that the most consistent and suitable analysis model is chosen.
According to Figure 1, after specifying the Model, all other activities are objectively defined and evaluated through statistical tests.
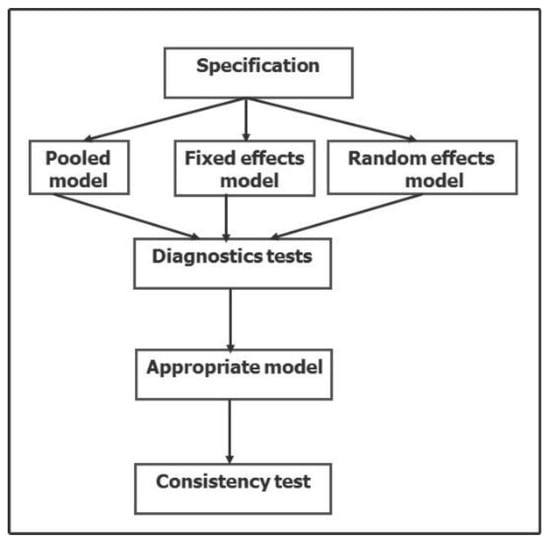
Figure 1.
Panel regression and instrumental variables regression.
Regarding panel regression models, specifically, in the pooled model, all coefficients are constant over time and between individuals. In the fixed effects model, each individual’s intercept may differ, but it does not vary over time, while in the random effects model, each individual’s random intercept is not correlated with explanatory variables [33].
Regarding diagnostic tests, the first thing to do is choose the most appropriate analysis model [46]. The tests used for this selection are listed in Table 4.
Table 4.
Tests to choose the best panel regression model.
Afterwards, the multicollinearity [47], serial autocorrelation in the error term [33], and heteroscedasticity [33] must be diagnosed. Diagnostic tests give more consistency to the chosen model [46,48]. In order to obtain such diagnoses, the decision rules from Table 5 must be considered.
Table 5.
Diagnostic tests.
Therefore, panel regression analysis, as shown in Figure 1 and Table 4 and Table 5, consists of a standardized process of objective and automated activities with statistical tests on all activities. This allows an objective analysis to be made of the role of independent variables in the behavior of the dependent variable in space and time [46,49].
3.3. Analyzed Development Models
In order to understand the purpose of this research regarding the relationship between oil and development, and the role of municipal government, first, it is necessary to explain how the purely economic model and the socioeconomic development model were outlined. Figure 2 shows how the municipality prepares and transforms for the inclusion of oil activity. It also reveals the research proposal to investigate the role of municipal government in this context.
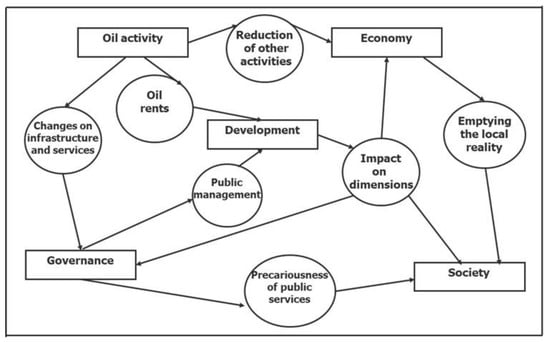
Figure 2.
Oil, Municipal Government, and Development.
Figure 2 shows the political, economic, and social dimensions in municipalities with oil activities, and shows how these activities impact local reality. With the emergence of oil activity, municipalities are affected by the increase in more profitable jobs, the increase in demand for public services, due to the population increase, and the reduction of local economic activities, as local workforces shift to the oil sector.
Such a reality demands that local governments find solutions through public management actions to avoid negative impacts on the local reality and reductions in the quality of public services, while financial revenues increase.
Therefore, this research proposes that municipal governments use financial revenues to build public savings to provide local economies, society, and oil activities with efficient public management, thereby promoting socioeconomic development [50,51].
Regarding the variables that comprise the analyzed models, those appropriate for the analysis and whose data are available for all municipalities in all years were selected.
The per capita gross domestic product (GDP) variable is the most commonly used for economic analyses when considering only economic development [52], and for impact evaluation studies of oil industry royalties on the economy, such as in the studies by [53,54].
The per capita expenditure variable represents the way the government spends, since oil-producing municipalities are known for their huge expenditures. The royalty variable represents oil revenue and is added to the municipality’s revenues.
The employment balance variable represents a measurement of the economic activity in oil-dependent locations, where there are many jobs in oil activity and high unemployment in local activities [55].
The high school distortion rate variable shows the rate of students at that schooling level’s average age who are not attending school. In general, those students drop out of school to work and help maintain their families. So, it is recommended that the government increase the amount of educational opportunities by improving education quality, which would strengthen local reality [7].
Proper public management can be measured by the public savings variable. This represents a municipal management effort to ensure future investments by changing the economic results from oil royalties into development for the entire local society. Public savings are a concrete means for municipal governments to invest in socioeconomic development over time to ensure intergenerational equity.
A summary of the variables used in this paper will be presented in Section 3.4.
Finally, it should be noted that socioeconomic development will be expressed in the IFDM variable, as this indicator is better able than the other indicators to measure aspects which are strictly related to the municipal government’s performance, to have an annual frequency, and to allow its equal use with other important indicators within the scope of this survey.
Regarding the development models chosen for this research, two models were analyzed: the purely economic model and the socioeconomic development model.
The first one is reduced to the economic dimension and has no municipal government participation. This model was used to analyze the hypothesis that oil wealth is responsible for development, the importance of royalties for the municipality’s gross domestic product (GDP), and to verify whether this model is significant, according to Equation (1) below.
GDP = α + β1EXPENSES + β2EMPLOYMENT + β3EDUCATION + β4ROYALTIES
Model (1) represents what has been analyzed by various authors concerning development in oil-producing economies. In [53,54], GDP and oil were used as development dependent variables.
As for the second model proposed in this research, analyses were run on the hypothesis that public management in more cautious municipalities seeks to achieve an investment capacity that can carry out future investments to promote intergenerational equity. Public management is represented by the public savings variable, as it allows municipal governments to carry out public management aimed at improving local public reality. This, in turn, will lead to a better socioeconomic development indicator and function as an attempt to make up for the consumption of natural resources from oil exploration by making future investments in human capital, thereby enhancing local socioeconomic reality. The proposed socioeconomic development indicator is the IFDM.
As for operationalization, the Model will analyze the contribution hypothesis of the research that development is broader than mere economic results, and that it can be expressed in socioeconomic outcomes with the effective participation of the municipal government through public savings to the municipal IFDM. Finally, the socioeconomic model is tested for significance, according to Equation (2) below.
IFDM = α + β1SAVINGS + β2EMPLOYMENT + β3EDUCATION + β4ROYALTIES
The socioeconomic development model (2) is intended to take a step forward and lead development discussions to another level, i.e., beyond that of merely economic models (1). By using IFDM instead of GDP, model (2) recognizes that development goes beyond the economic aspect and places the emphasis on the role of municipal public management. By using the public savings variable instead of that of expenditure, model (2) recognizes that a municipal financial fund will allow governments to make investments for local socioeconomic development. This, in turn, will foster intergenerational equity.
3.4. Variables Studied
Annual data from oil producing municipalities in Rio Grande do Norte state from 2003 to 2012 comprise the variables analyzed in this study. The municipalities surveyed are Assu, Alto Rodrigues, Apodi, Areia Branca, Caraúbas, Carnaubais, Felipe Guerra, Governador Dix-sept Rosado, Guamaré, Macau, Mossoró, Pendências, Porto do Mangue, Serra do Mel, and Upanema. Due to some difficulties in obtaining data for all variables in all municipalities, in each year, some of the data were estimated using linear regression Y = a + bX, where Y represents the variable whose data is to be estimated, and X the year variable. In addition, the data represent unbalanced panels [33].
The variables studied and their data sources are shown in Table 6.
Table 6.
Description of variables and data sources.
The Stata software was used for the implementation of panel regression analyses with diagnostic models and tests [32].
4. Results and Discussion
4.1. Characterization of Municipalities
Rio Grande do Norte is located in the Northeast region of Brazil and has a population of 3,168,027 inhabitants, according to the most recent 2010 census [56]. Its territory is divided into 167 municipalities. Its economy, according to [63], ranks 18th in Brazil. The extractive industry is fundamentally sustained by oil activity, which, until 2009, accounted for 33% of the industry’s GDP. With the decline in production as a result of the registered divestment, this important activity has reduced in importance in the local economy, comprising only 10% of the industry’s GDP since 2016 [63].
Despite the decline in oil production and divestment in onshore exploration, Rio Grande do Norte remains the main producer in this modality, constituting around 33% of Brazil’s onshore production [44,45]. Rio Grande do Norte represents a situation experienced by Brazilian municipalities when the impacts of onshore oil production have effects for the entire economy and local society.
A description featuring the municipalities’ variables and average values is given below.
Figure 3 shows series of variables from 2003 to 2012 for per capita GDP, per capita revenue, and per capita expenditures, where 2003 is the base year. Figure 3 shows the average per capita GDP growth up to 2009, followed by a decline, whenever GDP follows a similar path to average per capita expenditures. This reduction in per capita GDP suggests a retraction in production activities.
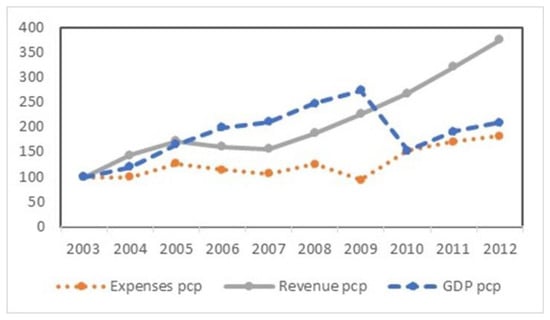
Figure 3.
GDP per capita, Revenue per capita and Expenses per capita; base: 2003.
The distribution of royalties to municipalities is shown in Figure 4. This Figure shows that municipalities had a similar evolution in the time lapse of around 50%. The Pendências municipality alone had a 300% evolution, which is considered very high.
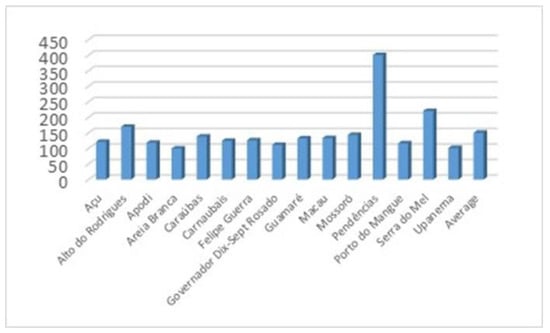
Figure 4.
Average Royalties.
Figure 5 presents the municipal socioeconomic development index as measured by IFDM. Rates in some municipalities, such as Alto do Rodrigues, Guamaré and Mossoró were way above the general average.
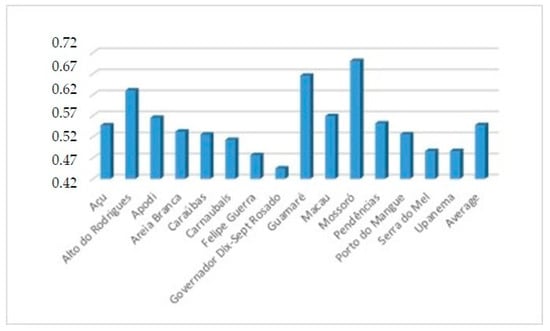
Figure 5.
Average IFDM.
Figure 6 shows the relationship between the variables relevant for our research, such as public savings and the IFDM, for the period from 2003 to 2012, regarding the temporal dimension. Figure 6 shows an indicative correlation between these variables, with an explanation coefficient of 65.55%.
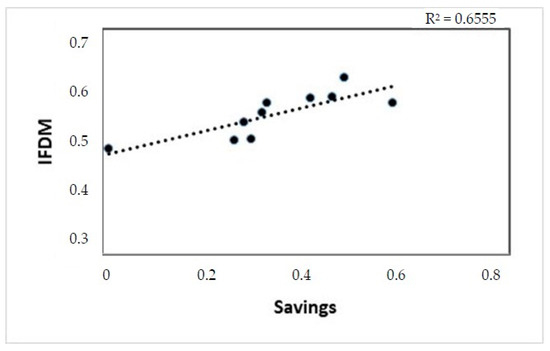
Figure 6.
Scatterplot Savings x IFDM - Temporal Dimension.
Figure 7, on the other hand, shows a nonindicative situation of a relationship between public savings and the IFDM variable in the spatial dimension, with an explanation coefficient of 1.55%.
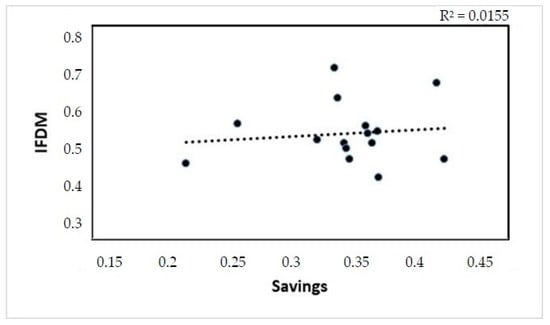
Figure 7.
Scatterplot Savings x IFDM—Spatial dimension.
The different results presented in Figure 6 and Figure 7 show how important it is to consider the panel regression model, which addresses both spatial and temporal dimensions, to ensure consistency in the analysis.
These results make it clear that the analyzed variables play an important role for the public management evaluation. It was possible to check the importance of panel regression for analysis consistency, as well as feature municipalities based on socioeconomic variables.
4.2. Purely Economic Development Model
In this subsection, we will analyze Equation (1), presented in the methodology section, in which the per capita GDP functions as the dependent variable. The analyses used the results from Table 7.
Table 7.
Economic development model.
Regarding the pooled model, it should be noted that it is significant at the 5% level, with a p-value of 0.0406. However, the explanation coefficient has a small value, i.e., 8.19%.
The fixed effects model is significant at the 5% level, with a p-value of 0.0013. However, the explanation coefficient is 1.62%.
The random effects model has a coefficient of explanation of 1.48%. The model itself is not significant at the 5% level, showing a p-value of 0.2403.
Overall, the three models offer little explanation. This alone indicates their limitation in terms of representing the development of oil producing municipalities. Still, the diagnostic tests were analyzed by using the results in Table 8.
Table 8.
Diagnostic tests to economic models.
According to the Chow test, the hypothesis of the pooled model should be rejected at the 5% level, as its p-value is 0.0000. Therefore, the fixed effect model from the hypothesis is the most appropriate one.
The Hausman test shows that the hypothesis of the random effect model should be rejected at the 5% level, as its p-value is 0.0001. Therefore, the fixed effect model from the hypothesis is the most appropriate one.
Finally, the LM Breusch-Pagan test shows the rejection of hypothesis of the pooled model at the 5% level, with a 0.0000 p-value. In that case, the random effect model from hypothesis would be the most appropriate one.
At this point, a more strategic analysis of the results is achieved. Firstly, it should be noted that the per capita GDP of the surveyed oil producing municipalities, as an economic variable, is not capable of thoroughly capturing their development. Secondly, the royalty variable was not significant at the 5% level. It was found that in those models, the p-value for the royalty variable coefficient was greater than 0.05. Therefore, the hypothesis that the development triggered by royalties is purely economic was not significant.
4.3. Socioeconomic Development Model
In this subsection, Equation (2) will be analyzed, as presented in the methodology section, with the IFDM as the dependent variable. The hypothesis that more prudent municipalities make public management efforts to build public savings, giving rise to better management of local public reality and providing a better indicator of socioeconomic development, will also be analyzed. The results presented in Table 9 will be used.
Table 9.
Socioeconomic development model.
The pooled model is significant at the 5% level with a p-value of 0.0000. The explanation coefficient R2 is 55.63%.
Regarding the fixed effects model, it has an R2 explanation coefficient of 53.26% and is significant at the 5% level, with a 0.0000 p-value.
Finally, the p-value of the random effects model is 0.0000. This indicates that this model is significant at the 5% level. It has also been observed that it has an explanation coefficient R2 of 54.04%, and that all explanatory variable coefficients are significant at the 5% level.
The diagnostic tests were analyzed using the results shown in Table 10.
Table 10.
Diagnostic tests for socioeconomic model.
The p-value of the Chow test was found to be 0.0000. It was also found that, at a 5% significance level, the fixed effects model is the most appropriate one.
The Hausman test p-value was 0.4424. Therefore, the random effects model is most appropriate at the 5% level.
Finally, it was found that the p-value of the LM Breusch-Pagan Test was 0.0000, and that at the 5% level the random effects model is the most appropriate one.
The convergence of diagnostic tests indicates that the random effects model is the most appropriate one. Despite the acceptable results of the random effects model, it is recommended that diagnoses of multicollinearity, serial autocorrelation in error term, and heteroscedasticity be made. The results are shown in Table 11.
Table 11.
Multicollinearity, serial autocorrelation in the error term, and heteroscedasticity.
Regarding multicollinearity and considering that the random effects model and all coefficients of its explanatory variables are significant at the 5% level, no evidence of multicollinearity was found [32]. Furthermore, considering that the Variance Inflation Factor (VIF) of each coefficient of explanatory variables was not higher than 10, and that the mean VIF of 1.29 was also below 10, it must be concluded that there is no evidence of multicollinearity.
As for serial autocorrelation in the error term, there is no evidence of autocorrelation at the 5% significance level, since the p-value was 0.0964.
As for heteroscedasticity, as the p-value was 0.0117, the presence of heteroscedasticity with 5% significance is accepted. In this case, one of the options to fix this problem is to make a robust model correction [33].
Table 12 shows the parameters of this new random effects model robustly corrected and without heteroscedasticity.
Table 12.
Corrected random effects model.
The explanation coefficient is R2 equals 54.04%. The model is significant at the 5% level, with a 0.0000 p-value. All explanatory variables have significant coefficients and the p-value is less than 0.05.
Considering all the results, it is clear that the development in the surveyed oil producing municipalities is well captured by the socioeconomic development model, with the IFDM and its explanatory variables, in particular, and with the inclusion of the public savings variable, the use of which is based on a literature review, on the basis of which it is believed that the financial fund from oil revenues plays an important role in the implementation of public policies by the Municipal Governments to guarantee the population’s well-being, as advocated by the role of royalties.
5. Conclusions
This research came to be after an analysis of the literature on oil and development, in which three very distinct notions emerged. The first concerns its purely economic role. It is a highly capital intensive and internationally competitive industry with a large wealth generating capacity. Another notion that emerged was that when the government does not adequately manage oil revenues, a shift of jobs from local activities to oil activities tends to occur due to the much higher wages associated with the latter. This, in turn, undermines local dynamics regarding cultural, social and political aspects, and becomes a drag on socioeconomic development [64]. Finally, it should be noted that some countries have managed to balance their economic growth through social welfare.
In this regard, given the controversial reality of the role of oil in development, and aiming to make both a proposal and a contribution to the literature, this research evaluated two development models: a purely economic one and the socioeconomic model, with the latter being broader and having the municipal government in a leading role, by making public management efforts to create public savings to try to ensure intergenerational equity.
Regarding the analysis of the two models, it was found that the first model was very limited in its ability to capture the development of the surveyed municipalities; in contrast, the socioeconomic model was more efficient according to the panel regression analysis techniques, such as pooled, fixed effects, random effects, and all diagnostic tests performed.
Finally, our conclusions showed that municipalities where public management can create public savings have better socioeconomic development indicators. These results are captured from social and economic aspects. In this research, they are represented by the royalties, high school distortion rate and employment balance variables.
Therefore, one way for the Government to contribute to socioeconomic development in the oil producing municipalities of Rio Grande do Norte would be to carry out efficient public management by applying oil activity revenue to the creation of public savings and to ensure the development of local economies, society and oil activities. While exploitation depletes natural oil resources, municipal governments must create public policies to promote and strengthen local social and economic aspects and ensure intergenerational equity.
Recognizing the role that the Academy plays in society, economics and politics, the present research shows the importance of objective analytical tools, with scientific rigor, in objective decision-making processes. It also showed the importance of establishing processes that guarantee intergenerational equity, based on the formulation of public policies that define and regulate the application of financial savings to achieve socioeconomic development.
The research recommends analyzing how oil activity impacts the human capital in oil producing municipalities. Another recommendation is to analyze the government’s role regarding local productive diversification in oil producing municipalities.
Author Contributions
Conceptualization, J.M.F., A.O.P.J., R.S.B.d.A. and N.F.d.S.; Data curation, J.M.F.; Formal analysis, J.M.F.; Investigation, J.M.F., R.S.B.d.A. and N.F.d.S.; Methodology, J.M.F. and A.O.P.J.; Software, J.M.F.; Supervision, A.O.P.J.; Validation, J.M.F. and A.O.P.J.; Visualization, J.M.F.; Writing–original draft, J.M.F., A.O.P.J., R.S.B.d.A. and N.F.d.S.; Writing–review&editing, J.M.F. and A.O.P.J. All authors have read and agreed to the published version of the manuscript.
Funding
This research was funded by a scholarship supported by Program CAPES/DINTER at the Federal University of Rio de Janeiro and Federal Institute of Science, Education and Technology of Rio Grande do Norte, financed by CAPES—Brazilian Federal Agency for Support and Evaluation of Graduate Education within the Ministry of Education of Brazil, grant number 023/2014.
Acknowledgments
The authors thank the Energy Planning Program of the Alberto Luiz Coimbra Institute for Graduate Studies and Engineering Research at the Federal University of Rio de Janeiro (Coppe-UFRJ), Federal Institute of Education, Science and Technology of Rio Grande do Norte (IFRN) and Coordination of Improvement of Higher Level Personnel (CAPES).
Conflicts of Interest
The authors declare no conflict of interest.
References
- Larsen, E.R. Are rich countries immune to the resource curse? Evidence from Norway’s management of its oil riches. Resour. Policy 2005, 30, 75–86. [Google Scholar] [CrossRef]
- Vandyck, T.; Kitous, A.; Saveyn, B.; Keramidas, K.; Santos, L.R.L.; Wojtowicz, K. Economic exposure to oil price shocks and the fragility of oil-exporting countries. Energies 2018, 11, 827. [Google Scholar] [CrossRef]
- Obeng-Odoom, F. Oil Rents, Policy and Social Development Lessons from the Ghana Controversy; United Nations Research Institute for Social Development: Geneva, Switzerland, 2015. [Google Scholar]
- Cunado, J.; Pérez de Gracia, F. Do oil price shocks matter? Evidence for some European countries. Energy Econ. 2003, 25, 137–154. [Google Scholar] [CrossRef]
- Cunado, J.; Perez de Gracia, F. Oil prices, economic activity and inflation: Evidence for some Asian countries. Q. Rev. Econ. Financ. 2005, 45, 65–83. [Google Scholar] [CrossRef]
- Hartwick, J.M. Intergenerational Equity and the Investing of Rents from Exhaustible Resources. Am. Econ. Rev. 1977, 67, 972–974. [Google Scholar]
- Shao, S.; Yang, L. Natural resource dependence, human capital accumulation, and economic growth: A combined explanation for the resource curse and the resource blessing. Energy Policy 2014, 74, 632–642. [Google Scholar] [CrossRef]
- Fang, Z.; Chen, Y. Human capital and energy in economic growth – Evidence from Chinese provincial data. Energy Econ. 2017, 68, 340–358. [Google Scholar] [CrossRef]
- Palatnik, R.R.; Tavor, T.; Voldman, L. The Symptoms of Illness: Does Israel Suffer from “Dutch Disease”? Energies 2019, 12, 2752. [Google Scholar] [CrossRef]
- Araújo, R.S.B.; Filgueira, J.M.; Jales Júnior, F. Matriz de risco político e econômico: Um estudo de caso em municípios produtores de petróleo e gás no onshore brasileiro. In Proceedings of the Rio Oil & Gas Expo and Conference, Rio de Janeiro, Brazil, 24–27 October 2016. [Google Scholar]
- Sachs, J.; Warner, A. Natural Resource Abundance and Economic Growth; National Bureau of Economic Research: Cambridge, MA, USA, 1995. [Google Scholar]
- Baltagi, B.H. Econometric Analysis of Panel Data; John Wiley Sons: Hoboken, NJ, USA, 2008. [Google Scholar]
- Hoque, M.E.; Low, S.W.; Zaidi, M.A.S. Do Oil and Gas Risk Factors Matter in the Malaysian Oil and Gas Industry? A Fama-MacBeth Two Stage Panel Regression Approach. Energies 2020, 13, 1154. [Google Scholar] [CrossRef]
- Souza, A.M.; Silva, J.A. Doença holandesa e desindustrialização no Brasil: 1995–2014. Indic. Econômicos FEE 2017, 44, 49–60. [Google Scholar]
- Cairnes, J. The Australian episode. In Selected Readings in International Trade and Tariff Problems; Taussig, F.W., Ed.; New York Ginn Co.: Boston, MA, USA, 1921. [Google Scholar]
- Prebisch, R. El dessarrollo econômico de la America Latina y algunos de sus principales problems. In Estudio Econômico de America Latina; Santiago do Chile CEPAL: Santiago, Chile, 1949. [Google Scholar]
- Singer, H.W. The Distribution of Gains between Investing and Borrowing Countries. Am. Econ. Rev. 1950, 40, 473–485. [Google Scholar]
- Furtado, C. O desenvolvimento recente da Venezuela. In Celso Furtado Ensaios sobre a Venezuela; Contraponto: Rio de Janeiro, Brazil, 2008; p. 187. ISBN 9788578660031. [Google Scholar]
- Corden, W.M.; Neary, J.P. Booming Sector and De-Industrialisation in a Small Open Economy. Econ. J. 1982, 92, 825–848. [Google Scholar] [CrossRef]
- Newell, R.G.; Raimi, D. The fiscal impacts of increased U.S. oil and gas development on local governments. Energy Policy 2018, 117, 14–24. [Google Scholar] [CrossRef]
- Ross, M.L. The Politics of the Resource Curse: A Review; Work. Pap.; University of California: Los Angeles, CA, USA, 2013. [Google Scholar]
- Apergis, N.; Payne, J. The oil curse, institutional quality, and growth in MENA countries: Evidence from time-varying cointegration. Energy Econ. 2014, 46, 1–9. [Google Scholar] [CrossRef]
- Maciel, G.C.A. Recursos Naturais e Desenvolvimento Econômico: Bênção, Maldição ou Oportunidade? Ph.D. Thesis, Univ. Fed. do Rio Janeiro, Inst. Econ., Rio de Janeiro, Brazil, 2015. [Google Scholar]
- Krugman, P. The narrow moving band, the Dutch disease, and the competitive consequences of Mrs. Thatcher. Notes on trade in the presence of dynamic scale economies. J. Dev. Econ. 1987, 27, 41–55. [Google Scholar] [CrossRef]
- Lederman, D.; Maloney, W.F. Trade Structure and Growth; Nat. Resour. Neither Curse nor Destin. World Bank: Washington, DC, USA, 2006. [Google Scholar]
- Oomes, N.; Kalcheva, K. Diagnosing Dutch Disease: Does Russia Have the Symptoms? IMF Work. Pap. 07/102; IMF Work: Washington, DC, USA, 2007. [Google Scholar]
- Levy, S. Public Investment to Reverse Dutch Disease: The Case of Chad. J. African Econ. 2007, 16, 439–484. [Google Scholar] [CrossRef]
- Ito, K. Dutch disease and Russia. Int. Econ. 2017, 151, 66–70. [Google Scholar] [CrossRef]
- Souza, C.R.S. de O Brasil Pegou a Doença Holandesa? Tese (Doutorado); Univ. São Paulo: São Paulo, Brazil, 2009. [Google Scholar]
- Veríssimo, M.P.; Xavier, C.L. Taxa de câmbio, exportações e crescimento: Uma investigação sobre a hipótese de doença holandesa no Brasil. Rev. Econ. Polit. 2013, 33, 82–101. [Google Scholar] [CrossRef]
- Valladares, L.M. Efeitos Econômicos da Expansão da Oferta de Petróleo e Gás Natural Provenientes do Pré-Sal Brasileiro. Ph.D. Thesis, UFMG-CEDEPLAR, Belo Horizonte, Brazil, 2013. [Google Scholar]
- Gujarati, D.; Porter, D.C. Econometria Básica; São Paulo McGraw-Hill Bookm.: New York, NY, USA, 2011. [Google Scholar]
- Wooldridge, J. Econometric Analysis of Cross Section and Panel Data, 2nd ed.; MIT: Cambridge, MA, USA, 2010. [Google Scholar]
- Godoy, D.V. Efficiency in Municipal Public Management in Education and Health. In XIX Prêmio Tesouro Nac. 2014; Tema 2—Econ. do Set. Público: Brasilia, Brazil, 2014. [Google Scholar]
- Scarpin, J.E.; Slomski, V. Estudo dos fatores condicionantes do índice de desenvolvimento humano nos municípios do estado do Paraná: Instrumento de controladoria para a tomada de decisões na gestão governamental. Rev. Adm. Publica 2007, 41, 909–933. [Google Scholar] [CrossRef][Green Version]
- Ifdm-methodology Methodological note (Nota Metodológica); Sist. FIRJAN-IFDM: Rio de Janeiro, Brazil, 2015.
- Silva, J.d.M.C.; Kuwahara, M.Y.; Maciel, V.F. A eficiência dos gastos municipais na geração de bem-estar na região metropolitana de São Paulo. Rev. Desenvolv. Econômico 2012, 1, 86. [Google Scholar] [CrossRef]
- Leite Filho, G.A.; Fialho, T.M. Relação entre indicadores de gestão pública e de desenvolvimento dos municípios brasileiros | Leite Filho | Cadernos Gestão Pública e Cidadania. Cad. Gestão Pública e Cid. São Paulo 2015, 20, 67. [Google Scholar]
- Nunes, J.B. Análise da Repartição das Participações Governamentais Advindas da Indústria do Petróleo Entre as Esferas de Governo e seu Impacto Sobre a Economia do Rio de Janeiro. Master’s Thesis, Rio Janeiro UFRJ/COPPE, Energy Planning Program, Alberto Luiz Coimbra Institute for Graduate Studies and Engineering Research at the Federal University of Rio de Janeiro (PPE/COPPE-UFRJ), Rio de Janeiro, Brazil, 2012. [Google Scholar]
- Choumert Nkolo, J. Developing a socially inclusive and sustainable natural gas sector in Tanzania. Energy Policy 2018, 118, 356–371. [Google Scholar] [CrossRef]
- Hotelling, H. The Economics of Exhaustible Resources. J. Polit. Econ. 1931, 39, 137–175. [Google Scholar] [CrossRef]
- Bresser-Pereira, L.C. Crescimento e Desenvolvimento Econômico; Esc. Econ. São Paulo da Fundação Getúlio Vargas: São Paulo, Brazil, 2008. [Google Scholar]
- Sousa, P.F.B.; Gomes, A.d.O.; Lima, A.O.; Peter, M.d.G.A.; Machado, M.V.V. Lei de Responsabilidade Fiscal e sua Relação com o Desenvolvimento Municipal: Uma Análise Utilizando Dados Em painel; XVIII Congr. Bras. Custos - ABC: São Leolpoldo, Brazil, 2011. [Google Scholar]
- Anp—Agência Nacional do Petróleo, G.N. e B. (Brasil). Anuário Estatístico Brasileiro do Petróleo, gás Natural e Biocombustíveis; Agência Nac. do Petróleo, Gás Nat. e Biocombustíveis.—Rio Janeiro: Rio de Janeiro, Brazil, 2016. [Google Scholar]
- Anp—Agência Nacional do Petróleo, G.N. e B. (Brasil). Produção Nacional de Petróleo e LGN (Metros Cúbicos); Agência Nac. do Petróleo, Gás Nat. e Biocombustíveis.—Rio Janeiro: Rio de Janeiro, Brazil, 2019. [Google Scholar]
- Cavalcanti, T.V.; Mohaddes, K.; Raissi, M. Growth, development and natural resources: New evidence using a heterogeneous panel analysis. Q. Rev. Econ. Financ. 2011, 51, 305–318. [Google Scholar] [CrossRef]
- Marques, L.D. Modelos Dinâmicos com Dados em Painel: Revisão de literatura; Série Work. Pap.; Centro de Estudos Macroeconómicos e Previsão: Porto, Portugal, 2000. [Google Scholar]
- Arezki, R.; Brückner, M. Oil rents, corruption, and state stability: Evidence from panel data regressions. Eur. Econ. Rev. 2011, 55, 955–963. [Google Scholar] [CrossRef]
- Alexeev, M.; Conrad, R. The elusive curse of oil. Rev. Econ. Stat. 2009, 91, 586–598. [Google Scholar] [CrossRef]
- Mukhtarov, S.; Mikayilov, J.I.; Mammadov, J.; Mammadov, E. The impact of financial development on energy consumption: Evidence from an oil-rich economy. Energies 2018, 11, 1536. [Google Scholar] [CrossRef]
- Humbatova, S.I.; Hajiyev, N.Q.-O. Oil Factor in Economic Development. Energies 2019, 12, 1573. [Google Scholar] [CrossRef]
- Liu, Y. Energy Production and Regional Economic Growth in China: A More Comprehensive Analysis Using a Panel Model. Energies 2013, 6, 1409–1420. [Google Scholar] [CrossRef]
- Rodrïguez, F.; Sachs, J.D. Why do resource-abundant economies grow more slowly? J. Econ. Growth 1999, 4, 277–303. [Google Scholar] [CrossRef]
- Postali, F.A.S.; Nishijima, M. O retorno social dos royalties do petróleo nos municípios brasileiros. In Proceedings of the 36th Brazilian Econ. Meet on An. do XXXVI Encontro Nac. Econ., Salvador, Brazil, 2008. [Google Scholar]
- Black, C. Uma Avaliação da Teoria da Doença Holandesa e da Hipótese da Maldição dos Recursos Naturais. Rev. Análise Econômica 2017, 35, 65–82. [Google Scholar] [CrossRef][Green Version]
- Pib-municípios. Produto Interno Bruto per capita, segundo as Grandes Regiões, Unidades da Federação e municípios; Prod. Interno Bruto dos Municípios—Inst. Bras. Geogr. e Estatística: Rio de Janeiro, Brazil, 2013. [Google Scholar]
- Despesa-municípios. FINBRA – Finanças do Brasil – Dados Contábeis dos Municípios - despesas; Secr. do Tesouro Nac.: Brasília, Brazil, 2013. [Google Scholar]
- Caged-saldo-emprego. Saldo do Emprego Formal de Janeiro a Dezembro de Cada ano por Município; CAGED—Cadastro Geral Empregados e Desempregados: Brasília, Brazil, 2013. [Google Scholar]
- Distorção-ensino-médio. Taxa de distorção idade-série—Ensino Médio; Obs. Monit. do Plano Nac. Educ.: São Paulo, Brazil, 2013. [Google Scholar]
- Royalties. Transferências Constitucionais—Tipo de Transferência Royalties; Secr. do Tesouro Nac.: Brasília, Brazil, 2013. [Google Scholar]
- IFDM. Evolução do IFDM—Índice FIRJAN de Desenvolvimento Municipal; Fed. das Indústrias do Rio Janeiro.: Rio de Janeiro, Brazil, 2013. [Google Scholar]
- Receita-municípios. FINBRA—Finanças do Brasil – Dados Contábeis dos Municípios - receitas; Secr. do Tesouro Nac.: Brasília, Brazil, 2013. [Google Scholar]
- Idema. Produto Interno Bruto do Estado e dos Municípios; Inst. Desenvolv. Sustentável e Meio Ambient. do Rio Gd. do Norte—Coord. Estud. Sócioeconômicos: Natal, Brazil, 2013. [Google Scholar]
- Kriskkumar, K.; Naseem, N.A.M. Analysis of oil price effect on economic growth of ASEAN net oil exporters. Energies 2019, 12, 3343. [Google Scholar] [CrossRef]
© 2020 by the authors. Licensee MDPI, Basel, Switzerland. This article is an open access article distributed under the terms and conditions of the Creative Commons Attribution (CC BY) license (http://creativecommons.org/licenses/by/4.0/).