Article

The Effect of Suction Side Tubercles on Torque Output of a Steam Turbine Low-Pressure Last Stage Blade

Key Laboratory of Hydraulic Machinery Transients, Wuhan University, Ministry of Education, Wuhan 430072, China
*
Author to whom correspondence should be addressed.
Energies 2020, 13(8), 1889; https://doi.org/10.3390/en13081889
Submission received: 15 March 2020 / Revised: 6 April 2020 / Accepted: 6 April 2020 / Published: 13 April 2020

Abstract

:
Flow separation and different kinds of stall flows occur under low load conditions for steam turbine last stage blades. In order to delay the flow separation and increase turbine power production, we applied suction side tubercles on steam turbine low-pressure last stage blades in the present study. The amplitude, wavelength, position, and thickness were considered as our design variables. We used the orthogonal test method (OTM) to generate modified blades with different tubercle variables that were then numerically simulated by a three-dimensional computational fluid dynamics (CFD) analysis. The blade axial torque of the nine modified tests was compared with the original blade. The results showed that the application of bionic tubercles on the suction side of the steam turbine blade is a promising solution to improve the blade axial torque for all modified tests with a maximum increase of 33.32% due to the turbulent vortices generated by bionic tubercles.

1. Introduction

With the energy structure reform in many countries of the world, the development of renewable energy generation, such as wind and solar power, is happening at an increasing rate [1]. The requirement for operational flexibility of power plants has increased. Inevitably, as an important part of power production devices, steam turbines face relevant problems, such as operating under partial load conditions to adjust the electrical frequency. However, under low load conditions, due to the increase of the impact angle of the steam flow, flow separation and different kinds of stall flows will occur in steam passage. This makes the flow characteristics inside the turbine more complicated than the design condition and causes various losses, which reduce the steam turbine power production [2]. In terms of delaying the flow separation, the application of bionic tubercles on turbine blades can be used as a research hotspot, as this can facilitate the momentum exchange between the boundary layer and the mainstream.
The arc-shaped tubercle of the humpback whale fin is considered as a passive flow control structure. Fish and Battle [3] found that the NACA634–021 airfoil section was quite similar to the cross section of the humpback whale fin. Subsequently, research work on the bionic tubercle shape referring to the humpback whale fin was carried out by many scholars who found that the presence of tubercle modification on the blade generated counter-rotating vortices, promoting energy exchange in the boundary layer and delaying the flow separation [4,5,6,7,8,9]. However, to our best knowledge, many previous studies applied bionic tubercles to aeronautic airfoils [10,11,12,13] or wind turbine blades [14,15,16,17,18], and few of them considered steam turbine applications [19,20]. Chen Tong [19] first applied leading edge bionic tubercle in the high-pressure last stage of steam turbines and discovered that it could improve the efficiency of the high-pressure last stage due to the counter-rotating vortices.
In the present work, our main objective was to consider the performance effect of suction side tubercles on the steam turbine low-pressure last blade. The amplitude, wavelength, position, and thickness were the considered design variables for the orthogonal test method (OTM), which generated nine different bionic tubercle configurations that were numerically simulated by a three-dimensional computational fluid dynamics (CFD) analysis. The blade axial torque of the nine modification tests was compared with the original blade. A physical explanation of the mechanism is given by looking at the flow characteristics around bionic tubercles. The remainder of this study is organized as follows: in Section 2, we describe the baseline geometry, bionic tubercle effectuation, and the orthogonal test method used to generate the bionic tubercle scheme, and we present the settings of the CFD simulation and the validation process. In Section 3, we show the results in terms of the blade axial torque of the nine modified cases and baseline, followed by a physical explanation of the phenomenon.

2. Materials and Methods

2.1. Geometry Scheme

The blading geometry of a steam turbine last stage was considered as the baseline geometry in the present paper, which consisted of 70 stator blades and 60 moving blades. The capacity of the steam turbine was 1000 MW and had a rotational speed of 1500 rev/min. The baseline geometry is shown in Figure 1a. Bionic tubercles are generated on the suction side of the baseline, referring to the tubercles on the fins of humpback whales. An example of the steam turbine low-pressure last blade with tubercles is presented in Figure 1b.
In order to control the shape and position of the tubercles, the parameters of the tubercle are defined in this paper, as shown in Figure 2. These are the wavelength, amplitude, position, and thickness. Among them, the wavelength, amplitude, position, and thickness are the control parameters for the distribution of the tubercles along the spanwise direction, the normal direction of the suction surface, the streamwise direction of the suction surface, and the size of the tubercles, respectively. For simplicity, the non-dimensional values of wavelength, amplitude, position, and thickness were considered, and they were defined as follows:
λ ¯ = λ H
A ¯ = A H
P ¯ = P L p
T ¯ = T L p
where H is the blade height, L p is the local suction side length, λ is the wavelength, A is the amplitude, P is the position, and T is the thickness.
The tubercles were set at 65–100% of the blade height of the low-pressure last stage moving blade of the turbine because it was demonstrated that tubercles are able to increase the turbine operative range; thus, it is reasonable to suppose they can work better under low load conditions when the steam mainly flows out the last stage from the blade tip. When the wavelength changes, the number of tubercles in the 65–100% of the blade height area will change. The effect of the change in the number of tubercles on the blade can be considered as the effect of the wavelength. Moreover, the blade was twisted and tapered from root to tip causing cascading section differences along the span. Therefore, the non-dimensional of position and thickness of the tubercles were calculated using the local suction surface length.
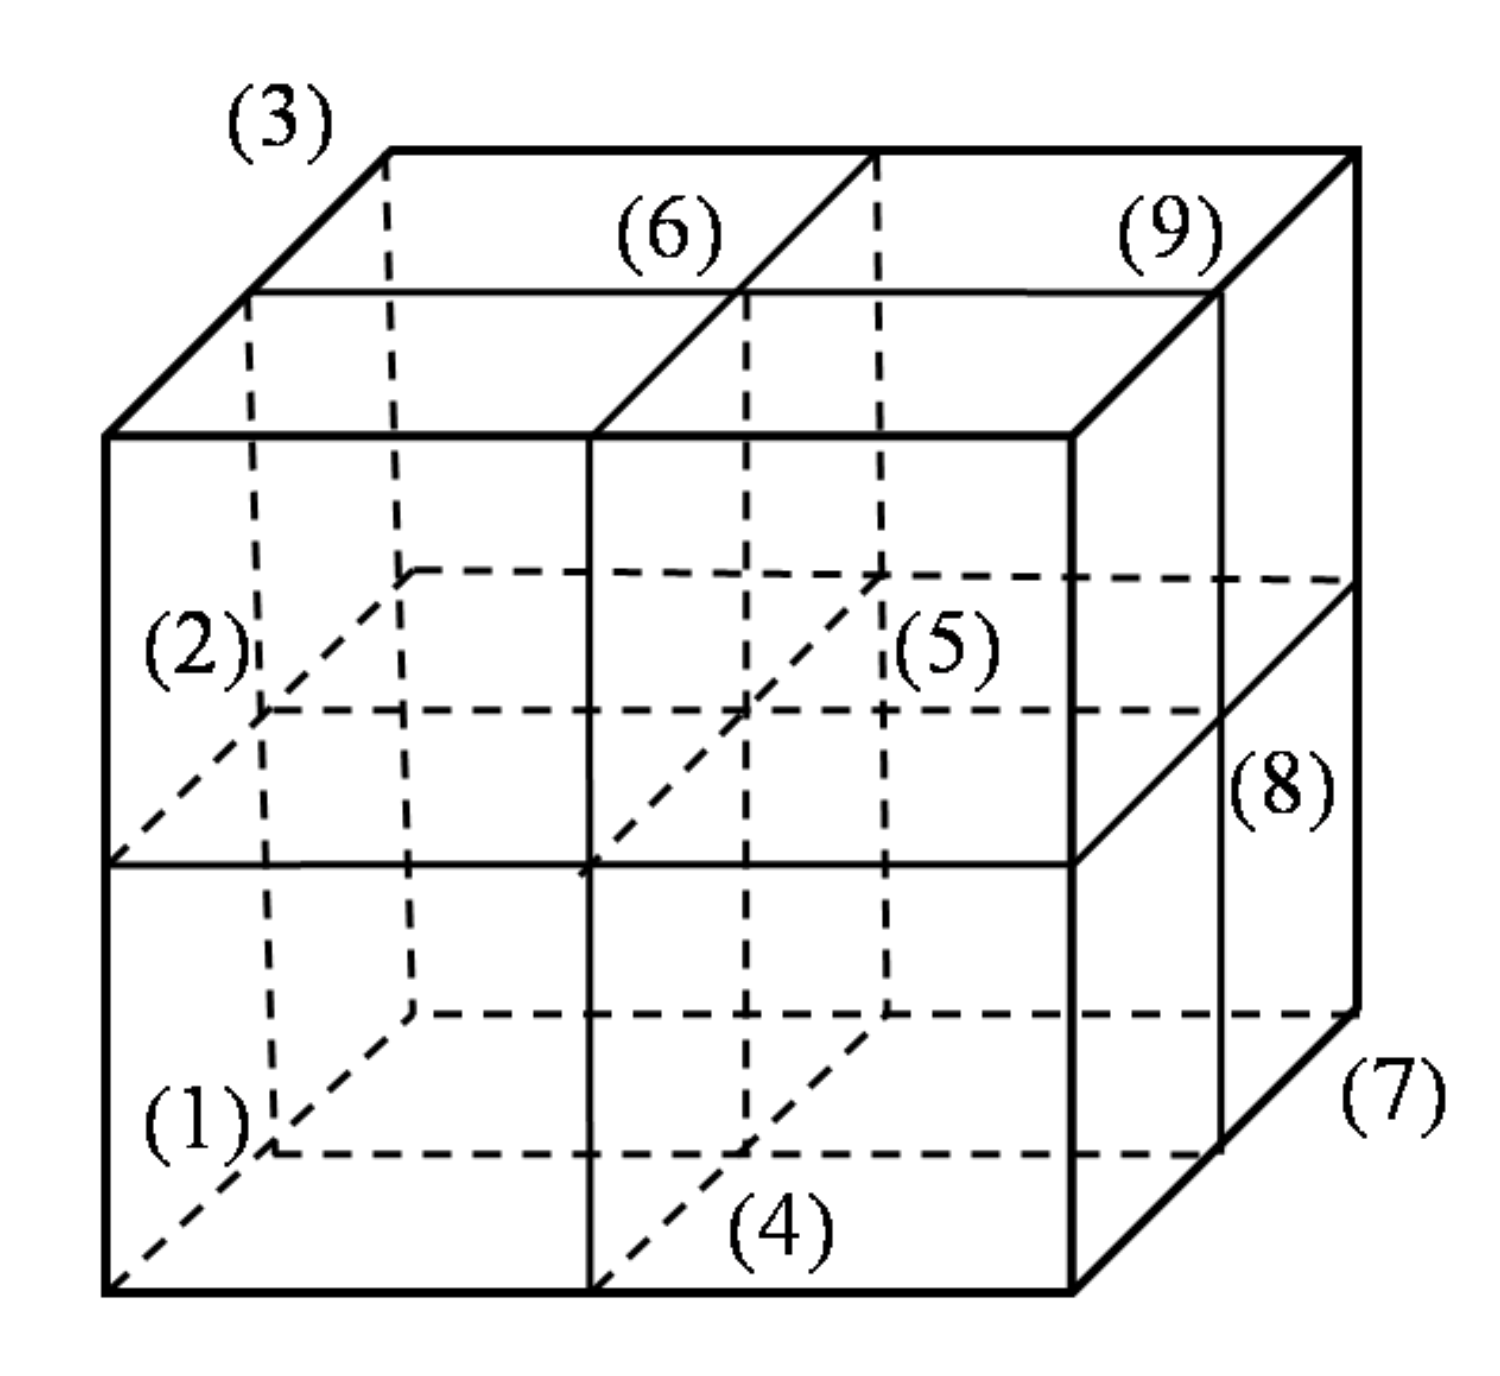
Previous works tested different tubercle configurations by changing the parameters randomly [15,21], while in this work, the orthogonal test method (OTM) was used to generate the representative tubercle geometry. OTM is a test method that uses a neatly arranged orthogonal table to conduct overall design, comprehensive comparison, and statistical analysis. This method can effectively reduce the number of tests in the case of having many parameters and a large range of parameter changes. The schematic diagram is shown in Figure 3. If a single-variable control variable method is used, 27 tests are required for a three factors of three levels test, while the test points can be systematically analyzed by controlling the number of tests nine times using OTM.
In the present work, the ranges applied to the non-dimensional wavelength, amplitude, position, and thickness are (1.09–2.19%), (0.55–0.77%) (6–10%), and (3–5%), respectively. The OTM was created by a four factors of three levels test. In Table 1, it is possible to see the test distribution of OTM contained in nine cases, and the corresponding non-dimensional values of wavelength, amplitude, position, and thickness are listed in Table 2. Each case represents a specific tubercle configuration and is simulated by three-dimensional CFD analysis.

2.2. Computational Methods and Validation

A three-dimensional CFD analysis was performed using ANSYS CFX, which is based on the finite volume method. The flow was considered as steady, compressible, viscous, and fully turbulent. Then, Reynolds time-averaged Navier–Stokes (RANS) with the κ-ω SST turbulent model was applied in the simulation. For the last stage of steam turbine low-pressure, there was steam condensation within the stage. A simple approach used for the simulation of flow characteristics was the equilibrium model, which assumes the two phases were in local thermodynamic equilibrium. Therefore, the governing equations are similar to those for single phase flow except that the flow variables were replaced by mixture properties. The mass, momentum, and energy governing equations are as follows:
ρ t + x i ρ u i = 0
ρ u j t + x i ρ u i u j = τ i j x i p x j
t ρ H p + x i ρ u i H = x i λ T x i + u j τ i j x i
where ρ , H , p , u j , τ , and λ   are the density and total enthalpy of the mixture, pressure, velocity components, shear stress, and thermal conductivity, respectively.
The iterations were conducted with high resolution discretization for governing equations. The κ-ω SST turbulent model with first-order upwind discretization in combination with y+≤1 of the prism layer mesh was used for flow calculations with an inverse pressure gradient and captured the transition of the boundary layer well. The automatic wall function was used with a non-slip boundary and the convergence criterion of the simulation was set as 1×10⁻⁴ for the RAM residuum. The IAPWS–IF97 library was applied to calculate the thermo-physical properties of the steam in which the steam properties in the solution process were obtained by interpolation in the previous steam range table.
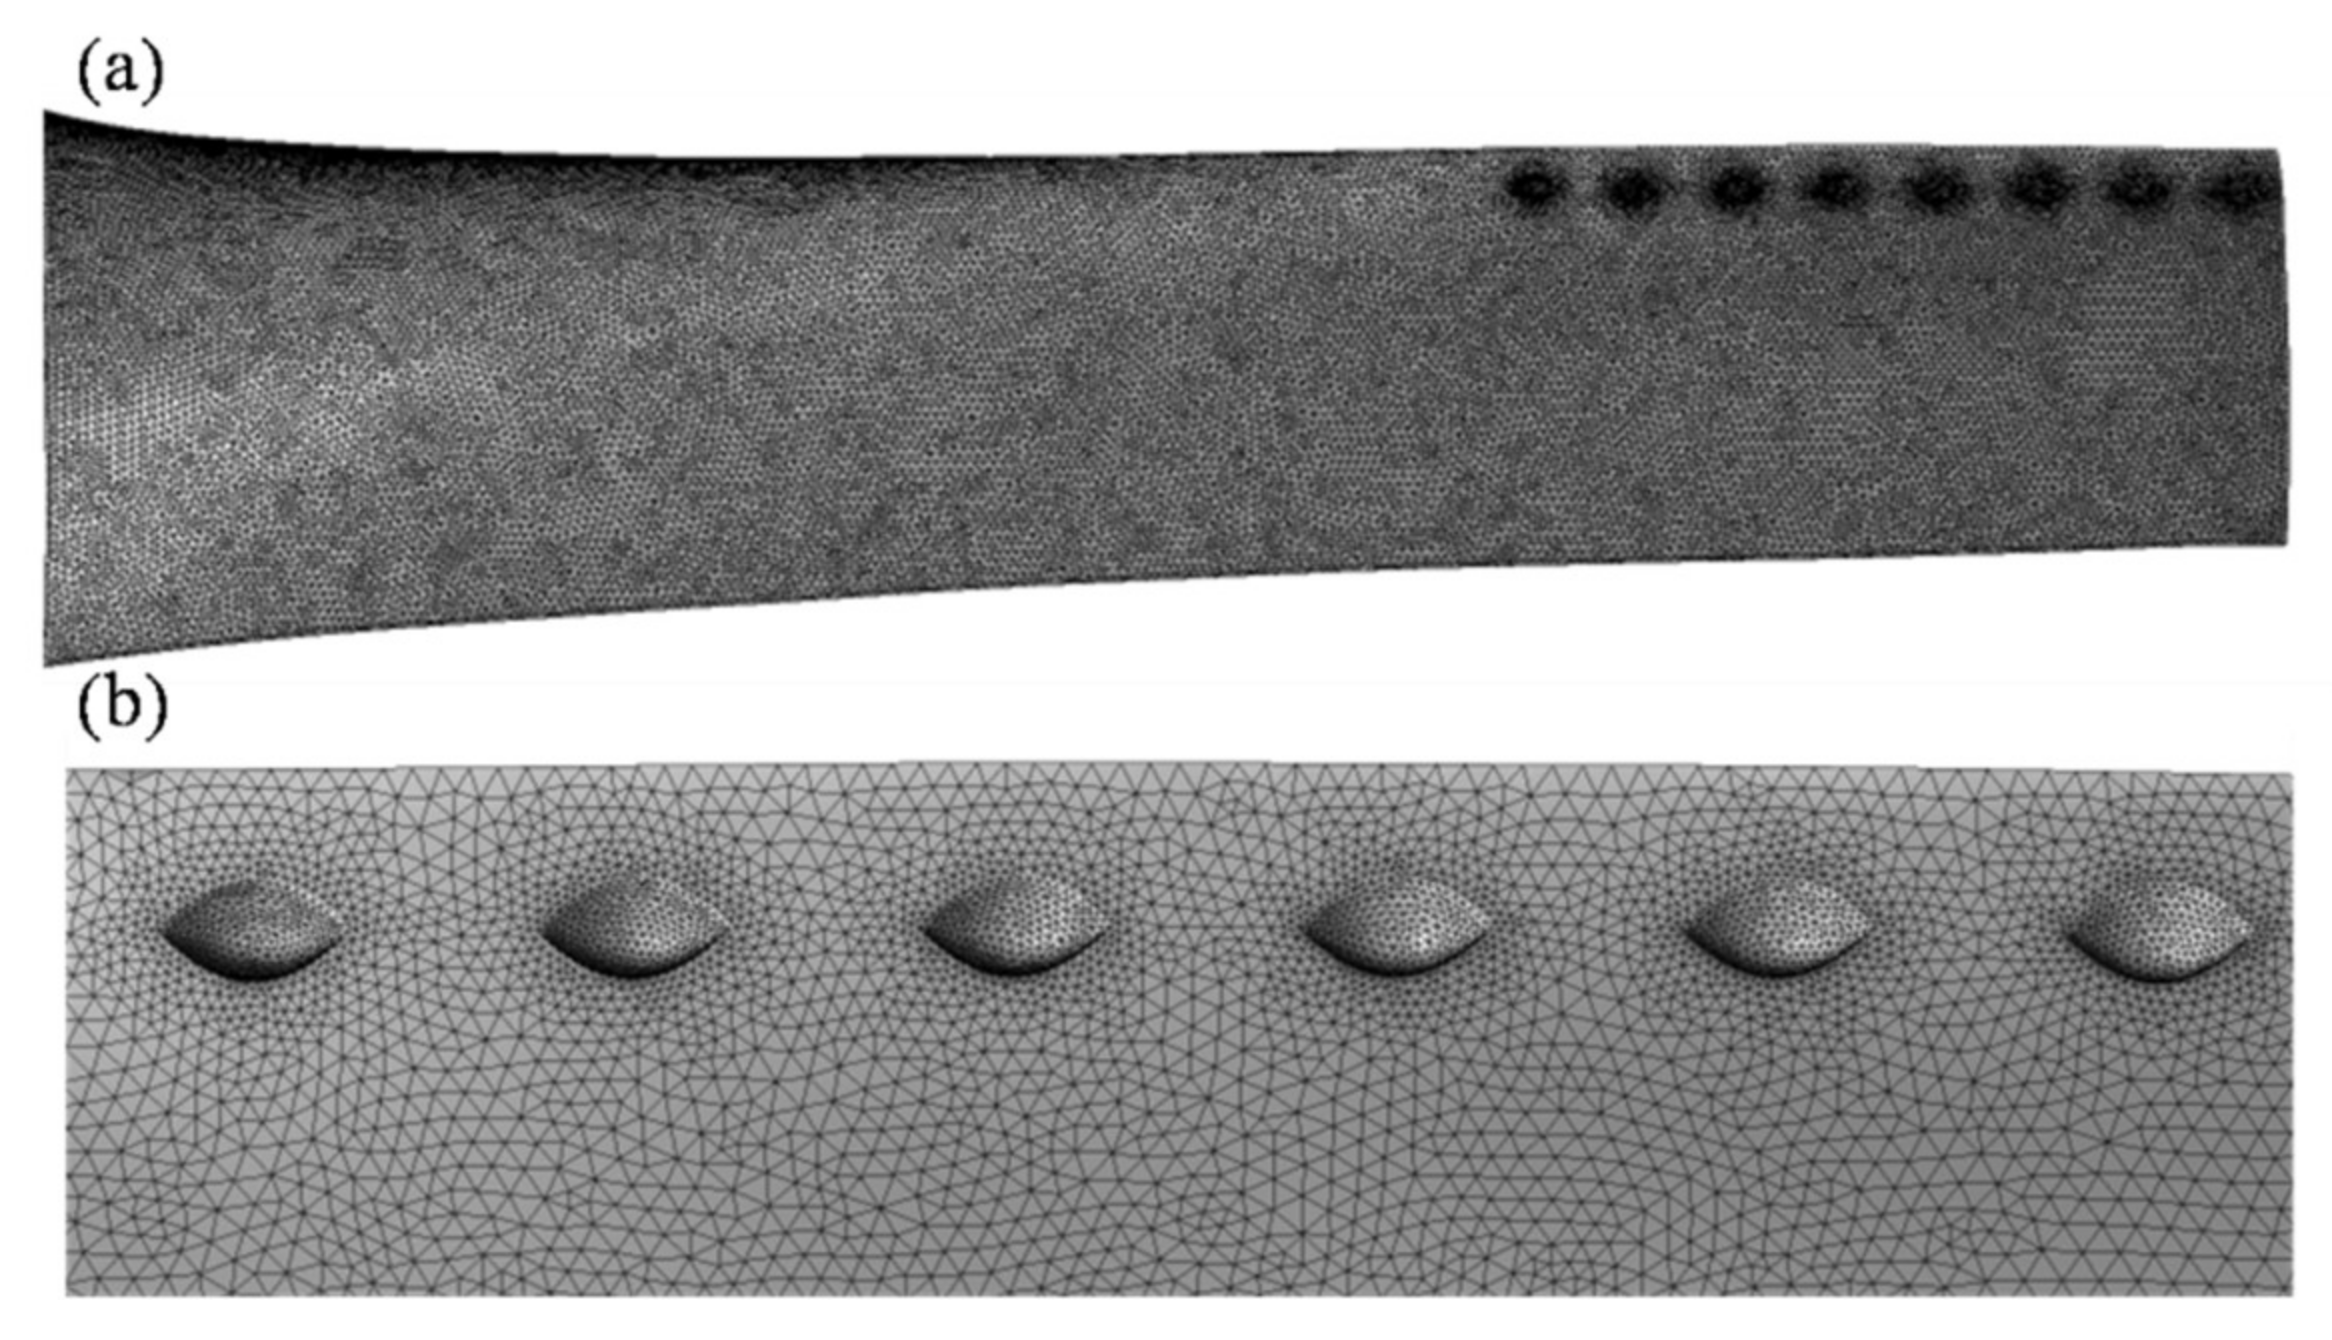
The fluid domain was discretized by the automatic mesh generation method using the mesh module in ANSYS Workbench. An example of the surface mesh on the steam turbine low-pressure blade and around the tubercles is shown in Figure 4. The encryption was performed near the blade surface, tubercles, leading edge, and trailing edge with a y+≤1 prism layer mesh. There, different mesh densities were used for the check of mesh sensitivity, as shown in Table 3. The results of the blade axial torque at three different mesh levels are listed in Figure 5. After the grid independence validation, the final number of grid cells was 2.35 million.
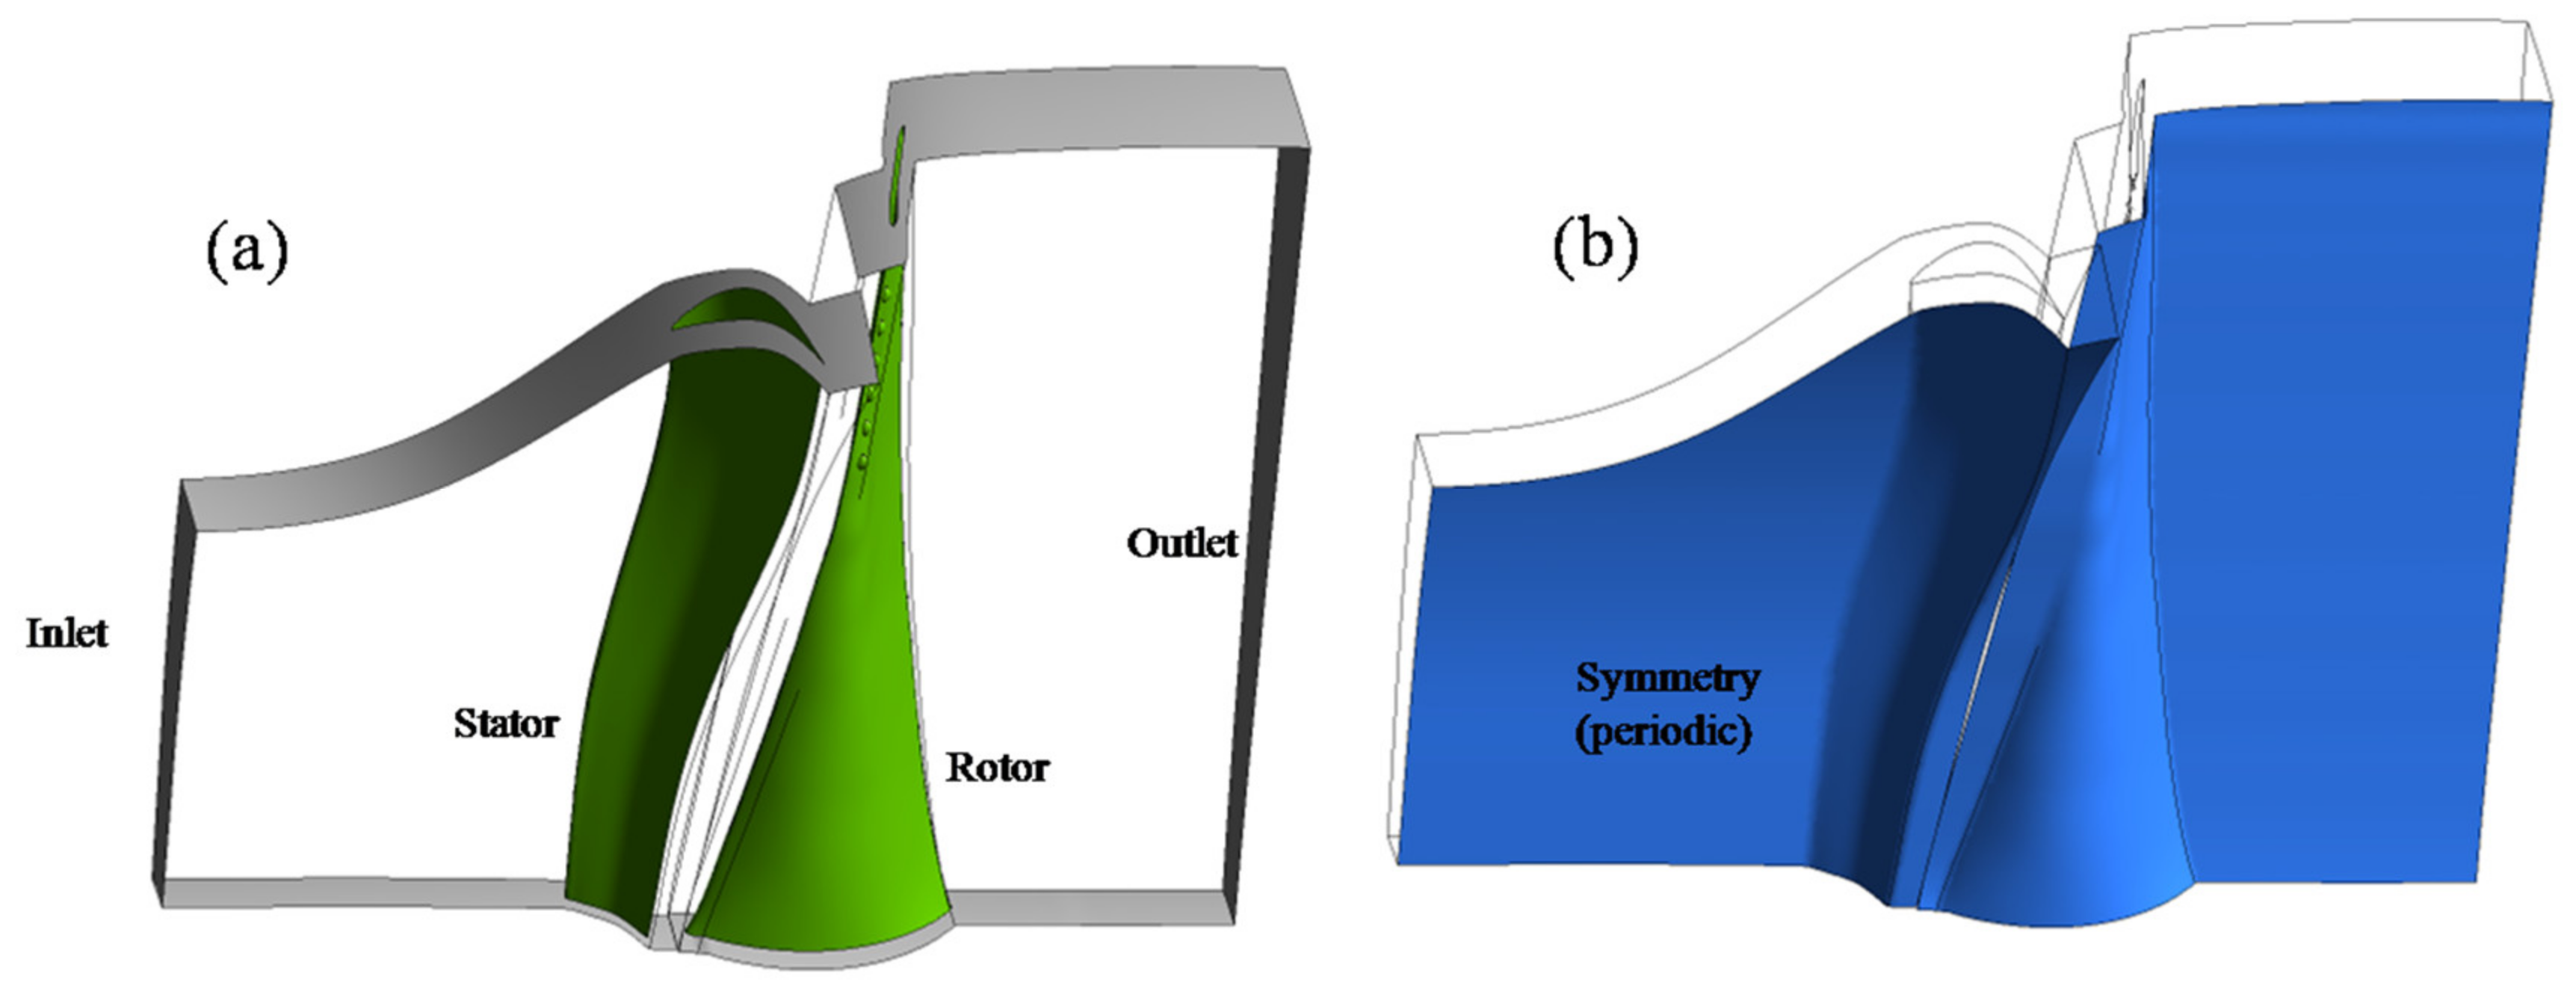
The fluid domain is illustrated in Figure 6. As the turbine blades were arranged in a circle around the rotation axis, the flow domain had the characteristics of rotation periodicity. In order to reduce the calculation resources, this paper used only one stator blade and moving blade as the fluid computing domain. When the flow crossed the interface, there was a frame of reference change or an area change. In the present paper, according to the pitch ratios, the mixing plane approach was used. In simulations, the inlet boundary condition was an axial inflow with the mass flow rate, and an average static pressure was used for the outlet boundary condition. The baseline and each tubercle configuration of steam turbine low-pressure last stage blade were simulated at two operating conditions, as shown in Table 4.
For the purpose of verifying the accuracy of the numerical model used in this paper to simulate the flow field of the low-pressure last stage of the steam turbine under a low load, this paper took the blade in reference[22] as the validation geometry, and the schematic diagram of the blade is shown in Figure 7a. It was a low-pressure last stage blade of a 200 MW steam turbine with a chord length of 173.97 mm, a blade pitch of 91.74mm, and an installation angle of 51.44 degrees, and the experimental boundary conditions corresponded to 60–70% rated power corresponding 120–140 MW. Twenty measurement points were arranged on the pressure and suction surface of the blade to measure the static pressure distribution on the blade surface.
Figure 7b compares the static pressure distribution on the surface of the verified turbine blade between the experiment and simulation. As can be seen from Figure 6b, the simulated pressure agrees well with the experimentally measured static pressure. The numerical model presented in this paper can well simulate the pressure distribution on the blade surface under non-design conditions.

3. Results and Discussion

In the present work, nine modification steam turbine low-pressure last blades with tubercles and the baseline geometry were simulated by a three-dimensional CFD analysis. Each of the modified blades was characterized by wavelength, amplitude, position, and thickness values defined by OTM. The results in terms of the blade axial torque of the nine modified tests were compared with the baseline value, and a physical explanation of the mechanism was given by looking at the flow characteristics around the bionic tubercles.

3.1. Blade Axial Torque

In order to better visualize the evolution in the blade axial torque given by bionic tubercles under different mass flow rate conditions, the non-dimensional blade axial torque was generated as follows:
Δ T ¯ i = T i T b T b ,
which is the difference between the OTM test blade axial torque and the baseline value at the same mass flow rate condition normalized by the original blade axial torque.
Table 5 shows the non-dimensional blade axial torque comparison between the nine modified blades with bionic tubercles and the original blade. As illustrated in Table 4, from the calculated blade axial torques of the nine different modified blades with bionic tubercles, these all have a visible positive effect on the blade axial torque at case 2. The maximum effect could increase the output torque by 33.32%. Thus, as the mass flow rate decreased, the corresponding flow rate was reduced when the blade axial torque of the turbine last stage became negative, demonstrating that those tubercles could effectively delay the turbine from entering the windage conditions, thereby improving the working capacity of the turbine unit.
For all nine tests, the blade axial torque of the last stage blade with tubercles also slightly increased correspondingly at case 1 when compared with the increment of the blade axial torque at case 2 and case 1. Test 3 achieved a maximum increase of output torque at33.32% for case 2, while the effect of the increase was the worst for case 1, only 0.90%, and the tendency seemed to reverse at test 1. Therefore, for this kind of steam turbine last stage tubercle modification, if the tubercles greatly improved the working capacity at low load, this may sacrifice the working capacity under the design conditions. Thus, when considering the specific bionic tubercle structure, the annual operating load of the turbine should be fully considered.
We now discuss the resulting non-dimensional blade axial torque of the nine tested blades with tubercles at case 2, since the bionic tubercles are supposed to can work even better under low load conditions. In order to study the influence of the four parameters of the bionic tubercles, including the wavelength, amplitude, position, and thickness on the output torque of the last stage blade, the blade axial torque of test 1, test 6, and test 7, corresponding to level 1 (1.09%) of the wavelength, has been added to calculate the average value. Similarly, the average value of different parameters at different levels can be calculated. The discrepancy between the average values could be considered as the effect of different parameters on the blade axial torque at different levels. In addition, the results revealed the effect of each level selected by the factor on the axial torque by comparing the magnitude of the R. The greater the R, the greater the change in the level of a factor and the greater effect on the axial shaft torque. The analysis results are illustrated in Table 6.
From Table 6, the amplitude of the tubercle had the largest influence on the blade axial torque of the turbine blade and the minimum thickness. Therefore, the amplitude of the bionic tubercle can be increased appropriately, and the thickness can be reduced appropriately. Moreover, within the parameter range of this study, if the wavelength, amplitude, and position of the tubercle increased, the blade axial torque value increased gradually, and as the thickness of the tubercle increased, its value decreased gradually. Within the scope of this study, the optimal tubercle parameters were when the wavelength was 2.19%, the amplitude was 0.77%, the position was 10%, and the thickness was 3%, which was when the blade axial torque could reach the maximum value.

3.2. Physical Mechanism Analysis

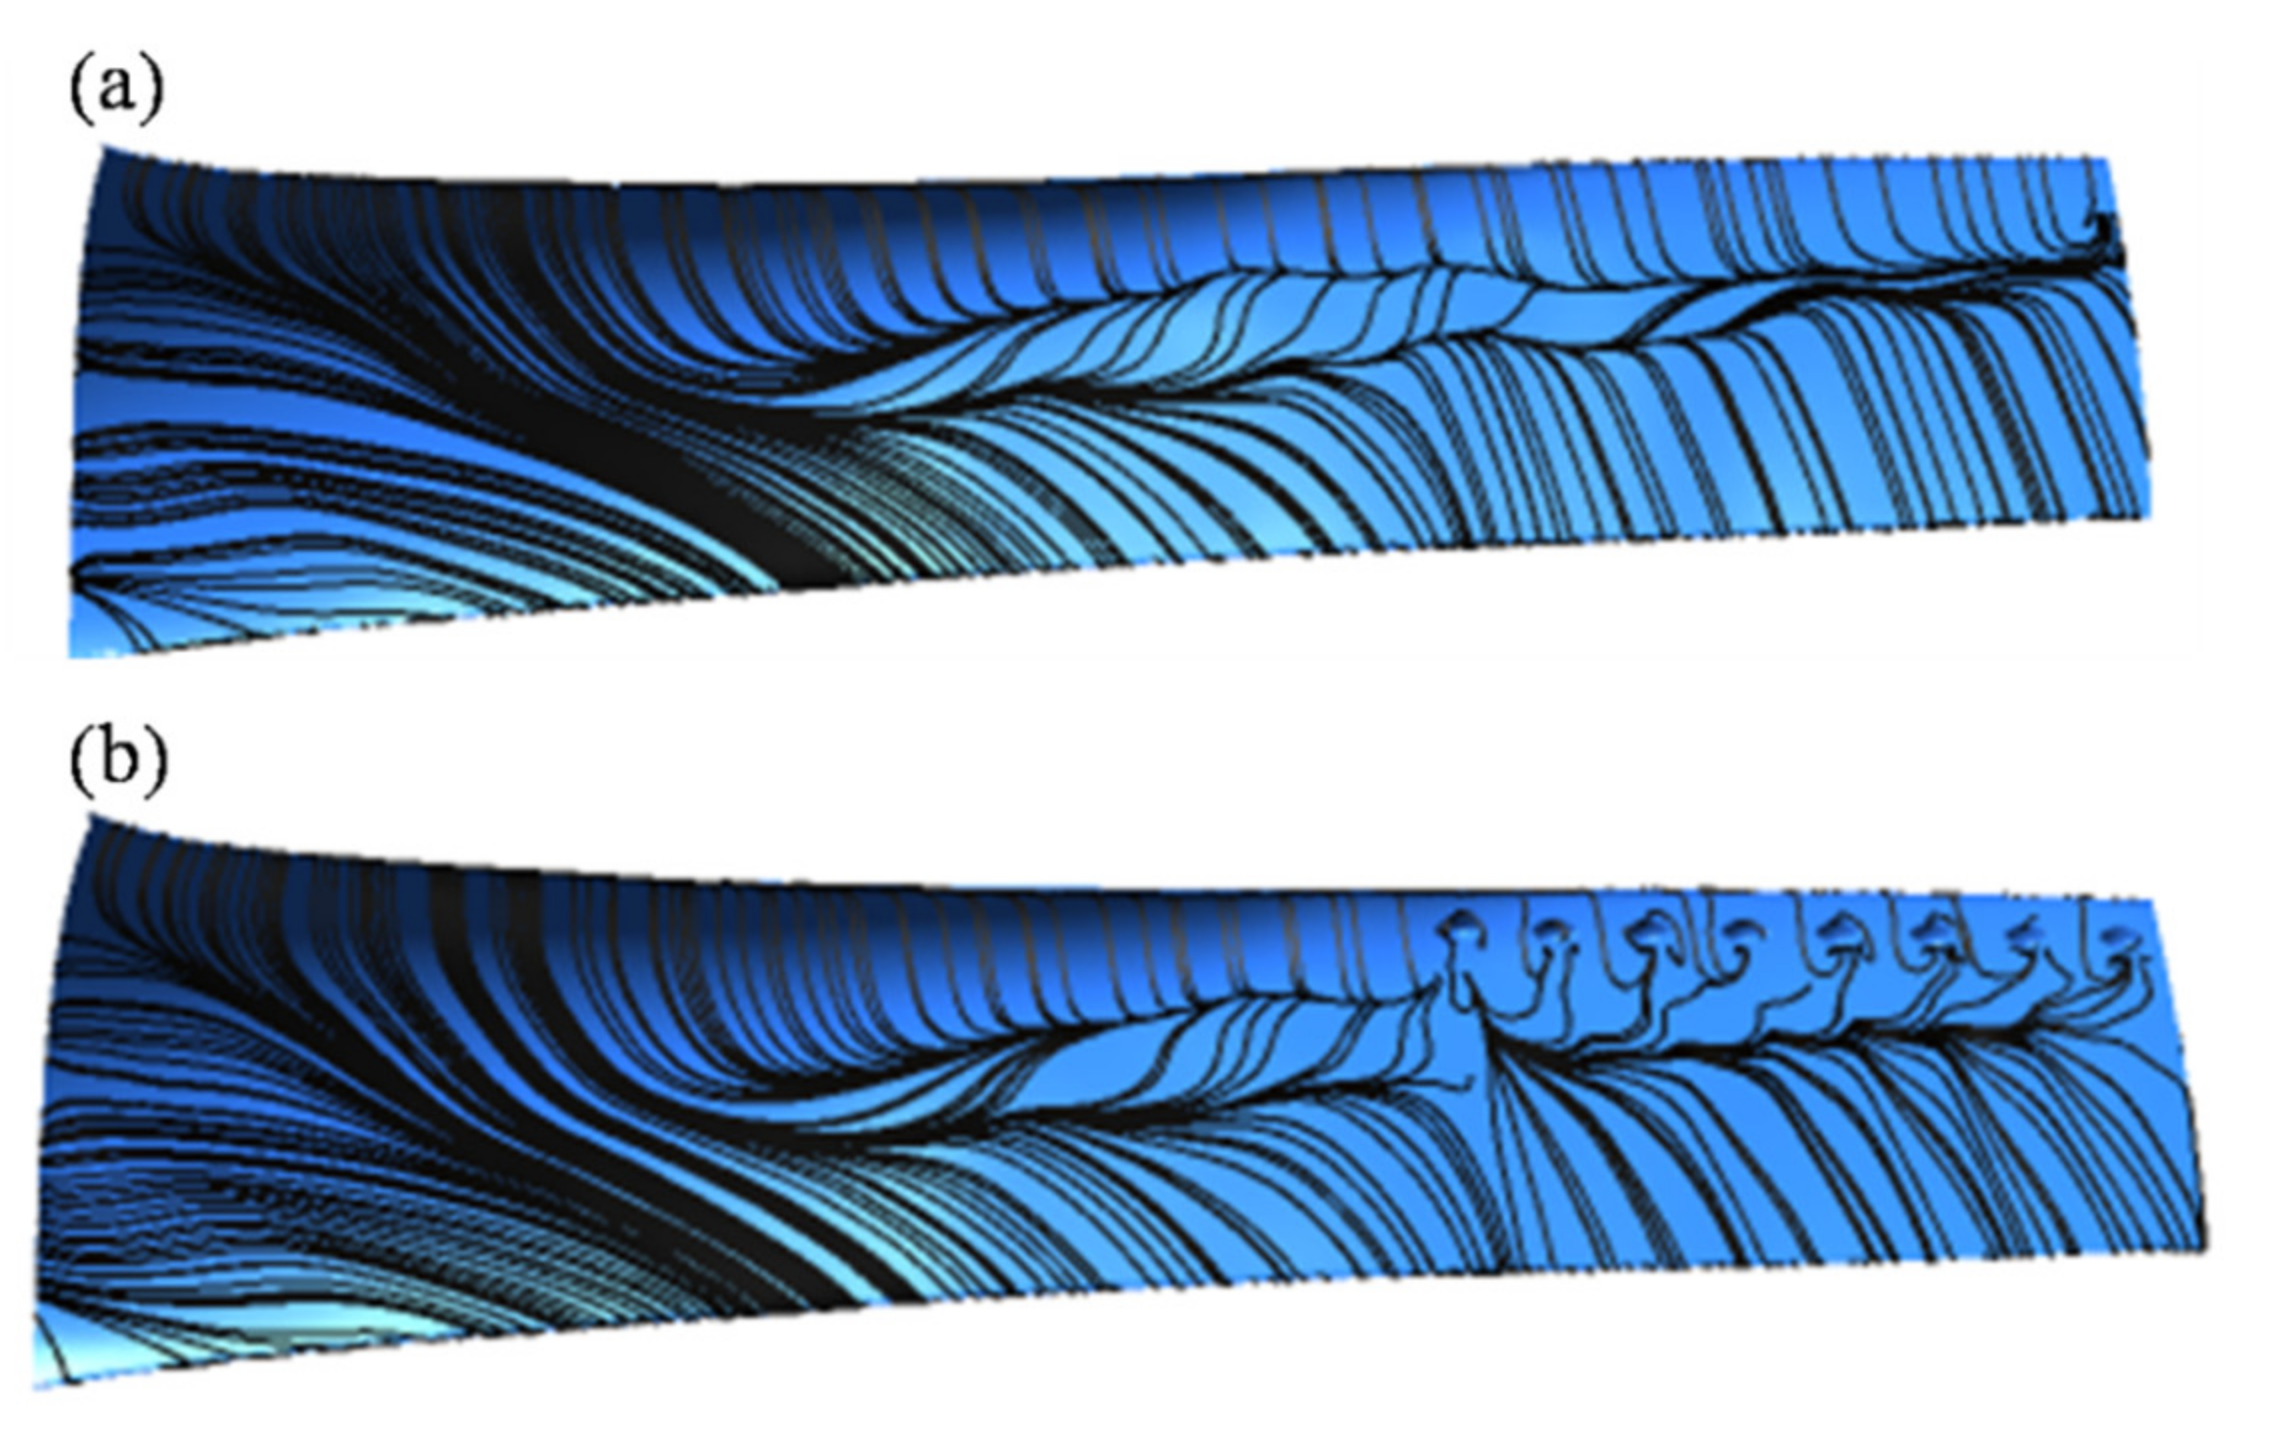
Next, we analyzed the flow characteristics of the best tubercle configuration (test 3) to reveal the physical mechanism. Figure 8 is a schematic diagram of the limiting streamlines on the surface of the original blade and modified blade with bionic tubercles. As shown in this figure, under low load conditions, there was a large radial flow in the low-pressure last stage of the steam turbine. The steam at the blade root was affected by the backflow and flowed in the direction of the spanwise to discharge the last stage domain. The radial speed made the blade surface limiting streamlines develop at the root of the blade along the direction of the spanwise, which is why the present article considered putting the bionic tubercle on the blade tip.
There were two obvious reattachment lines above the middle part of the blade, and the distance between the two reattachment lines was larger in the middle span, which means that there was a larger separation vortex. Comparing the limiting streamlines of the baseline with a modified blade after the bionic tubercles were set on the suction side, there was a strong disturbing effect on the side, and small turbulent vortices were formed around the tubercles, which could strengthen the energy exchange between the mainstream and the pressure side boundary layer. The tubercles also shortened the distance between the two reattachment lines on the blade, which means that they could reduce the separation vortex in the flow channel to a certain extent.
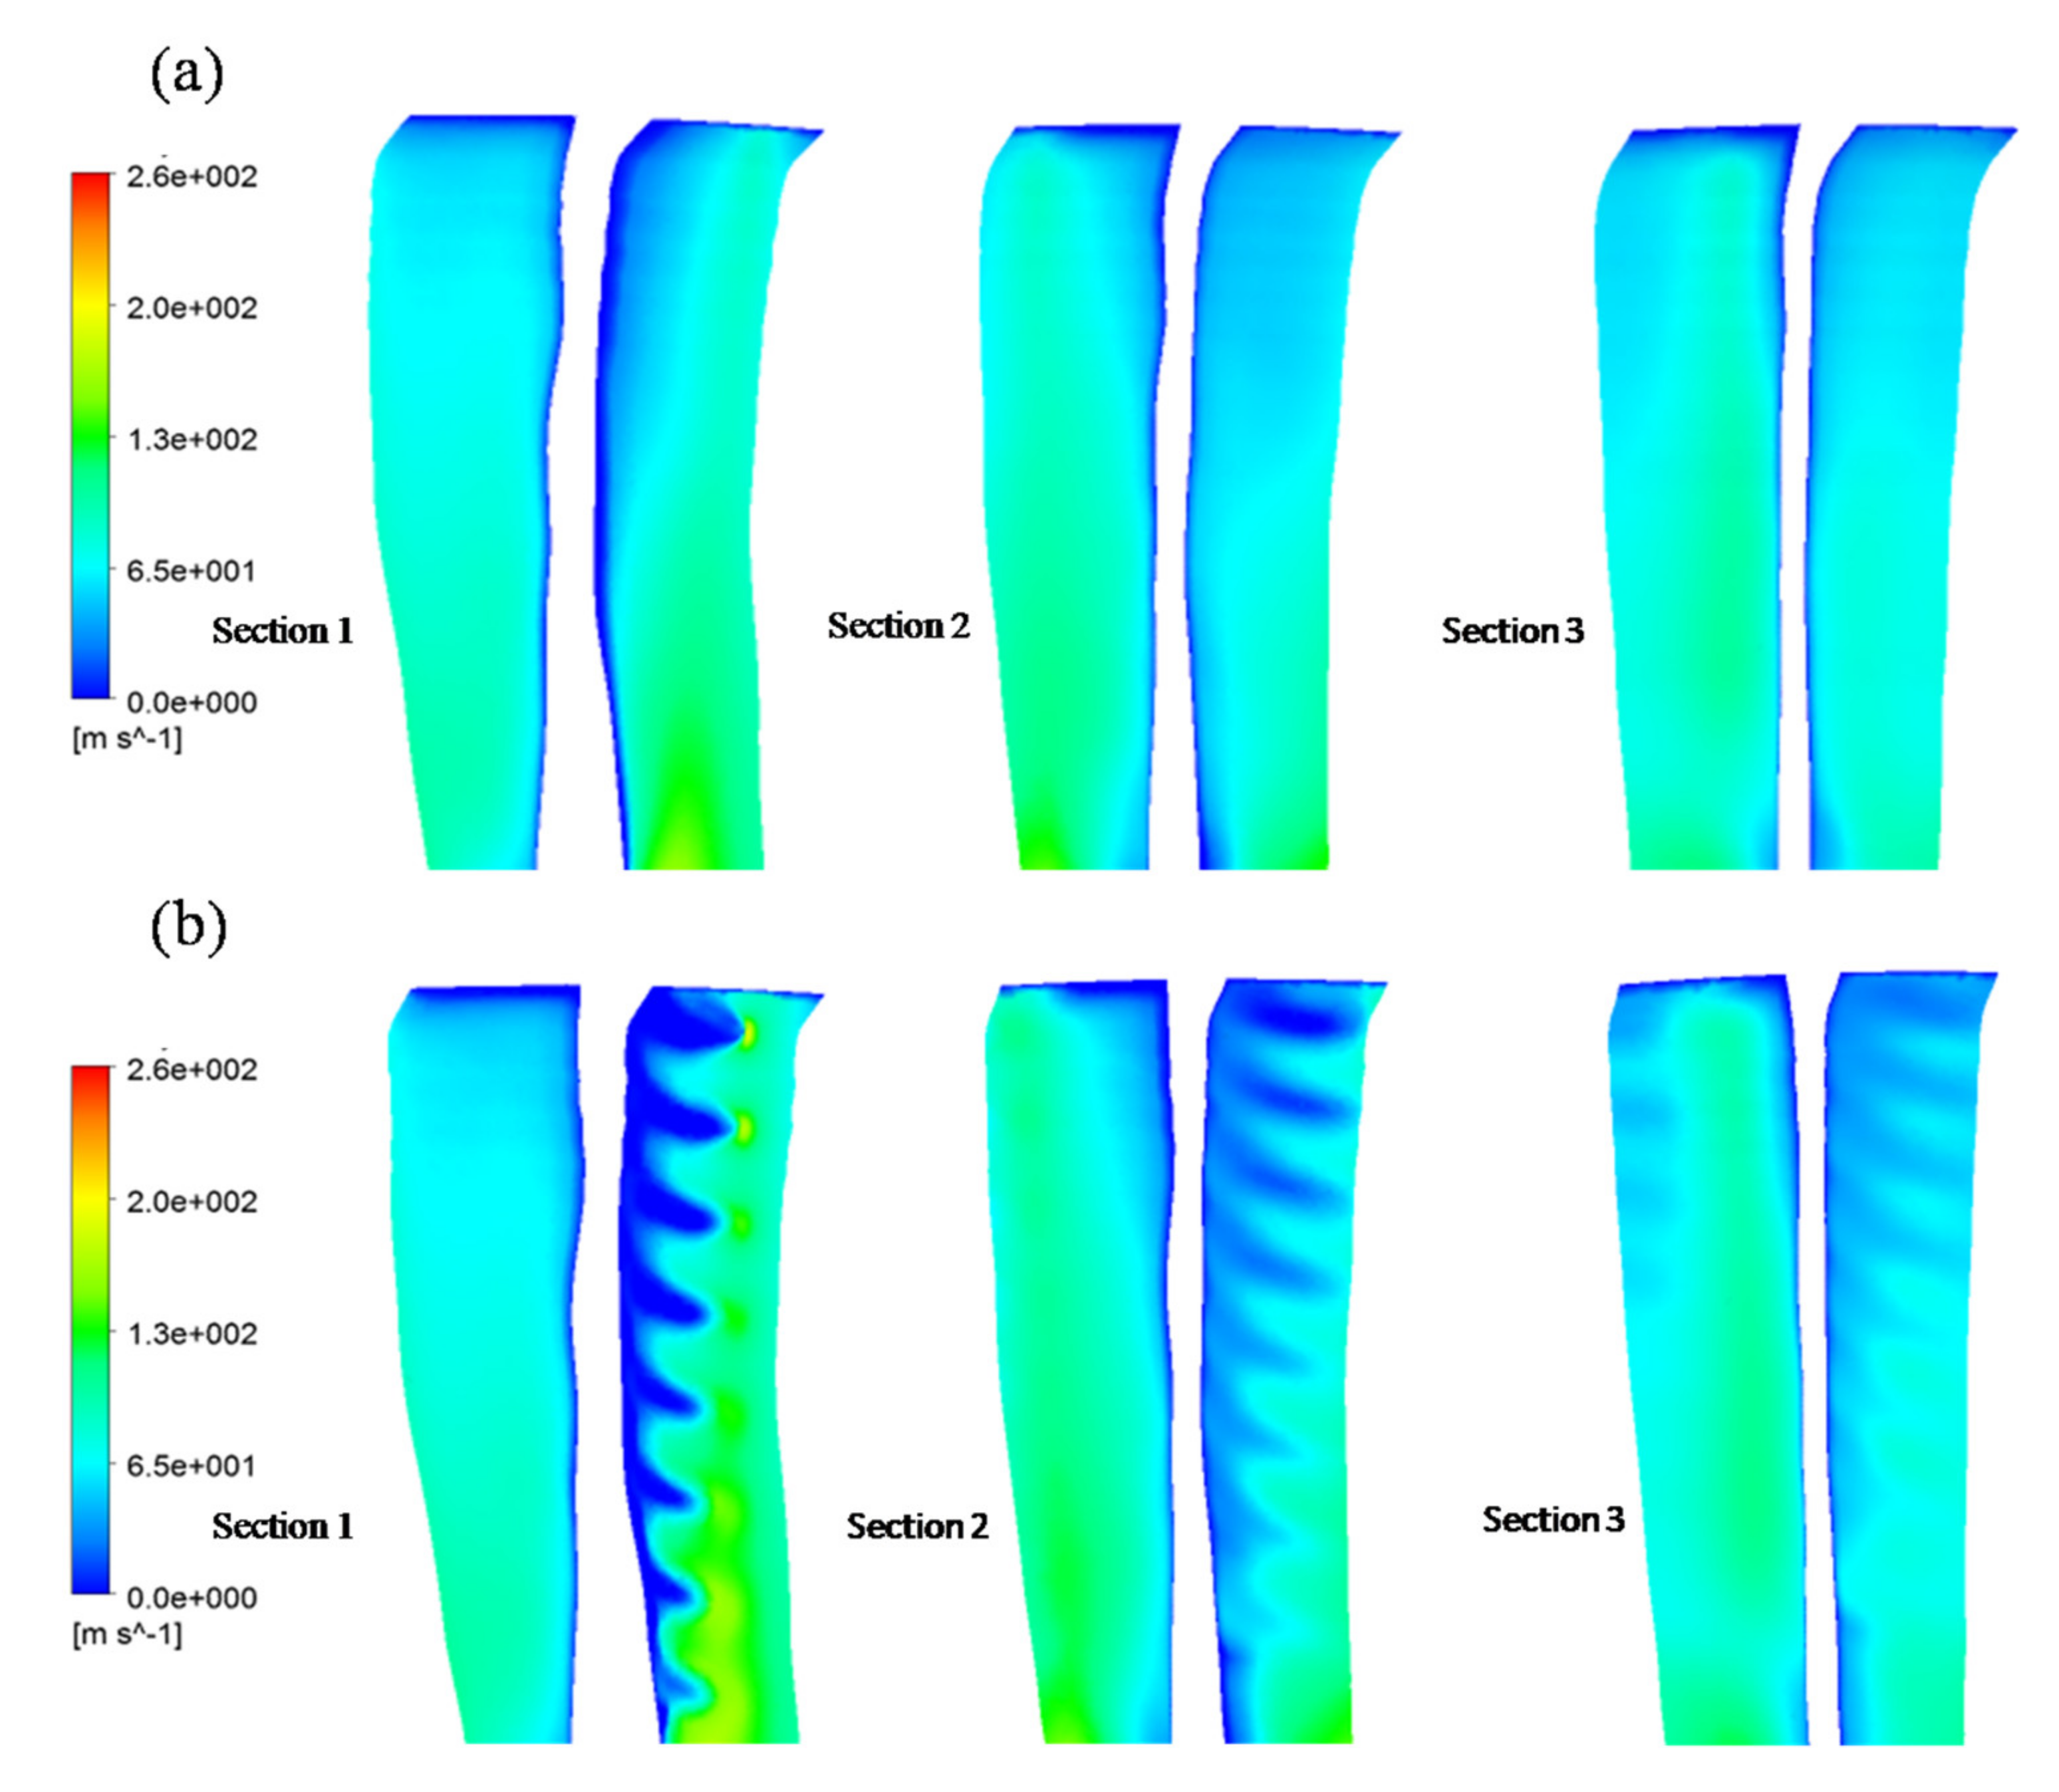
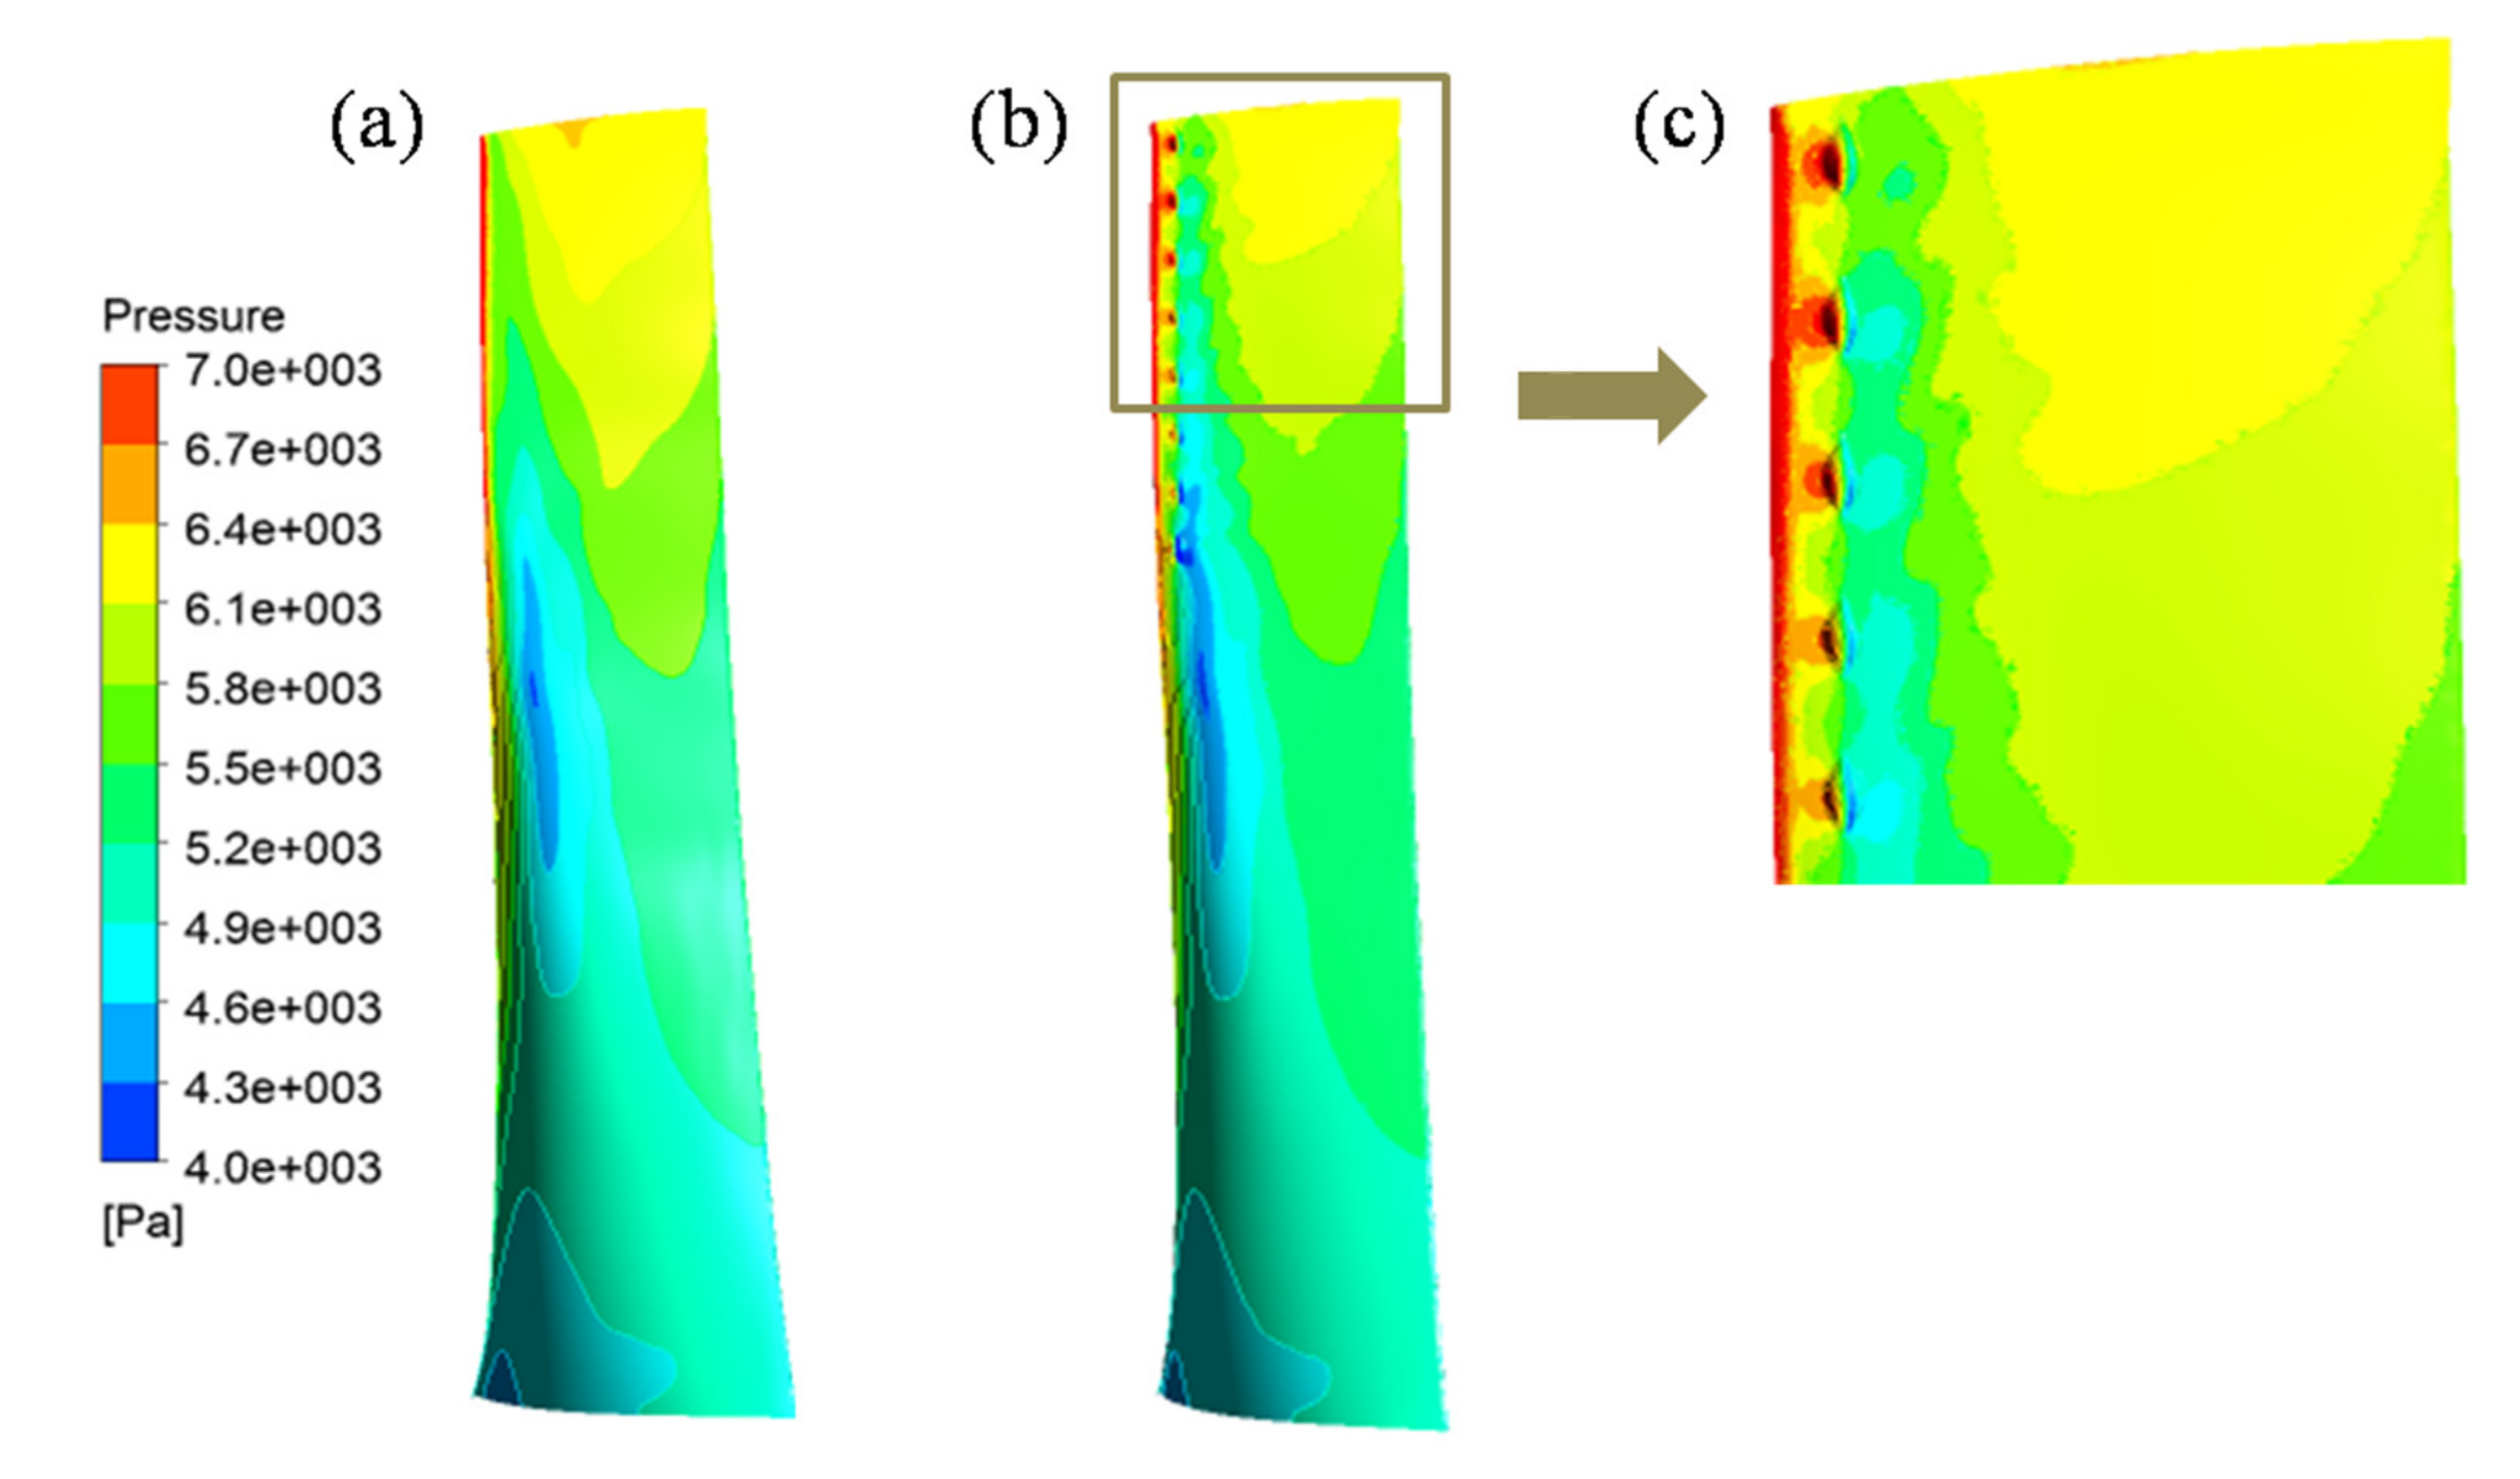
For the purpose of analyzing the development of turbulent vortices formed by bionic tubercles, the present paper analyzed the axial velocity distribution on different streamwise sections, which are shown in Figure 9, and cloud plots of the axial velocity distribution are illustrated in Figure 10. As shown in the figure, the flow field in the rotor cascade was changed by the turbulent vortices, which formed on the upper and lower sides of the bionic tubercle. The axial velocity component of the fluid in the boundary layer was reduced accordingly for low-energy fluids converging here, while high-energy fluids in the mainstream supplemented the two sides of the tubercle by the suction effect of the turbulent vortices. Looking at the static pressure distribution comparison (Figure 11), the accumulation of low-energy fluid in the turbulent vortex reduced the pressure on the suction side surface relative to the regular, and the reduced pressure propagated toward the trailing edge of the blade at a tubercle wavelength. The decrease in pressure increased the axial torque of the blades and the output power of the steam turbine.
On the other hand, the existence of turbulent vortices squeezed the mainstream fluid and moved the mainstream to the pressure side of the blade, thereby increasing the energy exchange between the mainstream and the pressure side boundary layer. Therefore, there was less low-energy fluid on the pressure side, which increased the axial velocity of the fluid near the pressure side. In the streamwise direction, the turbulent vortex generated by the bionic tubercle structure gradually developed toward the center of the flow domain, and its intensity gradually decreased.
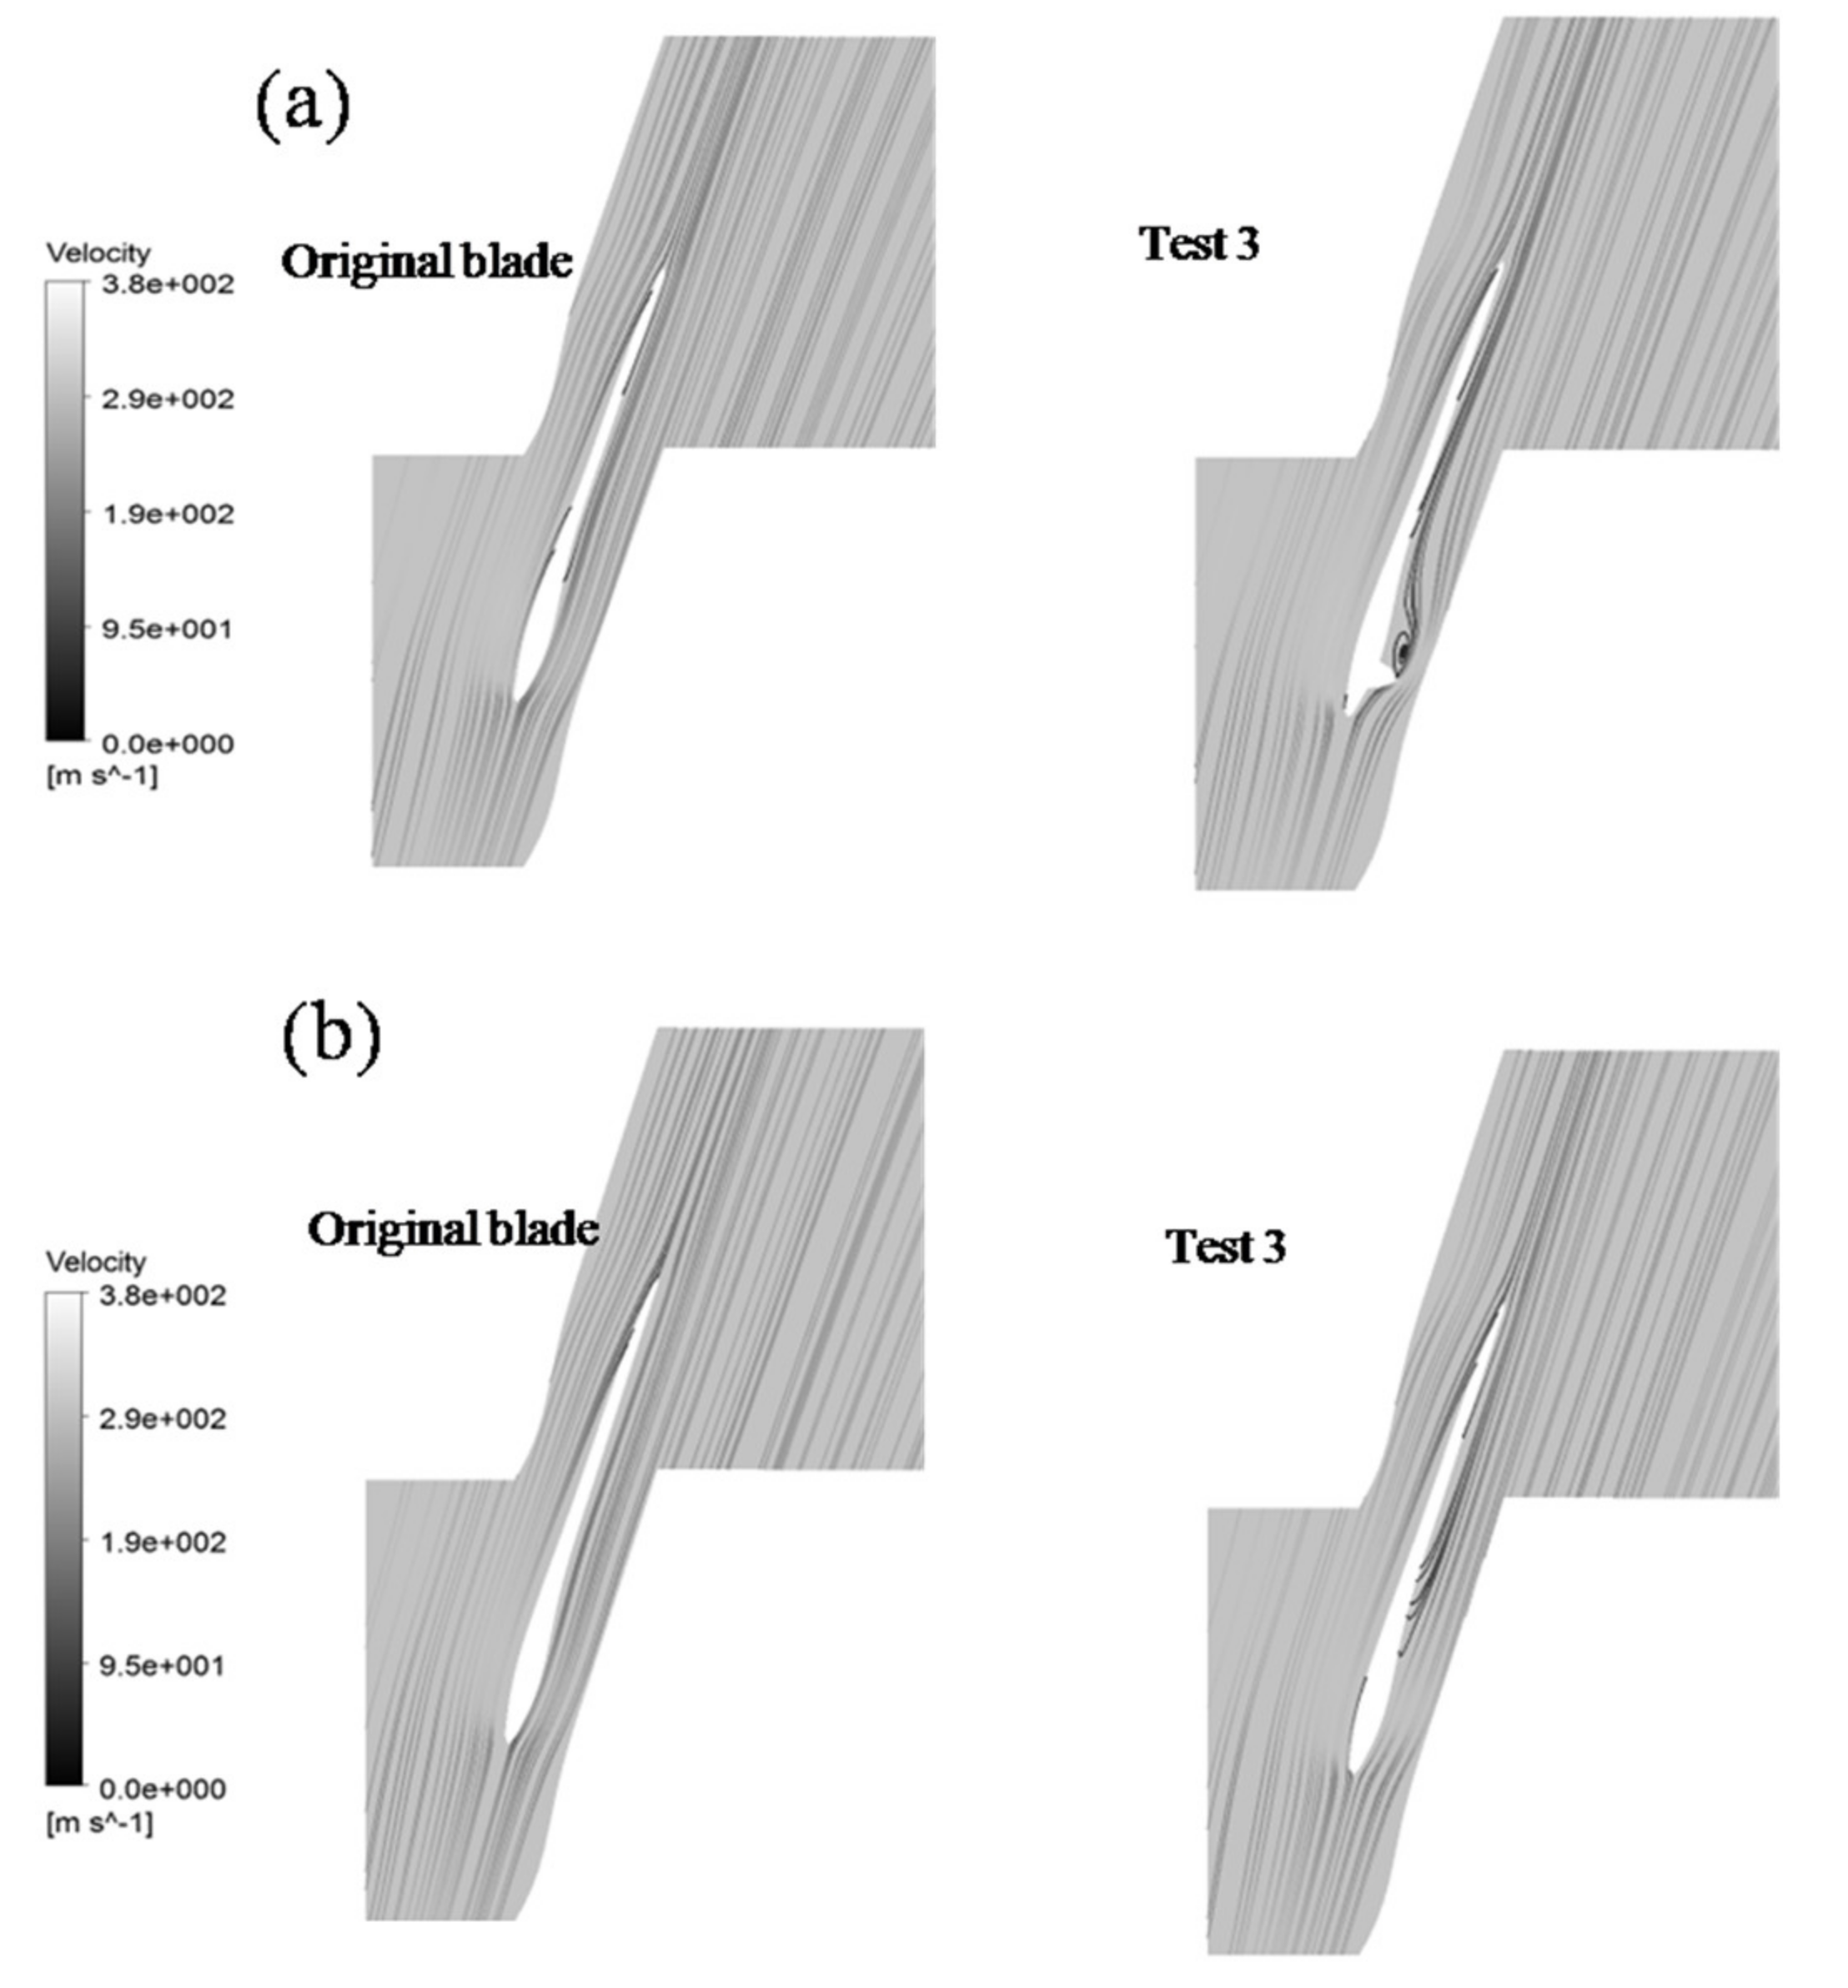
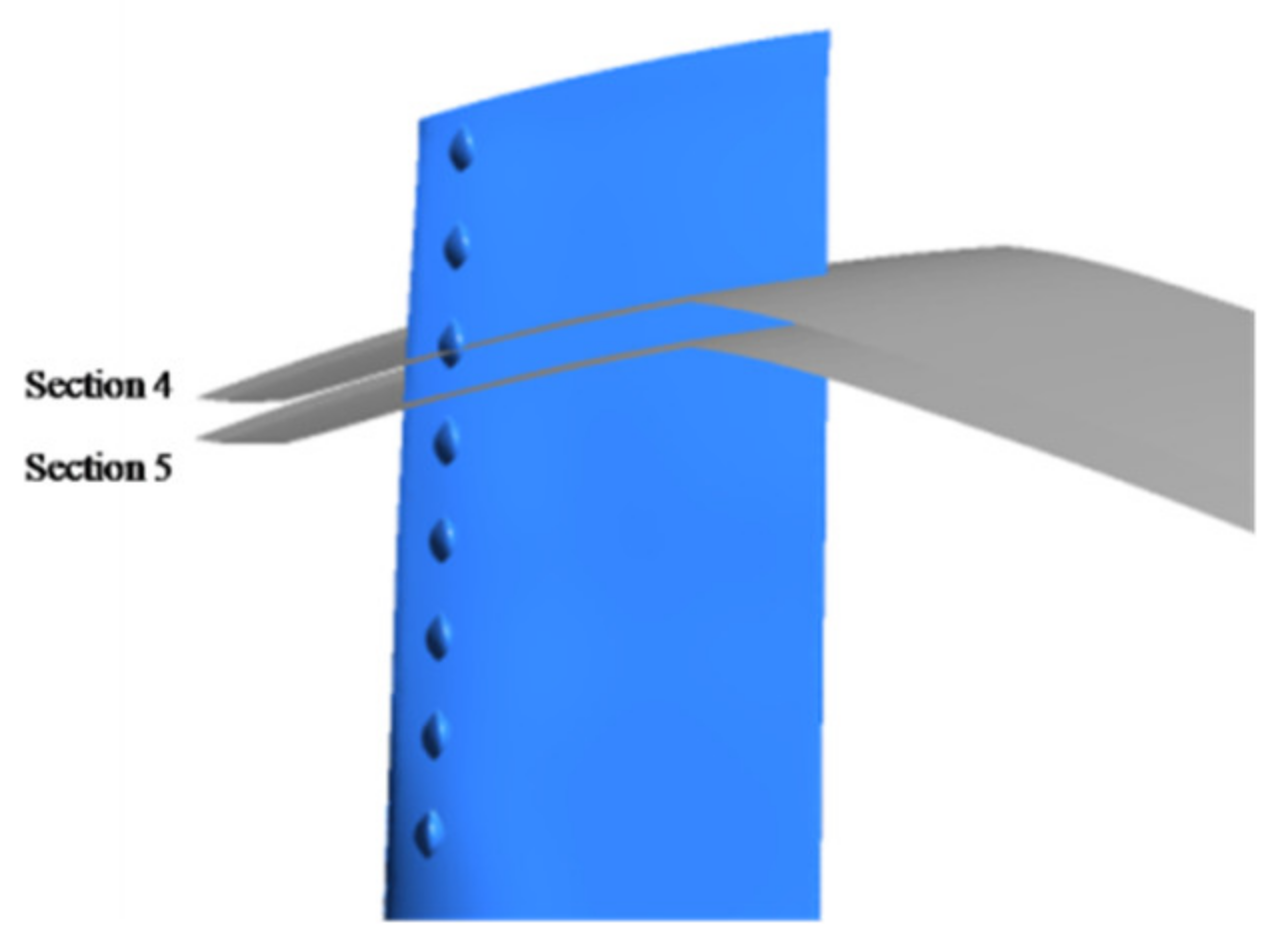
The surface streamline distribution of the original type and the modified blade with bionic tubercles on 89.5% and 87.5% spanwise sections are reported in Figure 12 where 89.5% of the span corresponded to the tubercle position, while 87.5% of the span was located between two adjacent tubercles, As shown in Figure 13.
At 89.5% of the spanwise section, compared with the original blade, the modified blade formed a convergence of low-energy fluid after the tubercles, which developed from the boundary layer and then squeezed the mainstream. At 87.5% of the span, the flow boundary layer of the suction blade surface was thicker than the regular one affected by the two adjacent tubercles above and below, and this also squeezed the mainstream flow, enhancing the energy exchange between the mainstream and the separation vortex. Therefore, the larger the amplitude of the bionic tubercle, the more obvious the squeeze effect on the mainstream, which explained that the amplitude was the most important factor affecting the blade axial torque. The existence of the tubercles is similar to a kind of vortex generator passively controlling the flow.

4. Conclusions

For the purpose of increasing the power production of the steam turbine low-pressure last stage at low load conditions, the present work modified the baseline to analyze different tubercle configurations in terms of the wavelength, amplitude, position, and thickness applied to the suction side of the original blade. Nine different cases were generated by OTM, and then they were numerically simulated by 3D computational fluid dynamic analysis considering two different mass flow rate conditions: 100% Gm and 40% Gm. The results, in terms of the blade axial torque of tubercle configurations, were compared with the original blade. Our conclusions are as follows:
  • An obvious improvement in the blade axial torque for all cases tested at both mass flow rate conditions was noted, and the optimal modified blade could increase this by 33.32%, which demonstrated that tubercles could effectively delay the turbine from entering the windage conditions. The amplitude of the tubercle had the largest influence on the axial torque of the turbine blade.
  • The further increase of the blade axial torque under low load conditions led to the decrease of the design mass flow rate. Therefore, the annual operating load of the turbine should be fully considered when considering the use of specific bionic raised structures. Within the scope of this study, the optimal tubercle parameters were: wavelength at 2.19%, amplitude at 0.77%, position at10%, and thickness at 3%.
  • The flow characteristics around bionic tubercles revealed that the mechanism of the blade with bionic tubercles increased the blade output power as that the tubercle acted like a vortex generator causing turbulent vortices, which decreased the static pressure on the suction side surface and promoted the energy exchange between the mainstream and boundary layer of the pressure side.
In the present paper, we changed the size of all bionic tubercles at the same time when we generated a specific configuration. However, since it was observed that the tubercles on whale’s flippers have uneven distribution characteristics, an interesting future study will need to consider different sized tubercles along the spanwise to analyze the performance effect on a steam turbine as a continuation of our present work.

Author Contributions

Z.J. wrote the original draft and supervised the overall active; F.W. and C.W. contributed to writing of the draft and data analysis; Z.M. carried out the validation and contributed co-supervised the overall activities; A.H. carried out Orthogonal Test and data analysis; D.M. contributed the drafting review and editing. All authors have read and agreed to the published version of the manuscript.

Funding

This research was funded by the National Natural Science Foundation of China, grant number 51776142.

Conflicts of Interest

There is no conflict of interest for all authors.

References

  1. Guoping, C.; Mingjie, L.; Tao, X. Research on the technological bottleneck of new energy development. Proc. Chin. Soc. Electr. Eng. 2017, 37, 20–26. [Google Scholar]
  2. Megerle, B. Unsteady aerodynamics of low-pressure steam turbines operating under low volume flow conditions. Trans. Am. Soc. Mech. Eng. J. Turbomach. 2014, 136, V05BT25A034. [Google Scholar]
  3. Fish, F.E.; Battle, J.M. Hydrodynamic Design of the Humpback Whale Flipper. J. Morphol. 1995, 225, 51–60. [Google Scholar] [CrossRef] [PubMed]
  4. Miklosovic, D.S.; Murray, M.M.; Howle, L.E.; Fish, F.E. Leading Edge Tubercles Delay Stall on Humpback Whale Flippers. Phys. Fluids 2004, 16, 39–42. [Google Scholar] [CrossRef] [Green Version]
  5. WATTSP; FISHF. The influence of passive, leading edge tubercles on wing performance. In Proceedings of the Twelfth International Symposium on Unmanned Untethered Submersible Technology 2001 Auton. Undersea Syst. Inst., Durham NH, USA, 21–24 August 2001. [Google Scholar]
  6. Vannierope, A.; Albens, B.P. How bumps on whale flippers delay stall: An aerodynamic model. Phys. Rev. Lett. 2008, 100, 054502. [Google Scholar]
  7. Hasheminejad, S.M.; Mitsudharmadi, H.; Winoto, S.H.; Lua, K.B.; Low, H.T. Streamwise counter-rotating vortices generated by triangular leading edge pattern in flat plate boundary layer. J. Vis. 2016, 19, 359–367. [Google Scholar] [CrossRef] [Green Version]
  8. Post, M.L.; Decker, R.; Sapell, A.R.; Hart, J.S. Effect of bio-inspired sinusoidal leading-edges on wings. Aerosp. Sci. Technol. 2018, 81, 128–140. [Google Scholar] [CrossRef]
  9. Giada, A.; Mavris, D.N.; Sankar, L.N. Performance Effects of Leading Edge Tubercles on the NREL Phase VI Wind Turbine Blade. J. Energy Resour. Technol. 2019, 141, 051206. [Google Scholar]
  10. Johari, H.; Henoch, C.; Custodio, D.; Levshin, A. Effects of leading-edge protuberances on airfoil performance. Aiaa J. 2007, 45, 2634–2642. [Google Scholar] [CrossRef]
  11. Arai, H.; Doi, Y.; Nakashima, T.; Mutsuda, H. Study on Stall Delay by Various Wavy Leading Edges. J. Aero Aqua Bio-Mech. 2010, 1, 18–23. [Google Scholar] [CrossRef] [Green Version]
  12. Julien, F.; Alfredo, P.; Ugo, P. Control of the separated flow around an airfoil using a wavy leading edge inspired by hump back whale flippers. ComptesRendusMécanique 2012, 340, 107–114. [Google Scholar]
  13. Zhang, M.M.; Wang, G.F.; Xu, J.Z. Experimental study of flow separation control on a low-Re airfoil using leading-edge protuberance method. Exp. Fluids 2014, 55, 1710. [Google Scholar] [CrossRef]
  14. Yoon, H.S.; Hung, P.A.; Jung, J.H.; Kim, M.C. Effect of the wavy leading edge on hydro dynamic characteristics for flow around low aspect ratio wing. Comput. Fluids 2011, 49, 276–289. [Google Scholar] [CrossRef]
  15. Zhang, R.-K.; Wu, V.D.J.-Z. Aerodynamic Characteristics of Wind Turbine Blades With a Sinusoidal Leading Edge. Wind Energy 2012, 15, 407–424. [Google Scholar] [CrossRef]
  16. Wang, Y.Y.; Hu, W.R.; Zhang, S.D. Performance of the bio-inspired leading edge protuberances on a static wing and a pitching wing. J. Hydrodyn. 2014, 26, 912–920. [Google Scholar] [CrossRef]
  17. Abate, G.; Mavris, D.N. CFD Analysis of Leading Edge Tubercle Effects on Wind Turbine Performance. AIAAPaperNo. 2017-4626. In Proceedings of the 15th International Energy Conversion Engineering Conference, Atlanta, GA, USA, 10–12 July 2017. [Google Scholar]
  18. Abate, G.; Mavris, D.N. Performance Analysis of Different Positions of Leading Edge Tubercles on a Wind Turbine Blade. AIAAPaperNo. 2018-1494. In Proceedings of the 15th International Energy Conversion Engineering Conference, Atlanta, GA, USA, 10–12 July 2017. [Google Scholar]
  19. Chen, T.; Xie, D.; Yang, C.; Zhang, H.; Xiong, Y.; Du, H. Application of Biologically Inspired Wavy Leading Edge in Nuclear Steam Turbine Cascade. Proc. Chin. Soc. Electr. Eng. 2018, 38. [Google Scholar]
  20. Fan, W.; Danmei, X.; Jing, Z.; Hengliang, Z.; Chun, W. Improvement of steam turbine blade foil with biomimetic design and its influence on aerodynamic performance. In Proceedings of the ASME Turbo Expo 2019: Turbine Technical Conference and Exposition, Phoenix, AZ, USA, 17–21 June 2019. [Google Scholar]
  21. Hand, M.; Simms, D.; Fingersh, L.; Jager, D.; Cotrell, J.; Schreck, S.; Larwood, S. Unsteady Aerodynamics Experiment Phase—VI: Wind Tunnel Test Configurations and Available Data Campaigns; Report No. NREL/TP-500-29955; National Renewable Energy Laboratory, Golden, CO.: Denver, CO, USA, 2001. [Google Scholar]
  22. Dykas, S.; Majkut, M.; Strozik, M.; Smołka, K. Experimental study of condensing steam flow in nozzles and linear blade cascade. Int. J. Heat Mass Transf. 2015, 80, 50–57. [Google Scholar] [CrossRef] [Green Version]
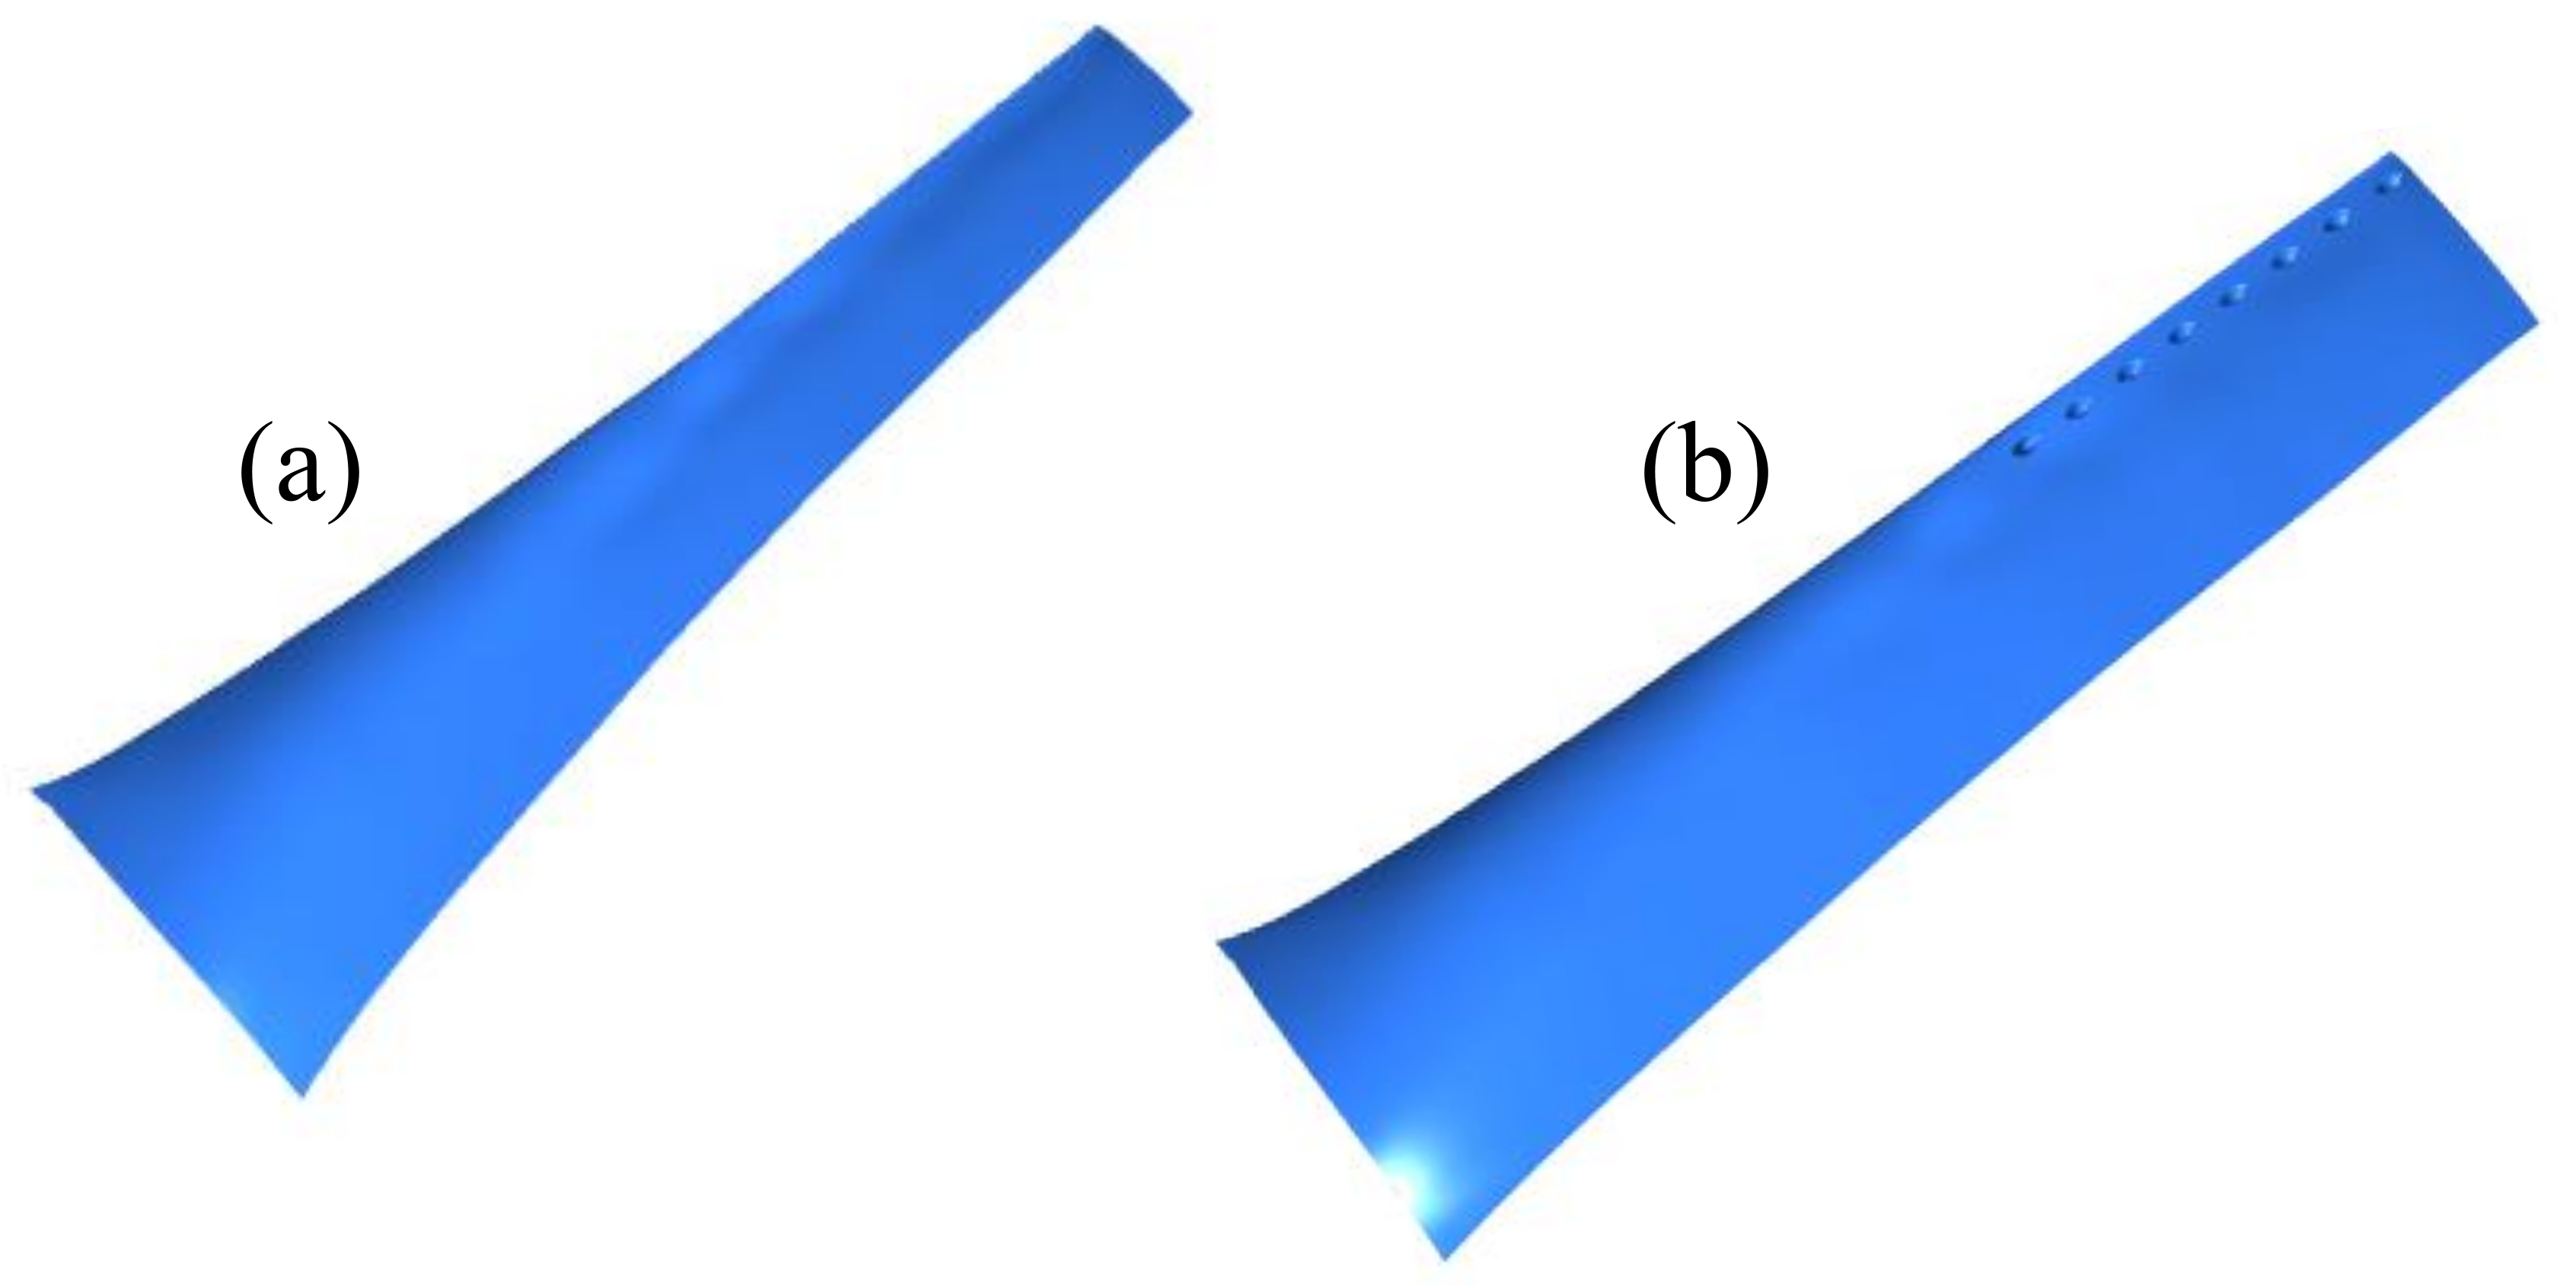
Figure 1. A CAD model of a steam turbine low-pressure last blade: (a) baseline geometry and (b) bionic tubercle configuration.
Energies 13 01889 g001
Figure 2. Blade with tubercles: (a) streamwise view and (b) spanwise view.
Energies 13 01889 g002
Figure 3. Schematic diagram of the orthogonal test method (OTM).
Energies 13 01889 g003
Figure 4. Surface mesh: (a) mesh on the blade and (b) mesh around the tubercles.
Energies 13 01889 g004
Figure 5. The relative blade axial torque at different mesh levels.
Energies 13 01889 g005
Figure 6. Fluid domain: (a) inlet, outlet, and wall, and (b) rotationally periodic.
Energies 13 01889 g006
Figure 7. Validation: (a) schematic diagram of the blade and (b) static pressure distribution on the blade surface.
Energies 13 01889 g007
Figure 8. Limiting streamlines on the suction side at case 2: (a) original blade and (b) test 3.
Energies 13 01889 g008
Figure 9. Schematic diagram of streamwise sections.
Energies 13 01889 g009
Figure 10. Cloud plots of axial velocity distribution on different sections at case 2: (a) original blade and (b) test 3.
Energies 13 01889 g010
Figure 11. Static pressure distribution of suction side: (a) original blade, (b) modified blade, and (c) enlarge image.
Energies 13 01889 g011
Figure 12. Surface streamlines distribution of the original blade (left) and test 3 (right) on (a) 89.5% and (b) 87.5% spanwise sections at case 2.
Energies 13 01889 g012
Figure 13. Schematic diagram of spanwise sections.
Energies 13 01889 g013
Table 1. OTM tests.
Table 1. OTM tests.
Test λ A P T
11111
22221
33331
43212
52132
61322
71233
82313
93123
Table 2. Non-dimensional values of wavelength, amplitude, position, and thickness.
Level λ A P T
11.09%0.55%6%3%
21.64%0.66%8%4%
32.19%0.77%10%5%
Table 3. The mesh size used for the check of mesh sensitivity.
No. of Elements (Million)CoarseMediumFine
Total1.482.354.04
Table 4. Boundary conditions.
CaseGmInlet Total TemperatureOutlet Static Pressure
1100%329.8 K5.4 kPa
240%329.8 K5.4 kPa
Table 5. Blade axial torque increment comparison between the nine tests.
TestNon-Dimensional Blade Axial Torque at Case 1Non-Dimensional Blade Axial Torque at Case 2
11.76%5.89%
21.42%13.07%
30.90%33.32%
41.68%10.88%
51.41%11.39%
61.38%20.85%
71.37%12.90%
81.72%15.75%
91.67%11.73%
Table 6. The OTM analysis results.
ParameterLevelAverage Value Non-Dimensional Blade Axial Torque at Case 2R at Case 2
Wavelength λ 113.21%5.44%
213.40%
318.65%
Amplitude A 19.67%13.63%
212.29%
323.30%
Position P 110.84%8.37%
215.22%
319.21%
Thickness T 117.43%3.97%
214.37%
313.46%