Review

Operational Management Implemented in Biofuel Upstream Supply Chain and Downstream International Trading: Current Issues in Southeast Asia

by
Hoo Poh Ying
1,*,
Cassendra Bong Phun Chien
2 and
Fan Yee Van
3
1
Energy Studies Institute (ESI), National University of Singapore (NUS), Singapore 119620, Singapore
2
Faculty of Chemical and Energy Engineering, Universiti Teknologi Malaysia, Johor Bahru 81300, Malaysia
3
Sustainable Process Integration Laboratory—SPIL, NETME Centre, Faculty of Mechanical Engineering, Brno University of Technology—VUT Brno, 616 69 Brno, Czech Republic
*
Author to whom correspondence should be addressed.
Energies 2020, 13(7), 1799; https://doi.org/10.3390/en13071799
Submission received: 26 February 2020 / Revised: 25 March 2020 / Accepted: 1 April 2020 / Published: 8 April 2020

Abstract

:
Bioenergy is one of the alternatives to secure energy demand, despite increasing debate on the sustainability of using bioenergy as a renewable source. As the source is disseminated over a large area and affected by seasonality, the potential benefit is highly dependent on other cost and benefit trade-offs along the supply chain. This review paper aims to assess operational management research methods used in biofuel supply chain planning, including both upstream production and international downstream trading. There have been considerable operational management studies done on upstream processes in biofuel production based on different strategic and tactical decision making of a single or multiple feedstocks, considering economic and environmental factor. However, the environmental consideration is often limited to carbon emission where the other environmental impact such as land-use change, biodiversity loss, irrigation and fertilisation are often being overlooked. Biofuel supply chain and trading at international level remain as an apparent research potential where only limited numbers of global energy models explicitly simulate international bioenergy trade. The leading biofuel producing countries in Southeast Asia: Malaysia, Indonesia and Thailand, are selected as a case study to investigate further on how the supply chain management model could be applied considering the existing biofuel support policies. This study is expected to contribute to the selection of operational management research methods used for decision making under robust policy context, followed by several recommendations.

1. Introduction and Problem Statement

The International Energy Agency (IEA) reported [1] that biofuel production for the transportation sector needs to triple by 2030 to 280 Mtoe to be on track with the Sustainable Development Scenario (SDS). This is equivalent to 10% of the global transport fuel demand, as compared to 3% global demand [1]. Table 1 shows the forecast annual production growth vs required production growth to meet SDS demand in 2030. Among the six countries/regions presented, China and ASEAN are among those with production growth that will possibly meet required biofuel production by 2030 under SDS. In 2017, the Chinese government announced to roll out the mandatory blending of 10% ethanol in gasoline nationwide by 2020 [2]. Significant development of new ethanol production capacity is currently underway in order to meet the target, which is equivalent to 15 Mt of biofuel annually, or around 45 Mt of corn. In ASEAN, biofuel policy is robust as domestic biofuel consumption is a means for energy security while promoting socio-economic development through ensuring demand for strategically critical agricultural commodities (Table 2). Among the 10 ASEAN member states, Indonesia, Malaysia, Philippines, Thailand and Vietnam are those with existing comprehensive policies on biofuel.
It is noted that Indonesia is the only ASEAN country with a target for a bioavtur (biojet fuel) mix of 5% by 2025 and 10% by 2050. The feedstocks used for biofuel production in ASEAN countries are palm oil (Indonesia, Malaysia, Thailand), coconut oil (the Philippines), sugarcane (Thailand, the Philippines) and cassava (Thailand, Indonesia). With Indonesia and Malaysia being the world top two producers of palm oil, Thailand being the world’s second producer of sugarcane after Brazil, Indonesia and Thailand being the world’s top second and third cassava producers, Indonesia and the Philippines being the top world producers of coconut oil, it is not an exaggeration to call Southeast Asia a rice bowl with huge regional potential for bioenergy production. Since biofuel carries a sustainable label as vehicle fuel when compared to conventional fossil fuels like gasoline or diesel, sustainability governance and a biofuel supply chain framework are essential to ensure that large scale biofuel consumption achieve its environmental benefits while delivering tangible economic and social benefits. Besides land-based vehicles, scaling up of biofuel consumption is also expected in the maritime and aviation sectors in the form of drop-in fuels, before more advanced alternative fuels like a solar jet, or hydrogen, become commercially viable. A decision-making level supply chain management is essential when formulating policies that sustainably promote biofuel production while providing investor confidence through financial de-risking measures or market instruments. De Meyer et al. [12] reviewed existing optimisation methods or models for optimisation in the field of biomass supply chain design and management. Most of the models reviewed had a case study in the EU, US and Brazil, with some case studies in China appearing in recent publications. Atashbar et al. [13] carried out a similar review on the modelling and optimisation of biomass supply chains. Most review articles are surrounding either solely on the methods of biomass supply chain management models, or solely on the potential, targets and current status of bioenergy in certain countries.
There has been a gap between how these supply chain management models could be used to plan for more sustainable biofuel production, considering the robust policy context of each biofuel producing countries. This is especially important for policymakers when it comes to decision making based on evidence. For ASEAN countries that possess significant feedstock resources, this is especially important so that food security and environmental sustainability are not compromised. This paper aims to first review the existing operational methods used to optimise the bioenergy supply chain, from upstream decision-making operational management optimisation model to downstream bioenergy trade model; then followed by a review on biofuel policy in ASEAN countries and challenges faced when implementing the policy. Only biofuel targets, policies and status of Indonesia, Malaysia and Thailand have been reviewed as there is existing comprehensive biofuel policy with similar bioenergy crops. The discussion will be made based on how the existing operational methods used in managing biomass supply chain at decision-making level could be used to tackle the challenges faced, or what are the research gap/blind spot/assumption made in existing methods that overlooks the consideration at the decision-making level. Most ASEAN countries that have biofuel mixes in the early days are motivated by energy security to reduce fuel imports and socio-economic factors as it creates jobs for their local communities. With increasing motivation towards carbon mitigation potential of biofuel in achieving sustainability target, it will be interesting to look into this matter and how each factor interact with each other when it comes to bioenergy planning.

2. Biofuel Supply Chain Planning and Management

The biofuel supply chain consists of biomass production, pre-treatment, storage and biofuel conversion. Each operation either takes place at the biomass production sites, or at another facility that is being connected to the biomass production site through different transportation mode. Figure 1 shows the flow chart of the biofuel supply chain. The biofuel supply chain is distinguished into two segments: upstream and downstream, with the segment bioenergy conversion placed interchangeably between the two, depending on whether biomass feedstock or the final product biofuel is traded. In this section, methods used in biofuel supply chain planning will be presented based on two categories: the upstream supply chain decision-making model and the downstream trade model. It is noted that not all bioenergy produced is traded; in some cases, bioenergy is utilised locally. To distinguish between supply chain management model used in this study downstream generally refers to traded bioenergy with some publications considering local consumption too.

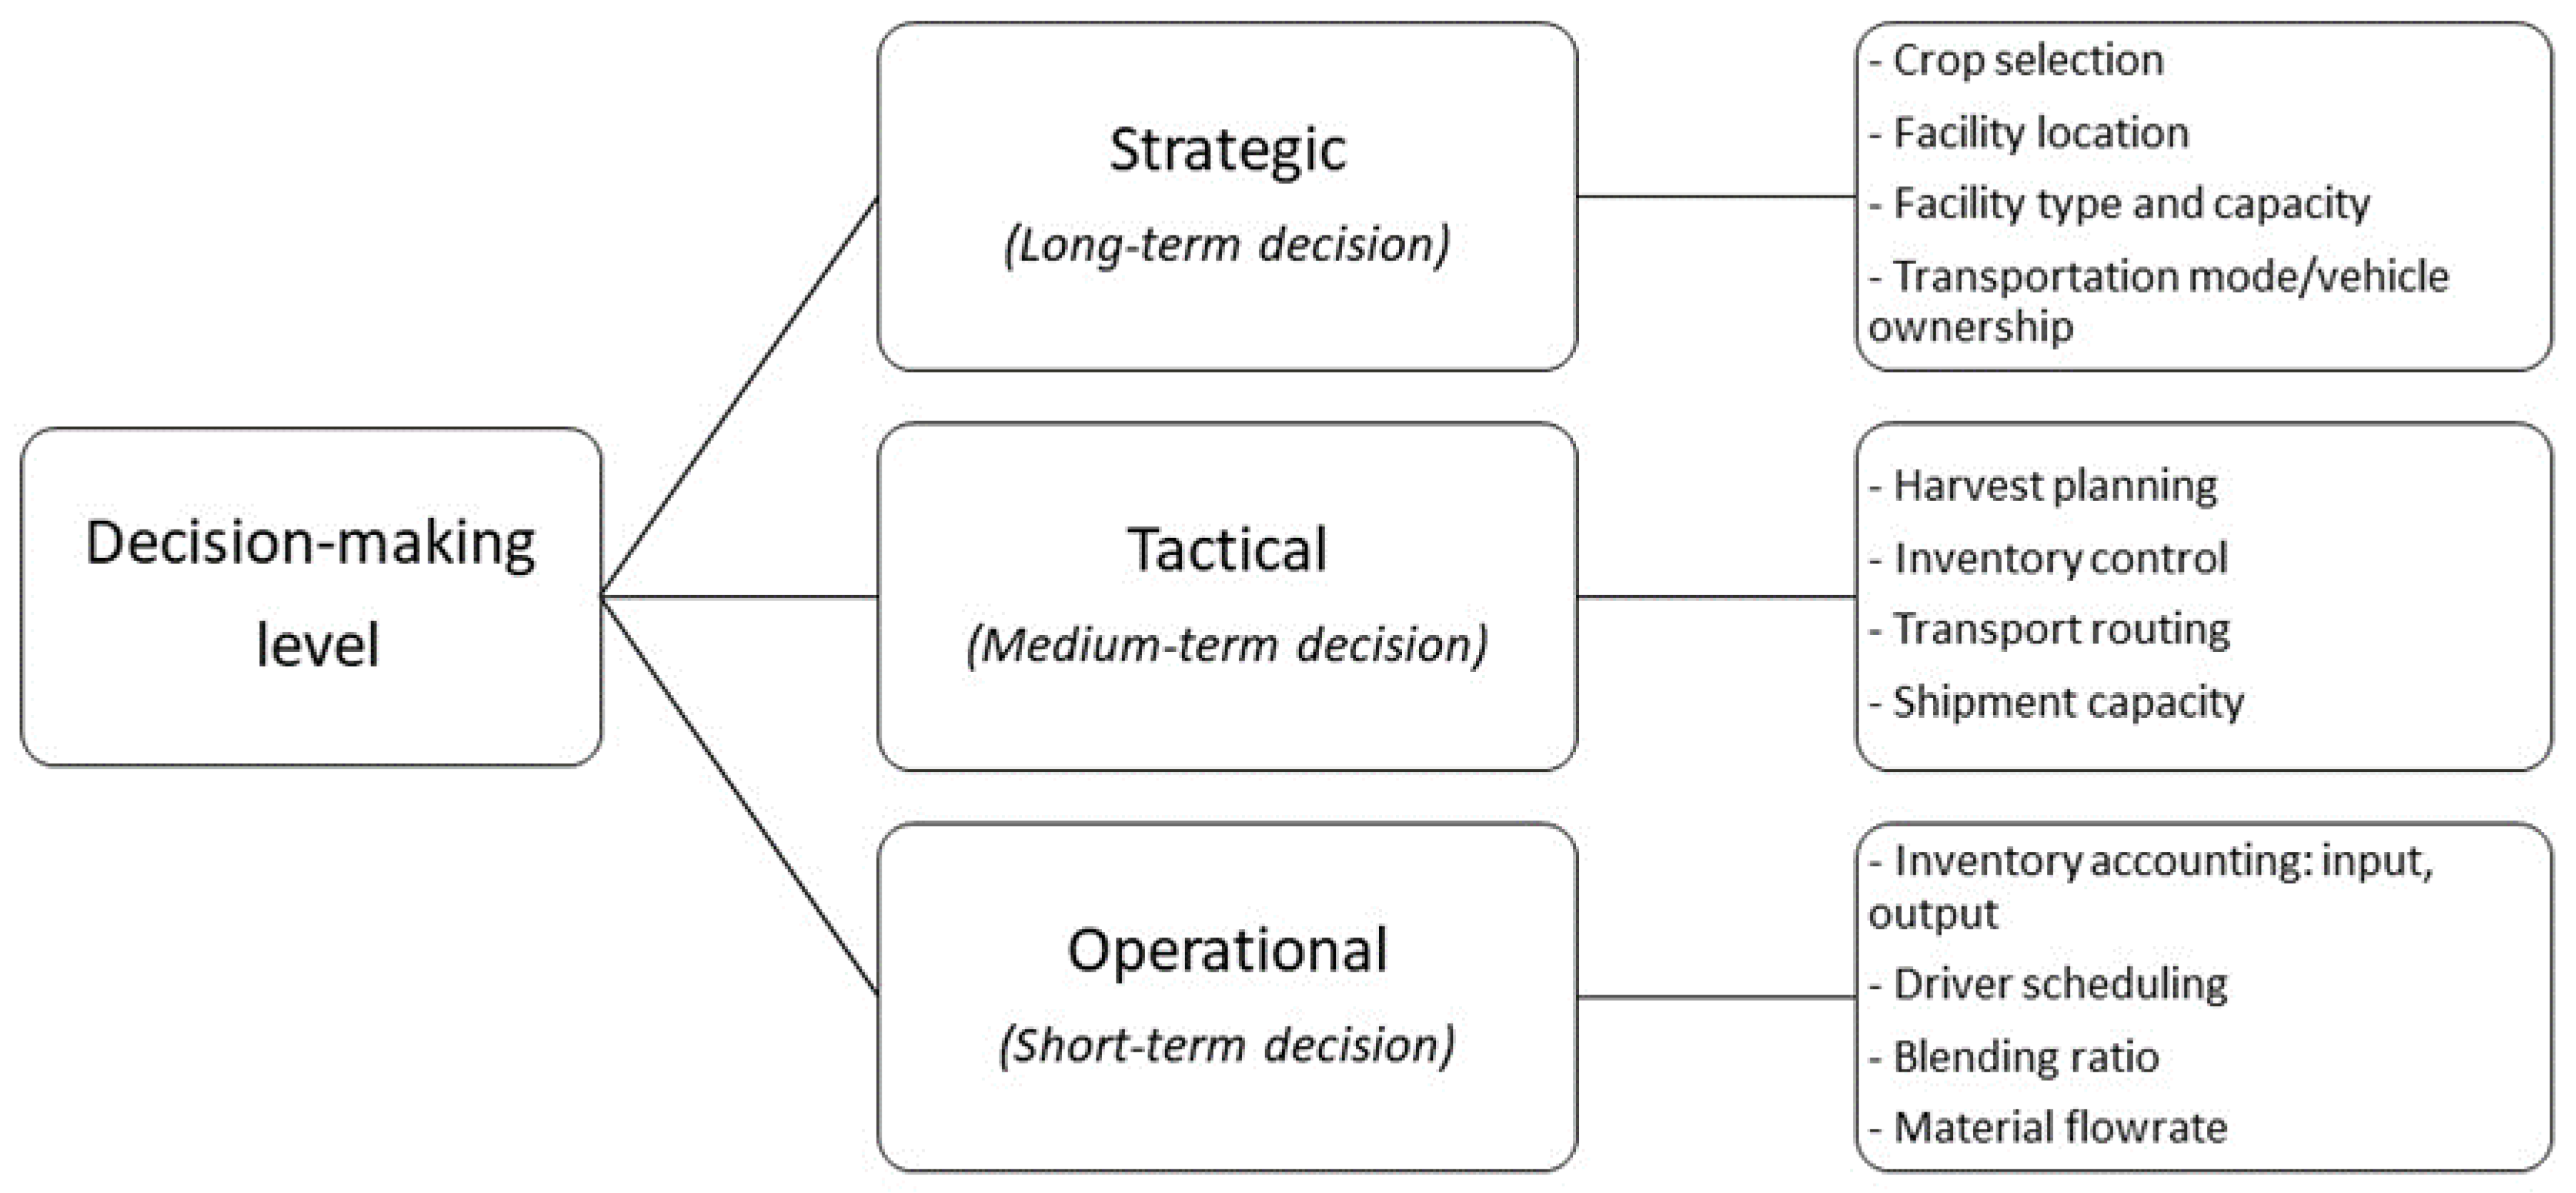
2.1. Methods Used in Biofuels Upstream Supply Chain Planning

The biofuel supply chain planning and management are influenced by various factors, among which are included biomass availability, choice of biomass cultivation type, harvesting, transport mode of the biomass, pre-treatment facility, biomass conversion technology type, conversion facility location and capacity, product storage facility, product distribution, routing and inventory. There are many decisions, of major and minor, to be made across the whole supply chain planning starting from crop selection to final product as covered in a review conducted by De Meyer et al. [12] and Atashbar et al. [13], in this case, biofuel consumption. There are three primary decision-making levels in supply chain planning and management: strategic, tactical and operational level (Figure 2). The strategic decision-making level refers to a decision where long-term investment is involved [12], for instance, location, capacity and type of storage, pre-processing, conversion facility, transportation mode (investment in ownership of the vehicle), crop selection. Tactical decision-making level refers to medium-term decision decisions, usually monthly or weekly and are within the constraint of a strategic decision [12]. Some examples of tactical decisions are harvest planning, inventory planning, transport routing and shipment capacity. Operational decision-making level usually refers to a decision over a short time frame, ranging from hourly to weekly that is within the limit of a tactical decision [12]. For instance, inventory planning and transport scheduling that ensures undisrupted and efficient operations of plants and processes at another facility through the supply chain.
Under each decision-making level, three main approaches are applied in solving the supply chain problem: mathematical programming, heuristic approaches, multicriteria decision analysis. Mathematical programming refers to mathematical models that represent real-world problems. The model is solved by optimising the objective function. For instance:
  • To maximise profit or to minimise the overall cost for an economic purpose.
  • To minimise greenhouse gas (GHG) emission for environmental purpose.
  • To maximise job creation for social purpose, while satisfying the limit of the constraints formulated in the model.
While the mathematical programming method aims to identify the optimal solution by solving the equations simultaneously, the heuristic approach looks for an optimal point to a defined problem through a stepwise approach. According to a review conducted by De Meyer [12], three different heuristics algorithms are observed: genetic algorithm, particle swarm optimisation and binary honeybee foraging for upstream biomass planning and management optimisation. Multicriteria decision analysis is also one of the methods used for decision making in supply chain generally. According to Roy [14], multicriteria decision analysis is defined as ‘a decision aid and a mathematical tool allowing the comparison of different alternatives or scenarios according to many criteria, often conflicting, in order to guide the decision-maker towards a judicious choice.
Thirty-two scientific publications could be found between 2014–2019 reviews the methods used for decision making at strategic and tactical levels under respective problem statement of the biofuel supply chain, with some exceptions for publications before 2014 for its method development related to recent publications. It shows a summary of recent scientific publications on decision making of biofuel supply chain (Table 3) It is observed that most biofuel supply chain planning and management problems are formulated as a Mixed Integer Linear Programming (MILP) problem, covering 21 papers out of 32 articles. Aguayo et al. [15] present a MILP model to address a static and dynamic corn-stover harvest scheduling problem in cellulosic ethanol production by minimising system cost. Ahn et al. [16] developed a mathematical programming model for strategic planning and design of microalgae biomass-to-biodiesel supply chain which minimise the total cost of the supply chain by taking resource constraints, demand constraints and technology into accounts. The model is then applied in a case study of the biodiesel market in South Korea.
Čuček et al. [17] presented a multi-period MILP model for regional bioenergy supply network optimisation with sources of biomass from first, second and third generations of biofuels. The model enables strategic decision on raw material sourcing, conversion technology selection by maximising economic performance. Foo et al. [18] developed a linear programming (LP) model to identify optimal feedstock allocation of a direct biomass source-sink allocation. The model is extended to a MILP model for pragmatic decision planning in biomass supply chain logistics, where a minimum threshold quantity is met in an optimal network. Miret et al. [19] developed a multi-period MILP model that proposes optimal bioethanol supply chain design with the account to facility location, process selection and inventory policy. This study compared the economic, environment and social aspect of bioethanol production from first and second-generation biomass. Ng and Maravelias [20] presented a multi-period MILP model for biofuel supply chain design, taking a case study in Wisconsin. Ng et al. [21] developed a MILP model which maximises biomass utilisation of rubber seed oil to produce biodiesel that considers centralised and decentralised rubber seed processing facilities. Rabbani et al. [22] developed a MILP model that selects optimal biomass pre-processing plant, biofuel plant and biofuel storage warehouse. Santibañez et al. [23] presented a multi-objective, multi-period MILP model that seeks to optimise the biorefinery supply chain in fulfilling ethanol and biodiesel demands in Mexico with consideration of economic, environmental and social criteria.
Other than MILP, some problems have been formulated as a mixed-integer non-linear programming (MINLP) model and then linearised to form the MILP model. López et al. [24] developed an MINLP optimisation model for biorefinery system design while taking the interactions of the biorefinery system with the surrounding watershed into account. The non-linear term came from the exponent to represent the economy of scale of biorefinery plant. The model is then solved as MILP by fixing the exponent as one. How et al. [25] developed a MINLP model that solves biomass supply chain synthesis problem by maximising overall profit and minimising CO2 emission through introduced CO2 penalty. Santibañez et al. [26] developed an MINLP model to identify the optimal configuration of a distributed biorefineries system, where the model can decide utilised raw materials, processing technologies, processing facilities and manufactured products.
It is observed that most supply chain optimisation problems are solely focused on optimising the economic benefits. Environmental, energetic and social factors deserve more attention in optimisation as these factors weight significantly when it comes to strategic decision making; this is especially true for the biofuel policymaker. To address this limitation, some authors used Pareto optimisation approach to obtain an optimal solution under the multi-objective situation. Liu et al. [27] present a multi-objective MILP model of biofuel conversion pathways with accounts to economic, energy and environmental criteria. Economic criteria are measured by total annual profit, energetic criteria are measured by fossil energy input per MJ biofuel, while environmental criteria are measured by GHG emissions per MJ biofuel. Pareto optimal surfaced is obtained to study the trade-offs between the three criteria. Miret et al. [19] applied the same approach through the epsilon-constraint method to study the multi-objective bioethanol supply chain model with a case study in France. Orjuela et al. [28] developed a multi-objective LP model that analyses biodiesel supply chain taking into consideration of economic, environment and social aspect, where the social aspect is taken from the perspective of food security concern. The epsilon-constraint method is then used to study the trade-off between multiple criteria. Osmani and Zhang [29] used an augmented epsilon-constraint method to solve multiple objective models with more than two objectives. Pareto optimal solution is also obtained in Santibañez et al. [23] multi-objective study.
It is undeniable that in the biofuel supply chain, which has a complex upstream supply chain, there are many uncertainties that could affect the performance of the supply chain, among which are included crop yield, potential disruption situations like pest attacks, floods or droughts, and biofuel price uncertainties. In order to address these uncertainties, a number of publications are found to have taken these factors into account. Azadeh et al. [30] present a stochastic multi-period MILP model that maximise the profit of a biofuel supply chain with prices of biofuels assumed to be stochastic. A case study is then conducted for the biofuel supply chain in Iran. Bairamzadeh et al. [31] proposes a hybrid robust MILP model for bioethanol supply chain design and planning with considerations of different types of uncertainties which included randomness, epistemic and deep uncertainties. Ghelichi et al. [32] developed a two-stage multi-period stochastic MILP model for biodiesel supply chain design with Jatropha curcas as feedstock, under consideration of feedstock supply and product demand uncertainties. Maheshwari et al. [33] developed biofuel supply chain resiliency optimisation model that consider no disruption and disruption scenarios during the flood, drought, pest attack, equipment failure, each weighted by their probability of occurrence. Mohseni and Pishvaee [34] present a robust supply chain optimisation model that manages complexities in strategic and tactical planning of microalgae-based biofuel production. The supply chain is designed based on batch and continuous production system. Optimal scale for the batch system is determined by a trade-off between the cost of biofuel production, transportation and risk mitigation. Osmani and Zhang [29] presents a multi-objective, multi-period optimisation model of a second-generation biofuel supply chain under switchgrass yield, bioethanol demand and bioethanol sale price uncertainties. Santibañez et al. [35] presented a stochastic multi-period optimisation model that identifies optimal biorefinery supply chain planning under raw material price uncertainty considering environmental and economic aspects. A multi-scale multi-period MILP model is developed by Sharifzadeh et al. [36] to identify the optimal supply chain design of biofuel production using fast pyrolysis under consumer demands and biomass availability uncertainty.
Some authors integrated graphical approaches with mathematical programming in solving a biomass supply chain problem. Fan et al. [37] developed a novel graphical decision-making tool that allows the selection of transportation mode with lower environmental burden and energy consumption. Lam et al. [38] proposed a two-level graphical strategy for optimal regional-level biomass energy supply chain networks synthesis that minimises total carbon emissions footprint followed by optimal biomass supply chain network synthesis within the region. The graphical approach was then applied to a case study at the Central European region.
Some authors integrated GIS functions to characterise the related biofuel supply chain when formulating the problem, especially in determining facility location. Harahap et al. [39] present a policy analysis using a spatially-explicit MILP model to optimise the overall palm oil supply chain—not just solely on palm oil biofuel supply chain in Sumatra, Indonesia. Hoo et al. [40] presented a spatial-economic optimisation MILP model to identify biomethane production plants with the aid of GIS network analysis. Zhang et al. [41] developed a GIS integrated optimisation model in designing a bioethanol feedstock supply chain, which allows the selection of facility location by minimising total system cost. The model is then applied on a case study in the northern part of Michigan’s Lower Peninsula, in the US.
Other than mathematical programming, a heuristic approach is also used by some authors to solve complex biofuel supply chain models. Note that the heuristic approach looks for satisfactory solutions, not necessarily an optimal solution and often presents reduced runtimes in solving models [12]. Asadi et al. [42] developed a multi-objective metaheuristic algorithm for algae biofuel supply chain design with an integrated formulation of inventory, routing and location decision under demand uncertainties. Marufuzzaman et al. [43] developed a two-staged (strategic level decision making followed by tactical decision making) stochastic model that assists the design and management of biodiesel supply chain by taking feedstock and technology uncertainties into account. The problem is then solved using an algorithm that combines Lagrangian relaxation and L-shaped solution methods. Poudel et al. [44] present a hybrid decomposition algorithm in solving an optimisation problem when studying the impact of disruption and congestion at the facility of a biofuel supply chain. While for multicriteria decision analysis, Nana et al. present a spatial explicit biodiesel supply chain optimisation model that was solved using an analytical hierarchy process (AHP). How and Lam [45] proposed a multi-objective optimisation (MOO) solution of biomass supply chain management (SBSCM) through AHP that integrates both economic and environmental factors. Among which the environmental factors included abiotic depletion potential (ADP), acidification potential (AP), aquatic toxicity potential (ATP), global warming potential (GWP), land footprint, nutrification potential (NP), ozone depletion potential (ODP), photochemical ozone creation potential (POCP), terrestrial toxicity potential (TTP), water footprint. A general method is also observed in Ng and Maravelias [46] study on the biofuel supply chain. The authors applied a systematic method to compare and investigate the economic performance and energy efficiency of the biofuel supply chain under various configurations and transportation modes. The author introduced hybrid configurations that can potentially improve economic performance and energy efficiency of different supply chain configuration. The findings of the result form the basis for larger-scale biofuel supply chain optimisation model in a future study.
It is observed that there is increasing research and publications on operational biofuel supply chain methods in China and Iran, especially for second-generation and third-generation biofuel production. Waste cooking oil as a feedstock for biofuel production is found in China biofuel supply chain planning (Table 4). Waste cooking oil can be converted into biofuel through hydro-processed esters and fatty acids (HEFA) conversion process. Advanced biofuel produced from waste cooking oil through HEFA process is also considered as Carbon Offsetting and Reduction Scheme for International Aviation (CORSIA)-eligible fuels, which it can be used as sustainable aviation fuel for aircraft. A number of supply chain planning involving microalgae are also found in recent literature. While crop selection in different continents varies geographically, seasonality also affects feedstock supply, as indicated in the most multi-period mathematical models. This is especially true for the northern hemisphere. Despite being primary world producers of biofuel [1], there are minimal scientific publications on supply chain planning from countries in Southeast Asia region found in the literature, except for [38] who have done extensive operational supply chain research on biomass in Malaysia. However, publication solely focusing on biofuel supply chain with case study characterising biofuel production in this region is missing.

2.2. Methods Used in Biofuel Downstream Supply Chain Planning

Bioenergy plays an essential role in promoting clean energy and securing the future energy supply. This rationale leads to increase global trade of biomass or energy carriers from biomass which has been reported by Schlamadinger et al. [48]. Welfle [49] highlighted that the bioenergy strategies of many countries highly depends on future imported resources to balance the demands. Biomass is unevenly distributed in the view of demand and resources availability. Developed countries and the energy policies drive the increasing reliance on bioenergy pathways to meet the energy demand. Some of the countries are facing insufficient biomass stock to meet the demand, but there are also countries with the potential supply that significantly exceeds the demand. An international biomass supply chain is vital to promote natural symbiosis. Junginger et al. [50] provide a comprehensive discussion on international bioenergy trade, including the drivers and barriers as well as developments in liquid biofuel trade. Europe is one of the prime markets for the trade of biomass for energy generation, with wood pellet as the main substrate (see Figure 3). Lamers et al. [51] show that Brazil is the leading exporter of bioethanol while the United States, Argentina, Indonesia and Malaysia are the major exporters of biodiesel. Based on the forecast by IEA [1], biofuel output is anticipated to reach 1.9 × 10¹¹ L (+24%) by 2024, owing to better market prospects in Brazil, the United States and China. Asia is expected to lead to biofuel production growth.
Downstream biofuel supply chain planning and management are subjected to a higher level of uncertainty, especially when it involves international trading. The objective function is generally the same as the upstream assessment, where economic and/or environmental aspect is optimised. Physical trade of biomass is not always the optimal solution due to international logistics, which increase the cost and environmental footprints. Laurijssena and Faaij [53], however, suggest that trading biomass is preferential than trading GHG emission credits. Other than the transporting distance, which is the main supply chain issue, the international trade (macro perspective) is affected by incentive-policy (e.g., the EU’s Renewable Energy Directive) context and trade tariffs (both import and export tariffs) [54]. The reliability of the assessment results is relying on the accurateness of projection/ prediction as well as the assumptions. The assessment model is usually supported by a range of scenarios representing the optimistic and pessimistic situation. Welfle [49] applied the biomass resource model to evaluate the biomass potential in Brazil. The trading possibility is determined by the availability of the resource, considering the remaining land area, the potential of resource collection, competing for a market of biomass utilisation as well as the conversion pathway. Deng et al. [55] conducted similar research to identify the potential of trading (import and export) based on resource availability but covering a more extensive range of feedstock and countries. The yield gradient, land-use change and technology development are varying to identify the biofuel potential. The estimation potential for the global scale ranges from 40 to 190 EJ final energy in 2070 where Brazil and Russia are recognised as the prominent exporters, while India and Nigeria are substantial importers. The forecasts mainly identifying the biomass potential rather than the biomass allocation, which considering the detailed costing, travel distance and available market. Lamers et al. [56] assess the potential import streams and supply costs under different sustainability constraints based on a bottom-up global trade model. Figure 4 shows the modelling framework which combining the biomass transport model and biomass allocation model. This modelling considered temporal and logistical determinants without neglecting the market development and time aspects (e.g., delay), where the biomass allocation is suggested.
The review by Diesenreiter and Kranzl [57] suggested that no customised models are available for incorporating global import/export potentials and international trade. The evaluated approaches in the review study are divided into basic modelling approaches for analysing the macroeconomic effect of international trade, computable general equilibrium models and geographic information system. A similar conclusion has been drawn by Solberg et al. [58] in a study for IEA bioenergy task 40 where none of the existing models is capable of performing good analyses of international trade of biomass and bioenergy products. Figure 5 summarises the assessed models in both studies in identifying the weakness and strengths. There is a common characteristic where all the presented models are customised more to the case of the EU. Green-X model [59], which allows the consideration of different energy policy instruments is also for the application of the European level. The gravity model of trade [60] is among the standard model in predicting bilateral trade flows according to the economic sizes and distance between two units despite the argument on the identified results [61]. Röttgers et al. [62] analyse the effect the EU imposes on the trade of the biofuel commodities and identify the drives (e.g., trade regulation or bioenergy regulation) of biofuel trade. The assessment suggests that EU trade integration has no enabling effect on canola oil trade where the import from outside of the EU is preferable. The result warrants a closer look at the political measures and its effectiveness, especially the green investment subsidy. However, other factors such as economies of scale, resource scarcity and value chain structure have to be taken into account as well for a conclusive picture.
Rentizelas et al. [63] stressed the need for a decision support tool to facilitate the supply chain design rather than assessing the supply chain of specific origin and destination location. A multicriteria tool based on data envelopment analysis which considers the environmental impact and cost is conducted to identify the efficiency of alternative pathways (Up to 56 pathways between Brazil and the UK) of international biomass supply chains are developed. Three models for bioenergy trade analysis, include TIMER (dynamic energy system model), GFPM (spatial partial equilibrium model based on price endogenous linear programming) and POLES (dynamic partial equilibrium model), have been reviewed by Matzenberger et al. [64]. It was concluded that further integration of international bioenergy trade, emerging barriers and drivers into the existing models is essential for a more realistic answer regarding the future role of the bioenergy system.
Maximising the economic performance is the common objective function in most of the models. However, the trade-offs between economic and environmental performance as well as the other factors have to be also considered. Total footprints-based multi-criteria optimisation is proposed by Čuček et al. [65] to consider the economic performance, environmental footprint as well as the social footprint in determining an optimal regional biomass energy supply chain. Jonkman et al. [66] propose a decision support tools with the advantages that it can take into account the goals of individual actors of the supply chain than only optimising the economic and environmental performance. This is a significant development and beneficial for supply chain with the involvement of different countries. The multicriteria approach is potential to adapted for global supply chain problem, although it is demonstrated through a case study in the Netherlands. Lee et al. [67] proposed a global supply chain optimisation framework supported by two-stage stochastic linear programming model (TRMISP) to identify the supply chain design (Southeast Asia to Europe and North America) under the price and demand uncertainty. This is important as uncertainties are one of the main challenges in modelling and optimisation of the international supply chain. Transfer pricing, currency exchange and taxation rates have to consider in the global supply chain planning. The studies which include one or more of the factors include de Matta and Miller [68] (Transfer price- generalised Benders decomposition approach), and Gonela et al. [69] (Tax-credit- stochastic mixed-integer linear programming model). Razm et al. [70] proposed a multi-objective mathematical model with the aids of GIS to design a global sustainable bioenergy supply network. This is a comparatively comprehensive model which considered all the crucial components at the international level.
The methodological challenges such as uncertainties of international statistics, inconsistent data on trade volumes and final use of traded products [71] persist despite advancing. It is expected to enhance the development of IoT and big data in the near future. Fingerman et al. [72] assessed the opportunities and risks for sustainable biomass export, particularly to Europe from the South-Eastern of United States. The long-term strategies assessment by Pelkmans et al. [73] for European bioenergy markets considered North America, South America, East Europe, Africa and Southeast Asia as the potential sourcing regions. It is concluded that policies should be stable and consistent within a long-term vision. Macro perspective assessments specifically done for Asia countries are generally lesser, especially compared to EU and South America. It deserves more research attention by adapted to the localised condition and forecast towards a close to the optimal global solution. Different approaches can be fitted for solving the problem related to international biofuel trade by integrating to the existing energy models. However, the considered variables are not consistent for a robust solution, and data availability for modelling is still one of the critical issues.

3. Case Study: Malaysia, Indonesia, Thailand

3.1. Existing Policy and Current Status

ASEAN is facing energy challenges in supplying sustainable and secure energy due to its increasing growth and depleting natural oil reserves. The rapid economic growth comes with a 50% increment in the regional energy demand within a decade [74]. The case studies are discussed in two sections. The first section looks into several essential policies in facilitating the installation and progression of the biofuel industry among the three Southeast Asian countries, namely Malaysia, Indonesia and Thailand. The second section discusses the challenges and the shift of attention on the upstream and downstream process of the biofuel supply chain following the progression of the biofuel industry.

3.1.1. Malaysia

In 2000, Malaysia included RE (small-scale hydro, solar, geothermal, wind and biomass) as its fifth energy source under the Fifth Fuel Diversification policy. Palm oil is the primary source of biofuel in Malaysia, with its available biomass from the 4.69 × 10⁶ ha of oil palm plantations [75]. Crude palm oil is the primary feedstock to produce biodiesel or palm methyl ester (PME) [76]. In 2006, Malaysia announced the National Biofuel Policy (NBP) with the aim to improve energy security, environmental performance, and increasing the domestic consumption of surplus palm oil [77].
Malaysia has been actively promoting the use of biodiesel for its transportation sector and subsidised sector. The Biofuels Industry Act 666 was enacted in 2008 for the licensing and the regulation of the biofuel’s industry and the mandate B5 blend was introduced for transport and industrial use progressively to all states from 2011–2014 [78]. In November 2014, the B7 biodiesel was introduced nationwide to increase the use of biodiesel by 47.5%, up to 575,000 t/y [79]. Subsequently, under the year 2019 Malaysian budget, the government implemented the B10 biodiesel program for the transportation sector and B7 for the industrial sector [80]. The consumption of palm oil was expected to reach 700,00–800,000 t palm oil annually under the B10 program, which is 50% higher under the B7 programme in 2018 [81]. Malaysia’s government presently aims to raise its biodiesel mandate blend from the current B10 to B20 for the transport sector and from the present B7 to B10 for the industrial sector by 2020 [82].
Bioethanol is less utilised in Malaysia despite the high biomass production and availability [83], with 15.8–17 Mt/y of empty fruit bunches produced that can be converted to bioethanol through pre-treatment, hydrolysis and fermentation [84]. There is currently no mandate blend of bioethanol under the NBP. The Malaysian market for bioethanol is potentially much larger than the market for biodiesel because a much more significant proportion of the vehicle fleet runs on gasoline [83]. Abdulrazik et al. [85] identified a profit of around $710 M/y, assuming single ownership from different bio-products derived from empty fruit bunch.

3.1.2. Indonesia

Indonesia is abundant in biomass, typically oil palm and Jatropha for biodiesel as well as cassava and sugar cane for bioethanol [86]. In 2006, the government of Indonesia announced the Indonesia Presidential Regulation no.5, also known as the National Energy Policy (NEP), to include biofuel as one of its RE sources. The NEP aimed to have biofuel contributing more than 5% to the national energy consumption by the year 2025 [87]. The Indonesia government also introduced volumetric utilisation target to have 10–20% of diesel and petrol consumption to be replaced by biodiesel and bioethanol [86]. In 2008, the Ministry of Energy and Mineral Resource Regulation (MEMR) No.32 introduced mandatory biofuel utilisation in transportation, industry, commercial and electricity. In 2013, the MEMR No.25 expanded the biodiesel utilisation to public service obligation (PSO), non-PSO, industry and electricity [87]. Based on the Government Regulation No 70/2014 on National Energy Policy and the Presidential Regulation No 22/2017 on General Plan of National Energy, Indonesia is aiming to increase the biofuel share up to 23% of its RE mix by 2025 [88].
For the use of biodiesel, the government has expanded the use of B20 to all sectors, including both PSO and non-PSO. The Indonesia government has launched the highest mandate blend of B30 around the globe in December 2019, where it is expected to save USD 4.5 × 10⁶ annually on fossil fuel import for the country [89]. The government is currently on its way to implement B30 by 2020 for the transportation sector and B40 for large sectors such as railways. For bioethanol, the government targets to have a mandated blend of E5 for PSO and E10 for non-PSO from the current E2 in 2020 then expand to E20 for all sectors in 2025 [88].

3.1.3. Thailand

Comparing the biofuel policies of Thailand with its neighbouring countries like Malaysia and Indonesia, the Thai government places more significant emphasis on its bioethanol industry. The Thai government has released a series of revised energy plans towards their transition into Thailand 4.0 with emphasis on the use of RE to achieve a low carbon society. In 2012, Thailand introduced the Alternative Energy Development Plan (AEDP) from 2012–2021 to increase its bioethanol production from 1.2 to 9 × 10⁶ L from sugarcane and cassava as well as the oil palm plantation for biodiesel from 2.3 to 6 × 10⁶ L [90]. The AEDP also aims to increase the mix of RE to 30% by 2036 into the energy mix, with a 25% target of substitution of fuel with biofuel [91]. In 2014, the new power development plan (PDP) was announced with five integration master plans, including the revised PDP and AEDP. The PDP 2015, which covers from 2015–2036, focuses on energy security and fuel diversification, cost of power generation, and lessening CO2 emission of power generation [91]. The AEDP 2015 aimed to achieve 30% of RE in the energy mix in 2036, with 20–25% to be contributed by biofuel [92]. In 2018, the government of Thailand also announced its updated PDP for 2018–2037 to increase RE share up to 35% on the national energy mix [93].
The bioethanol policy of Thailand has been promoting high consumption of the ethanol fuel as the government provides incentives and tax reductions, where the price of gasohol can be 20–40% cheaper than regular gasoline for cars compatible with E20 and E85 gasohol [92]. The government of Thailand implemented public sales of B10 in 2019 and to replace the current B7 by 2021 [94], followed by the possible implementation of B20 on buses and trucks [95]. In its AEDP 2012–2021, the Thai’s government has also looked into the production of advanced biodiesel fuel derived from algae and jatropha with a 1.95 × 10⁹ L production target [96].

3.2. Discussion

As depicted in Figure 1, the biofuel supply chain contains the upstream (biomass production, pre-treatment, feedstock storage) and downstream (conversion and bioenergy utilisation) processes. Following the increasing volume of the biofuel blend and the expansion of the industries practising such mandatory blend, there will be increasing pressure in securing the biomass availability for the upstream process. For example, in Malaysia, the implementation of the B10 program will consume up to 750 kt of oil palm annually [81]. For Indonesia, the government has to secure a biofuel supply of 9.59 × 10⁹ L for the implementation of the mandated blend of B30 [89]. The study also pointed out the need for more infrastructure support on the fuelling stations to suppler the increasing blend. For Thailand, 15% of extra land for plantation is required in order to achieve its B10 target [97]. This is also complicated where oil palm requires 24 years till maturation [77]. Abdul-Manan et al. [77] identified four major elements for improving the upstream performance, namely improving the fresh fruit bunch yield, improving worker productivity, increasing oil extraction rate and developing biogas plant for oil palm yield. The increasing production of the biomass also requires a parallel installation and upgrading of pre-treatment and storage facilities.
In terms of environmental performance for the upstream processes in securing the biomass availability, the palm oil industry will need to demonstrate better sustainability performance towards a greener environment and a broader market acceptance. [98]. There is still a lack of detailed assessment framework from the NBP. Abdul-Manan et al. [99] discussed the significant variation in the environmental performances from the differences in land use, deforestation, N fertilisers and fertilisation management practice of different palm-based biofuel refinery. Čuček et al. [100] also highlighted that footprints used to monitor sustainability usually vary and expressed ambiguously. For environmental footprints, there are carbon emission footprint, water footprint, energy footprint, emission footprint, nitrogen footprint, land footprint and biodiversity footprint [100]. Nitrogen footprint attributed to fertiliser, pesticide and final combustion of biofuel/biomass is often neglected when quantifying the environmental impact of the increasing use of bioenergy. In Indonesia, it was reported that 25% of the oil palm plantations were on peat soils, which can lead to the release of stored carbon and contribute to global warming [101]. From the economic perspective, there are concerns over the financial cost in importing and subsidising petroleum-based fuel [102] which can contribute to a significant expenditure of the government [98]. There is also increasing reluctance of the EU in importing palm oil and palm-derived products [103]. In addition, in the case of Malaysia where the biofuel industry is largely based on palm oil and FAME, Abdul-Manan et al. [77] also pointed out this may limit the technology innovation and the selection of best available techniques, especially in times when there is a change in the government policy or market preferences.
The greatest challenge in achieving its biofuel target is the amount of feedstock which is then associated with uncertain impact on the environmental sustainability due to land-use change, water consumption and net fossil energy savings [86]. With increasing population and rising projection of consumption, Kraxner et al. [104] reported that there would not be enough land to stop deforestation while switching to 100% renewables and conserve natural areas completely, especially in the tropical regions. There is still in need of assessment or optimisation on the sustainability performance for the designing or optimisation of the upstream process as pointed out by [77]. In addition to the environmental sustainability performance such as GHG and C change, some additional aspects of being considered for designing the upstream process include:
  • The time needed for maturation and the decreasing yield of oil palm following maturation.
  • Economic performances involving local and export demand.
  • Involvement of the installation of biofuel plants and blending facilities.
  • The utilisation of readily available biomass residual to produce 2nd generation biofuel or other bioproducts, e.g., utilisation of biogas produced from agroindustry wastewater.
The downstream process of the biofuel supply chain involves the conversion and the bioenergy utilisation aspects. Chanthawong et al. [105] identified three major factors affecting the long-term demand for biofuel, which includes the price of biofuels, real gross domestic production and the number of vehicles. Putrasari et al. [87] also pointed out that the biofuel program is limitedly applied to a specific area by the central Indonesia government with low social acceptance and limited research into the development of flexi fuel vehicle. Moreover, there is also competition in the allocation of the bioenergy utilisation. For example, Malaysia has 40% of its palm oil being used to produce biofuel and limiting the supply for vegetable oil demand [106]. Following the tighter environmental regulation, the palm oil biodiesel is also required to perform greener to secure its demand. For example, under the US Renewable Fuel Standards, cellulosic biofuel and biomass-based diesel are required to reduced lifecycle GHG of at least 60% and 50% [107]. In addition to the improved environmental management during the upstream process, the downstream process could be optimised following the upgrading of conversion technology with a higher extraction rate, less emission to air and more. The installation of anaerobic digestion plant can contribute to GHG reduction through the utilisation of biogas as renewable energy [77]. The diversification of more value-added products from the downstream such as oleochemical derivatives and the utilisation of waste and biomass residuals for 2nd generation biofuels are attractive for improving both the environmental and economic performances [108], briquette and phytonutrients from crude palm oil [109].
In terms of the supply chain design for the downstream process, it is recommended to take into the environmental and social considerations of several aspects on the biofuel consumption that include:
  • The increasing mandate blend and the optimal mandate blend
  • Expanded consumption of biofuel to other sectors
  • Diversification of the product spectrum of the biomass
  • The different conversion rate of biomass to the biofuel.

4. Conclusions

This study reviewed the operational research methods used in biofuel supply chain planning. For the upstream supply chain optimisation, most optimisation focuses on either economic performance or environmental and social factors. For the downstream bioenergy trading optimisation, price and demand uncertainties are of the significant challenges for regional and international trading, which can be influenced by the policy or industry target of all trading partners involved. Following the increment in the mandate biofuel blend imposed by the three mentioned countries—Malaysia, Indonesia and Thailand—and the global demand for cleaner biofuel, the integration of the environmental and social factors to the supply chain design would offer better decision making on optimising the sustainability. The sustainability of bioenergy upstream supply chain can come to the negative environmental impact of bioenergy feedstock plantation due to land-use change, fertilisation and irrigation. Stricter qualification of advanced and greener biofuel for international downstream trading through the development of sustainability criteria and certification is crucial, especially the trade-offs of environmental and social footprints.
There is a consideration of the industry or policy’s characteristic, such as a biofuel industry based on single biomass, the flexibility of other conversion technologies and the utilisation routes of the interested biomass. A more holistic approach that took sustainability criteria like land-use change, biodiversity loss, the impact of irrigation and fertilisation, carbon emission footprint, nitrogen footprint and other emission footprints into consideration is vital to assist a more informed policy decision. Good governance and coordination of different policy areas: an integrated assessment should support energy, land-use change, climate and rural socio-economic development. There is an urgent need for interdisciplinary research in this field, especially for the Southeast Asian countries which have a high forecasted annual biofuel production growth rate in years to come. While biofuel enables countries to meet their energy goals, established interdisciplinary research done in this field will lead to more sustainable resource use, improved environmental performance, strengthened energy security and enhanced economic development.

Author Contributions

Conceptualization, H.P.Y. and F.Y.V.; methodology, H.P.Y. and F.Y.V.; formal analysis, H.P.Y., C.B.P.C. and F.Y.V.; resources, H.P.Y., C.B.P.C. and F.Y.V.; writing—original draft preparation, H.P.Y., C.B.P.C. and F.Y.V.; writing—review and editing, H.P.Y., C.B.P.C. and F.Y.V.; visualization, H.P.Y. and F.Y.V.; supervision, H.P.Y. All authors have read and agreed to the published version of the manuscript.

Funding

This research was funded by the Energy Studies Institute and the EU project “Sustainable Process Integration Laboratory—SPIL”, project No. CZ.02.1.01/0.0/0.0/15_003/0000456 by EU “CZ Operational Programme Research, Development and Education”.

Acknowledgments

Energy Studies Institute is acknowledged for core funding this piece of work. The EU project Sustainable Process Integration Laboratory—SPIL, funded as project No. CZ.02.1.01/0.0/0.0/15 003/0000456, by Czech Republic Operational Programme Research and Development, Education under the collaboration agreement with the Universiti Teknologi Malaysia is gratefully acknowledged.

Conflicts of Interest

The authors declare no conflict of interest.

References

  1. IEA (International Energy Agency). Renewables 2019; IEA: Paris, France, 2019. [Google Scholar]
  2. REUTERS. China Sets 2020 Target for Nationwide Ethanol to Cut Corn Stocks. Available online: www.reuters.com/article/us-china-biofuels/china-sets-2020-target-for-nationwide-ethanol-use-to-cut-corn-stocks-idUSKCN1BO03R (accessed on 29 November 2019).
  3. National Energy Council. National Blueprint of Energy in Indonesia; The Ministry of Energy and Mineral Resources of Indonesia: Jakarta, Indonesia, 2017.
  4. REUTERS. Indonesia President Wants B30 in Use by Jan 2020: Cabinet Secretary. Available online: www.reuters.com/article/us-indonesia-biodiesel/indonesia-president-wants-b30-in-use-by-january-2020-cabinet-secretary-idUSKCN1V20VR (accessed on 29 November 2019).
  5. Ministry of Plantation Industries and Commodities Malaysia. The National Biofuel Policy; Ministry of Plantation Industries and Commodities Malaysia: Putrajaya, Malaysia, 2006.
  6. REUTERS. Malaysia to Implement B10 Biodiesel Programme from Dec. 1. Available online: www.reuters.com/article/malaysia-palmoil-biodiesel/malaysia-to-implement-b10-biodiesel-programme-from-dec-1-idUSL4N1XY24I (accessed on 29 November 2019).
  7. Department of Energy Philippines. Biofuels Act of 2006; 13th Congress of the Philippines: Taguig, Philippines, 2007. [Google Scholar]
  8. Ison, L. Biofuels Industry Bats for B5 in Diesel by 2021. Available online: www.pna.gov.ph/articles/1074753 (accessed on 29 November 2019).
  9. Department of Alternative Energy Development and Efficiency Thailand. Alternative Energy Development Plan: AEDP 2015; Department of Alternative Energy Development and Efficiency Thailand: Bangkok, Thailand, 2015; p. 22.
  10. Trinh, T.A.; Linh Le, T.P. Biofuels Potential for Transportation Fuels in Vietnam: A Status Quo and SWOT Analysis. In Proceedings of the IOP Conference Series: Earth and Environmental Science, Ho Chi Minh City, Vietnam, 17–19 April 2018; Volume 143, pp. 1–18. [Google Scholar]
  11. F+L Daily. Vietnam to Mandate 5% Ethanol Blends by January 2018. Available online: www.fuelsandlubes.com/vietnam-to-mandate-5-ethanol-blends-by-january-2018/ (accessed on 29 November 2019).
  12. De Meyer, A.; Cattrysse, D.; Rasinmäki, J.; Van Orshoven, J. Methods to Optimise the Design and Management of Biomass-for-Bioenergy Supply Chains: A Review. Renew. Sustain. Energy Rev. 2014, 31, 657–670. [Google Scholar] [CrossRef] [Green Version]
  13. Zandi Atashbar, N.; Labadie, N.; Prins, C. Modelling and Optimisation of Biomass Supply Chains: A Review. Int. J. Prod. Res. 2018, 56, 3482–3506. [Google Scholar] [CrossRef]
  14. Roy, B. Multicriteria Methodology for Decision Aiding; Springer US: Dordrecht, The Netherlands, 1996. [Google Scholar]
  15. Aguayo, M.M.; Sarin, S.C.; Cundiff, J.S.; Comer, K.; Clark, T. A Corn-Stover Harvest Scheduling Problem Arising in Cellulosic Ethanol Production. Biomass Bioenergy 2017, 107, 102–112. [Google Scholar] [CrossRef]
  16. Ahn, Y.C.; Lee, I.B.; Lee, K.H.; Han, J.H. Strategic Planning Design of Microalgae Biomass-to-Biodiesel Supply Chain Network: Multi-Period Deterministic Model. Appl. Energy 2015, 154, 528–542. [Google Scholar] [CrossRef]
  17. Čuček, L.; Martín, M.; Grossmann, I.E.; Kravanja, Z. Multi-Period Synthesis of Optimally Integrated Biomass and Bioenergy Supply Network. Comput. Chem. Eng. 2014, 66, 57–70. [Google Scholar] [CrossRef]
  18. Foo, D.C.Y.; Tan, R.R.; Lam, H.L.; Abdul Aziz, M.K.; Klemeš, J.J. Robust Models for the Synthesis of Flexible Palm Oil-Based Regional Bioenergy Supply Chain. Energy 2013, 55, 68–73. [Google Scholar] [CrossRef]
  19. Miret, C.; Chazara, P.; Montastruc, L.; Negny, S.; Domenech, S. Design of Bioethanol Green Supply Chain: Comparison between First and Second Generation Biomass Concerning Economic, Environmental and Social Criteria. Comput. Chem. Eng. 2016, 85, 16–35. [Google Scholar] [CrossRef] [Green Version]
  20. Ng, R.T.L.; Maravelias, C.T. Design of Biofuel Supply Chains with Variable Regional Depot and Biorefinery Locations. Renew. Energy 2017, 100, 90–102. [Google Scholar] [CrossRef] [Green Version]
  21. Ng, W.P.Q.; Lam, H.L.; Yusup, S. Supply Network Synthesis on Rubber Seed Oil Utilisation as Potential Biofuel Feedstock. Energy 2013, 55, 82–88. [Google Scholar] [CrossRef]
  22. Rabbani, M.; Ramezankhani, F.; Giahi, R.; Farshbaf-Geranmayeh, A. Biofuel Supply Chain Considering Depreciation Cost of Installed Plants. J. Ind. Eng. Int. 2016, 12, 221–235. [Google Scholar] [CrossRef] [Green Version]
  23. Santibañez-Aguilar, J.E.; González-Campos, J.B.; Ponce-Ortega, J.M.; Serna-González, M.; El-Halwagi, M.M. Optimal Planning and Site Selection for Distributed Multiproduct Biorefineries Involving Economic, Environmental and Social Objectives. J. Clean. Prod. 2014, 65, 270–294. [Google Scholar] [CrossRef]
  24. López-Díaz, D.C.; Lira-Barragán, L.F.; Rubio-Castro, E.; Ponce-Ortega, J.M.; El-Halwagi, M.M. Optimal Location of Biorefineries Considering Sustainable Integration with the Environment. Renew. Energy 2017, 100, 65–77. [Google Scholar] [CrossRef]
  25. How, B.S.; Tan, K.Y.; Lam, H.L. Transportation Decision Tool for Optimisation of Integrated Biomass Flow with Vehicle Capacity Constraints. J. Clean. Prod. 2016, 136, 197–223. [Google Scholar] [CrossRef]
  26. Santibañez-Aguilar, J.E.; Rivera-Toledo, M.; Flores-Tlacuahuac, A.; Ponce-Ortega, J.M. A Mixed-Integer Dynamic Optimization Approach for the Optimal Planning of Distributed Biorefineries. Comput. Chem. Eng. 2015, 80, 37–62. [Google Scholar] [CrossRef]
  27. Liu, Z.; Qiu, T.; Chen, B. A Study of the LCA Based Biofuel Supply Chain Multi-Objective Optimization Model with Multi-Conversion Paths in China. Appl. Energy 2014, 126, 221–234. [Google Scholar] [CrossRef]
  28. Orjuela-Castro, J.A.; Aranda-Pinilla, J.A.; Moreno-Mantilla, C.E. Identifying Trade-Offs between Sustainability Dimensions in the Supply Chain of Biodiesel in Colombia. Comput. Electron. Agric. 2019, 161, 162–169. [Google Scholar] [CrossRef]
  29. Osmani, A.; Zhang, J. Multi-Period Stochastic Optimization of a Sustainable Multi-Feedstock Second Generation Bioethanol Supply Chain—A Logistic Case Study in Midwestern United States. Land Use Policy 2017, 61, 420–450. [Google Scholar] [CrossRef]
  30. Azadeh, A.; Vafa Arani, H.; Dashti, H. A Stochastic Programming Approach towards Optimization of Biofuel Supply Chain. Energy 2014, 76, 513–525. [Google Scholar] [CrossRef]
  31. Bairamzadeh, S.; Saidi-Mehrabad, M.; Pishvaee, M.S. Modelling Different Types of Uncertainty in Biofuel Supply Network Design and Planning: A Robust Optimization Approach. Renew. Energy 2018, 116, 500–517. [Google Scholar] [CrossRef]
  32. Ghelichi, Z.; Saidi-Mehrabad, M.; Pishvaee, M.S. A Stochastic Programming Approach toward Optimal Design and Planning of an Integrated Green Biodiesel Supply Chain Network under Uncertainty: A Case Study. Energy 2018, 156, 661–687. [Google Scholar] [CrossRef]
  33. Maheshwari, P.; Singla, S.; Shastri, Y. Resiliency Optimization of Biomass to Biofuel Supply Chain Incorporating Regional Biomass Pre-Processing Depots. Biomass Bioenergy 2017, 97, 116–131. [Google Scholar] [CrossRef]
  34. Mohseni, S.; Pishvaee, M.S. A Robust Programming Approach towards Design and Optimization of Microalgae-Based Biofuel Supply Chain. Comput. Ind. Eng. 2016, 100, 58–71. [Google Scholar] [CrossRef]
  35. Santibañez-Aguilar, J.E.; Morales-Rodriguez, R.; González-Campos, J.B.; Ponce-Ortega, J.M. Stochastic Design of Biorefinery Supply Chains Considering Economic and Environmental Objectives. J. Clean. Prod. 2016, 136, 224–245. [Google Scholar] [CrossRef]
  36. Sharifzadeh, M.; Garcia, M.C.; Shah, N. Supply Chain Network Design and Operation: Systematic Decision-Making for Centralized, Distributed, and Mobile Biofuel Production Using Mixed Integer Linear Programming (MILP) under Uncertainty. Biomass Bioenergy 2015, 81, 401–414. [Google Scholar] [CrossRef] [Green Version]
  37. Van Fan, Y.; Klemeš, J.J.; Walmsley, T.G.; Perry, S. Minimising Energy Consumption and Environmental Burden of Freight Transport Using a Novel Graphical Decision-Making Tool. Renew. Sustain. Energy Rev. 2019, 114, 1. [Google Scholar] [CrossRef]
  38. Lam, H.L.; Varbanov, P.S.; Klemeš, J.J. Optimisation of Regional Energy Supply Chains Utilising Renewables: P-Graph Approach. Comput. Chem. Eng. 2010, 34, 782–792. [Google Scholar] [CrossRef]
  39. Harahap, F.; Leduc, S.; Mesfun, S.; Khatiwada, D.; Kraxner, F.; Silveira, S. Opportunities to Optimize the Palm Oil Supply Chain in Sumatra, Indonesia. Energies 2019, 12, 420. [Google Scholar] [CrossRef] [Green Version]
  40. Hoo, P.Y.; Hashim, H.; Ho, W.S.; Yunus, N.A. Spatial-Economic Optimisation of Biomethane Injection into Natural Gas Grid: The Case at Southern Malaysia. J. Environ. Manag. 2019, 241, 603–611. [Google Scholar] [CrossRef]
  41. Zhang, F.; Wang, J.; Liu, S.; Zhang, S.; Sutherland, J.W. Integrating GIS with Optimization Method for a Biofuel Feedstock Supply Chain. Biomass Bioenergy 2017, 98, 194–205. [Google Scholar] [CrossRef]
  42. Asadi, E.; Habibi, F.; Nickel, S.; Sahebi, H. A Bi-Objective Stochastic Location-Inventory-Routing Model for Microalgae-Based Biofuel Supply Chain. Appl. Energy 2018, 228, 2235–2261. [Google Scholar] [CrossRef]
  43. Marufuzzaman, M.; Eksioglu, S.D.; Huang, Y. Two-Stage Stochastic Programming Supply Chain Model for Biodiesel Production via Wastewater Treatment. Comput. Oper. Res. 2014, 49, 1–17. [Google Scholar] [CrossRef]
  44. Poudel, S.; Marufuzzaman, M.; Quddus, M.A.; Chowdhury, S.; Bian, L.; Smith, B. Designing a Reliable and Congested Multi-Modal Facility Location Problem for Biofuel Supply Chain Network. Energies 2018, 11, 1682. [Google Scholar] [CrossRef] [Green Version]
  45. How, B.S.; Lam, H.L. Integrated Palm Biomass Supply Chain toward Sustainable Management. Chem. Prod. Process Model. 2017, 12, 1–19. [Google Scholar] [CrossRef]
  46. Ng, R.T.L.; Maravelias, C.T. Economic and Energetic Analysis of Biofuel Supply Chains. Appl. Energy 2017, 205, 1571–1582. [Google Scholar] [CrossRef]
  47. Geng, N.; Zhang, Y.; Sun, Y.; Geng, S. Optimization of Biodiesel Supply Chain Produced from Waste Cooking Oil: A Case Study in China. In IOP Conference Series: Earth and Environmental Science; IOP Publishing: Bristol, UK, 2019; Volume 264. [Google Scholar]
  48. Schlamadinger, B.; Faaij, A.P.C.; Daugherty, E. Should We Trade Biomass, Electricity, Renewable Certificates, or CO2 Credits? In IEA Bioenergy Task 38 40; IEA: Paris, France, 2004. [Google Scholar]
  49. Welfle, A. Balancing Growing Global Bioenergy Resource Demands—Brazil’s Biomass Potential and the Availability of Resource for Trade. Biomass Bioenergy 2017, 105, 83–95. [Google Scholar] [CrossRef]
  50. Junginger, M.; Goh, C.S.; Faaij, A. International Bioenergy Trade; Lect. Notes Energy; Springer: Berlin/Heidelberg, Germany, 2014. [Google Scholar]
  51. Lamers, P.; Hamelinck, C.; Junginger, M.; Faaij, A. International Bioenergy Trade—A Review of Past Developments in the Liquid Biofuel Market. Renew. Sustain. Energy Rev. 2011, 15, 2655–2676. [Google Scholar] [CrossRef]
  52. WBA (World Bioenegy Association). Biomass Supply Chains—Harvesting & Collection, Pre-Treatment & Upgrading, Storage, Transportation & Handling; World Bioenergy Association: Stockholm, Sweden, 2018. [Google Scholar]
  53. Laurijssen, J.; Faaij, A.P.C. Trading Biomass or GHG Emission Credits? Clim. Chang. 2009, 94, 287. [Google Scholar] [CrossRef] [Green Version]
  54. NREL (National Renewable Energy Laboratory). International Trade of Biofuels; NREL: Golden, CO, USA, 2013. [Google Scholar]
  55. Deng, Y.Y.; Koper, M.; Haigh, M.; Dornburg, V. Country-Level Assessment of Long-Term Global Bioenergy Potential. Biomass Bioenergy 2015, 74, 253–267. [Google Scholar] [CrossRef] [Green Version]
  56. Lamers, P.; Hoefnagels, R.; Junginger, M.; Hamelinck, C.; Faaij, A. Global Solid Biomass Trade for Energy by 2020: An Assessment of Potential Import Streams and Supply Costs to North-West Europe under Different Sustainability Constraints. GCB Bioenergy 2015, 7, 618–634. [Google Scholar] [CrossRef] [Green Version]
  57. Diesenreiter, F.; Kranzl, L. Approaches for Modelling the International Trade of Biomass for Bioenergy (to Evaluate Its Impacts on Bioenergy Markets). Available online: www.researchgate.net/publication/228558774_Approaches_for_modelling_the_international_trade_of_Biomass_for_Bioenergy_to_evaluate_its_impacts_on_bioenergy_markets (accessed on 11 February 2020).
  58. Solberg, B.; Dornburg, V.; Bolkesjø, T.F.; Faaij, A.; Junginger, M.; Trømborg, E. Bioenergy and Biomass Trade: Evaluation of Models’ Suitability for Analysing International Trade of Biomass and Bioenergy Products; Norwegian University of Life Sciences: Aas, Norway; Copernicus Institute, Utretch University: Utretch, The Netherlands, 2007. [Google Scholar]
  59. Hoefnagels, R.; Kluts, I.; Junginger, M.; Visser, L.; Resch, G.; Mantau, U.; Pelkmans, L.; Devriendt, N. Sustainable and Optimal Use of Biomass for Energy in the EU beyond 2020; European Commission: Brussels, Belgium, 2017. [Google Scholar]
  60. Van Bergeijk, P.A.G.; Brakman, S. The Gravity Model in International Trade: Advances and Applications; Van Bergeijk, P.A.G., Brakman, S., Eds.; Cambridge University Press: Cambridge, UK, 2010. [Google Scholar]
  61. Baldwin, R.; Taglioni, D. Gravity Chains Estimating Bilateral Trade Flows When Parts and Components Trade Is Important; ECB (European Central Bank): Frankfurt, Germany, 2011. [Google Scholar]
  62. Röttgers, D.; Faße, A.; Ulrike, G. The Canola Oil Industry and EU Trade Integration: A Gravity Model Approach. In Proceedings of the German Development Economics Conference 2010, Hannover, Germany, 18–19 June 2010; p. 32. [Google Scholar]
  63. Rentizelas, A.; Melo, I.C.; Alves Junior, P.N.; Campoli, J.S.; Aparecida do Nascimento Rebelatto, D. Multi-Criteria Efficiency Assessment of International Biomass Supply Chain Pathways Using Data Envelopment Analysis. J. Clean. Prod. 2019, 237, 117690. [Google Scholar] [CrossRef]
  64. Matzenberger, J.; Kranzl, L.; Tromborg, E.; Junginger, M.; Daioglou, V.; Sheng Goh, C.; Keramidas, K. Future Perspectives of International Bioenergy Trade. Renew. Sustain. Energy Rev. 2015, 43, 926–941. [Google Scholar] [CrossRef]
  65. Čuček, L.; Varbanov, P.S.; Klemeš, J.J.; Kravanja, Z. Total Footprints-Based Multi-Criteria Optimisation of Regional Biomass Energy Supply Chains. Energy 2012, 44, 135–145. [Google Scholar] [CrossRef]
  66. Jonkman, J.; Kanellopoulos, A.; Bloemhof, J.M. Designing an Eco-Efficient Biomass-Based Supply Chain Using a Multi-Actor Optimisation Model. J. Clean. Prod. 2019, 210, 1065–1075. [Google Scholar] [CrossRef]
  67. Lee, C.Y.; Sun, W.C.; Li, Y.H. Biodiesel Economic Evaluation and Biomass Planting Allocation Oprimisation in Global Supply Chain. IEEE Trans. Eng. Manag. 2019, 1–14. [Google Scholar] [CrossRef]
  68. De Matta, R.; Miller, T. Formation of a Strategic Manufacturing and Distribution Network with Transfer Prices. Eur. J. Oper. Res. 2015, 241, 435–448. [Google Scholar] [CrossRef]
  69. Gonela, V.; Zhang, J.; Osmani, A.; Onyeaghala, R. Stochastic Optimization of Sustainable Hybrid Generation Bioethanol Supply Chains. Transp. Res. Part E Logist. Transp. Rev. 2015, 77, 1–28. [Google Scholar] [CrossRef]
  70. Razm, S.; Nickel, S.; Sahebi, H. A Multi-Objective Mathematical Model to Redesign of Global Sustainable Bioenergy Supply Network. Comput. Chem. Eng. 2019, 128, 1–20. [Google Scholar] [CrossRef]
  71. Proskurina, S.; Junginger, M.; Heinimö, J.; Vakkilainen, E. Global Biomass Trade for Energy—Part 1: Statistical and Methodological Considerations. Biofuels Bioprod. Biorefin. 2019, 13, 358–370. [Google Scholar] [CrossRef]
  72. Fingerman, K.R.; Nabuurs, G.J.; Iriarte, L.; Fritsche, U.R.; Staritsky, I.; Visser, L.; Mai-Moulin, T.; Junginger, M. Opportunities and Risks for Sustainable Biomass Export from the South-Eastern United States to Europe. Biofuels Bioprod. Biorefin. 2019, 13, 281–292. [Google Scholar] [CrossRef]
  73. Pelkmans, L.; Van Dael, M.; Junginger, M.; Fritsche, U.R.; Diaz-Chavez, R.; Nabuurs, G.J.; Del Campo Colmenar, I.; Gonzalez, D.S.; Rutz, D.; Janssen, R. Long-Term Strategies for Sustainable Biomass Imports in European Bioenergy Markets. Biofuels Bioprod. Biorefin. 2019, 13, 388–404. [Google Scholar] [CrossRef]
  74. IRENA (International Renewable Energy Agency); ACE (ASEAN Centre for Energy). Renewable Energy Outlook for ASEAN; IRENA: Abu Dhabi, UAE; ACE: Jakarta, Indonesia, 2016. [Google Scholar]
  75. Masjuki, H.H.; Kalam, M.A.; Mofijur, M.; Shahabuddin, M. Biofuel: Policy, Standardization and Recommendation for Sustainable Future Energy Supply. Energy Procedia 2013, 42, 577–586. [Google Scholar] [CrossRef] [Green Version]
  76. MIDA (Malaysian Investment Development Authority). Time to Implement Malaysia’s Biodiesel Mandate. Available online: www.mida.gov.my/home/6751/news/time-to-implement-malaysia-s-biodiesel-mandate/ (accessed on 27 December 2019).
  77. Abdul-Manan, A.F.N.; Baharuddin, A.; Chang, L.W. A Detailed Survey of the Palm and Biodiesel Industry Landscape in Malaysia. Energy 2014, 76, 931–941. [Google Scholar] [CrossRef]
  78. MPI (Ministry of Primary Industry). Malaysia Biofuel Programme. Available online: mpi.gov.my/index.php/en/media-2/mpic-in-the-news/255-mpic-di-dalam-akhbar-2019/berita-biobahan-api/575-program-biobahan-api-malaysia-bi (accessed on 27 December 2019).
  79. Zainal, H. B7 Biodiesel to Be Launched to Replace B5 at Petrol Stations from Nov 1. Available online: www.thestar.com.my/news/nation/2014/10/29/b7-biodiesel-to-be-launched-lower-emission-fuel-to-replace-b5-at-petrol-stations-from-nov-1 (accessed on 27 December 2019).
  80. Wahab, A.G. Malaysia Biofuels Annual; United States Department of Agriculture (USDA) Global Agricultural Information Network (GAIN): Washington, DC, USA, 2018.
  81. MPOC (Malaysian Palm Oil Council). Palm Oil: B7 and B10 Biodiesel Will Use 450,000 Tonnes Additional CPO. Available online: mpi.gov.my/index.php/en/media-2/mpic-in-the-news/254-news-b10/2112-palm-oil-b7-and-b10-biodiesel-will-use-450-000-tonnes-additional-cpo (accessed on 27 December 2019).
  82. Wahab, A.G. Malaysia Biofuels Annual; United States Department of Agriculture (USDA) Global Agricultural Information Network (GAIN): Washington, DC, USA, 2019.
  83. Tye, Y.Y.; Lee, K.T.; Wan Abdullah, W.N.; Leh, C.P. Second-Generation Bioethanol as a Sustainable Energy Source in Malaysia Transportation Sector: Status, Potential and Future Prospects. Renew. Sustain. Energy Rev. 2011, 15, 4521–4536. [Google Scholar] [CrossRef]
  84. Derman, E.; Abdulla, R.; Marbawi, H.; Sabullah, M.K. Oil Palm Empty Fruit Bunches as a Promising Feedstock for Bioethanol Production in Malaysia. Renew. Energy 2018, 129, 285–298. [Google Scholar] [CrossRef]
  85. Abdulrazik, A.; Elsholkami, M.; Elkamel, A.; Simon, L. Multi-Products Productions from Malaysian Oil Palm Empty Fruit Bunch (EFB): Analyzing Economic Potentials from the Optimal Biomass Supply Chain. J. Clean. Prod. 2017, 168, 131–148. [Google Scholar] [CrossRef] [Green Version]
  86. Rahmadi, A.; Aye, L.; Moore, G. The Feasibility and Implications for Conventional Liquid Fossil Fuel of the Indonesian Biofuel Target in 2025. Energy Policy 2013, 61, 12–21. [Google Scholar] [CrossRef]
  87. Putrasari, Y.; Praptijanto, A.; Santoso, W.B.; Lim, O. Resources, Policy, and Research Activities of Biofuel in Indonesia: A Review. Energy Rep. 2016, 2, 237–245. [Google Scholar] [CrossRef] [Green Version]
  88. Ministry of Energy and Mineral Resources Indonesia. Bioenergy in Indonesia: Rules and Implementations. Available online: www.ieabioenergy.com/wp-content/uploads/2018/09/1.5-Elis-Heviati.pdf (accessed on 27 December 2019).
  89. REUTERS. Indonesia Launches B30 Biodiesel to Cut Costs, Boost Palm Oil. Available online: www.theedgemarkets.com/article/indonesia-launches-b30-biodiesel-cut-costs-boost-palm-oil (accessed on 27 December 2019).
  90. Lecksiwilai, N.; Gheewala, S.H.; Silalertruksa, T.; Mungkalasiri, J. LCA of Biofuels in Thailand Using Thai Ecological Scarcity Method. J. Clean. Prod. 2017, 142, 1183–1191. [Google Scholar] [CrossRef]
  91. Thailand Ministry of Energy. Thailand Power Development Plan. Available online: www.eppo.go.th/index.php/en/policy-and-plan/en-tieb/tieb-pdp (accessed on 27 December 2019).
  92. Bloyd, C. Thailand Alternative Fuels Update 2017; United State Department of Energy: Washington, WA, USA, 2017.
  93. Hong, C.S. Thailand’s Renewable Energy Transitions: A Pathway to Realize Thailand 4.0. Available online: thediplomat.com/2019/03/thailands-renewable-energy-transitions-a-pathway-to-realize-thailand-4-0/ (accessed on 27 December 2019).
  94. Oils & Fats International. B10 Biodiesel Introduced in Thailand. Available online: www.ofimagazine.com/news/b10-biodiesel-introduced-in-thailand (accessed on 27 December 2019).
  95. Sapp, M. Thai B20 Mandate Set for End-April. Available online: www.biofuelsdigest.com/bdigest/2019/04/08/thai-b20-mandate-set-for-end-april/ (accessed on 27 December 2019).
  96. Asia Biomass Office. Introduction Status for Biofuel in Thailand. Available online: www.asiabiomass.jp/english/topics/1505_01.html (accessed on 27 December 2019).
  97. Permpool, N.; Bonnet, S.; Gheewala, S.H. Greenhouse Gas Emissions from Land Use Change Due to Oil Palm Expansion in Thailand for Biodiesel Production. J. Clean. Prod. 2016, 134(Pt. B), 532–538. [Google Scholar] [CrossRef]
  98. Mukherjee, I.; Sovacool, B.K. Palm Oil-Based Biofuels and Sustainability in Southeast Asia: A Review of Indonesia, Malaysia, and Thailand. Renew. Sustain. Energy Rev. 2014, 37, 1–12. [Google Scholar] [CrossRef]
  99. Abdul-Manan, A.F.N.; Baharuddin, A.; Chang, L.W. Application of Theory-Based Evaluation for the Critical Analysis of National Biofuel Policy: A Case Study in Malaysia. Eval. Program Plan. 2015, 52, 39–49. [Google Scholar] [CrossRef] [PubMed]
  100. Čuček, L.; Klemeš, J.J.; Kravanja, Z. A Review of Footprint Analysis Tools for Monitoring Impacts on Sustainability. J. Clean. Prod. 2012, 34, 9–20. [Google Scholar] [CrossRef]
  101. Tan, K.T.; Lee, K.T.; Mohamed, A.R.; Bhatia, S. Palm Oil: Addressing Issues and towards Sustainable Development. Renew. Sustain. Energy Rev. 2009, 13, 420–427. [Google Scholar] [CrossRef]
  102. Chien Bong, C.P.; Ho, W.S.; Hashim, H.; Lim, J.S.; Ho, C.S.; Peng Tan, W.S.; Lee, C.T. Review on the Renewable Energy and Solid Waste Management Policies towards Biogas Development in Malaysia. Renew. Sustain. Energy Rev. 2017, 70, 988–998. [Google Scholar] [CrossRef]
  103. Maulia, E.; Kumar, P.P. Palm Oil: Indonesia and Malaysia Push Back as EU Clamps Down. Available online: asia.nikkei.com/Spotlight/Asia-Insight/Palm-oil-Indonesia-and-Malaysia-push-back-as-EU-clamps-down (accessed on 27 December 2019).
  104. Kraxner, F.; Nordström, E.M.; Havlík, P.; Gusti, M.; Mosnier, A.; Frank, S.; Valin, H.; Fritz, S.; Fuss, S.; Kindermann, G.; et al. Global Bioenergy Scenarios—Future Forest Development, Land-Use Implications, and Trade-Offs. Biomass Bioenergy 2013, 57, 86–96. [Google Scholar] [CrossRef]
  105. Chanthawong, A.; Dhakal, S.; Jongwanich, J. Supply and Demand of Biofuels in the Fuel Market of Thailand: Two Stage Least Square and Three Least Square Approaches. Energy 2016, 114, 431–443. [Google Scholar] [CrossRef]
  106. Mekhilef, S.; Siga, S.; Saidur, R. A Review on Palm Oil Biodiesel as a Source of Renewable Fuel. Renew. Sustain. Energy Rev. 2011, 15, 1937–1949. [Google Scholar] [CrossRef]
  107. EPA (Environmental Protection Agency). Renewable Fuel Annual Standards. Available online: https://www.epa.gov/renewable-fuel-standard-program/renewable-fuel-annual-standards (accessed on 3 February 2020).
  108. Shafie, S.M.; Mahlia, T.M.I.; Masjuki, H.H.; Andriyana, A. Current Energy Usage and Sustainable Energy in Malaysia: A Review. Renew. Sustain. Energy Rev. 2011, 15, 4370–4377. [Google Scholar] [CrossRef]
  109. Hosseini, S.E.; Wahid, M.A. Necessity of Biodiesel Utilization as a Source of Renewable Energy in Malaysia. Renew. Sustain. Energy Rev. 2012, 16, 5732–5740. [Google Scholar] [CrossRef]
Figure 1. An example of a biofuel supply chain.
Energies 13 01799 g001
Figure 2. Decision-making levels of biofuel supply chain.
Energies 13 01799 g002
Figure 3. Wood pellet trade flows, adapted from World Bioenergy Association [52].
Energies 13 01799 g003
Figure 4. The integrated modelling framework for international biomass (to energy) trade adapted from by Lamers et al. [56].
Energies 13 01799 g004
Figure 5. Model for international trade of biomass for energy. Please refer to Diesenreiter and Kranzl [57] and Solberg et al. [58] for the detailed discussion on each approach.
Energies 13 01799 g005
Table 1. Forecast growth vs required growth to meet the year 2030 target under SDS [1].
Country/RegionForecast Annual Production Growth in 2019–24 (%)Required Production Growth Needed to Meet SDS in 2019–30 (%)
USA16
EU0.58
Brazil3.56
India1122
China1617
ASEAN98
Table 2. ASEAN countries with comprehensive biofuel policy.
CountryPolicy/StrategyThe Biofuel Production Target for the Transportation SectorGovernment Ministries/Agencies
IndonesiaIndonesia National Energy Plan (Ministerial Regulation No. 22/2017) [3]30% biodiesel plan by 2025 (update: the government has announced B30 blending recently to start in January 2020 [4])Ministry of Energy and Mineral Resources (MEMR)
MalaysiaNational Biofuels Policy 2006 [5]B5 programme was launched in 2011 to encourage 5% biofuels blend (update: the government has announced the B10 biodiesel program starting December 2018 [6])Ministry of Plantation Industries and Commodities (MPIC) (renamed: Ministry of Primary Industries)
PhilippinesNational Biofuels Program (NBP) [7]1% ethanol blend by 2007, 2% by 2008, 5% by 2009, 10% blend by 2011 and increasing to 20 % by 2020. Meanwhile, 5% biodiesel blend by 2015 and 20% by 2025 (update: current biodiesel blend is at 2% [8])Department of Energy
ThailandAlternative Energy Development Plan (AEDP) 2015–2036 [9]25% RE share in the transportation sector by 2036Department of Renewable Energy Development and Energy Efficiency (2015), Ministry of Energy
VietnamThe scheme on Development of Biofuels up to 2015 with the Vision to 2025 (Decision No. 177/2007QD-TTg); National Strategy on Renewable Energy [10]Aims to produce 1.8 × 10⁶ tons of biofuels per year by 2025; to supply 5% of total transport fuel demand by 2020 and to raise to 13% by 2030.
(update: the government announced 5% mix of ethanol starting December 2014, however, was postponed to January 2018 [11])
Ministry of Industry and Trade
Table 3. Recent scientific publications on state-of-art of decision making for the biofuel supply chain.
SourceDecision LevelObj.Decision VariablesMethodCase Study
Aguayo et al. [15]TECTactical:
- minimum number of balers required
- harvest and routing decision
MP - MILPUSA
Ahn et al. [16]S + TECStrategic:
- refineries facility location and capacity
Tactical:
- feedstock sourcing location and amount
MP - MILPSouth Korea
Asadi et al. [42]S + TEC + ENStrategic:
- number and location of distribution facility
- allocation of extraction sites to these facilities
Tactical:
- minimum inventory level
- routing of extraction sites
H - algorithmIran
Azadeh et al. [30]SECStrategic:
- facility locations and capacities- technology and material flows
MP - MILPIran
Bairamzadeh et al. [31]S + TECStrategic:
- facilities location & capacity
- technology type
Tactical:
- biomass allocation
- inventory levels
- production amounts
- transportation among network
MP - MILPIran
Fan et al. [37]TEC + ENTactical:
- transportation mode selection
MP - LP + P-graphRotterdam to Antwerp, Netherlands and Genova, Italy
Foo et al. [18]TENTactical:
- plant capacity
- feedstock capacity
MP - LP + MILPMalaysia
Čuček et al. [17]SECStrategic:
- raw materials sourcing
- conversion technologies
- intermediate & final product flows
MP - MILPEU
Ghelichi et al. [32]S + TECStrategic:
- numbers, locations and capacities of cultivation and facility
Tactical:
- transportation mode allocation
- number of purchased and rented trucks
MP - MILPIran
Harahap et al. [39]SECStrategic:
- technology selection for biomass conversion
MP - MILP + GISSumatra, Indonesia
Hoo et al. [40]S + TECStrategic:
- facility location
- biomethane plant size
Tactical:
- transportation mode
MP – MILP + GISJohor, Malaysia
How and Lam [45]TEC + ENTactical:
- biomass allocation
- biomass transportation mode
MP - MILPJohor, Malaysia
How et al. [25]S + TECStrategic:
- processing hub selection
Tactical:
- biomass allocation
- transportation mode selection
MP - MINLPJohor, Malaysia
Lam et la. [38]SENStrategic:
- biomass supply chain network design
MP - LP + P-graphCentral European region
Liu et al. [27]SEC + EN + SOStrategic:
- optimal conversion pathway
- biomass type, locations
- facility locations
- network topology structure
MP - MILPChina
López et al. [24]SEC + ENStrategic:
- feedstocks type
- location of cultivation sites
- location of biomass facilities
- biomass conversion technologies
MP - MINLPCentral-west part of Mexico
Maheshwari et al. [33]SECStrategic:
- locations and capacities of pre-processing facility & biorefinery plant
- biomass and intermediate product flows
MP - MILPSouthern Illinois, USA
Marufuzzaman et al. [43]S + TEC + ENStrategic:
- transportation mode
- facility location
Tactical:
- inventory control
H - algorithmMississippi, USA
Miret et al. [19]S + TEC + EN + SOStrategic:
- facilities location
- process selection
Tactical:
- inventory
MP - MILPFrance
Mohseni and Pishvaee [34]S + TECStrategic:
- optimal production scale
Tactical:
- intermediate product and product flows
- amount of fertiliser needed
MP - MILPIran
Nana et al. [47]SEC + ENStrategic:
- facility location & capacity
MCDA - AHP + GISJiangsu, China
Ng and Maravelias [20]S + TECStrategic:
- biomass selection and allocation
- technology selection
- regional depots and biorefineries locations and capacity
Tactical:
- production, inventory and shipment
MP - MILPSouth Central, South of Wisconsin, USA
Ng and Maravelias [46]-EC + ENE-General methodNA
Ng et al. [21]T + OECTactical + operational:
- optimal blending ratio
MP - MILPMalaysia
Orjuela et al. [28]SEC + EN + SOStrategic:
- strategy/solution selection
MP - LPColumbia
Osmani and Zhang [29]SEC + EN + SOStrategic:
- land allocation for switchgrass cultivation
- locations and capacities of facility
- conversion technology
MP - MILPMidwestern USA
Poudel et al. [44]S + TECStrategic:
- facility location
Tactical:- production & storage
- routing plan
MP - MINLP; H - algorithmMississippi and Alabama, USA
Rabbani et al. [22]SECTactical:
- whether to purchase or rent the warehouses and plants
- selection of pre-processing centre
- selection of biofuel plants
- selection of warehouses to store biofuels
MP - MILPNA
Santibañez et al. [23]TEC + EN + SOTactical:
- feedstock produced
- feedstock transported
- feedstock arrived/accumulated
- product arrived/accumulated
MP - MILPMexico
Santibañez et al. [26]TECStrategic:
- processing facility and technology
Tactical:
- material flow
- inventory level
MP - MINLPMexico
Santibañez et al. [35]S + TEC + ENStrategic:
- facility location
technology type
Tactical:
- raw materials and products
- market
MP - MILPMexico
Sharifzadeh et al. [36]S + T + OECStrategic:
- number, type, location and size of processing plants and mobile pyrolyser
Tactical + operational:
- materials flowrates
MP - MILPLondon, Liverpool, UK
Zhang et al. [41]S + TECStrategic:
- facility location
Tactical:
- inventory level
MP - MILP + GISNorthern part of Michigan’s Lower Peninsula, USA
S—Strategic; T—Tactical; O—Operational; EC—Economic; EN—Environment; SO—Social; MP—Mathematical programming; H—Heuristic; MCDA—Multicriteria Decision Analysis
Table 4. Feedstock categorisation.
Agricultural ResiduesIndustrial WastewaterEnergy CropsMicroalgae
CSMRWSRSCRBSWRPRSRMSWWSWCOCWSPORORSOSFJSGWBSGSMSFRGSMA
[15]x
[16] x
[42] x
[30] xxxx x x
[31]x xx x
[17]x x x x x
[37]NS
[18] x
[32] x
[39] x x
[40] x xx
[45] x
[25] x xx
[38] x x x x
[27] x x xx
[24]x x x xx
[33]x xx
[43] x
[19] x x x
[34] x
[47] x
[20]x x
[46]x
[21] x x
[28] x
[29] x x
[44]x x
[22] x
[23] x x xx xxxx
[26] x x xx xxx x
[35] x x xx xxx x
[36] x x
[41] x
CS—corn stover; MR—mill residues; WS—wheat straw; RS—rice straw; CR—cotton residues; BS—barley straw; WR—wood residues; PR—palm residues; SR—sugarcane residues; MSW—municipal solid waste; WS—wastewater sludge; WCO—waste cooking oil; C—corn; W—wheat; S—sugarcane; PO—palm oil; RO—rapeseed oil; RSO—rubber seed oil; SF—sunflower; J—Jatropha; SG—sorghum; WB—woody biomass; SGS—switchgrass; M—Miscanthus; SFR—safflower; MA—microalgae; NF—not specified.

