Article

Parametric Investigation of a Trigeneration System with an Organic Rankine Cycle and Absorption Heat Pump Driven by Parabolic Trough Collectors for the Building Sector

by
Evangelos Bellos
* and
Christos Tzivanidis
Thermal Department, School of Mechanical Engineering, National Technical University of Athens, Zografou, Heroon Polytechniou 9, 15780 Athens, Greece
*
Author to whom correspondence should be addressed.
Energies 2020, 13(7), 1800; https://doi.org/10.3390/en13071800
Submission received: 11 March 2020 / Revised: 4 April 2020 / Accepted: 4 April 2020 / Published: 8 April 2020

Abstract

:
This article presents a simulation study which focuses on the thermodynamic analysis of a solar-driven trigeneration system for heating, cooling, and electricity production. The system uses parabolic trough collectors operating with Therminol VP-1 for feeding an organic Rankine cycle operating with toluene and an absorption heat pump operating with a LiBr–H2O working pair. The collecting area is selected at 100 m2 and the storage tank at 4 m3. The system is studied parametrically in order to examine the impact of various parameters on the system energy efficiency, system exergy efficiency, electricity production, heating production, and cooling production in the simple payback period of the investment. The examined parameters are the following: solar beam irradiation level, solar beam irradiation angle, superheating degree in the turbine inlet, pressure level in the turbine inlet, heat source temperature level, generator temperature level, and the heat input in the generator. For the nominal case of a 15 kW generator input, the electricity production is 6.3 kW, the heating production 11.5 kW, and the cooling production 10.7 kW. The system energy efficiency is 40.7%, while the system exergy efficiency is 12.7%. The financial investigation of the investment proved that it is viable with the simple payback period to be 8.1 years in the nominal case and it can be reduced to 7.8 years with an optimization procedure. Lastly, it has to be said that the examined system is found to be a viable configuration which is an ideal choice for application in the building sector. The analysis was conducted under steady-state conditions with a model developed using Engineering Equation Solver (EES).

1. Introduction

The exploitation of solar irradiation in solar trigeneration/polygeneration systems is a new idea that can create sustainable systems [1,2]. Usually, concentrating solar collectors are selected in these systems due to their ability to produce useful heat at high-temperature levels and consequently to manage the solar irradiation with relatively low exergy destruction [3]. Trigeneration and polygeneration systems are highly efficient units that can be used for producing many useful outputs with high-efficiency values [4]. The use of these units in the building sector has high compatibility because this sector presents various needs which are mainly translated into heating, cooling, and electricity demand. There are many options for coupling trigeneration systems which are ideal in the building sector, and thus this idea has been studied considerably in the literature [5]. Usually, solar irradiation is applied in these systems by using parabolic trough solar collectors (PTCs) which are the most mature solar concentrating technology at this time [6].
In the literature, different configurations of solar-driven trigeneration/polygeneration systems with PTCs can be found. The use of a water/steam Rankine cycle as the prime mover has been studied by Ozlu and Dincer [7]. They designed a system for cooling, heating, electricity, and hydrogen production which also incorporated an electrolyzer, absorption chiller, and wind turbine. They found an energy efficiency of 65% and an exergy efficiency of 43%. Sahoo et al. [8] investigated a system with a biomass boiler combined to the PTC, while the prime mover was also a water/steam Rankine cycle. They added a distillation unit for freshwater production, while the other useful outputs were cooling by an absorption chiller and electricity by the Rankine cycle. The system had 49% energy efficiency and 21% exergy efficiency.
The next part of the literature includes studies with an organic Rankine cycle (ORC) as the prime mover. More specifically, in these studies, the ORC is the device that manages high heat inputs by the solar field and produces electricity, so this device is the core of the examined system. Al-Sulaiman et al. [9] examined the incorporation of an ORC with an absorption chiller for trigeneration and they found 20% exergy efficiency. Bellos and Tzivanidis [10] optimized a similar configuration, and they found exergy efficiency around 29% and energy efficiency around 150%. The use of a two-stage ORC has been studied by Ahmadi et al. [11] in a polygeneration system which also includes two absorption heat pumps and an electrolyzed and a dryer unit. They found 21% energy efficiency and 14% exergy efficiency. Khalid et al. [12] studied an ORC-based system that operates with solar energy, geothermal energy, and wind energy. The energy and exergy efficiencies of this system were 76% and 7%, respectively. The use of an ORC coupled to a vapor compression cycle has been studied by Bellos et al. [13]. This configuration does not use an ACH, and so the investment cost is lower than that of other systems; however, there is a sacrifice in electricity production due to the consumption in the compressor. Solar energy through PTC and biomass energy is the heat input in this unit. The results proved that this system had 51% energy efficiency and 22% exergy efficiency, while the payback period was 5 years.
Moreover, some studies use gas turbines or internal combustion engines as prime movers. Baghernejad et al. [14] performed interesting work that investigated a system with a gas turbine and water/steam Rankine cycle which also included AHP and parabolic trough collectors for cooling, electricity, and heat production. The exergy efficiency of this unit was about 56%. The use of a piston engine as the prime mover has been studied by Li et al. [15]. They investigated a unit with an ACP, gasifier, heat exchangers, and cooling desiccant unit for trigeneration. The system had 19% exergy efficiency, while they found that the use of solar energy reduced the biomass consumption by 30%.
The previous literature review shows that there is a lot of interest in solar-driven trigeneration systems in order to produce many useful outputs with a renewable energy source. In this direction, the present work investigates a promising configuration that combines the most mature and usual devices in order to produce electricity, heating, and cooling. Parabolic trough collectors (PTCs) are used in order to properly exploit the incident solar irradiation. The solar field separately feeds the organic Rankine cycle (ORC) for electricity production and an absorption chiller (AHP) for heating and cooling production. This system is a simple topology that makes possible the production of the main energy demands of a building with well-established technologies. Therefore, the installation of this system can be done easily without the high cost and the need for developing new technologies. The present work studies this unit in a detailed way by performing parametric studies for different design scenarios and different solar potential cases. Moreover, the final results are also expressed in yearly performance terms, and simple financial analysis is conducted in order to have a multilateral image of the system sustainability. The final results of this work clearly indicate the energy, exergy, and financial behaviors of this unit and they can be directly used for the design of future solar-driven trigeneration systems. The analysis was conducted under steady-state conditions with a model developed by Engineering Equation Solver (EES) [16].

2. Material and Methods

2.1. The Studied Solar-Driven Trigeneration System

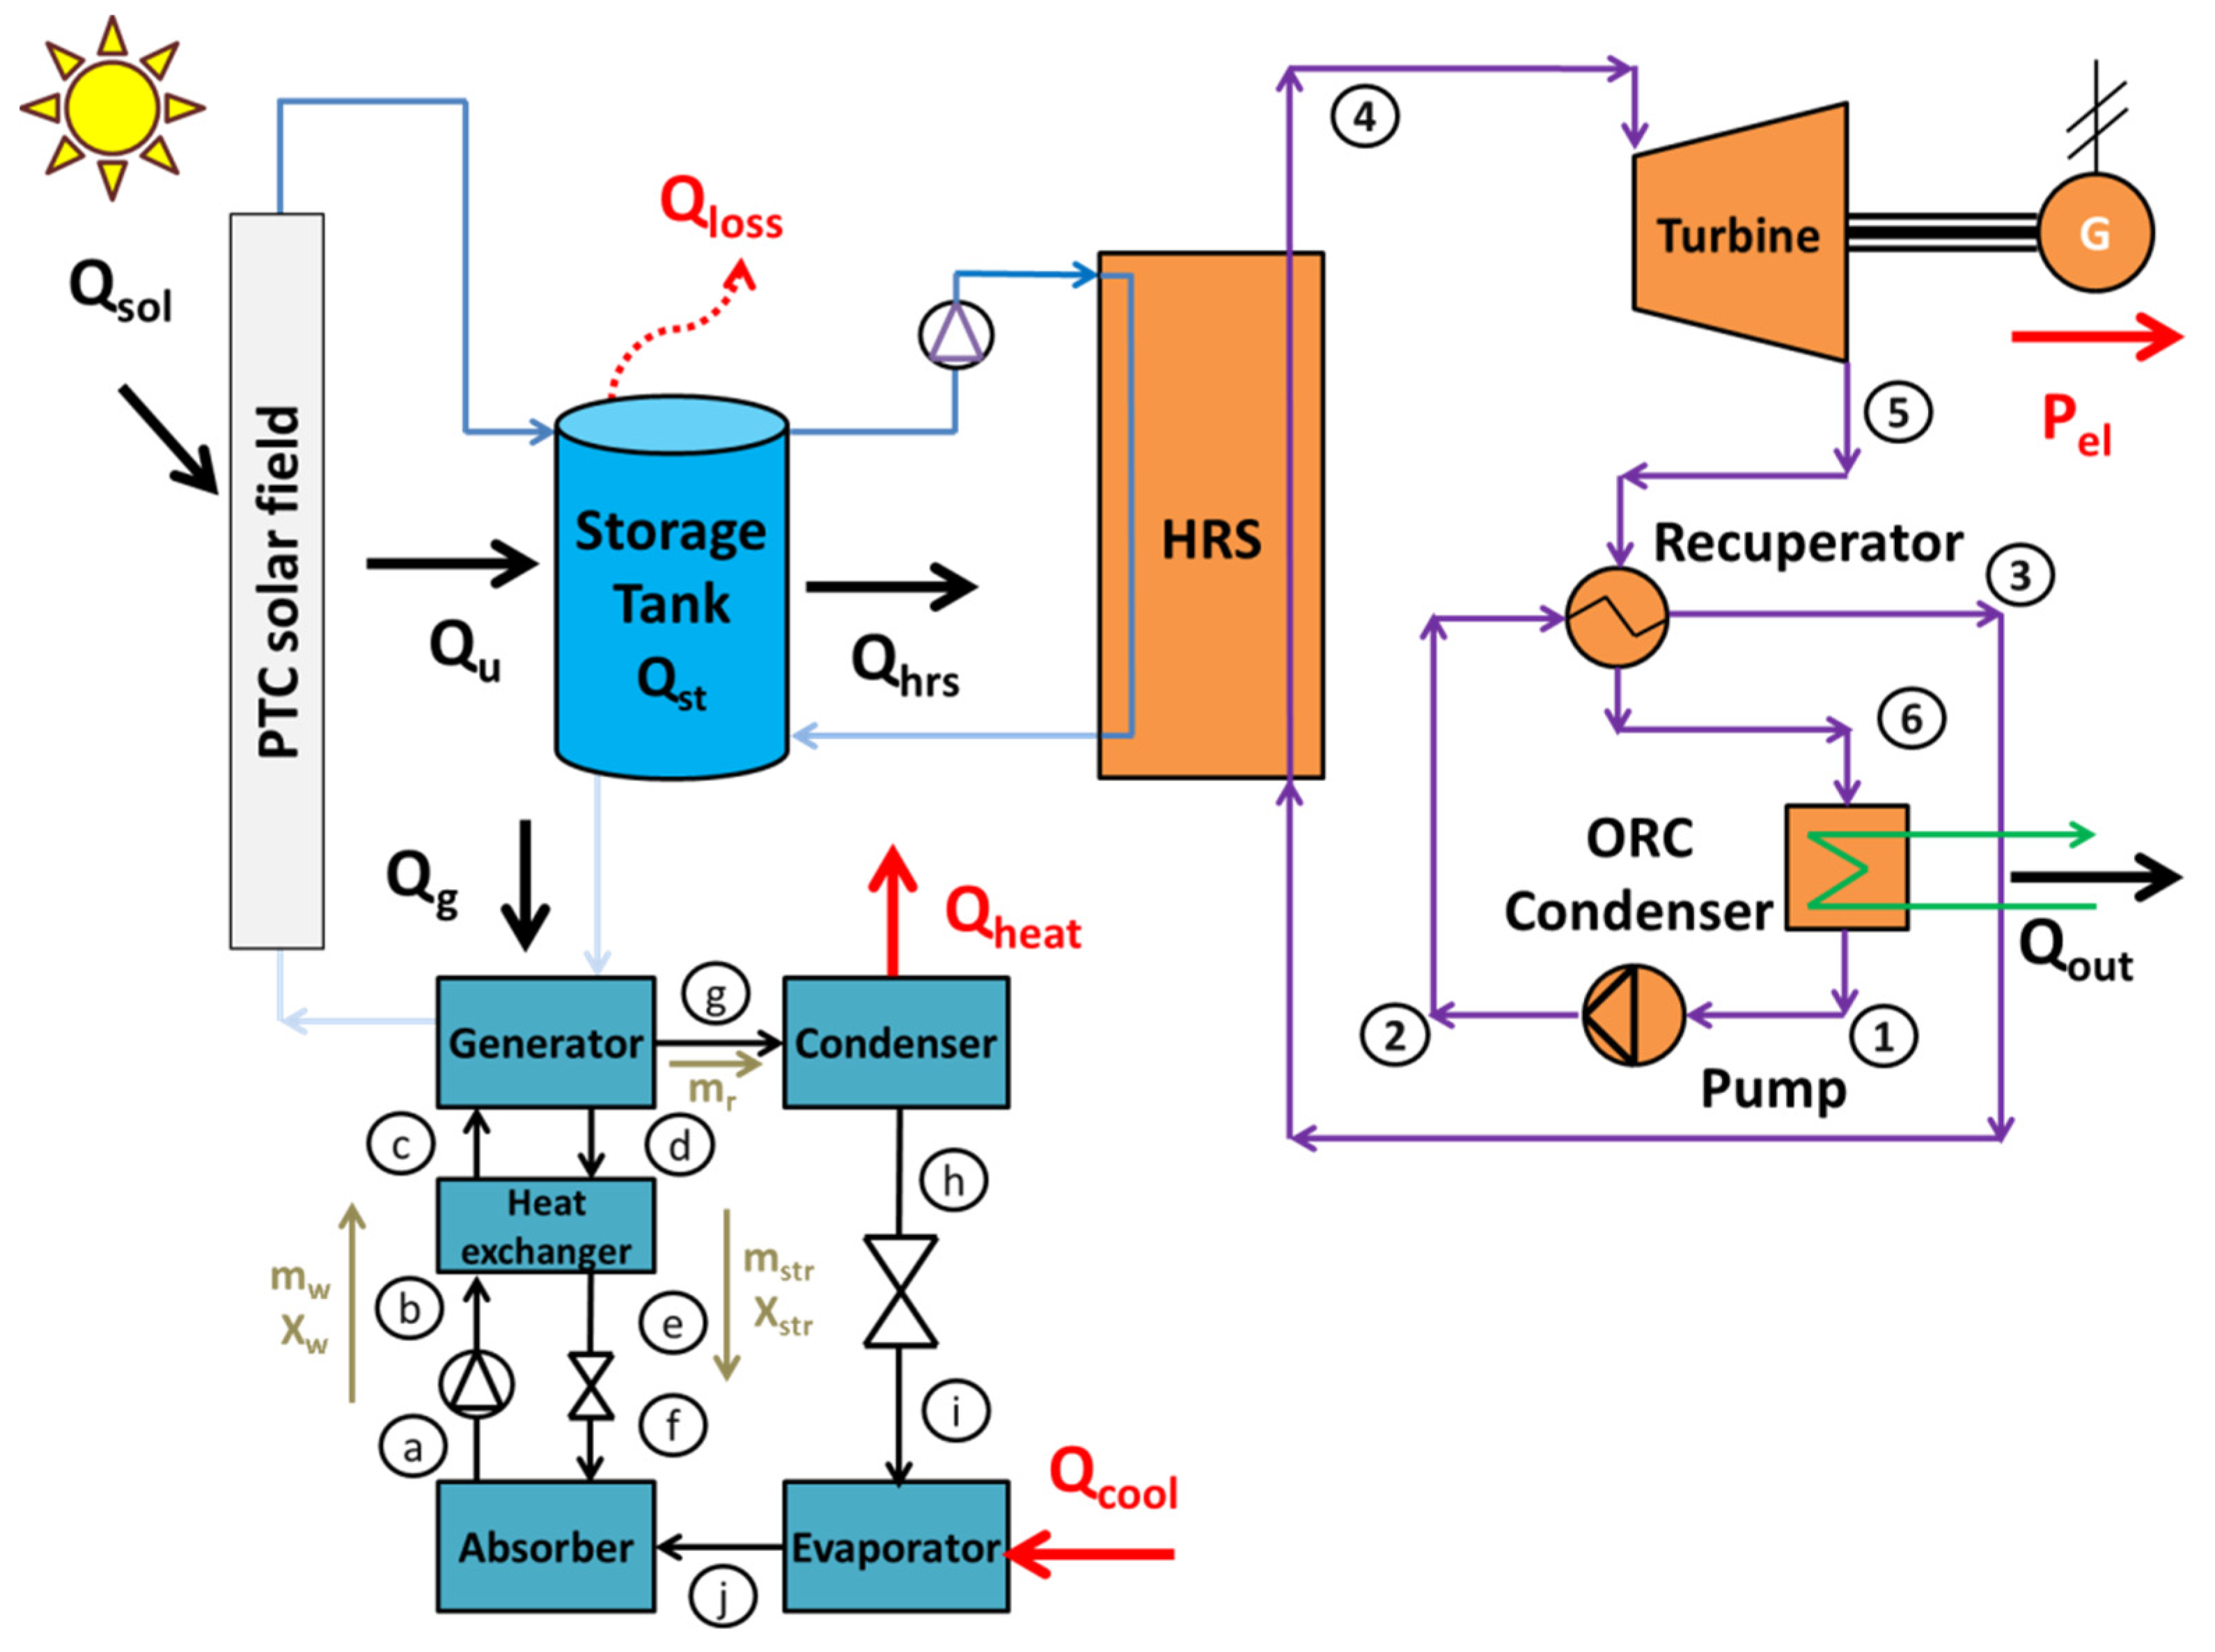
Figure 1 shows the examined system which includes parabolic trough collectors (PTCs), a storage tank, an absorption heat pump (AHP), and an organic Rankine cycle (ORC). The ORC and the AHP share the same heat source which is the useful heat production by the solar field. The PTC field has the characteristic of the EuroTrough PTC [17,18] which is a usual choice in the literature. The collecting area (Acol) is selected at 100 m2 in all cases, while the storage tank volume (Vtank) is 4 m3 [19]. These values are the basic inputs of this work and they determine the levels of the produced useful outputs. The use of a collecting area at 100 m2 is a reasonable value for building applications due to the land restrictions in cities (installation on a roof). The thermal loss coefficient of the storage tank (UT) is selected at 0.5 W/m2K [20]. The working fluid in the solar field is Therminol VP-1 [21], which can operate up to 400 °C, and its flow rate (mcol) is selected at 2 kg/s in order to obey the general rule of the specific flow rate of 0.02 kg s−1 m−2 [22]. This working fluid is a usual choice in the literature and in real systems, and thus it has been selected in this work.
The absorption heat pump is a single-stage machine that operates with LiBr–H2O and it has a solution heat exchanger. The cooling is produced at 5 °C, the heat is rejected at 40 °C in the absorber, while the heating is produced at 60 °C through the condenser. The ORC is a regenerative cycle that operates with toluene as the working fluid which is the best choice exergetically for trigeneration systems, according to Ref. [10]. More specifically, the use of toluene is able to increase electricity production which is very important for the present system. Moreover, the absorption heat pump is not directly coupled to the ORC, so the selection of toluene has no impact on the cooling and the heating productions. The heat is rejected in the condenser at 40 °C, the pinch point (PP) in the heat recovery system (HRS) is selected at 5 K, and the minimum temperature difference in the recuperator (ΔΤrec) at 10 K [10].
The system is examined parametrically in order to determine the impact of various parameters on its energy and exergy performance, and typical weather data for Athens (Greece) were used for estimating its yearly performance and its financial viability. Lastly, it has to be commented that the absorption heat pump is a device that properly manages the cooling production (which is an input) and it partially converts the cooling input into heating. This fact explains why the sum of heating and cooling is greater than the generator input.

2.2. Mathematical Modeling

2.2.1. Solar Field Modeling

The thermal efficiency of the PTC (ηth,col) can be found according to the following formula for the EuroTrough module [17,18]
η t h , c o l = 0.7408 · K ( θ ) 0.0432 · T c o l , i n T a m G b 0.000503 · ( T c o l , i n T a m ) 2 G b
The incident angle modifier (K) of the PTC is dependent on the eth incident angle on the aperture (θ) and it is calculated as below [23]:
K ( θ ) = cos ( θ ) 5.25091 · 10 4 · θ 2.859621 · 10 5 · θ 2
The useful heat that the PTC produces (Qu) is given as:
Q u = m c o l · c p · ( T c o l , o u t T c o l , i n )
The solar beam irradiation on the collector aperture (Qsol) is calculated as:
Q s o l = G b · A c o l
Moreover, the collector thermal efficiency (ηth,col) is defined as below:
η t h , c o l = Q u Q s o l
The heat input in the generator (Qgen) can be written as:
Q g = m c o l · c p · ( T g , i n T g , o u t )
In this work, the outlet temperature of the thermal oil from the generator is equal to the inlet temperature in the solar field (Tg,out = Tcol,in), while the inlet oil temperature in the generator is equal to the mean storage tank temperature (Tg,in = Tst). In every case, the minimum temperature difference is not smaller than 5 K in order to have a proper heat exchange.
The general energy balance in the solar field can be written as below:
Q s t = ( Q u Q g ) Q h r s Q l o s s
where (Qloss) is the storage tank thermal losses.

2.2.2. Organic Rankine Cycle Modeling

The work production in the turbine shaft (WT) can be calculated as below:
W T = m o r c · ( h 4 h 5 )
The pumping work demand (Wp) is calculated as:
W p = m o r c · Δ P ρ 1 · η m o t o r
The turbine isentropic efficiency (ηis,T) is selected to be 85% [24] and it is defined as:
η i s , T = h 4 h 5 h 4 h 5 , i s
The net electricity production (Pel) of the ORC can be calculated as:
P e l = η g · η m · W T W p
The electrical generator efficiency (ηg) is 98%, and the shaft mechanical efficiency (ηm) is 99% which are reasonable values.
Moreover, the heat input in the heat recovery system (Qhrs) can be written as:
Q h r s = m o r c · ( h 4 h 3 )

2.2.3. Absorption Heat Pump Modeling

The examined absorption heat pump is a single-stage machine which operates with the LiBr–H2O working pair. Below, the main equations for the AHP modeling are given.
The cooling production (Qcool) is calculated as below:
Q c o o l = m r · ( h j h i )
The generator heat input energy (Qg) is calculated as:
Q g = m r · h g + m s t r · h d m w · h c
The absorber heat rejection (Qa) is calculated as:
Q a = m r · h j + m s t r · h f m w · h a
The heating production in the condenser (Qheat) is calculated as:
Q h e a t = m r · ( h g h h )
The effectiveness of the solution heat exchanger (ηhex) is defined below:
η h e x = h d h e h d h b
In this work, this efficiency is selected at 60% [19] which is a typical value.
The energy balance in the solution heat exchanger is given below:
m w · ( h c h b ) = m s t r · ( h d h e )
The work input in the solution heat pump is practically negligible; therefore:
h b = h a
The processes in the throttling valves are adiabatic:
h f = h e
h i = h h
The total mass flow rate balance in the generator can be written as:
m w = m s t r + m r
The mass flow rate balance of the LiBr substance in the generator can be written as:
X w · m w = X s t r · m s t r
Moreover, it is important that the state point “j” is assumed to be saturated vapor and the state point “h” saturated liquid.

2.2.4. System Evaluation Criteria

The energy efficiency of the system (ηen) is defined as:
η e n = P e l + Q c o o l + Q h e a t Q s o l
The exergy efficiency of the system (ηex) is defined as:
η e x = P e l + Q c o o l · ( T 0 T e 1 ) + Q h e a t · ( 1 T 0 T h e a t ) Q s o l · [ 1 4 3 · T 0 T s u n + 1 3 · ( T 0 T s u n ) 4 ]
The exergy flow of solar beam irradiation is modeled by using the Petela model [25]. The temperature levels in the previous equation have to be in Kelvin units, the sun temperature level (Tsun) is selected at 5770 K, and the reference temperature level (T0) is selected at 298.15 K.
The financial evaluation is conducted by using the simple payback period (SPP) as the proper evaluation criterion. This index is calculated as below:
S P P = C 0 T i m e · C F
The system capital cost of the system (C0) is calculated as below:
C 0 = K c o l · A c o l + K t a n k · V t a n k + K o r c · P e l + K A H P · Q c o o l
Moreover, it has to be said that Table 1 includes the values used for the specific costs. The operating period (Time) is selected at 2500 h per year which is a reasonable value for Athens (Greece) [20].
The hourly system cash flow (CF) can be written as:
C F = P e l · K e l + Q h e a t · K h e a t + Q c o o l · K c o o l K O & M T i m e
The operation and maintenance cost (KO&M) is estimated to be 1% of the capital cost (KO&M = 0.01∙C0). The electricity cost is selected at 0.20 €/kWhel, the heating cost at 0.10 €/kWhheat, and the cooling cost at 0.067 €/kWhcool [26].

2.3. Followed Methodology

The present work investigates a solar-driven trigeneration system under steady-state conditions. Mathematical modeling was performed according to the equations of Section 2.2 in the program Engineering Equation Solver (EES). Table 1 includes the main parameters of this work which are used in all the cases. The system is studied parametrically by changing the value of one parameter every time and by keeping the other parameters constant at this time. Table 2 includes the default values and the range of the parameters that are used in the parametric analysis. These values have been selected to have reasonable values that correspond to real operating conditions and they have been tested in preliminary studies of the developed program. Among the parameters, there are two parameters which have not defined yet and they are explained below:
The pressure ratio (α) is the ratio of the turbine inlet (phigh) to the critical pressure of the toluene (pcrit) which is 41.26 bar. This parameter practically is equivalent to the high-pressure level in the ORC cycle. The maximum value of the parameter (α) is selected to be 90% for safety reasons.
a = p h i g h p c r i t
The other parameter is the heat source temperature difference (ΔΤs) and it is defined as the temperature difference between the heat source temperature in the HRS (Ts,in) and the minimum possible heat source temperature. The minimum possible value is the lowest possible value for having a pinch point of 5 K in the evaporator start. Moreover, the saturation temperature (Tsat) is dependent on the value of the parameter (α) in every scenario.
Δ Τ s = T s , i n ( T s a t + Δ T s h + P P )
The following pertains to the selection of the solar irradiation level, solar angle, and yearly operating hours. These data correspond to the weather data for the location of Athens (Greece). The solar beam irradiation level was selected at 700 W/m2 because this is the mean value for the year under sunny conditions. The solar angle of 30° gives an incident angle modifier close to the mean yearly value for PTC in Athens [28]. Moreover, a simple analysis of the effective sunny hours with a positive product (K(θ)⋯Gb) indicated about 2500 h. Therefore, these selected values can lead to representative results for the weather conditions in the examined location, in accordance with Ref. [28]. The generator heat input is selected at 15 kW in order to give heating and cooling values close to 10 kW which are suitable values for a system like the present one. The superheating is selected at 20 K in order not to be too high, which usually occurs in ORCs. The zero heat source temperature difference and the maximum pressure ratio are the optimum results for Ref. [10] and thus they are selected to be the default values. The generator temperature is selected to have a relatively high value in order to achieve an adequate coefficient of performance, and also the crystallization limitation has been taken into consideration. Another important issue regards the validation of the used models. The validation and verification procedures of the AHP and of the ORC are included in our previous work; see Ref. [10], so there is no reason for including these data again. Moreover, this work is a simulation study and not an experiment, so there is no possibility of calculating “errors” from the obtained results. Strict convergence criteria have been applied, and so the results are presented with high accuracy.
In the last part of this work, an optimization procedure has been performed in order to determine the optimum design for achieving minimum SPP. The parameters that have been studied, as optimization variables, are the generator temperature, the pressure ratio, and the superheating. The range of the optimization variables follows the limits of Table 3, while the other parameters have the default values of Table 3. The optimization procedure is supported by EES software.

3. Results

The results of this work are expressed in terms of energy efficiency, exergy efficiency, simple payback period, hourly cash flow rate, electricity, and cooling and heating production. Section 3.1 presents the parametric analysis for different ORC parameters, Section 3.2 the AHP parameters, and Section 3.3 the parametric studies for different solar potential cases. Section 3.4 includes results about the yearly performance as well as discussion comments. It is useful to state the main results of the default case (according to Table 3). In this case, the electricity production is 6.31 kW, the heating production 11.53 kW, the cooling production 10.67%, the energy efficiency 40.72%, the exergy efficiency 12.71%, the payback period 8.1 years, and the hourly cash flow rate 3.13 €/h. Moreover, it is interesting to state that the coefficient of performance for the absorption heat pump is 0.711 for cooling and 0.769 for heating.

3.1. Variation of the Parameters in the Organic Rankine Cycle

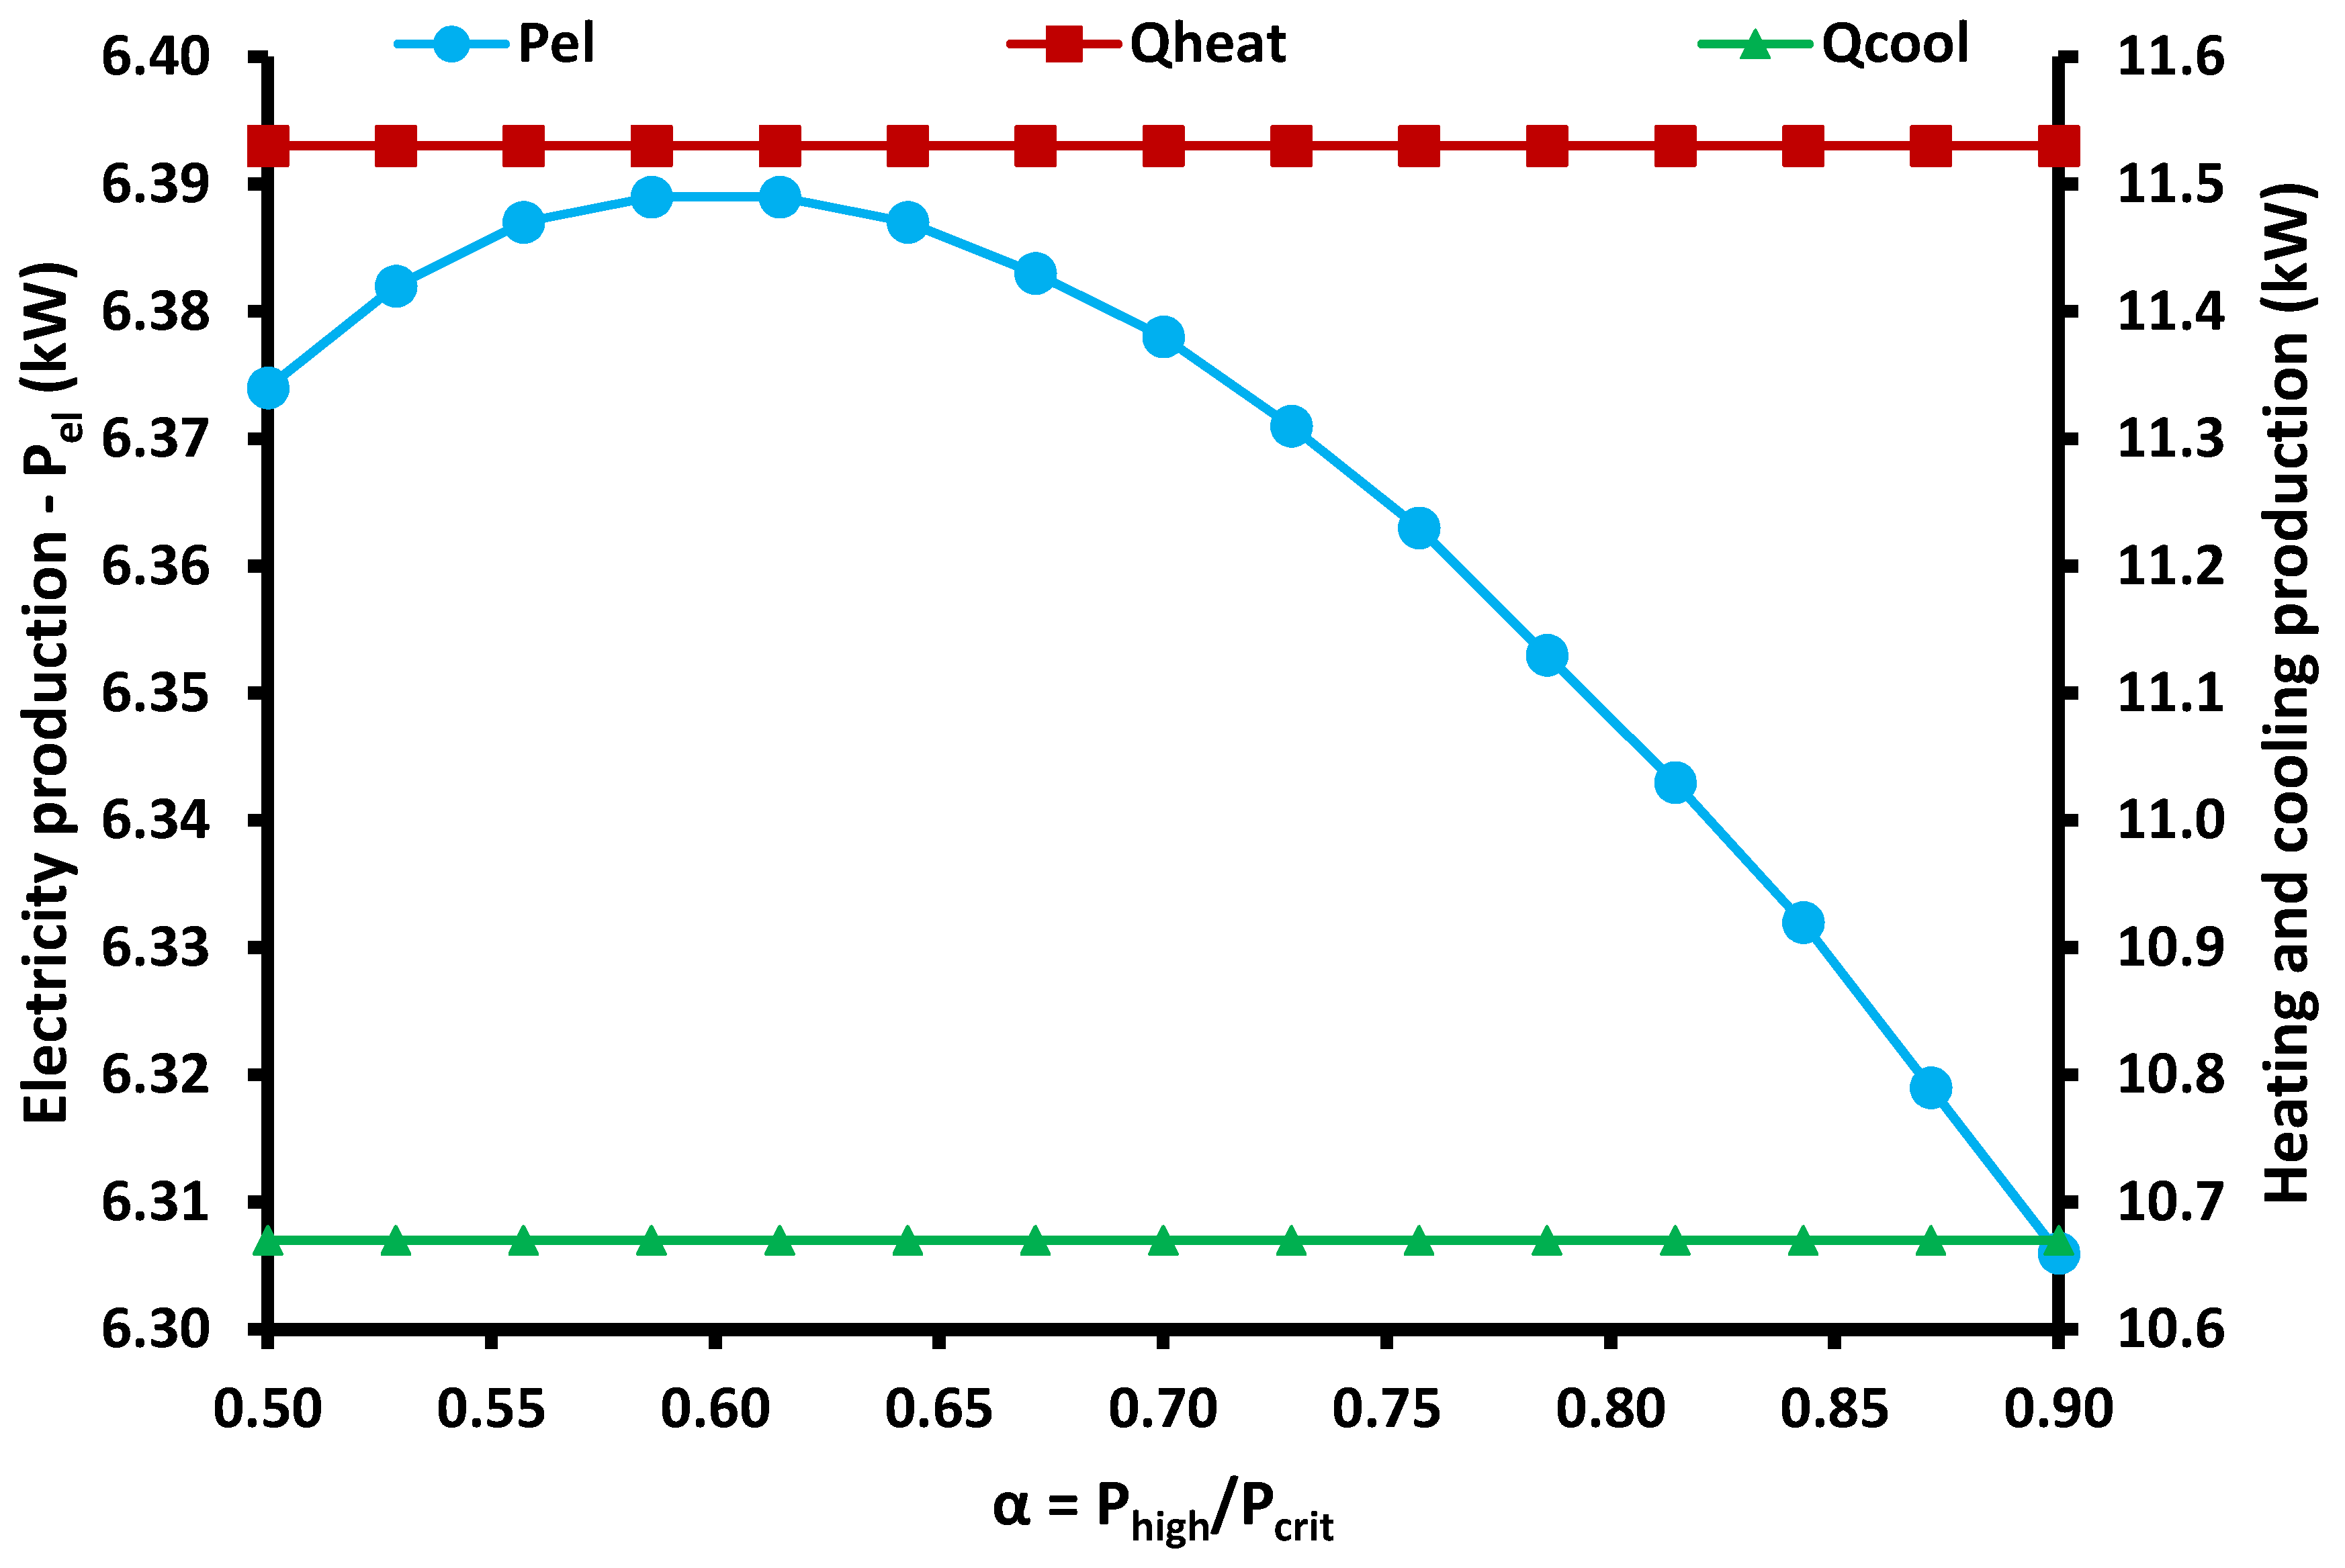
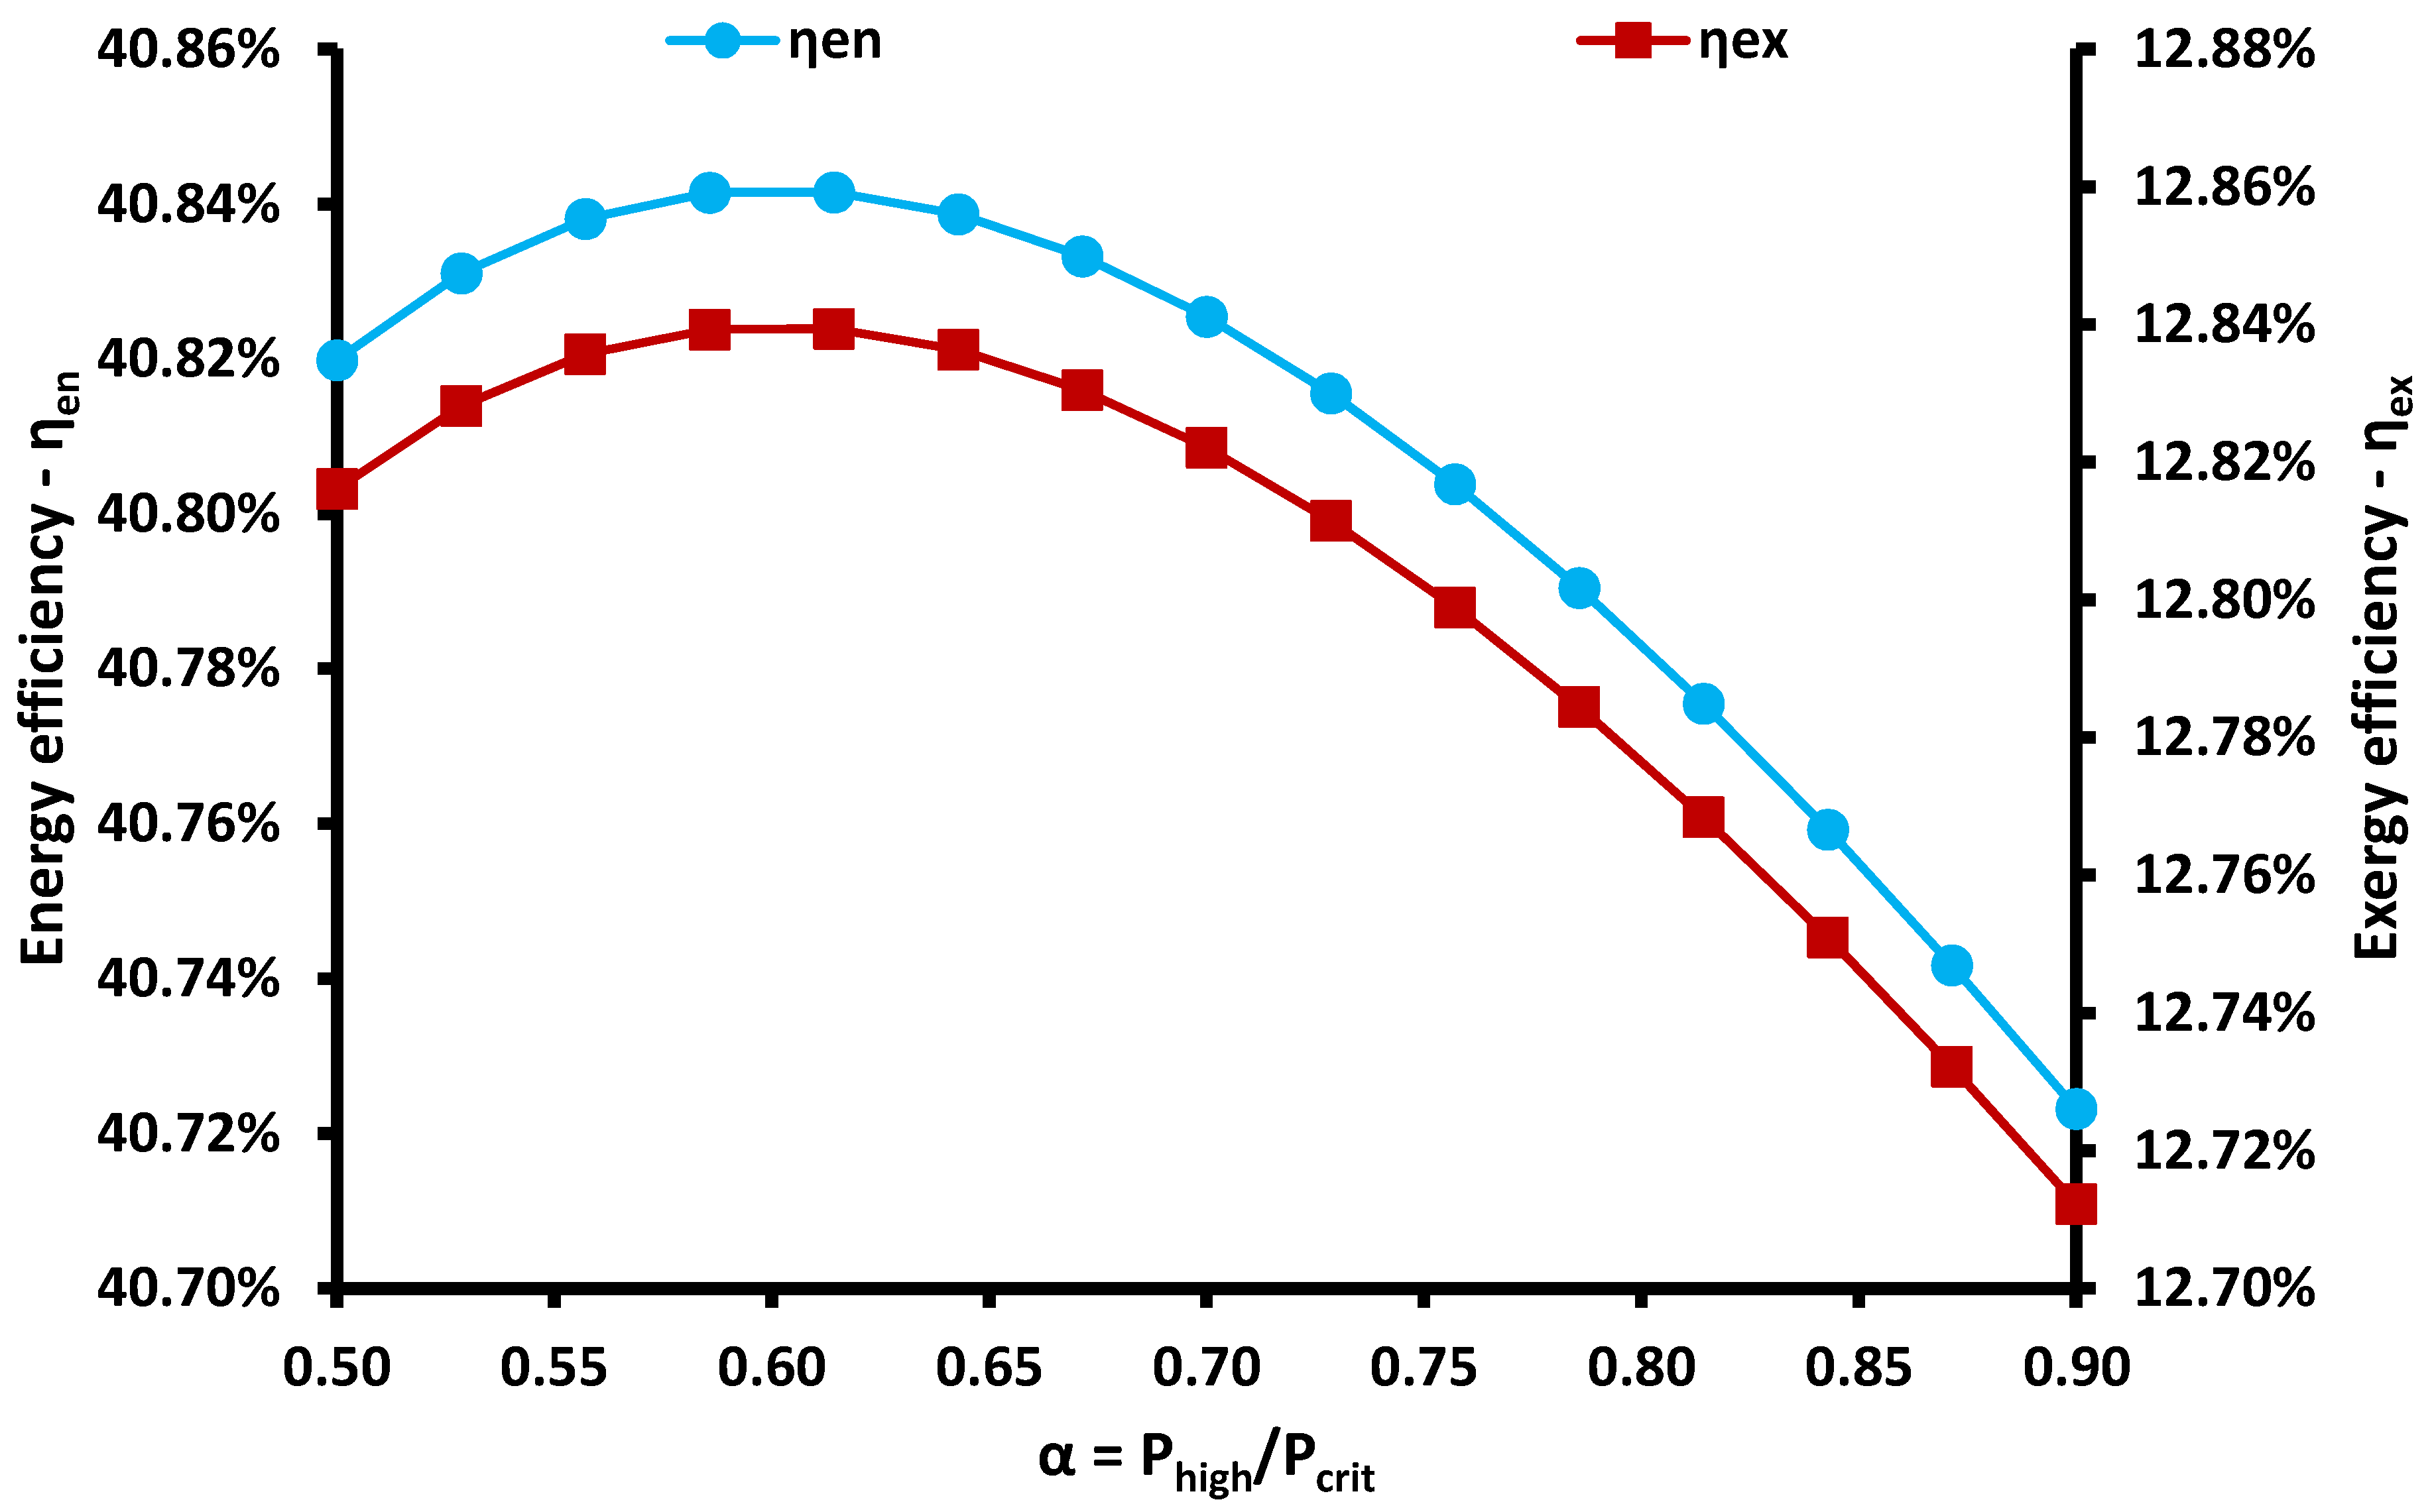
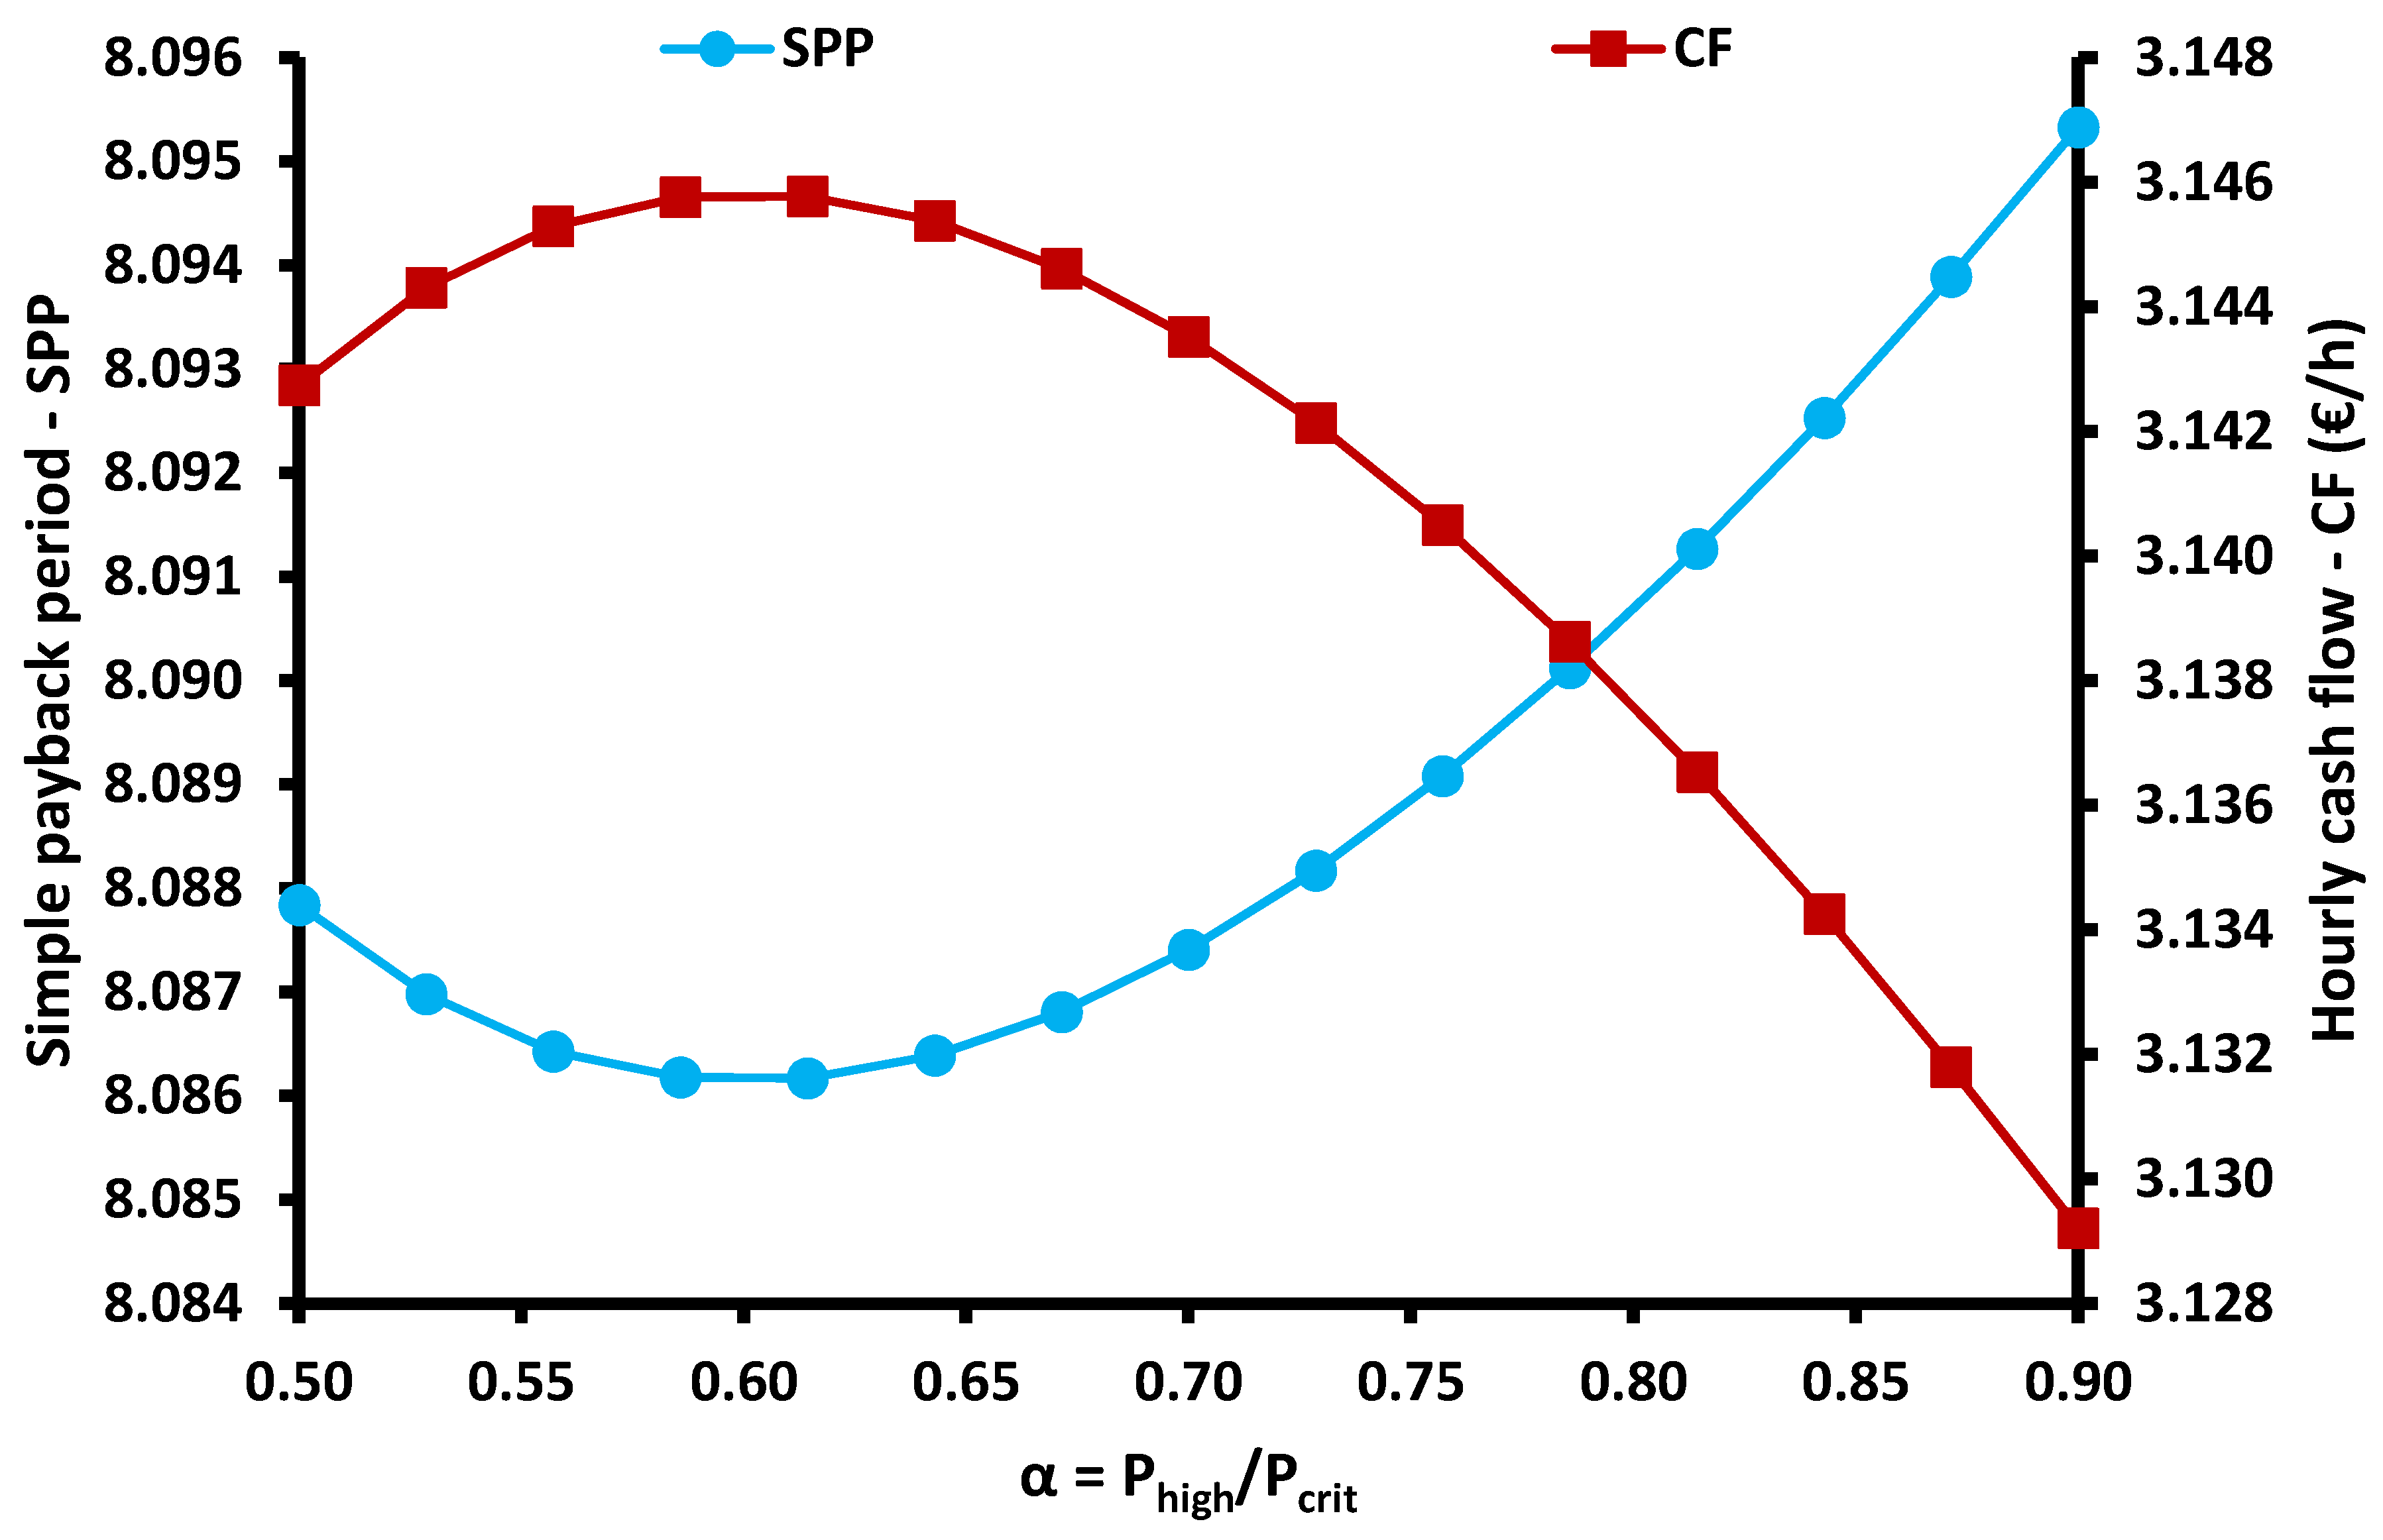
Figure 2 shows the variation of the useful outputs for different pressure ratio values. It is obvious that only electricity production is affected by this parameter and it is maximized for pressure ratio at 0.6 and it is 6.39 kW. The heating and cooling productions are not affected by the variation of this parameter. Moreover, Figure 3 shows that both energy and exergy efficiencies are maximized for α = 0.6. More specifically, the maximum energy efficiency is 40.84%, while the maximum exergy efficiency is 12.84%. Moreover, Figure 4 indicates that the SPP of the system is minimized for α = 0.6 and it is about 8.086 years, while the hourly cash flow is maximized at 3.146 €/h. Therefore, it can be said that the maximization of electricity production at a specific value of the pressure ratio leads to the optimization of all the other indexes. However, the deviations from the default scenario are not so high, and so this fact indicates that the use of the initial value of α = 0.90 instead of the optimum value of α = 0.60 in the parametric analysis does not have a great impact on the obtained values.
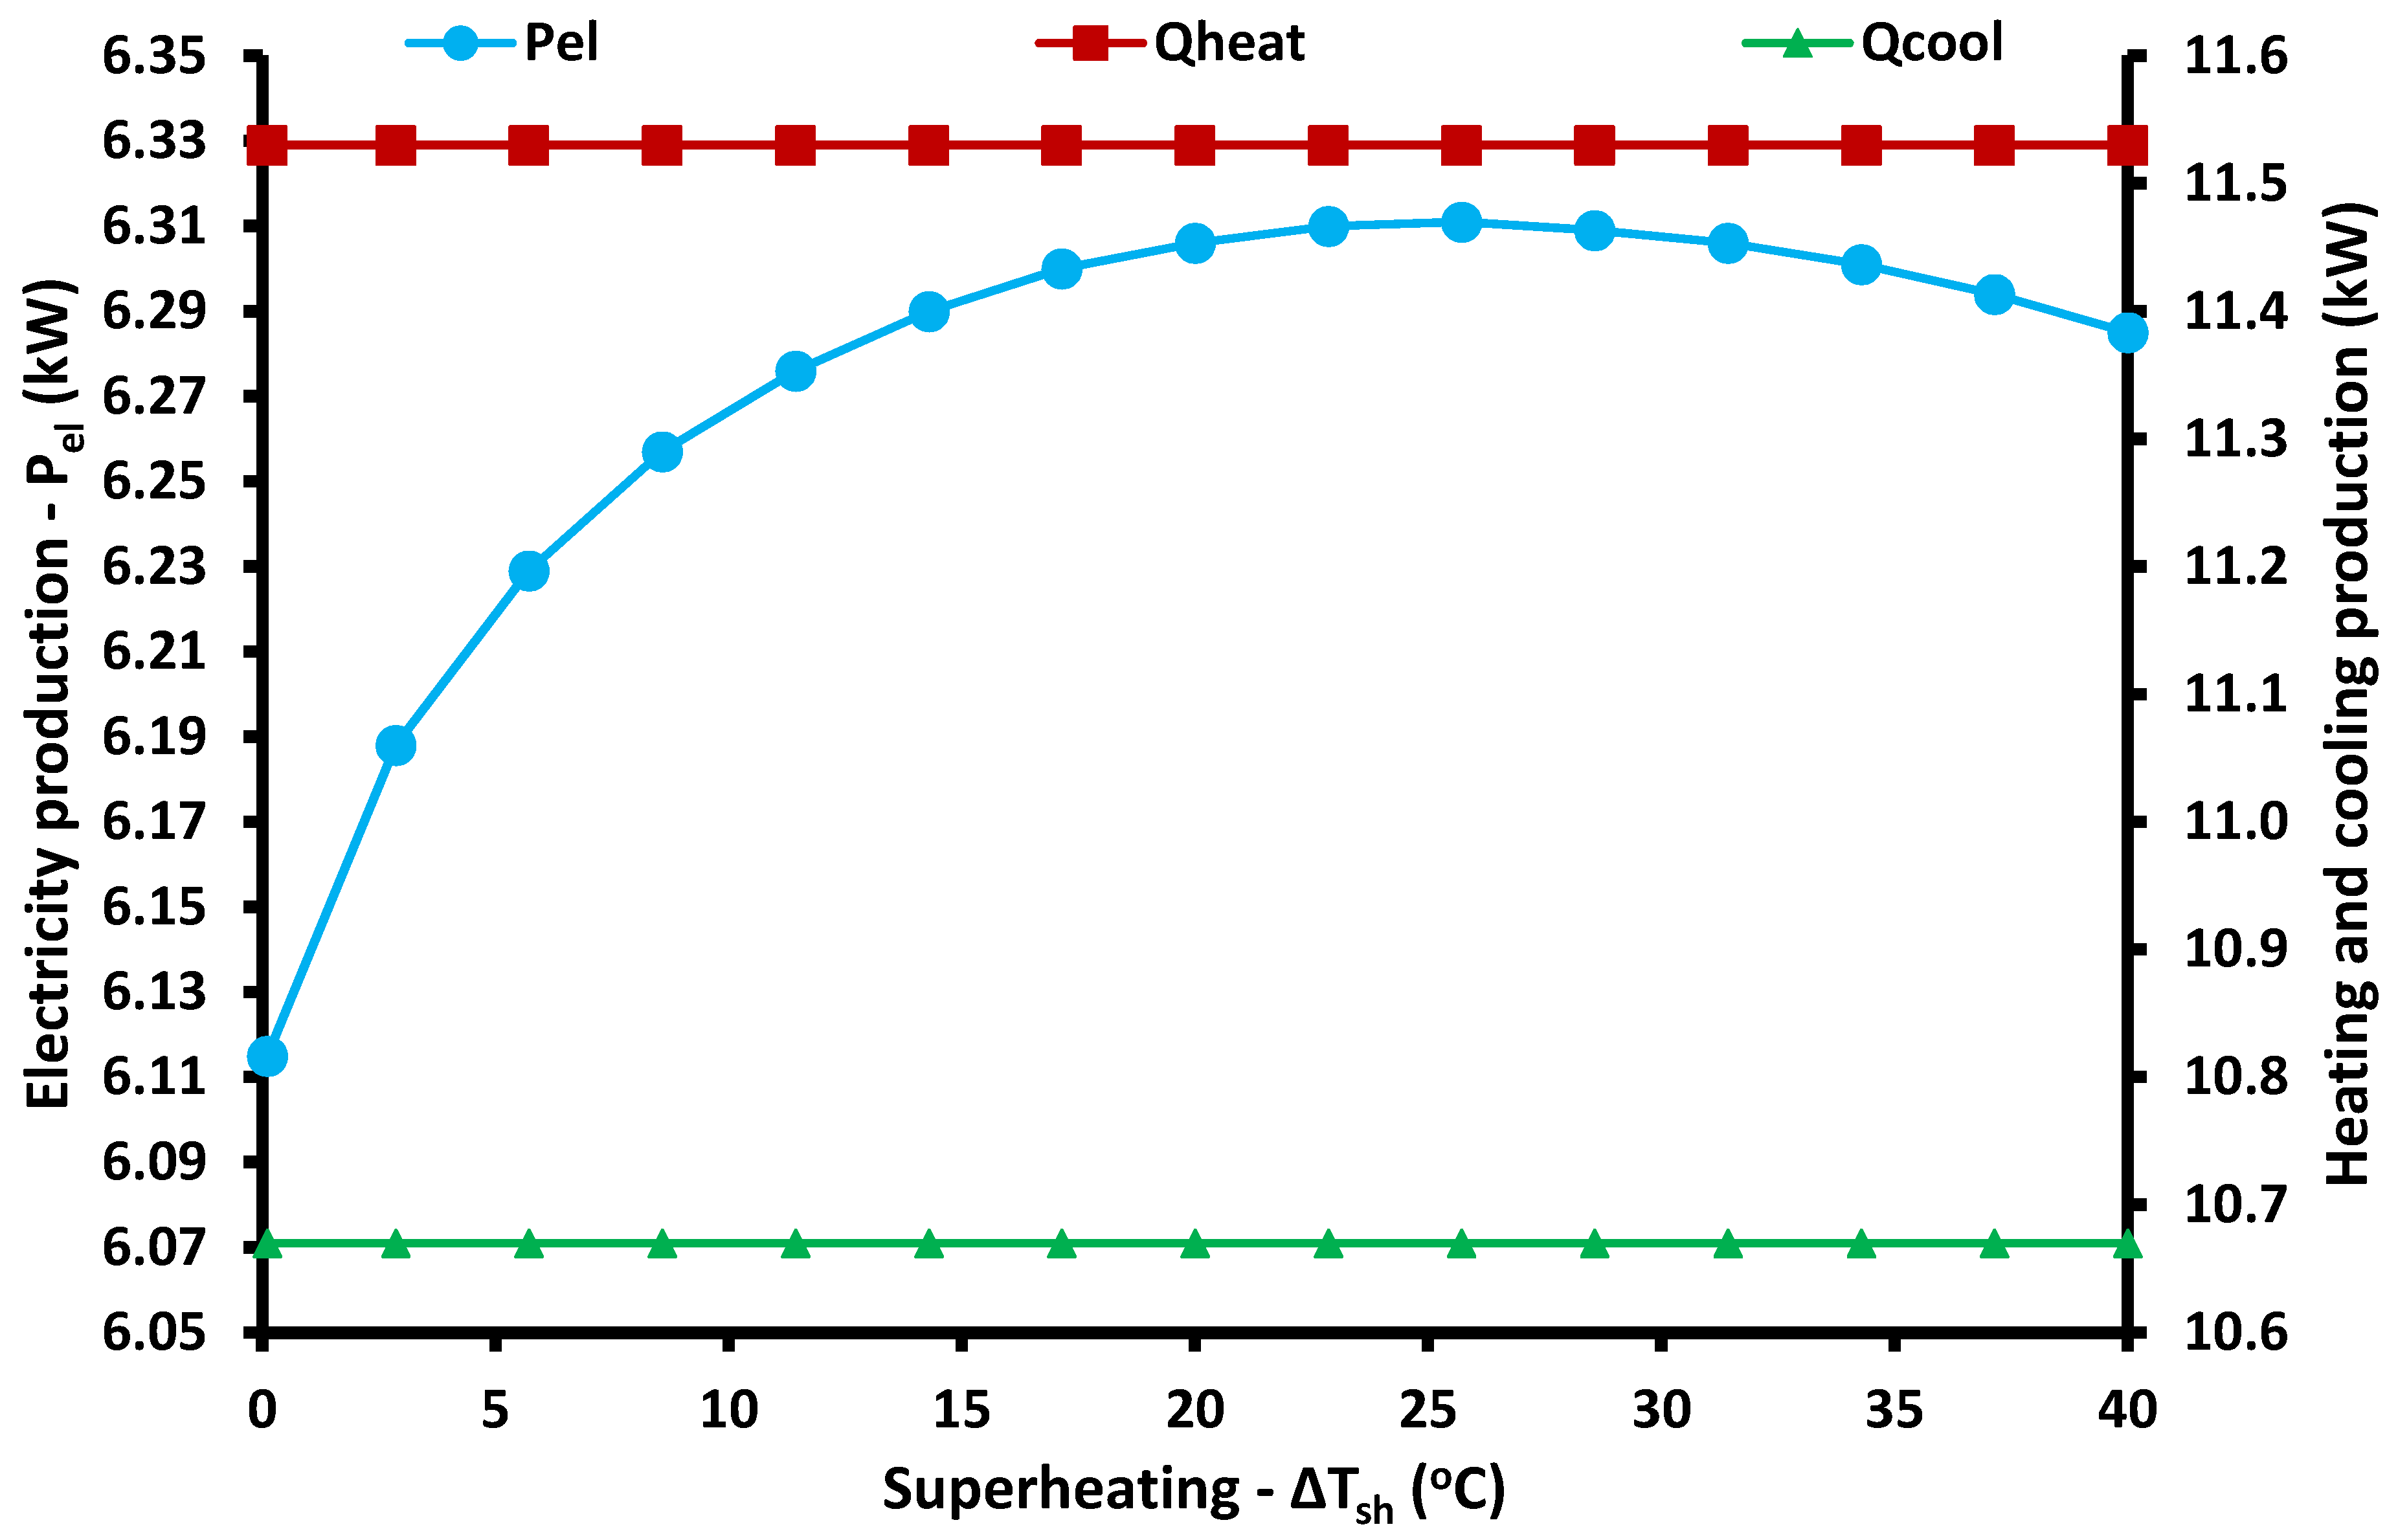
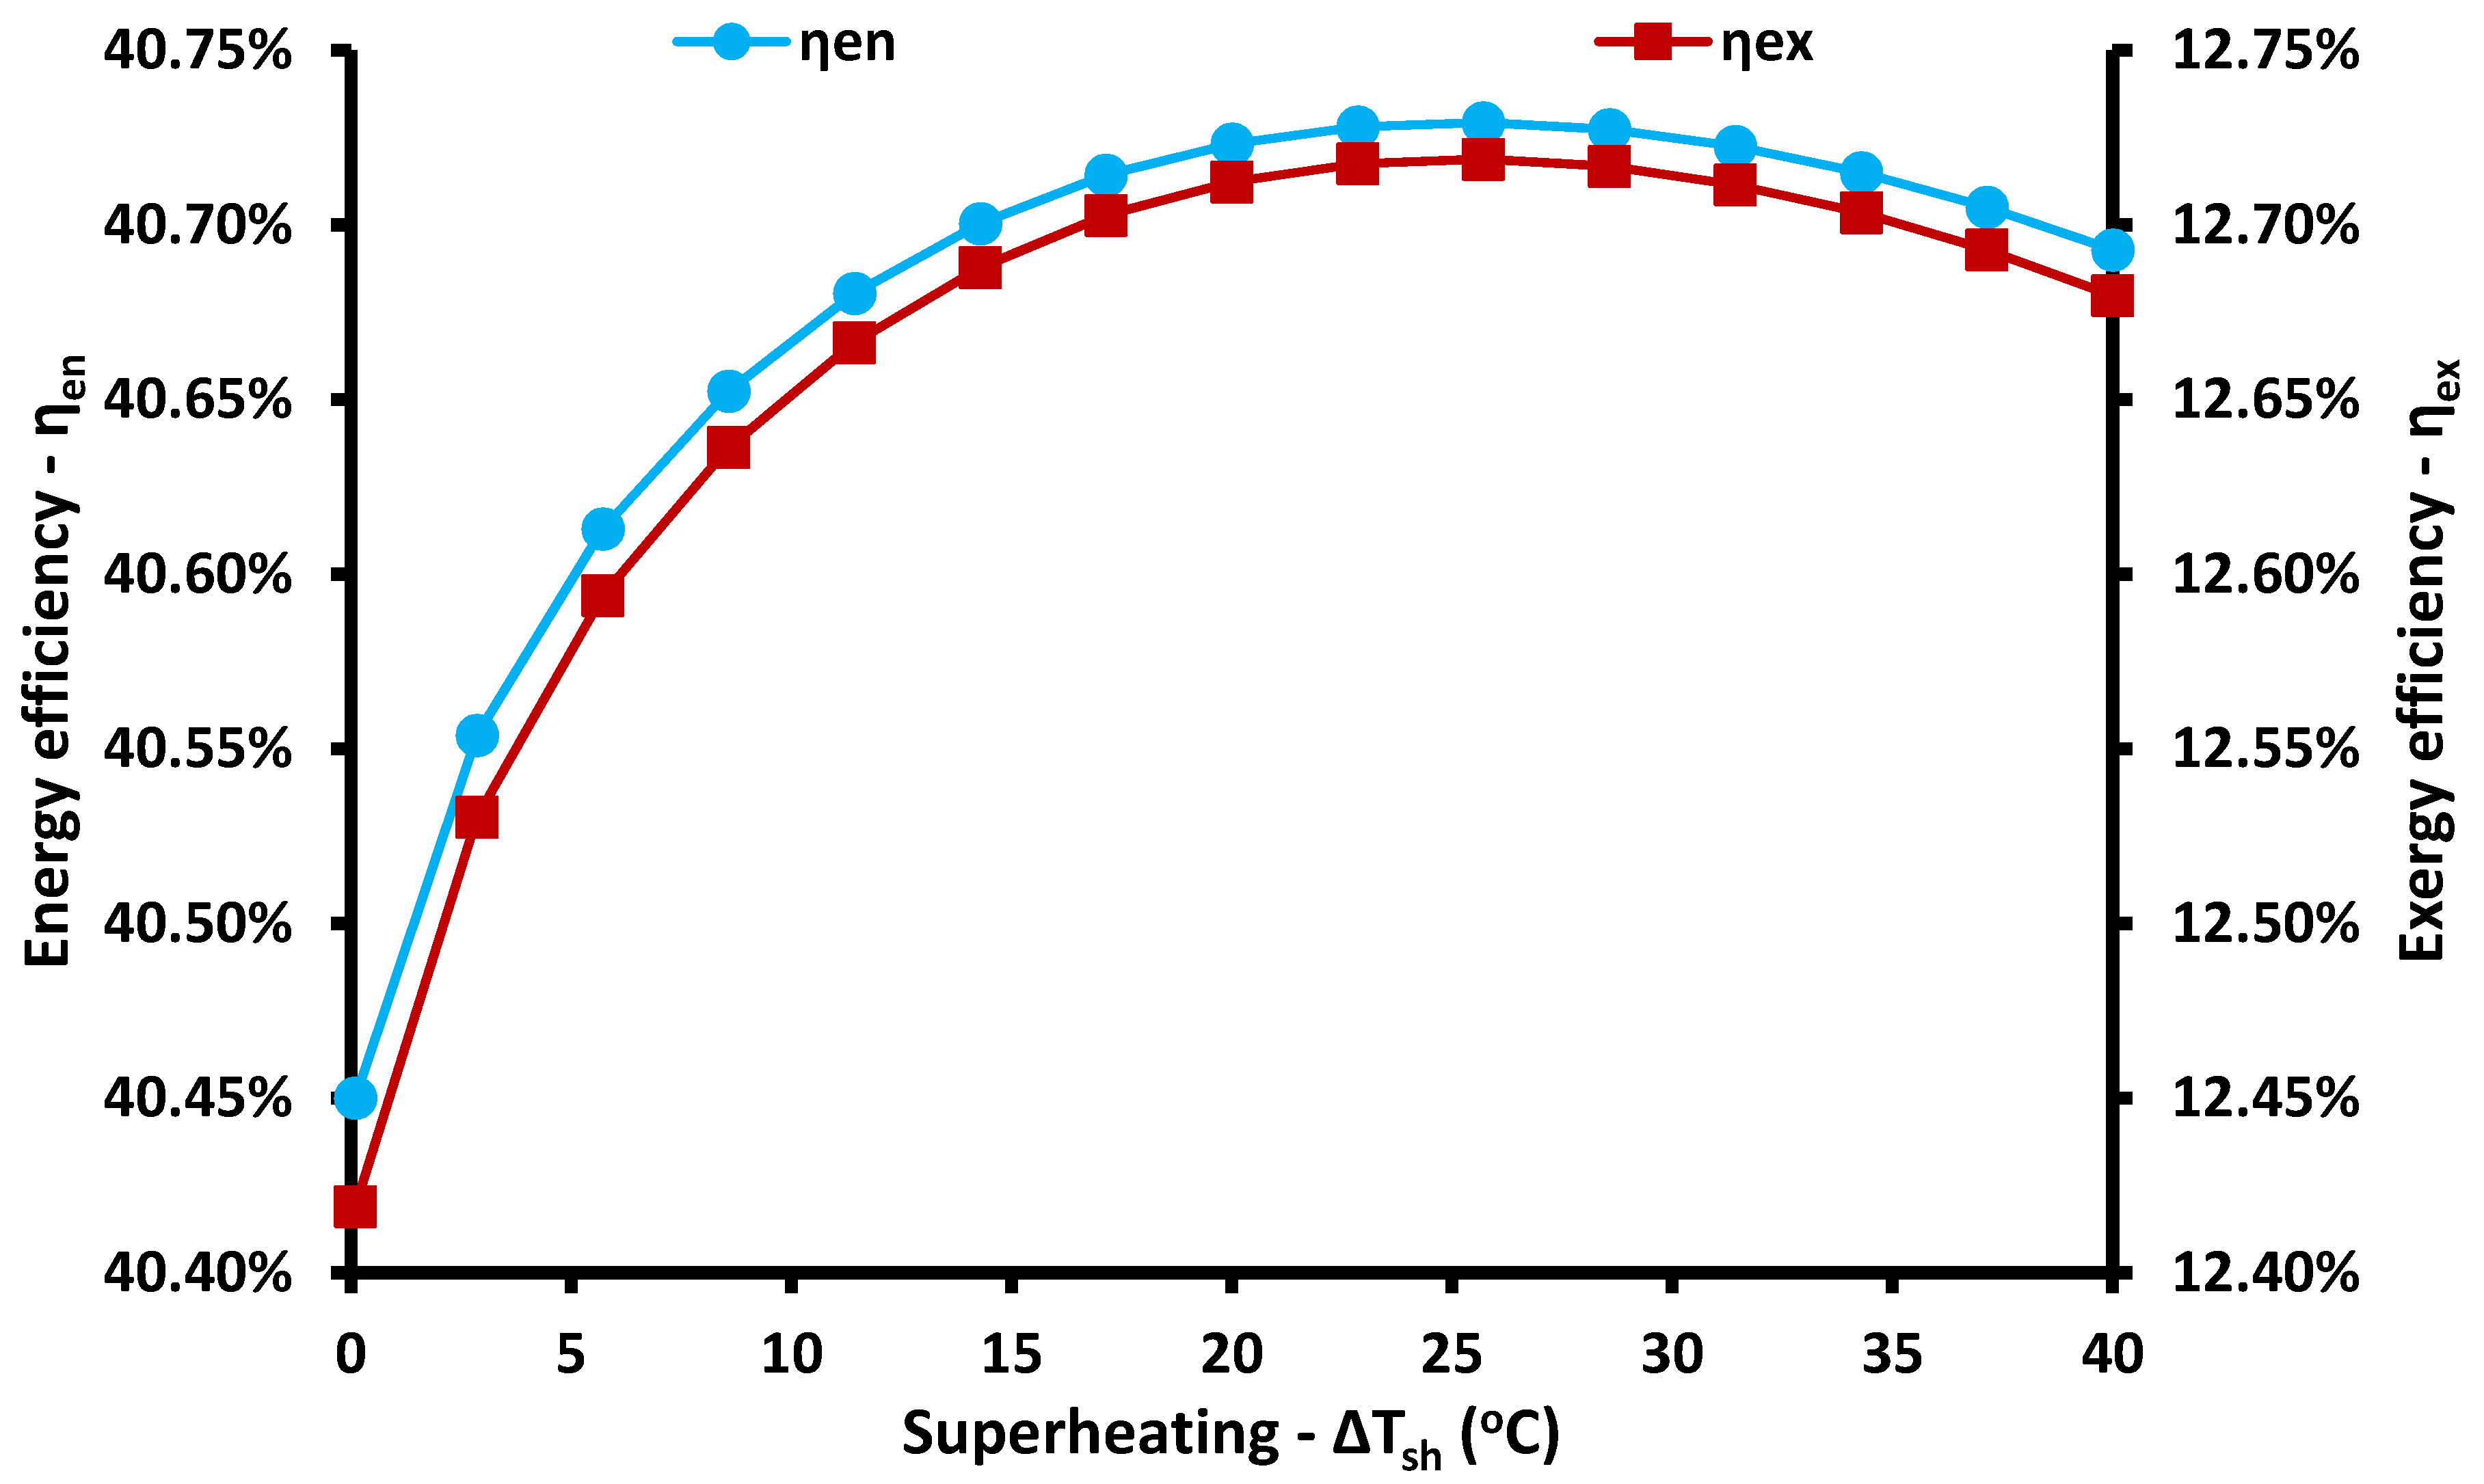
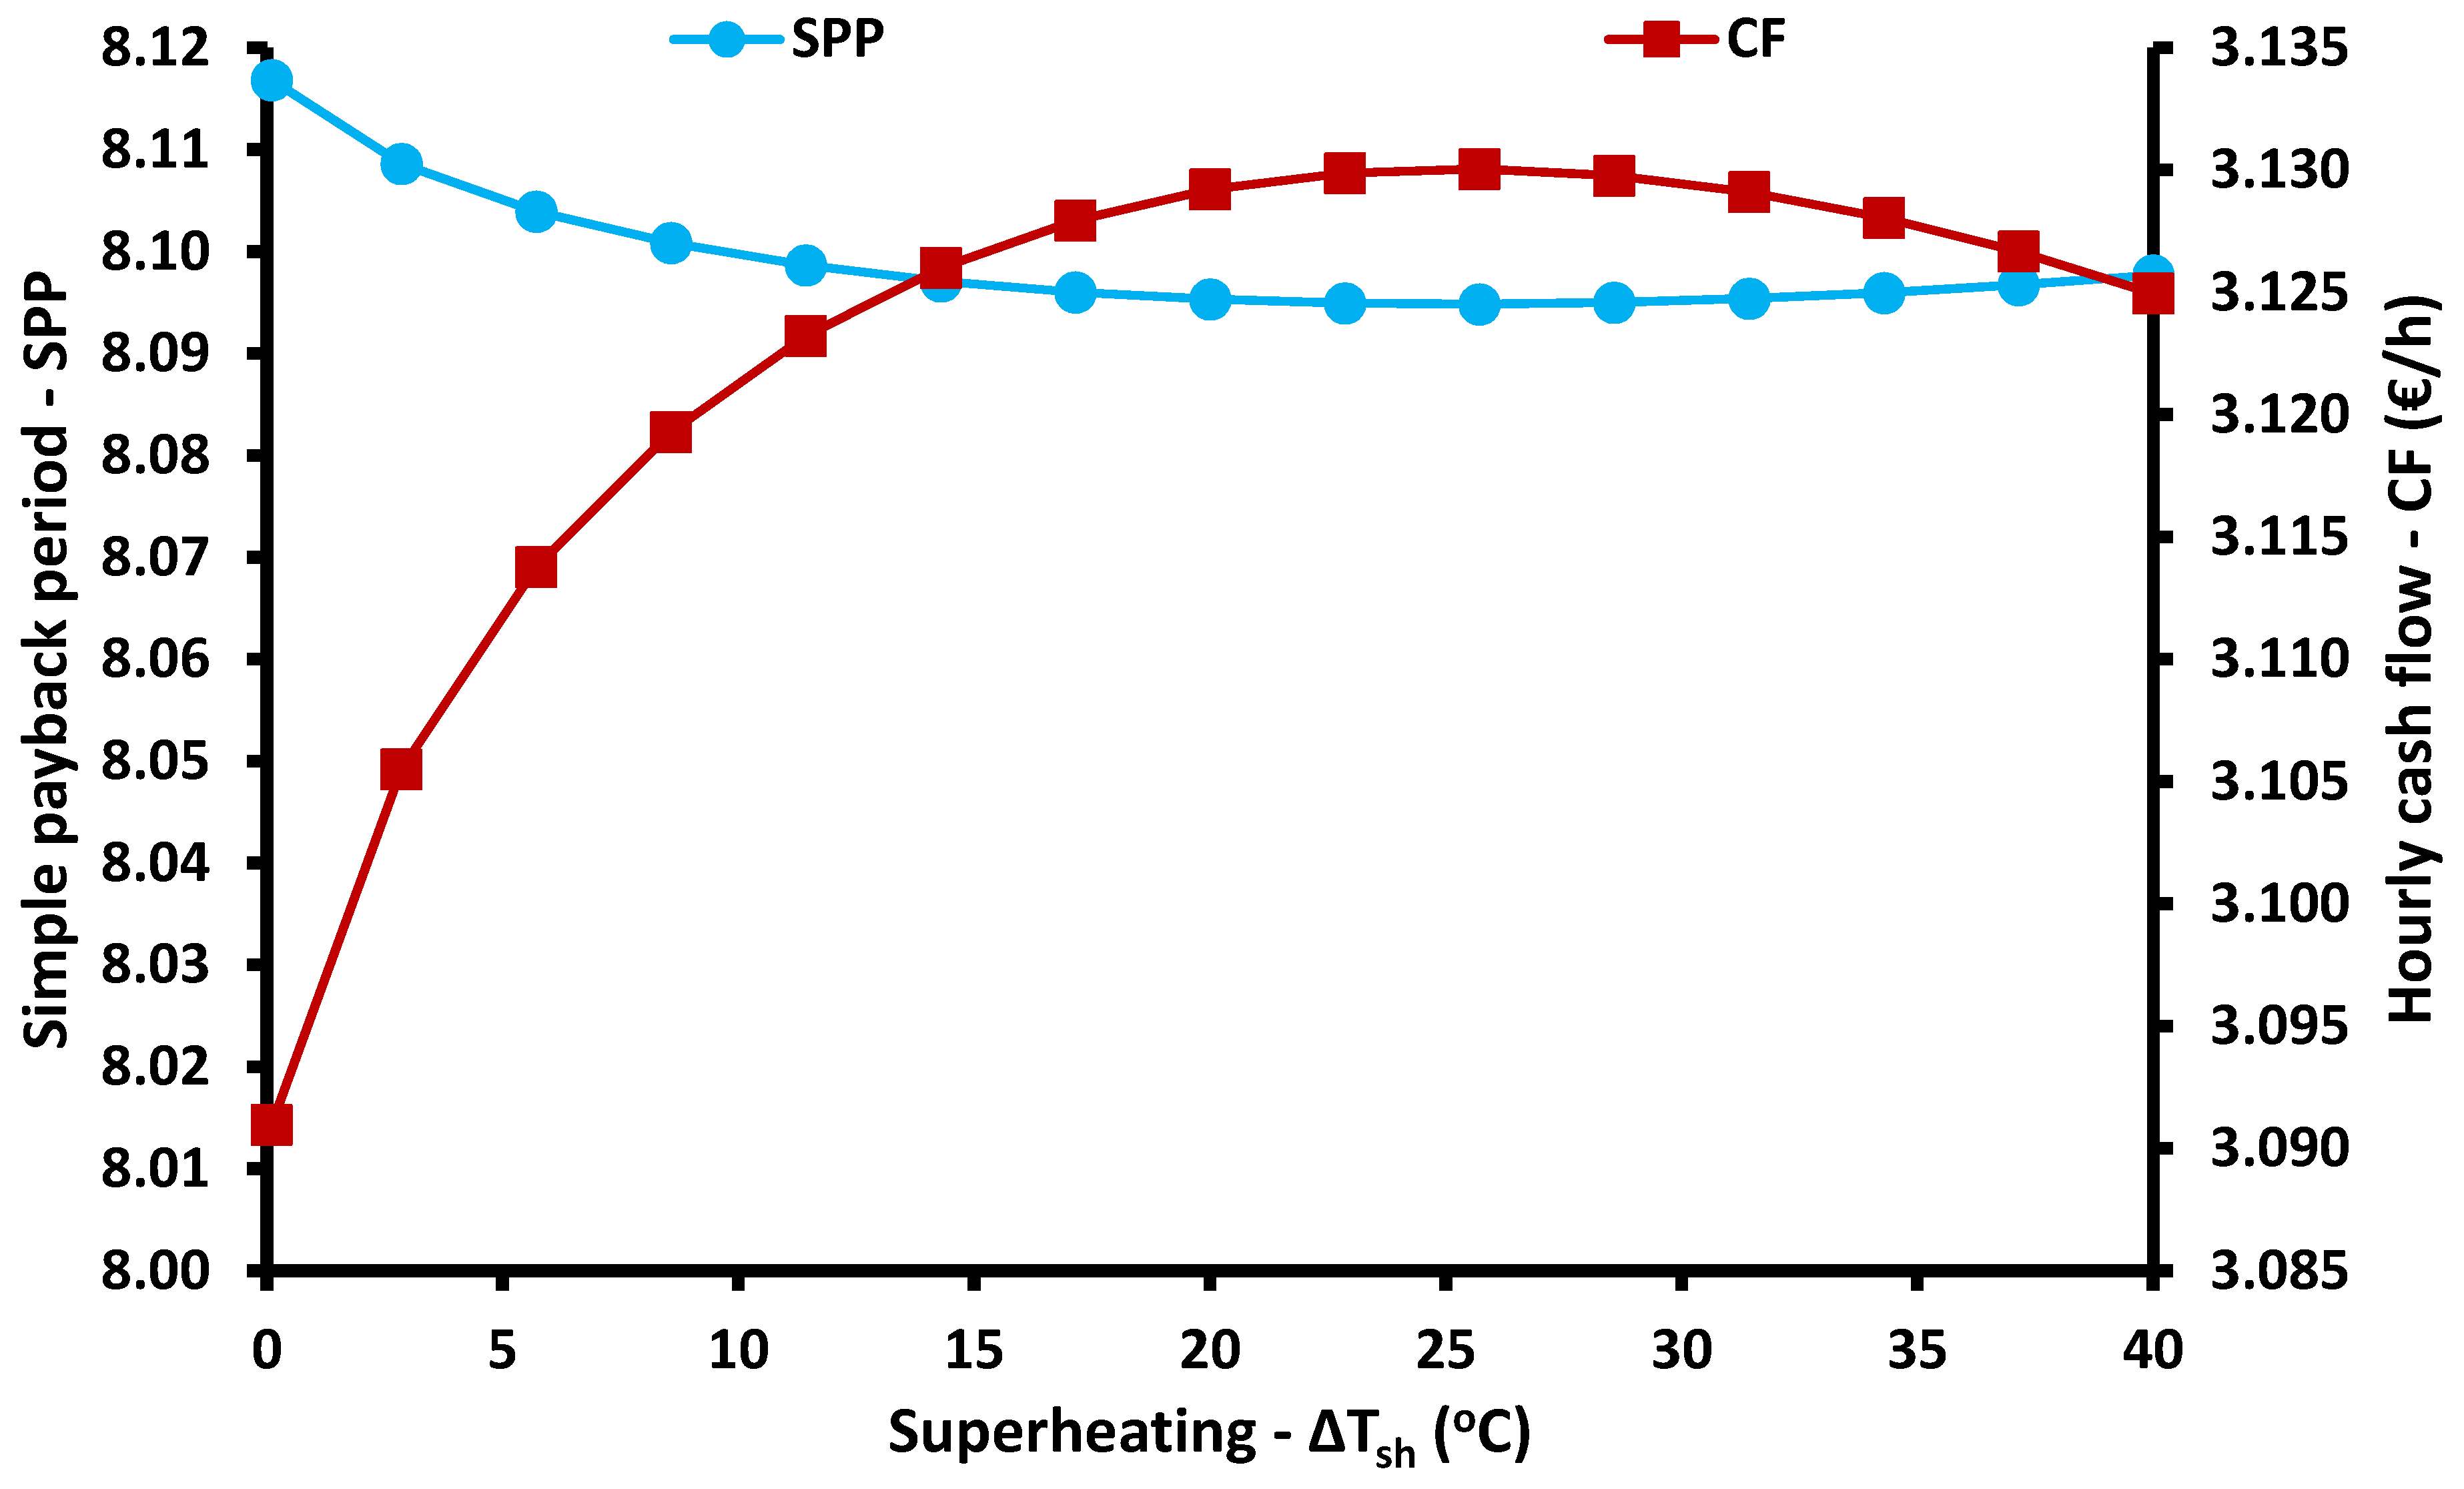
The next examined parameter is the superheating degree in the turbine inlet. Figure 5 shows that only electricity production is affected by this parameter and it is maximized at 25 K for the examined pressure level. This is an interesting result which indicates that there is a need for optimization of this parameter in order to have adequate electricity production. It has to be commented that in the examined ranges, the optimization of the superheating degree is more important than the optimization of the pressure ratio parameter. Figure 6 illustrates that both energy and the exergy efficiencies are maximized for 25 K superheating which is a reasonable result because this superheating value also maximizes electricity production. The maximum energy efficiency is 40.73%, and the respective maximum exergy efficiency of 12.72%. Figure 7 shows that the payback period is minimized for 25 K superheating, and the hourly cash flow is maximized for the same superheating value. The minimum SPP is 8.095 years, and the respective maximum hourly cash flow rate is 3.13 €/h.
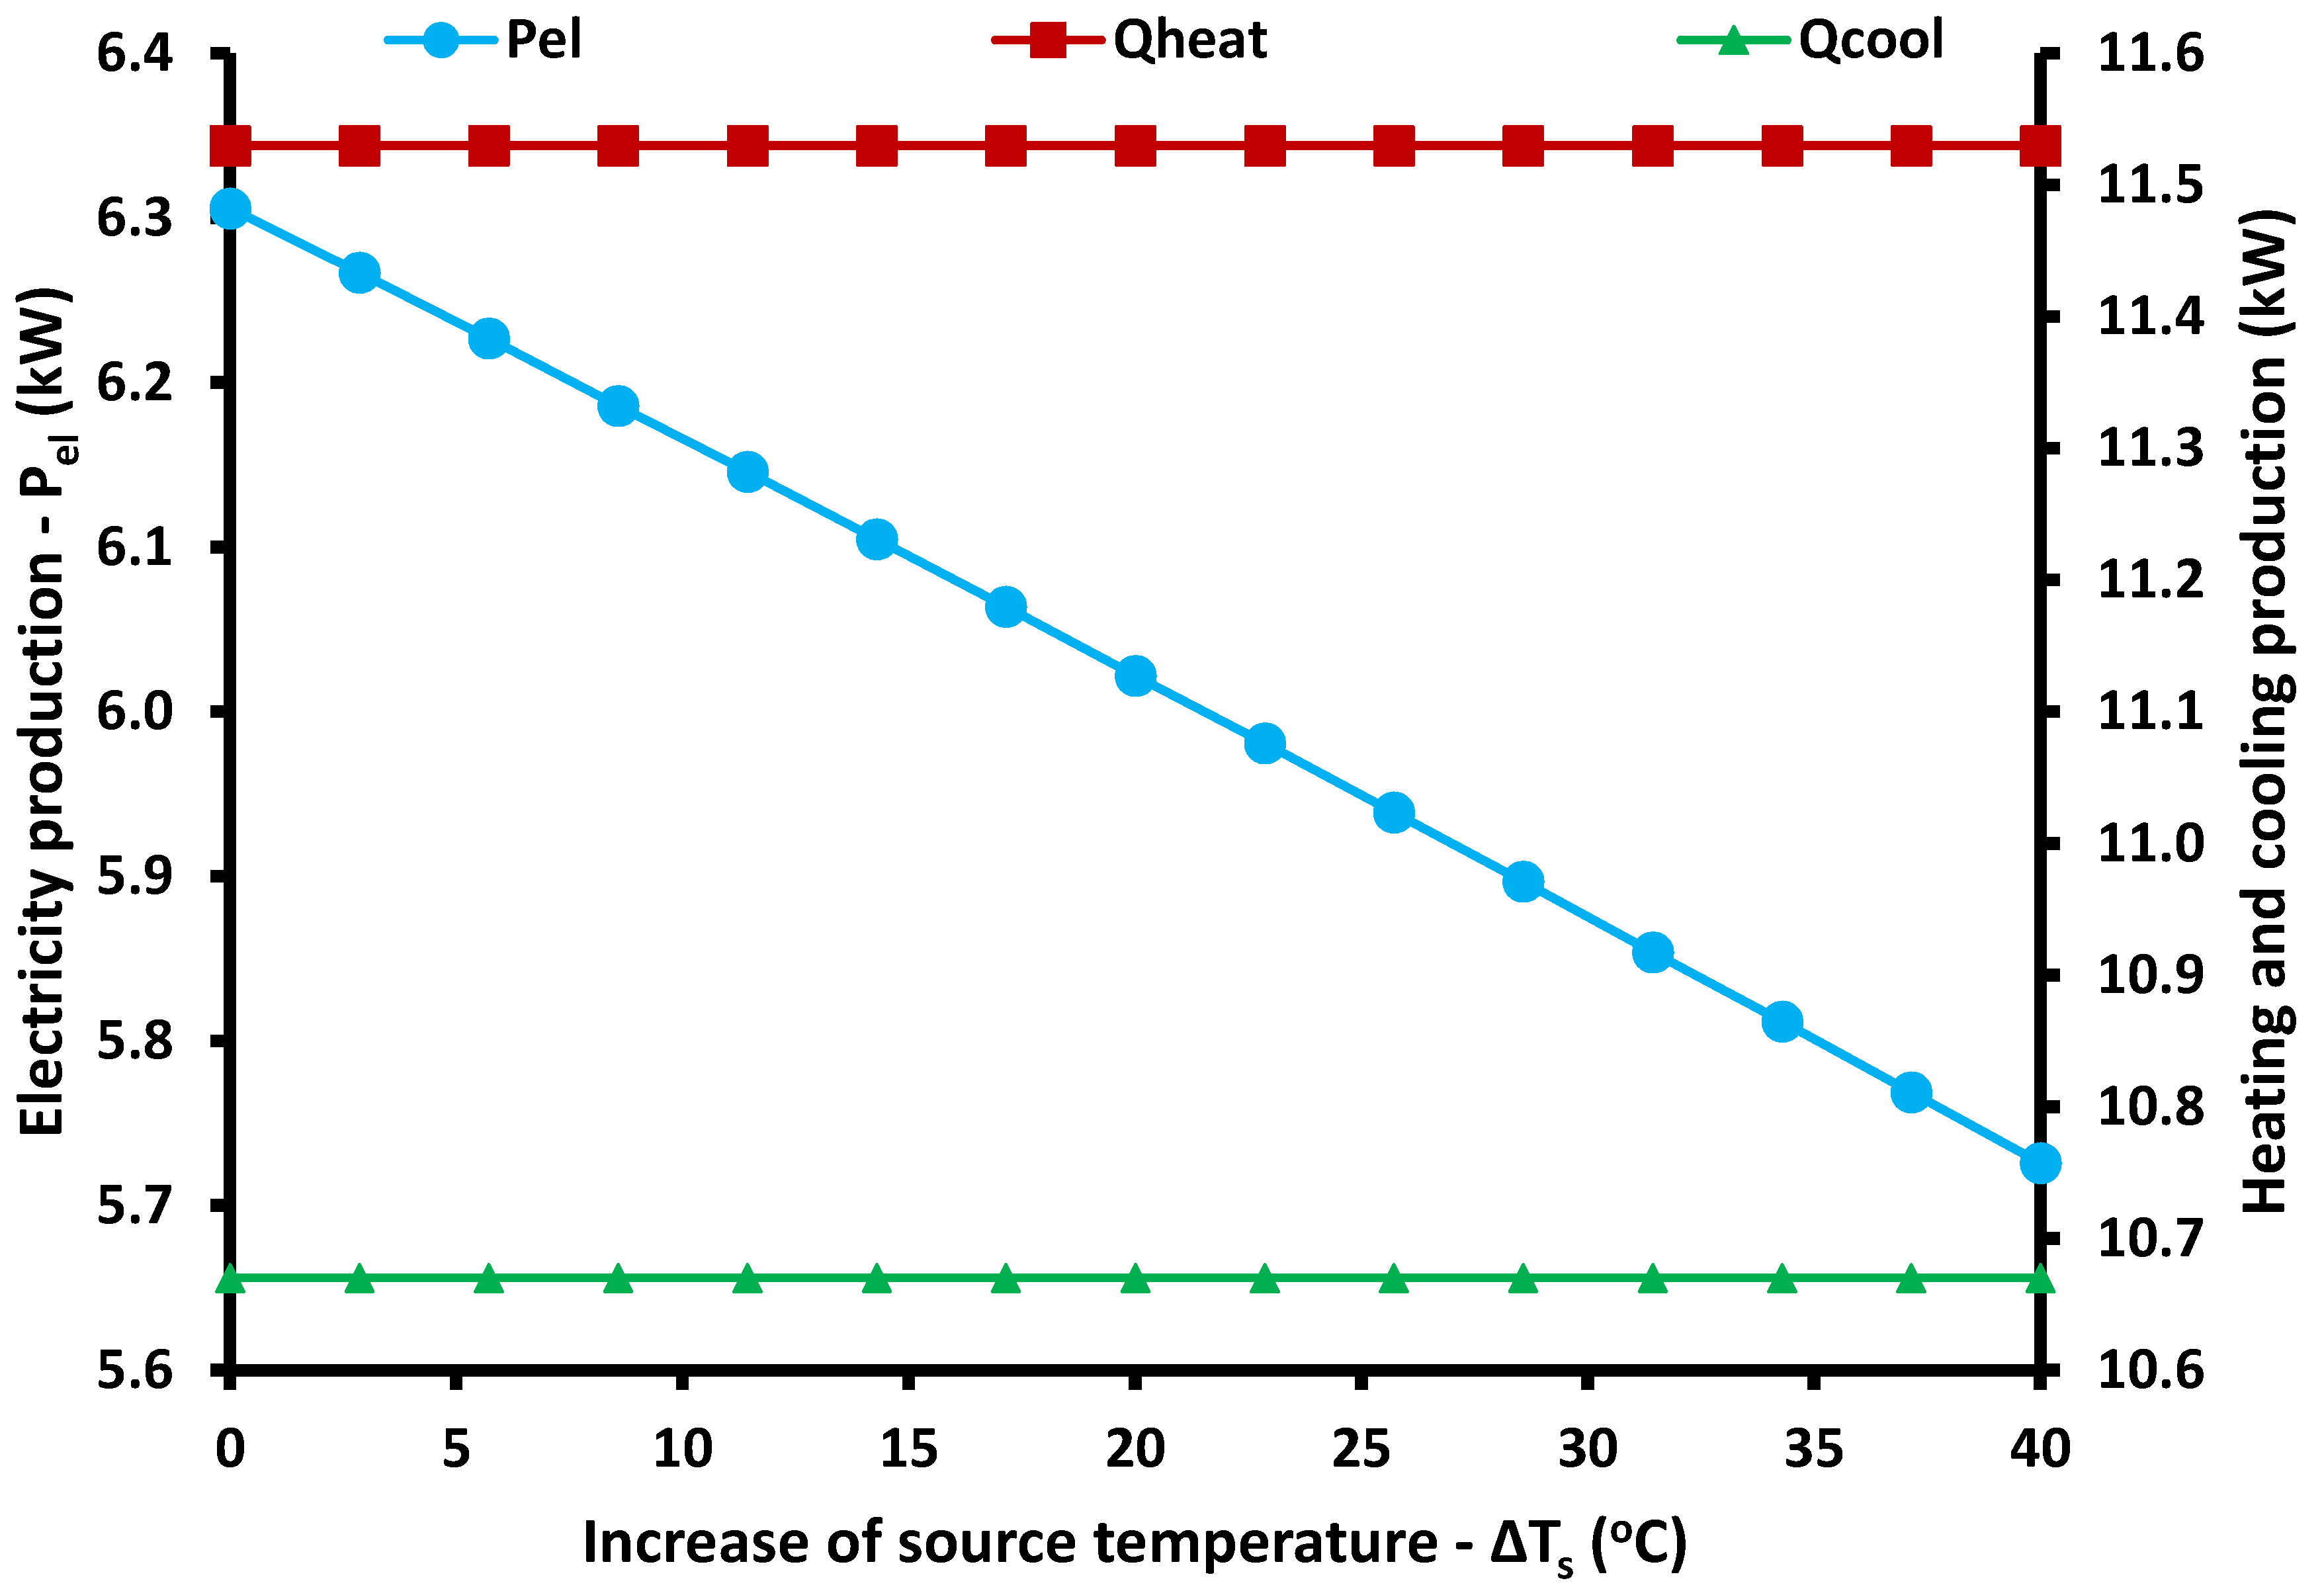
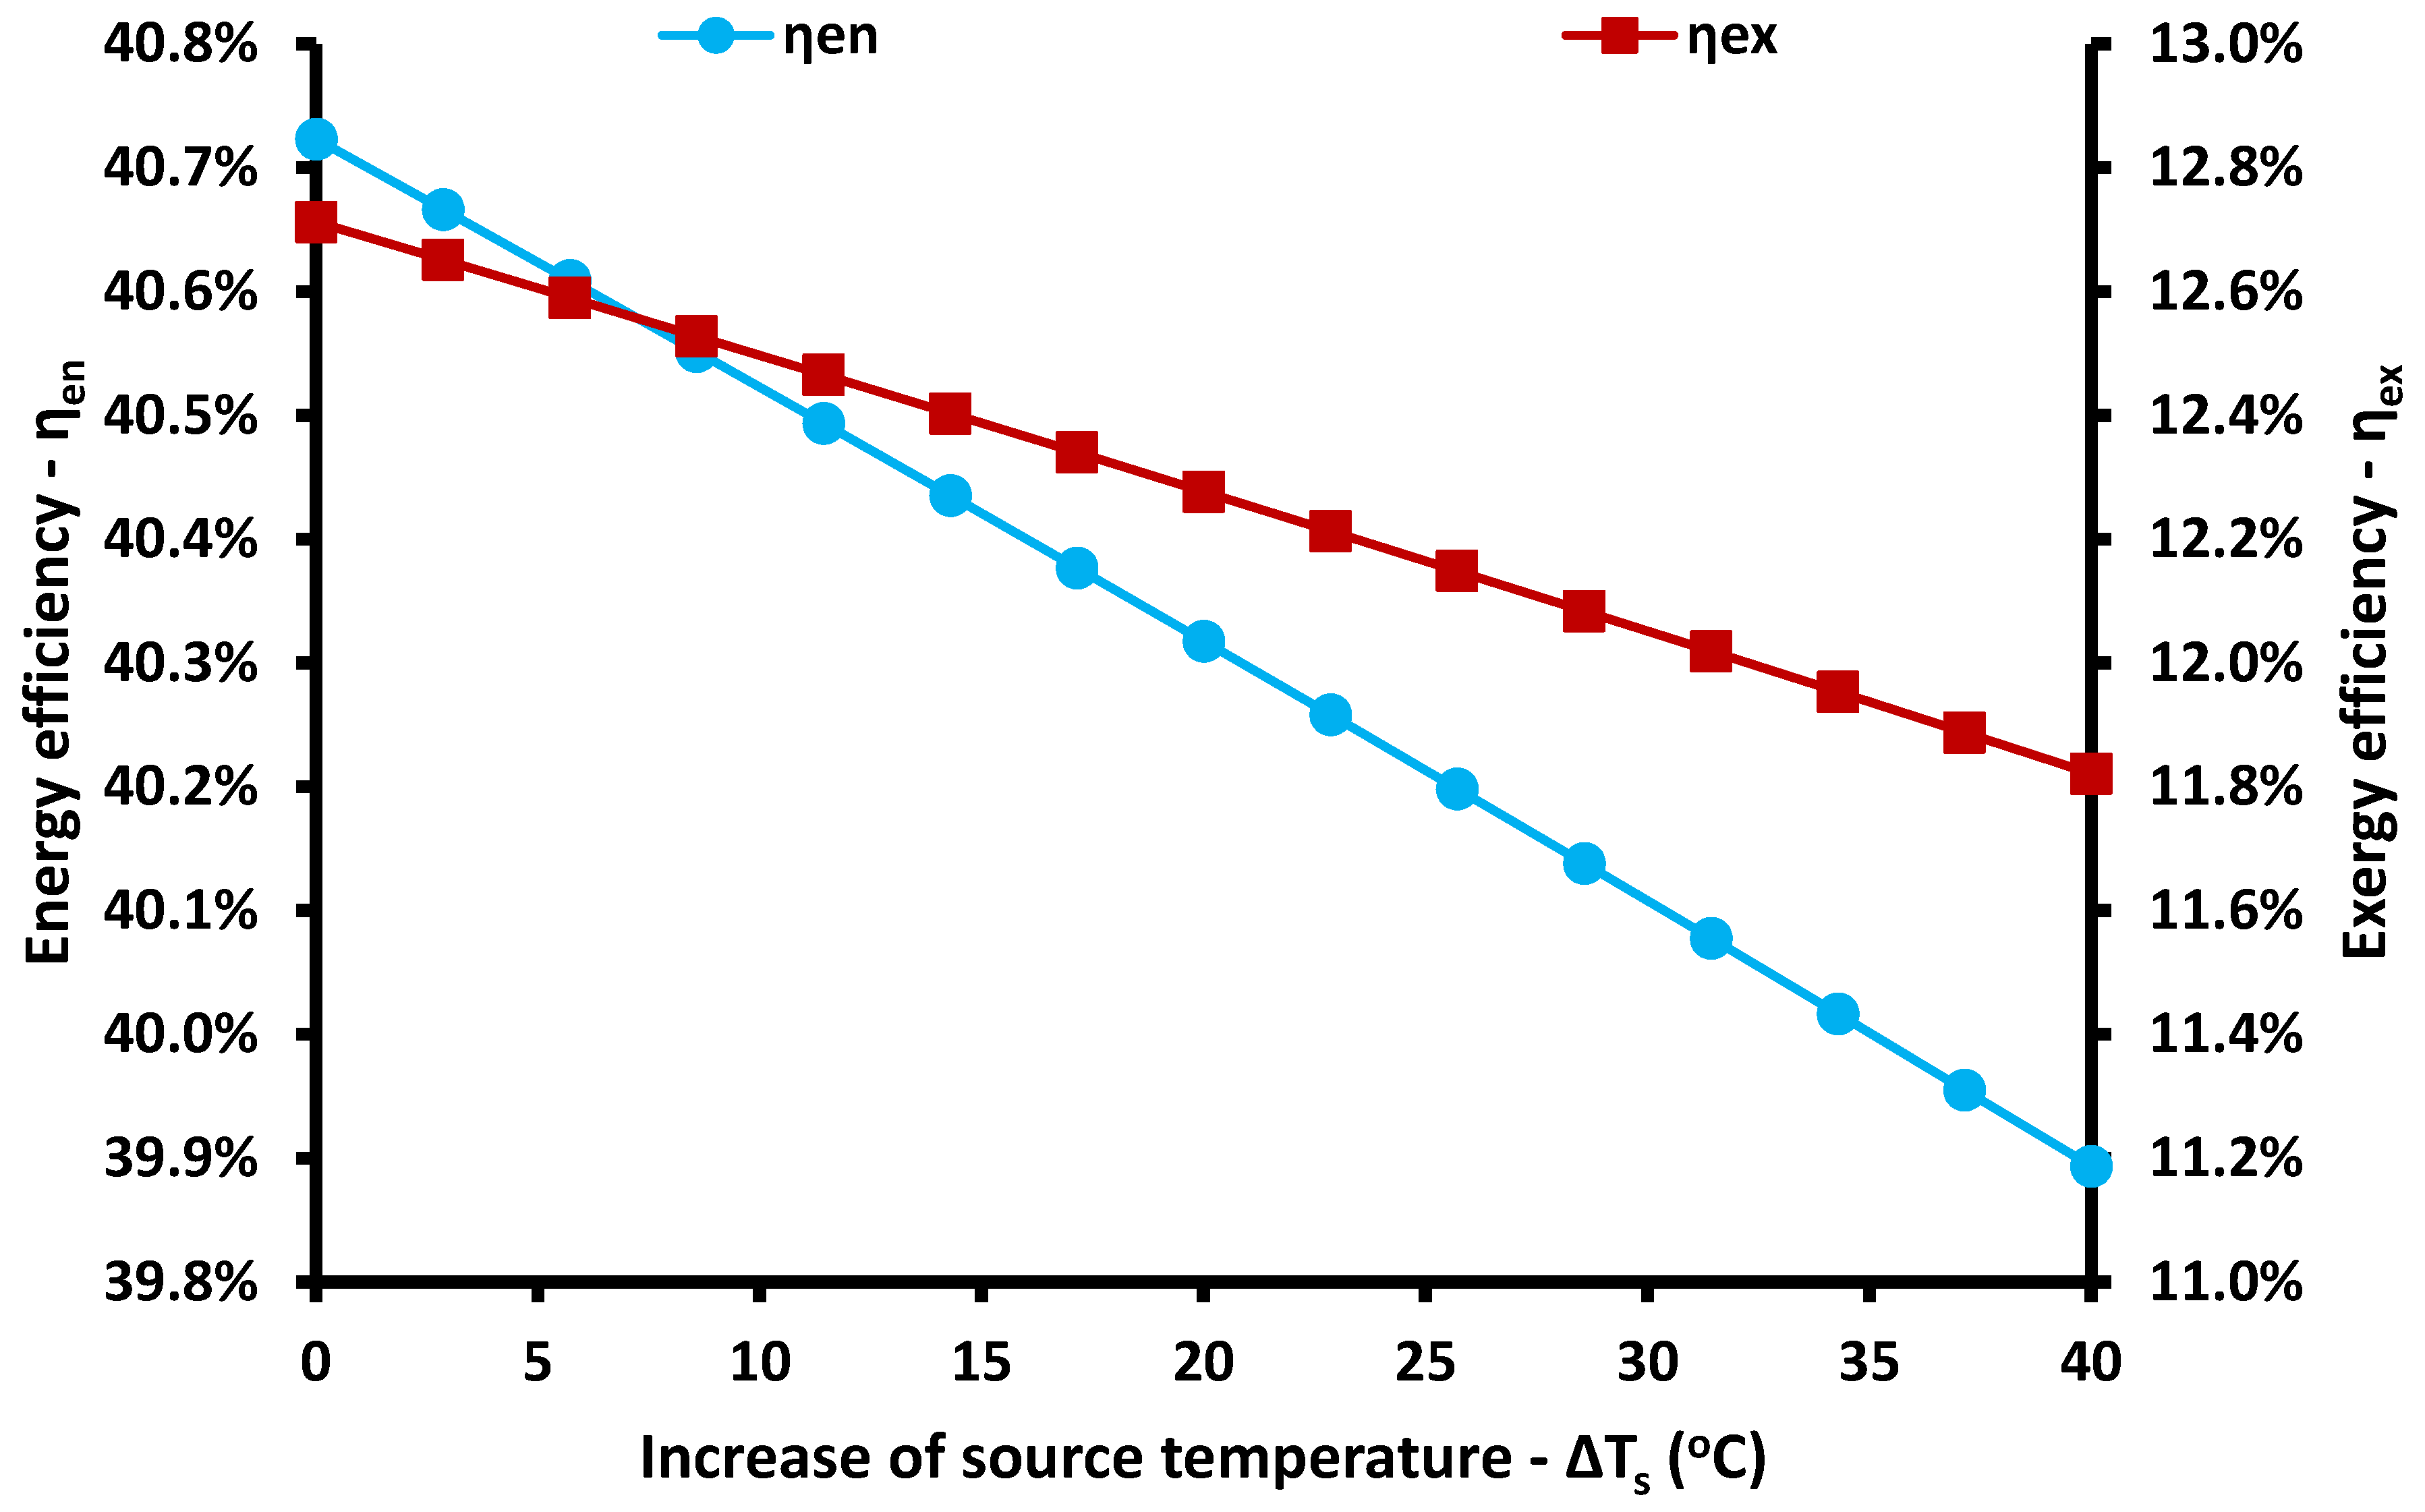
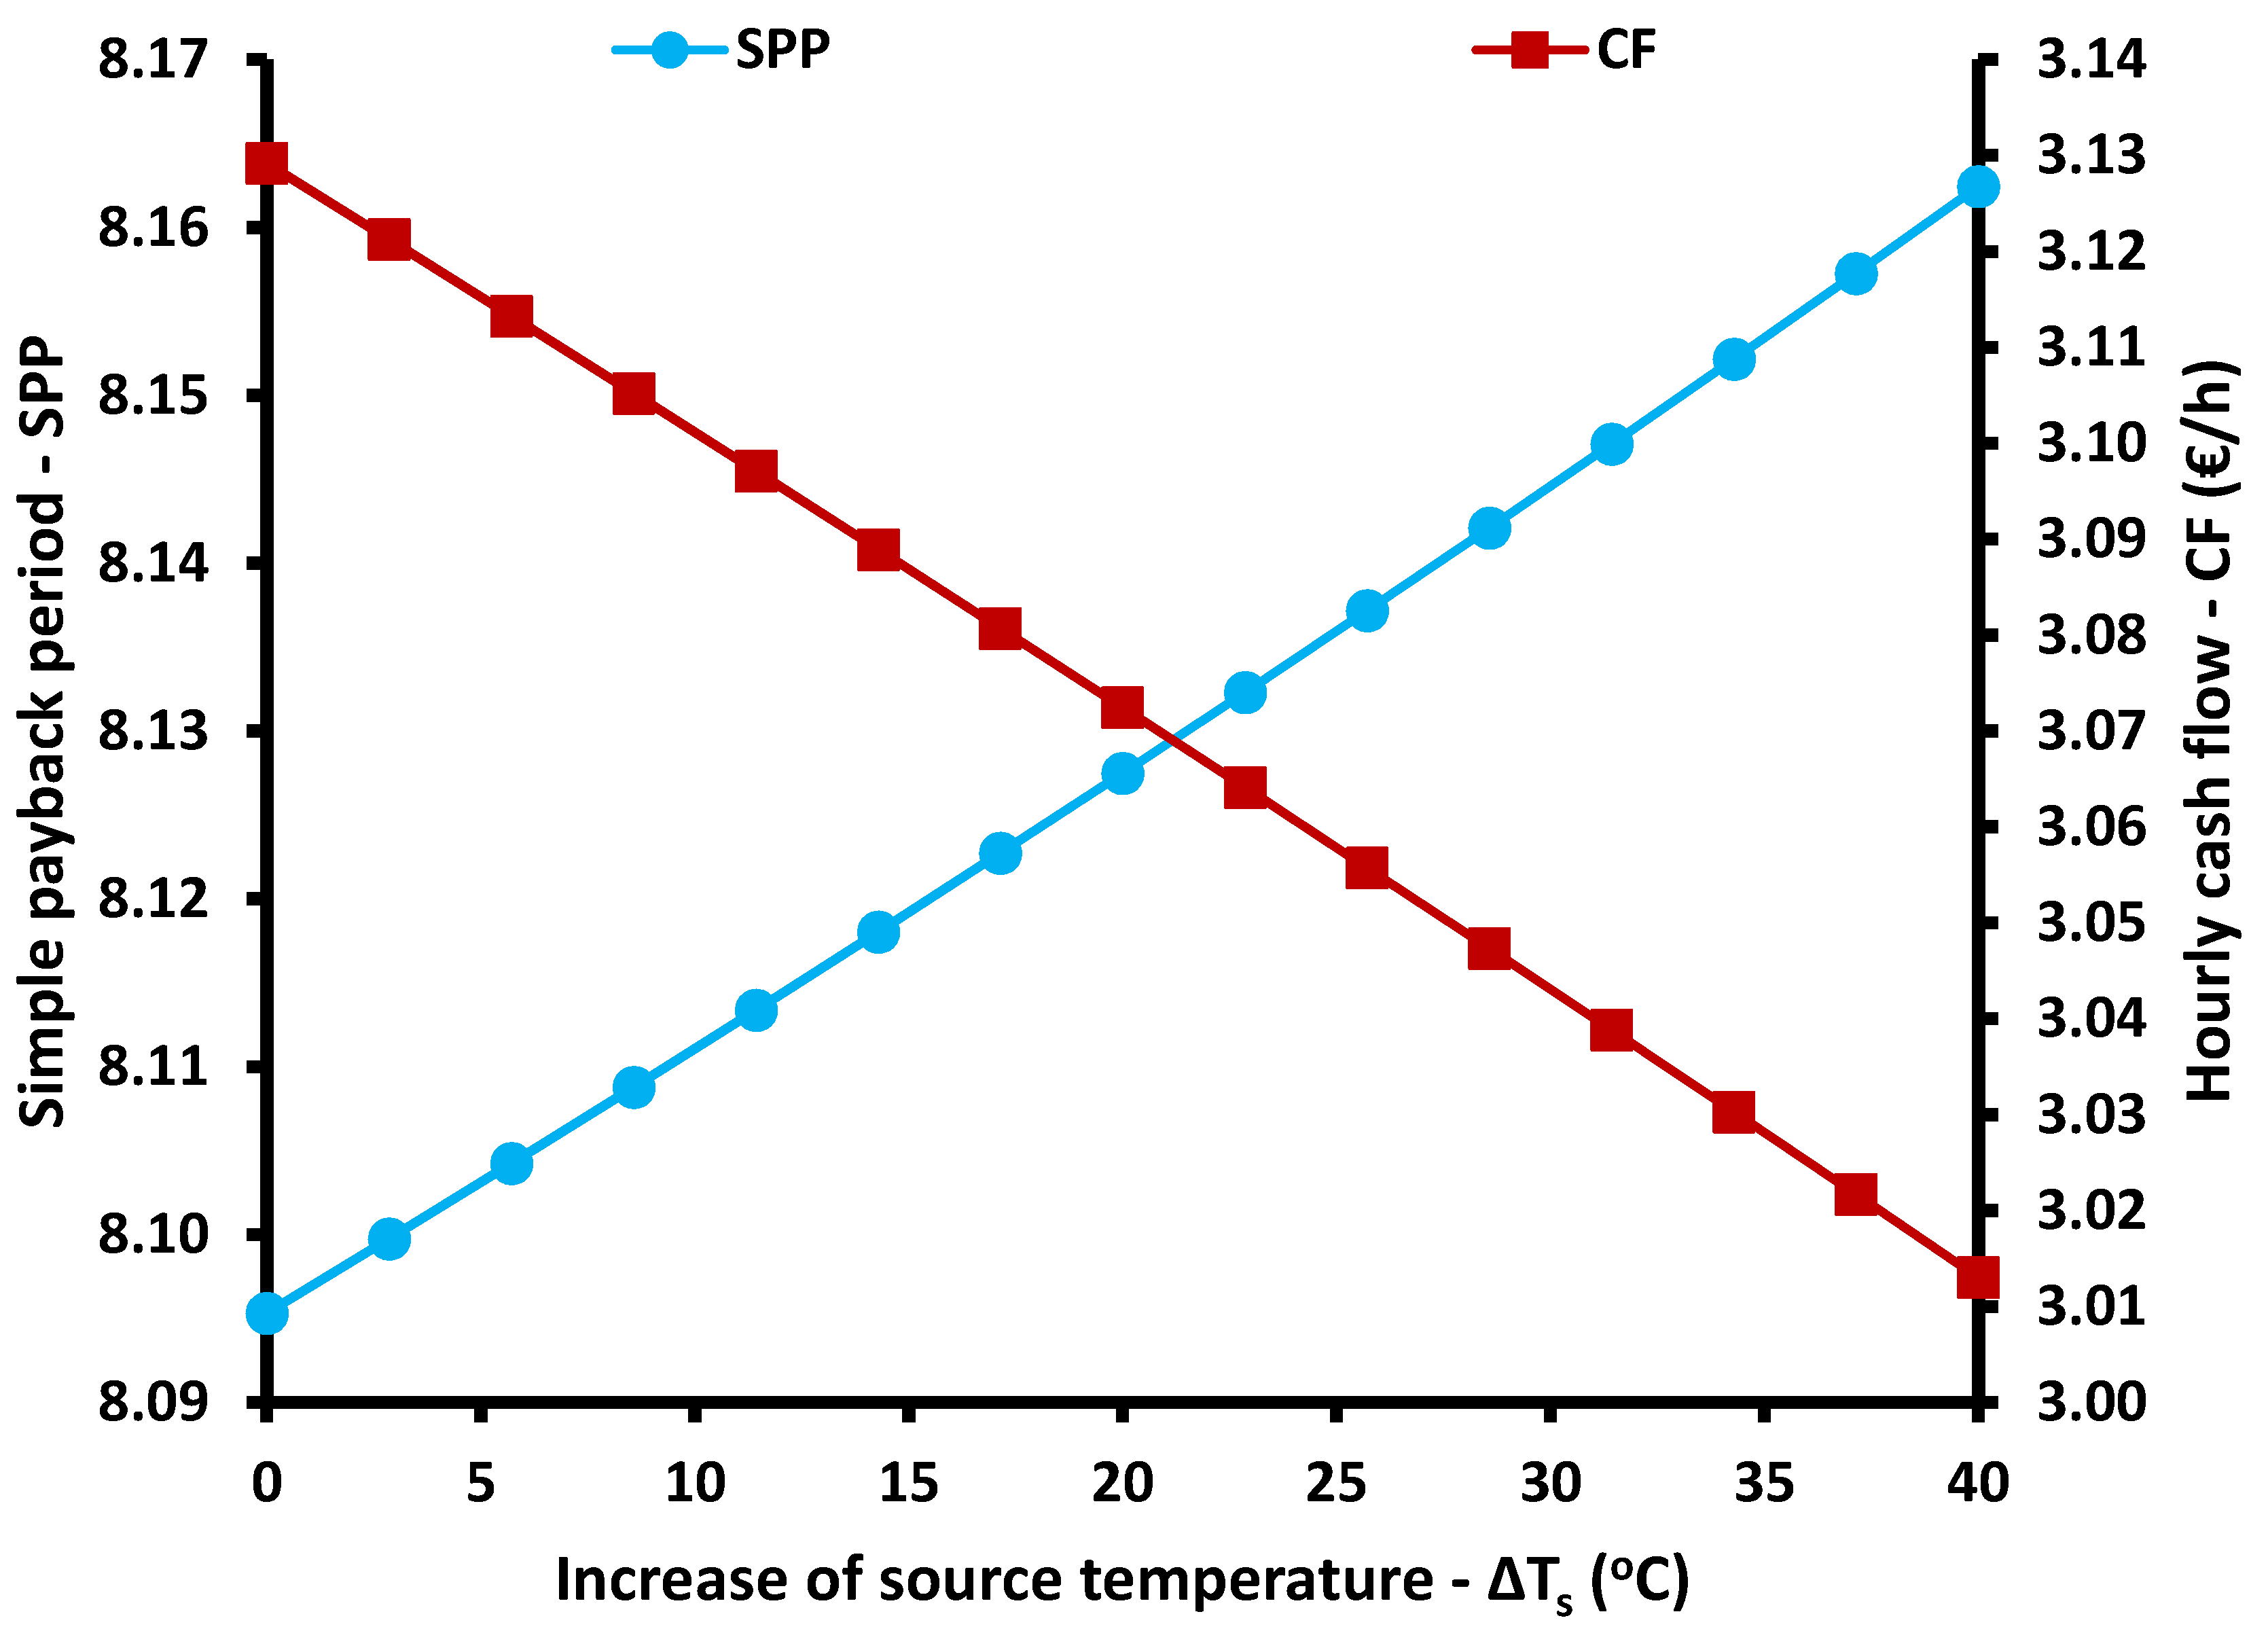
Figure 8, Figure 9 and Figure 10 show the impacts of the heat source temperature in the ORC on the system performance. This analysis is conducted by using a special parameter, which is the increase of the source temperature, and it shows the deviation of the used source temperature from the minimum possible for proper heat transfer in the HRS. The heating and the cooling production is not affected by this parameter, as Figure 8 indicates; however, the electricity production is reduced. Practically, higher heat source temperature leads to higher operating temperatures in the solar systems, and so higher thermal losses are created. Therefore, the heat input in the ORC is reduced, and the results of Figure 8 are justified. The heating/cooling production is not affected because in all cases, the heat input in the generator is 15 kW, and the temperature levels of the hot thermal oil are higher than the generator temperature, and a proper heat transfer is achieved in an easy way (high-temperature difference between the thermal oil and the generator temperature level). The increase in the heat source temperature can reduce electricity production from 3.61 kW to 5.73 K when there is a temperature increase of 40 K. This is a significant reduction that is not desired. Figure 9 shows that the increase of the heat source temperature leads to a decrease in energy and exergy efficiencies, reasonable results according to the electricity production behavior. The energy efficiency is decreased from 40.72% to 39.89%, while the exergy efficiency from 12.71% to 11.82% for a 40 K temperature increase in the heat source temperature. Moreover, Figure 10 proves that higher heat source temperature increases the SPP from 8.095 years to 8.162 years, while the hourly cash flow is reduced from 3.13 €/h to 3.01 €/h.

3.2. Variation of the Parameters of the Absorption Heat Pump

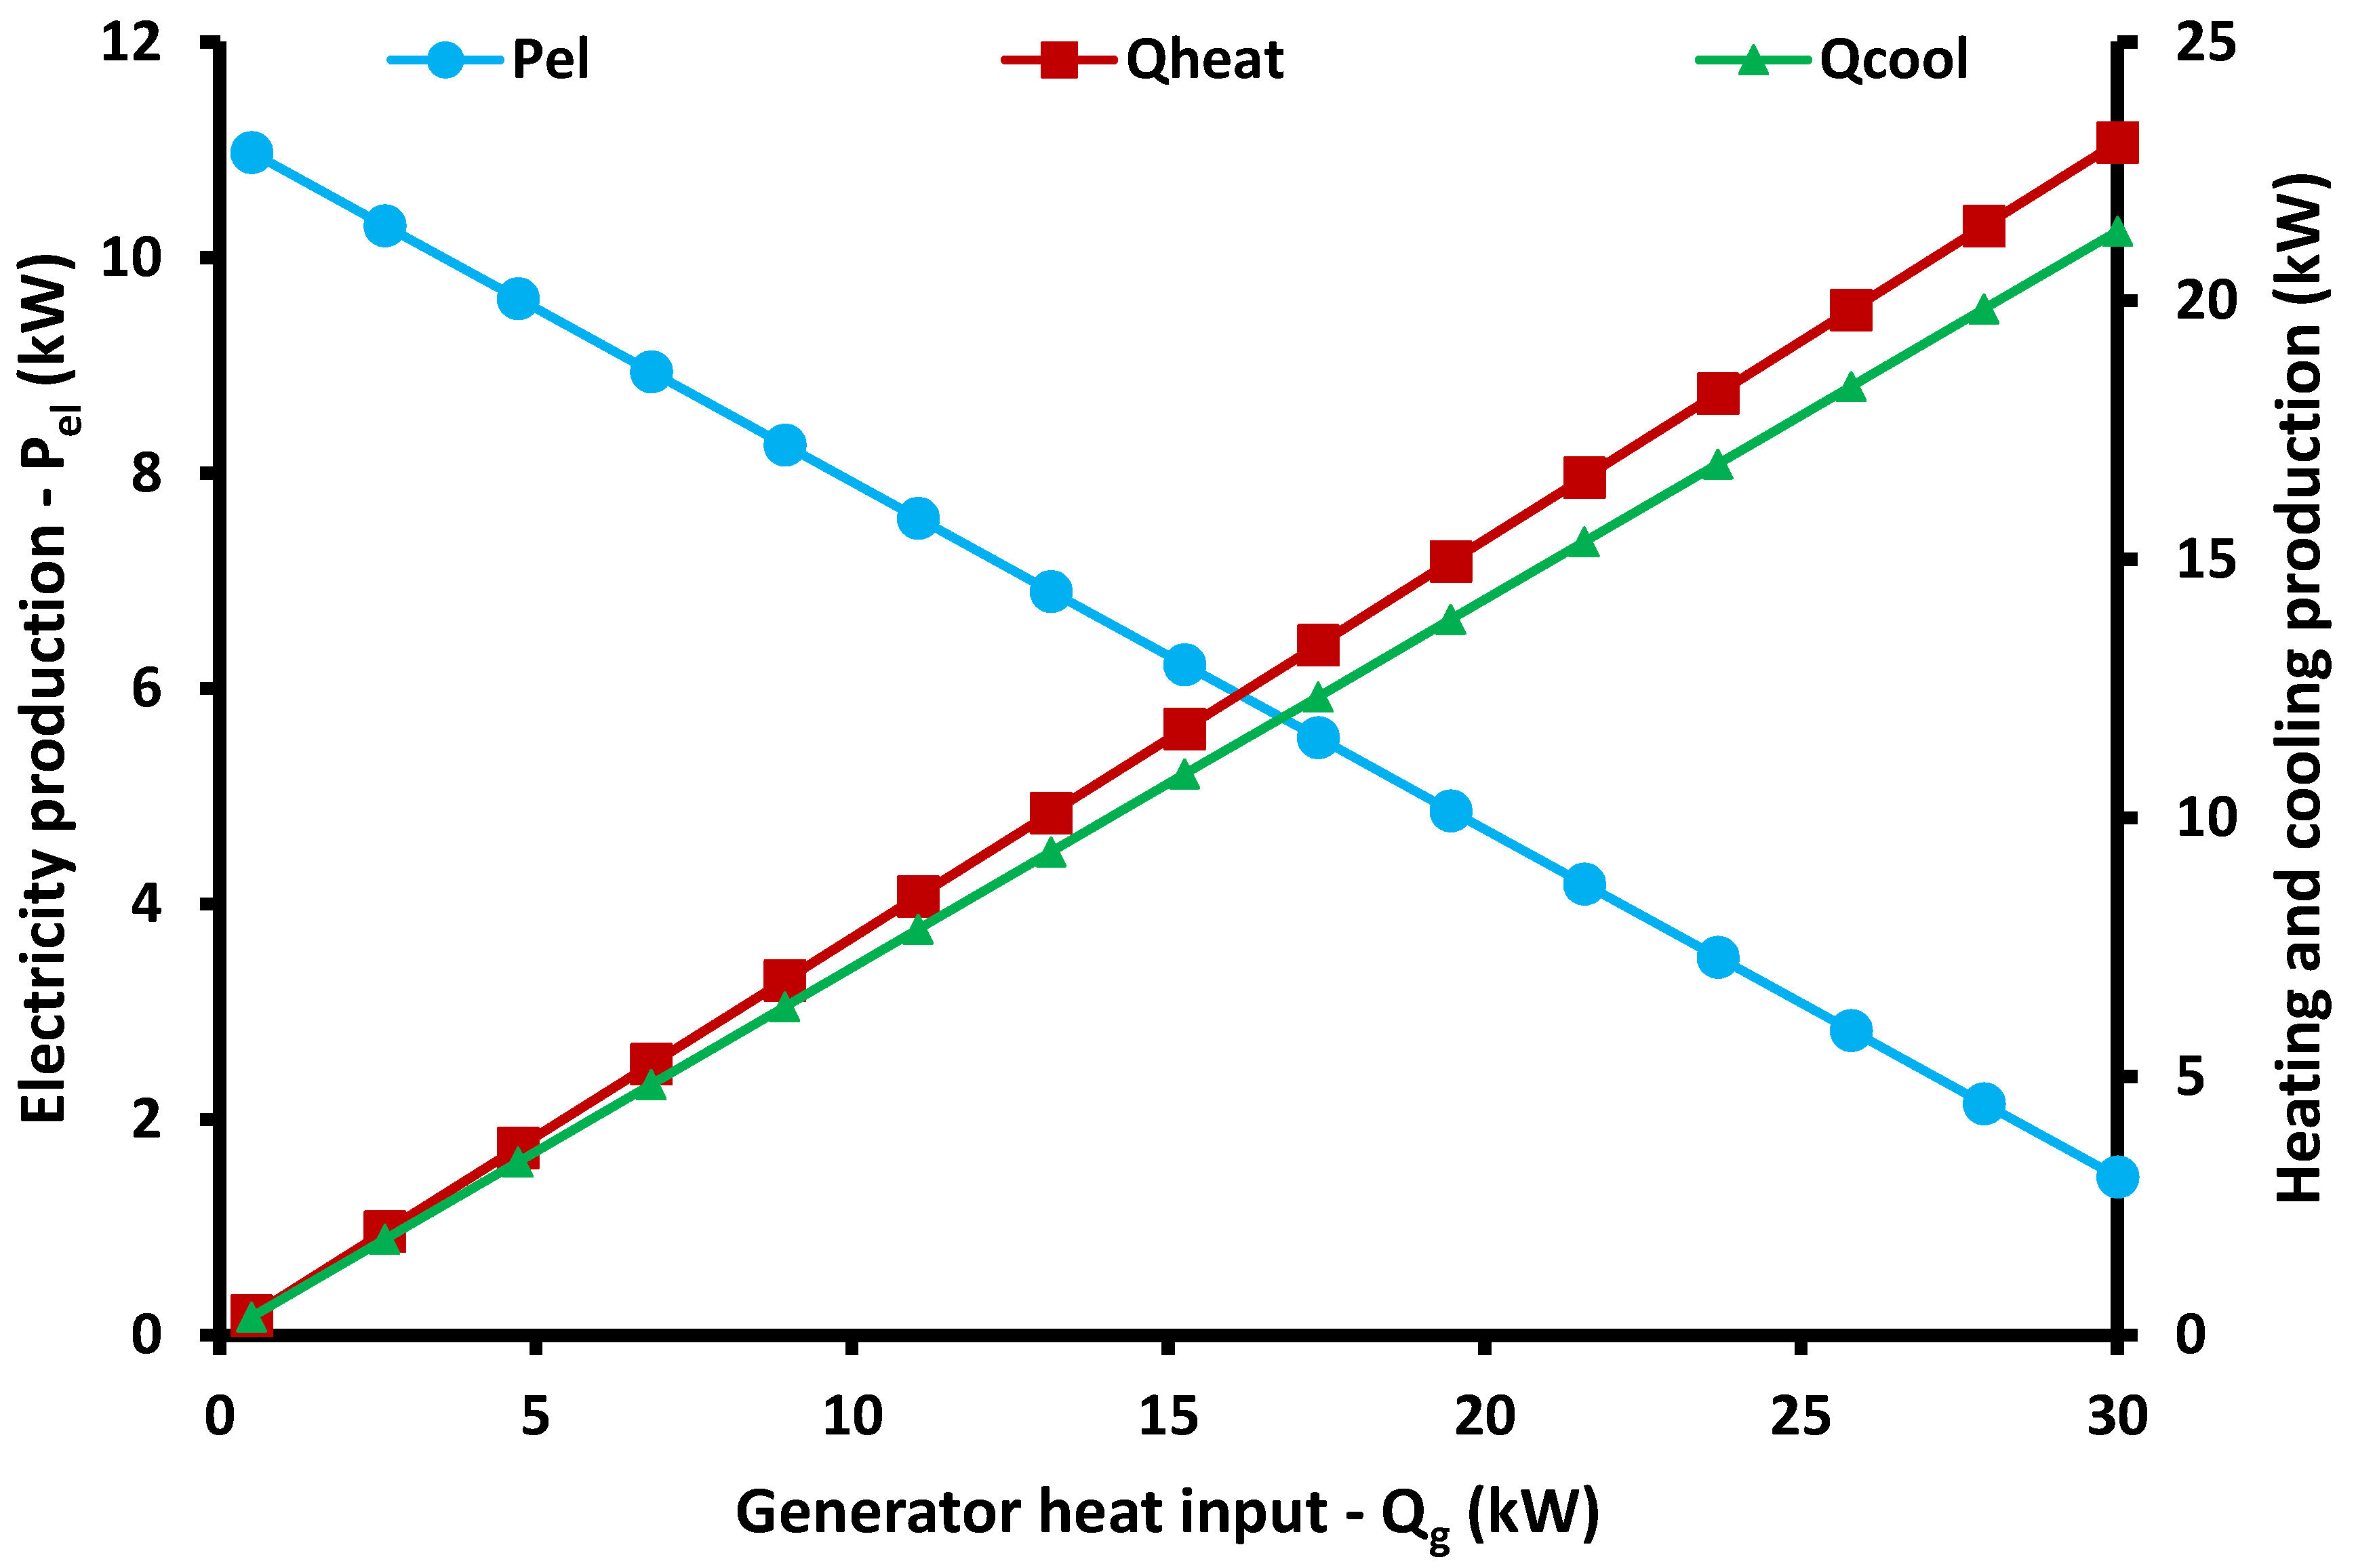
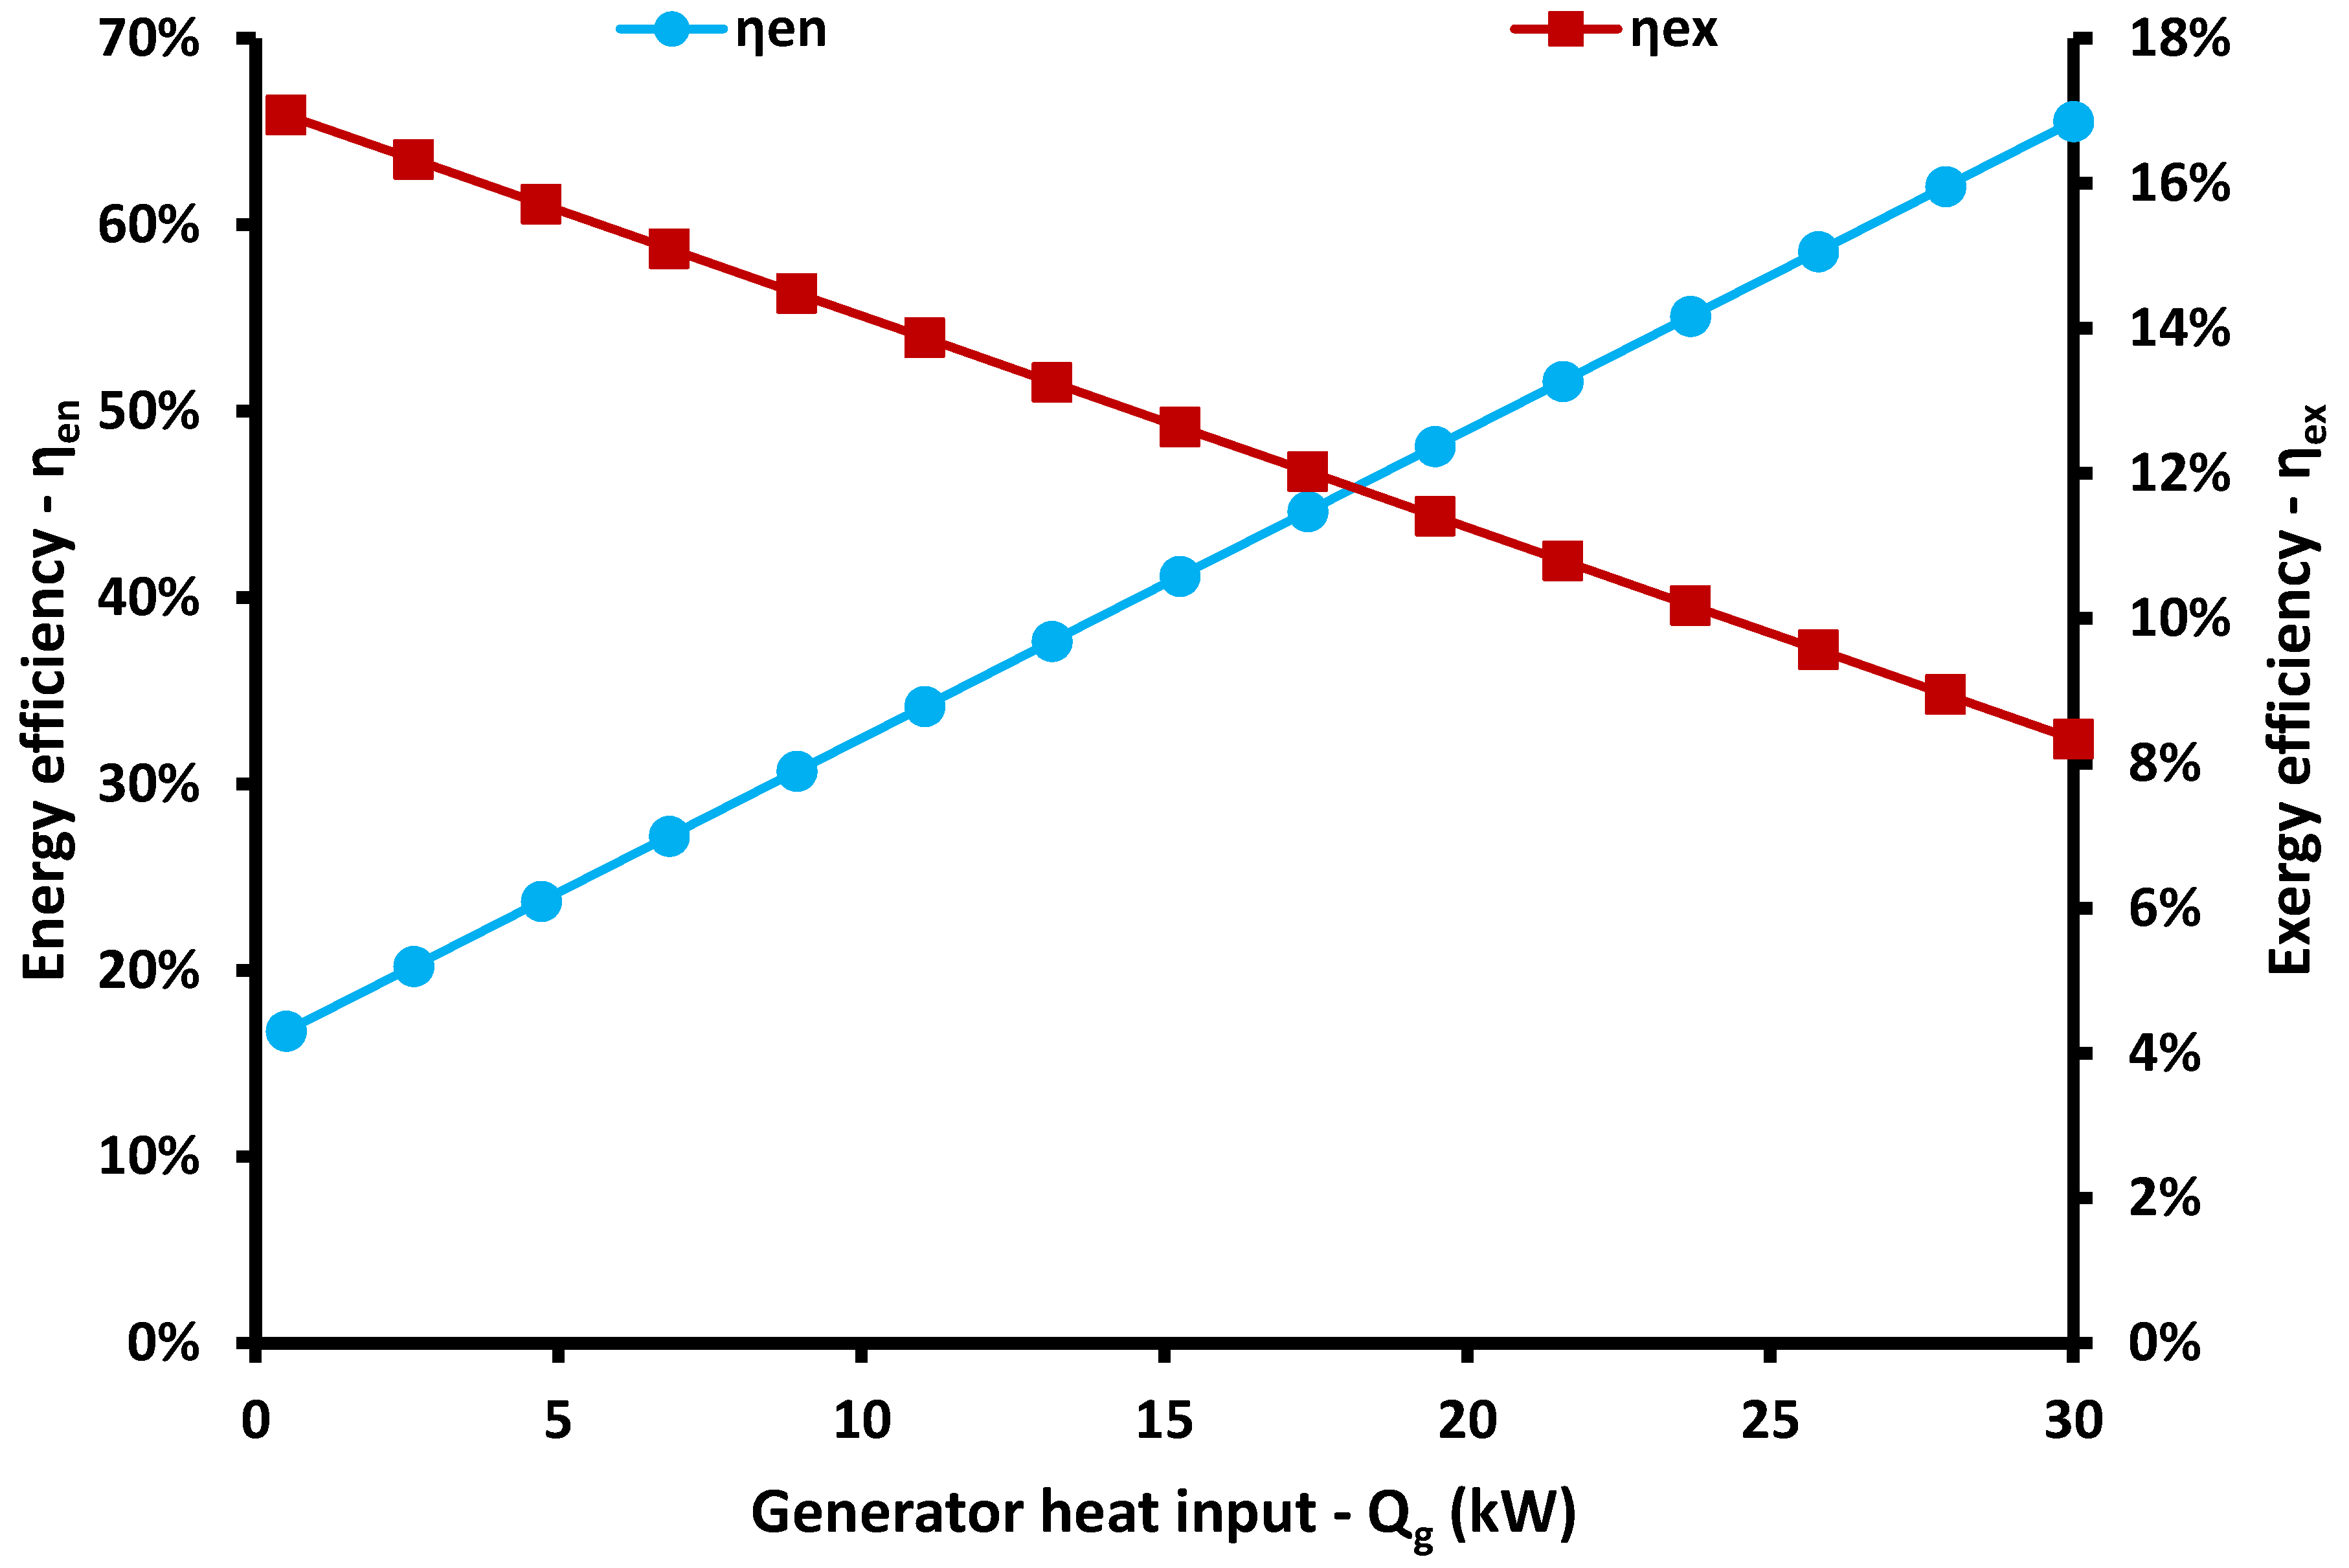
The next part of the parametric analysis regards studies about parameters that influence mainly the absorption heat pump. Figure 11, Figure 12 and Figure 13 include results about the impact of the generator heat input on the system performance. In the default scenario, a heat rate of 15 kW has been selected, while in the parametric study, it ranges from zero to 30 kW. The heating and cooling increase linearly with the increase of the generator heat input, and they reach 23.06 kW and 21.34 kW, respectively. On the other hand, the electricity production decreases linearly with the increase of the generator temperature and it can be 1.47 kW for 30 kW of generator heat input. Practically, higher heat input amounts in the generator decrease the available heat input in the HRS, and thus the electricity production is reduced. Figure 12 shows that the increase of the generator heat input can increase energy efficiency by up to 65.53%, while it reduces the exergy efficiency by 8.33%. These results are explained by the way that the generator temperature influences on the useful products. More specifically, the exergy efficiency is influenced more by electricity production than by the other useful outputs, and thus the decrease in electricity production reduces the exergy efficiency. On the other hand, the simultaneous increases in cooling and heating production lead to an increase in energy efficiency. Figure 13 shows that higher generator temperature leads to lower SPP and a higher hourly cash flow rate, which indicates that the increase of the heat input in the generator leads to a more viable investment. The lowest SPP can be 5.74 years. However, the high generator temperature leads to low electricity production, which reduces the ability of the system to satisfy the electricity demand of the respective application. Therefore, the generator temperature has to be adjusted to meet the needs of the examined application in every case.
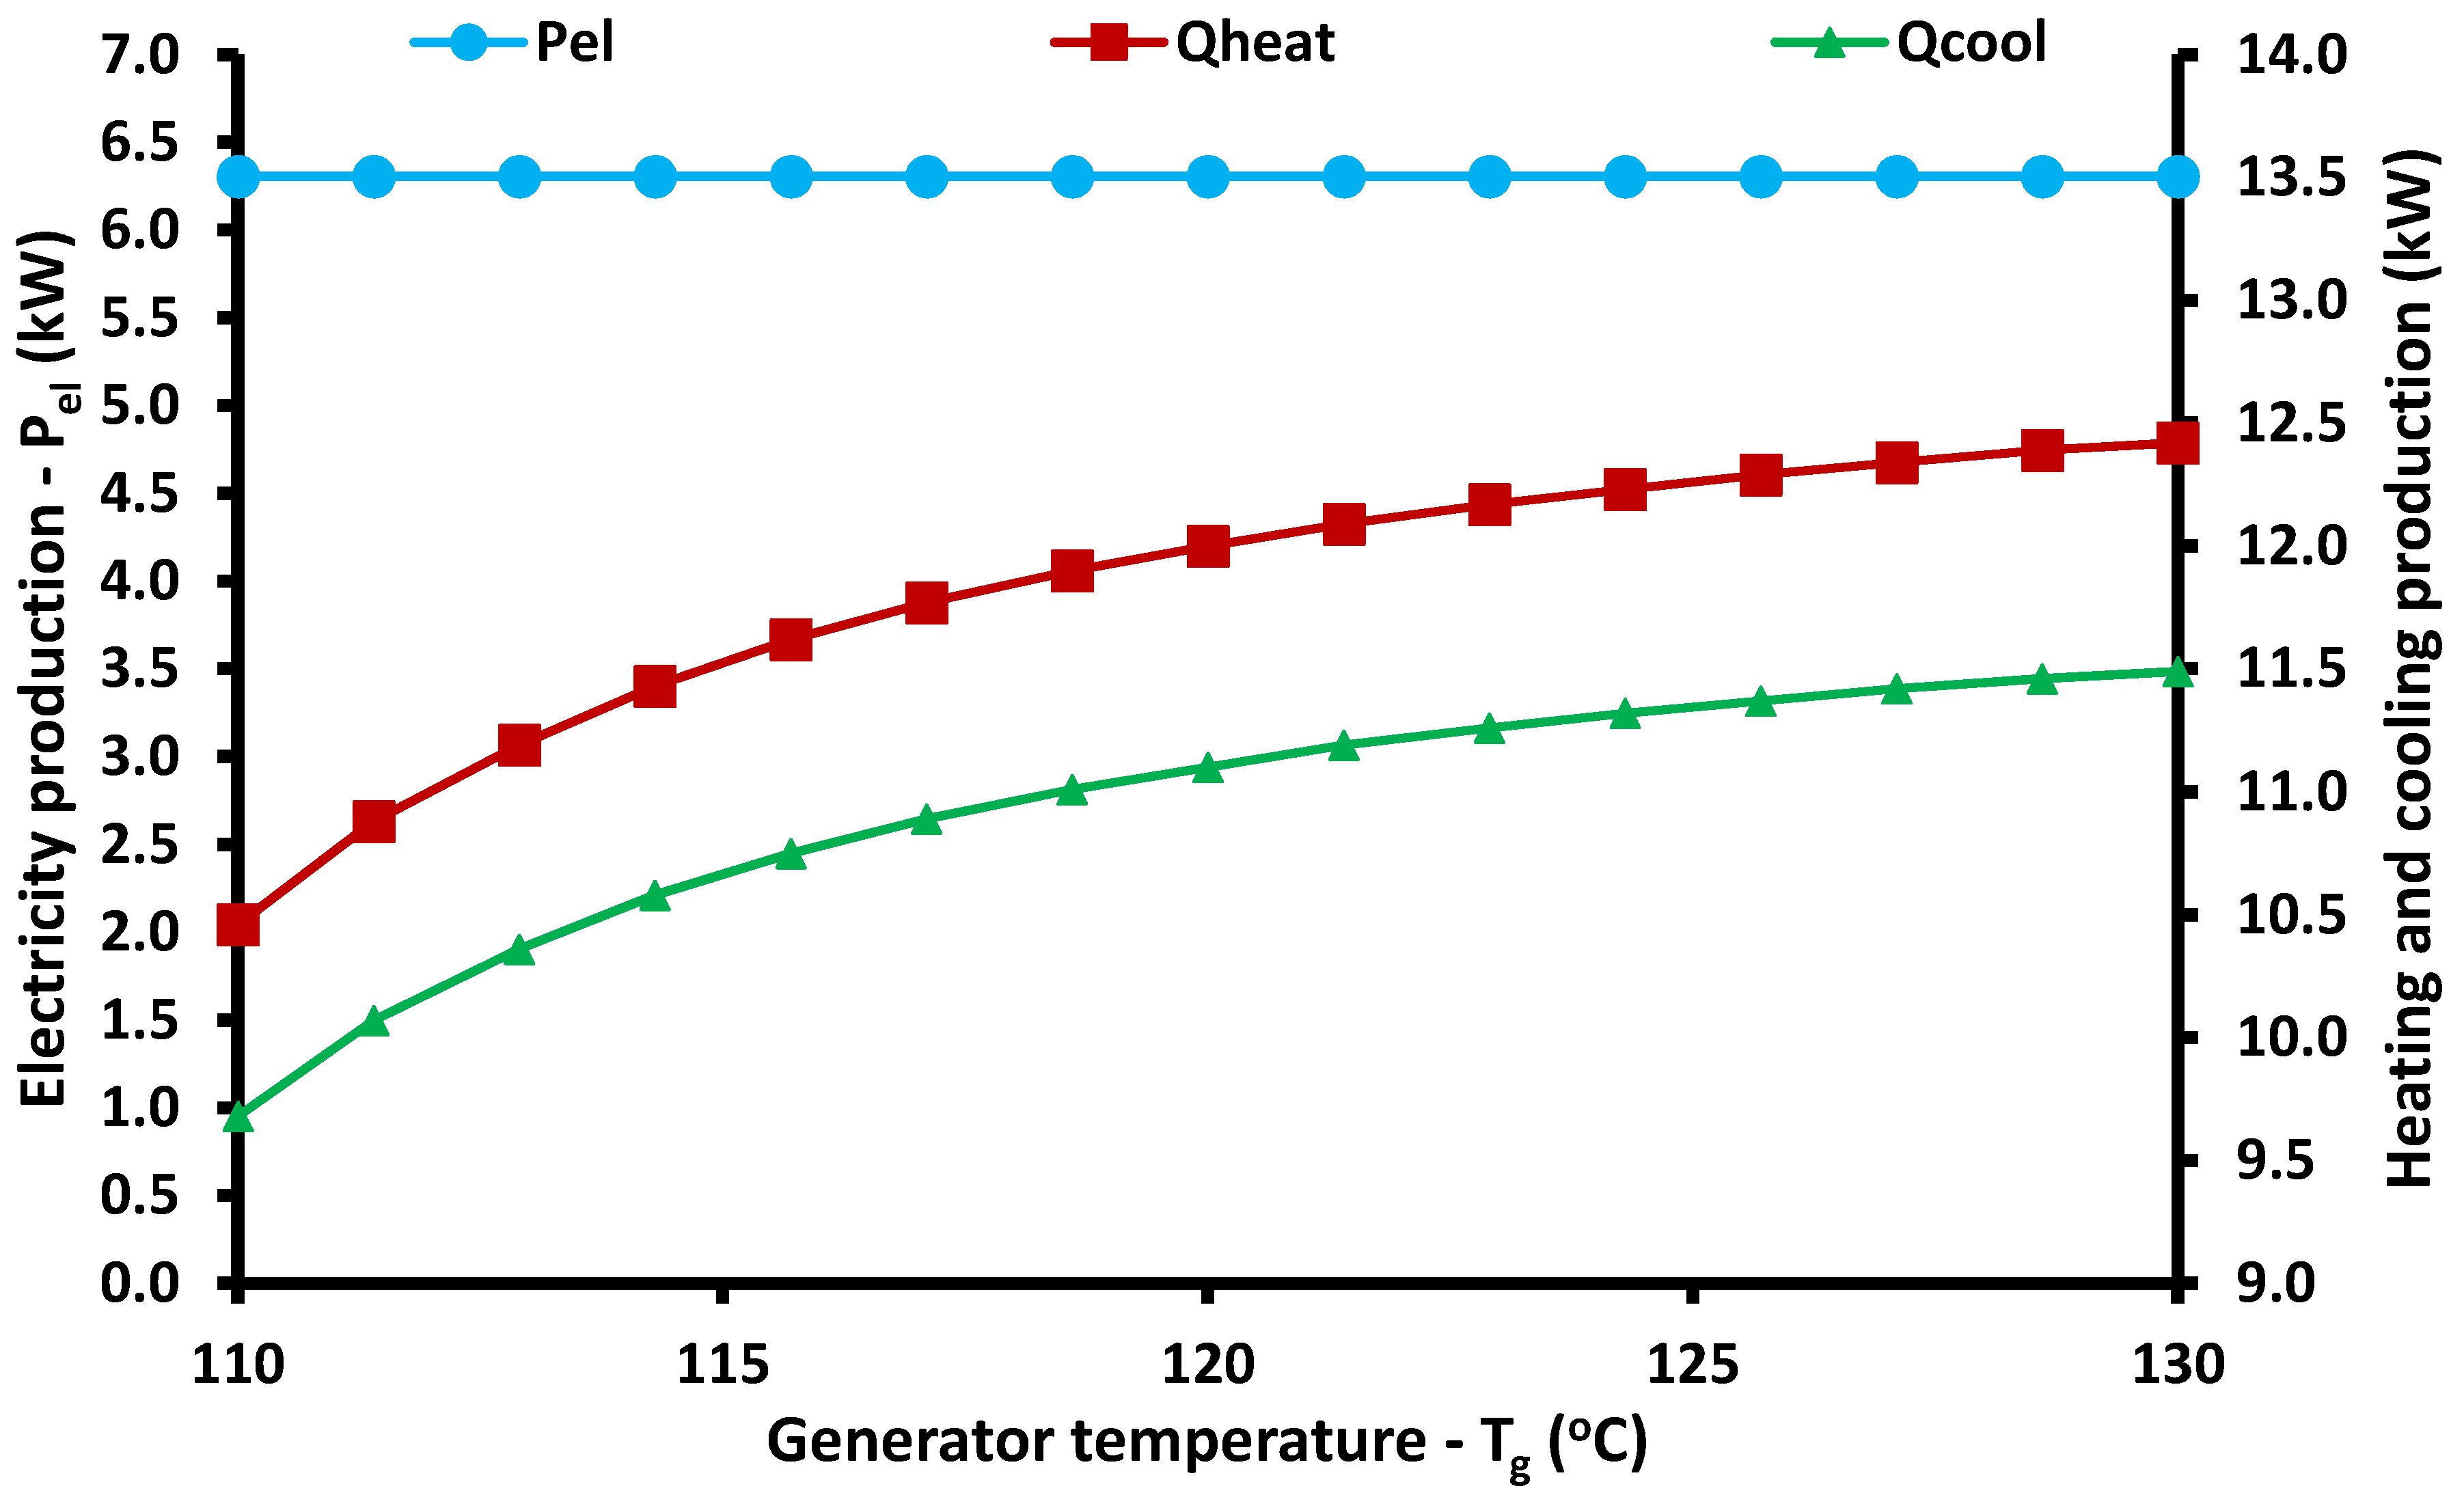
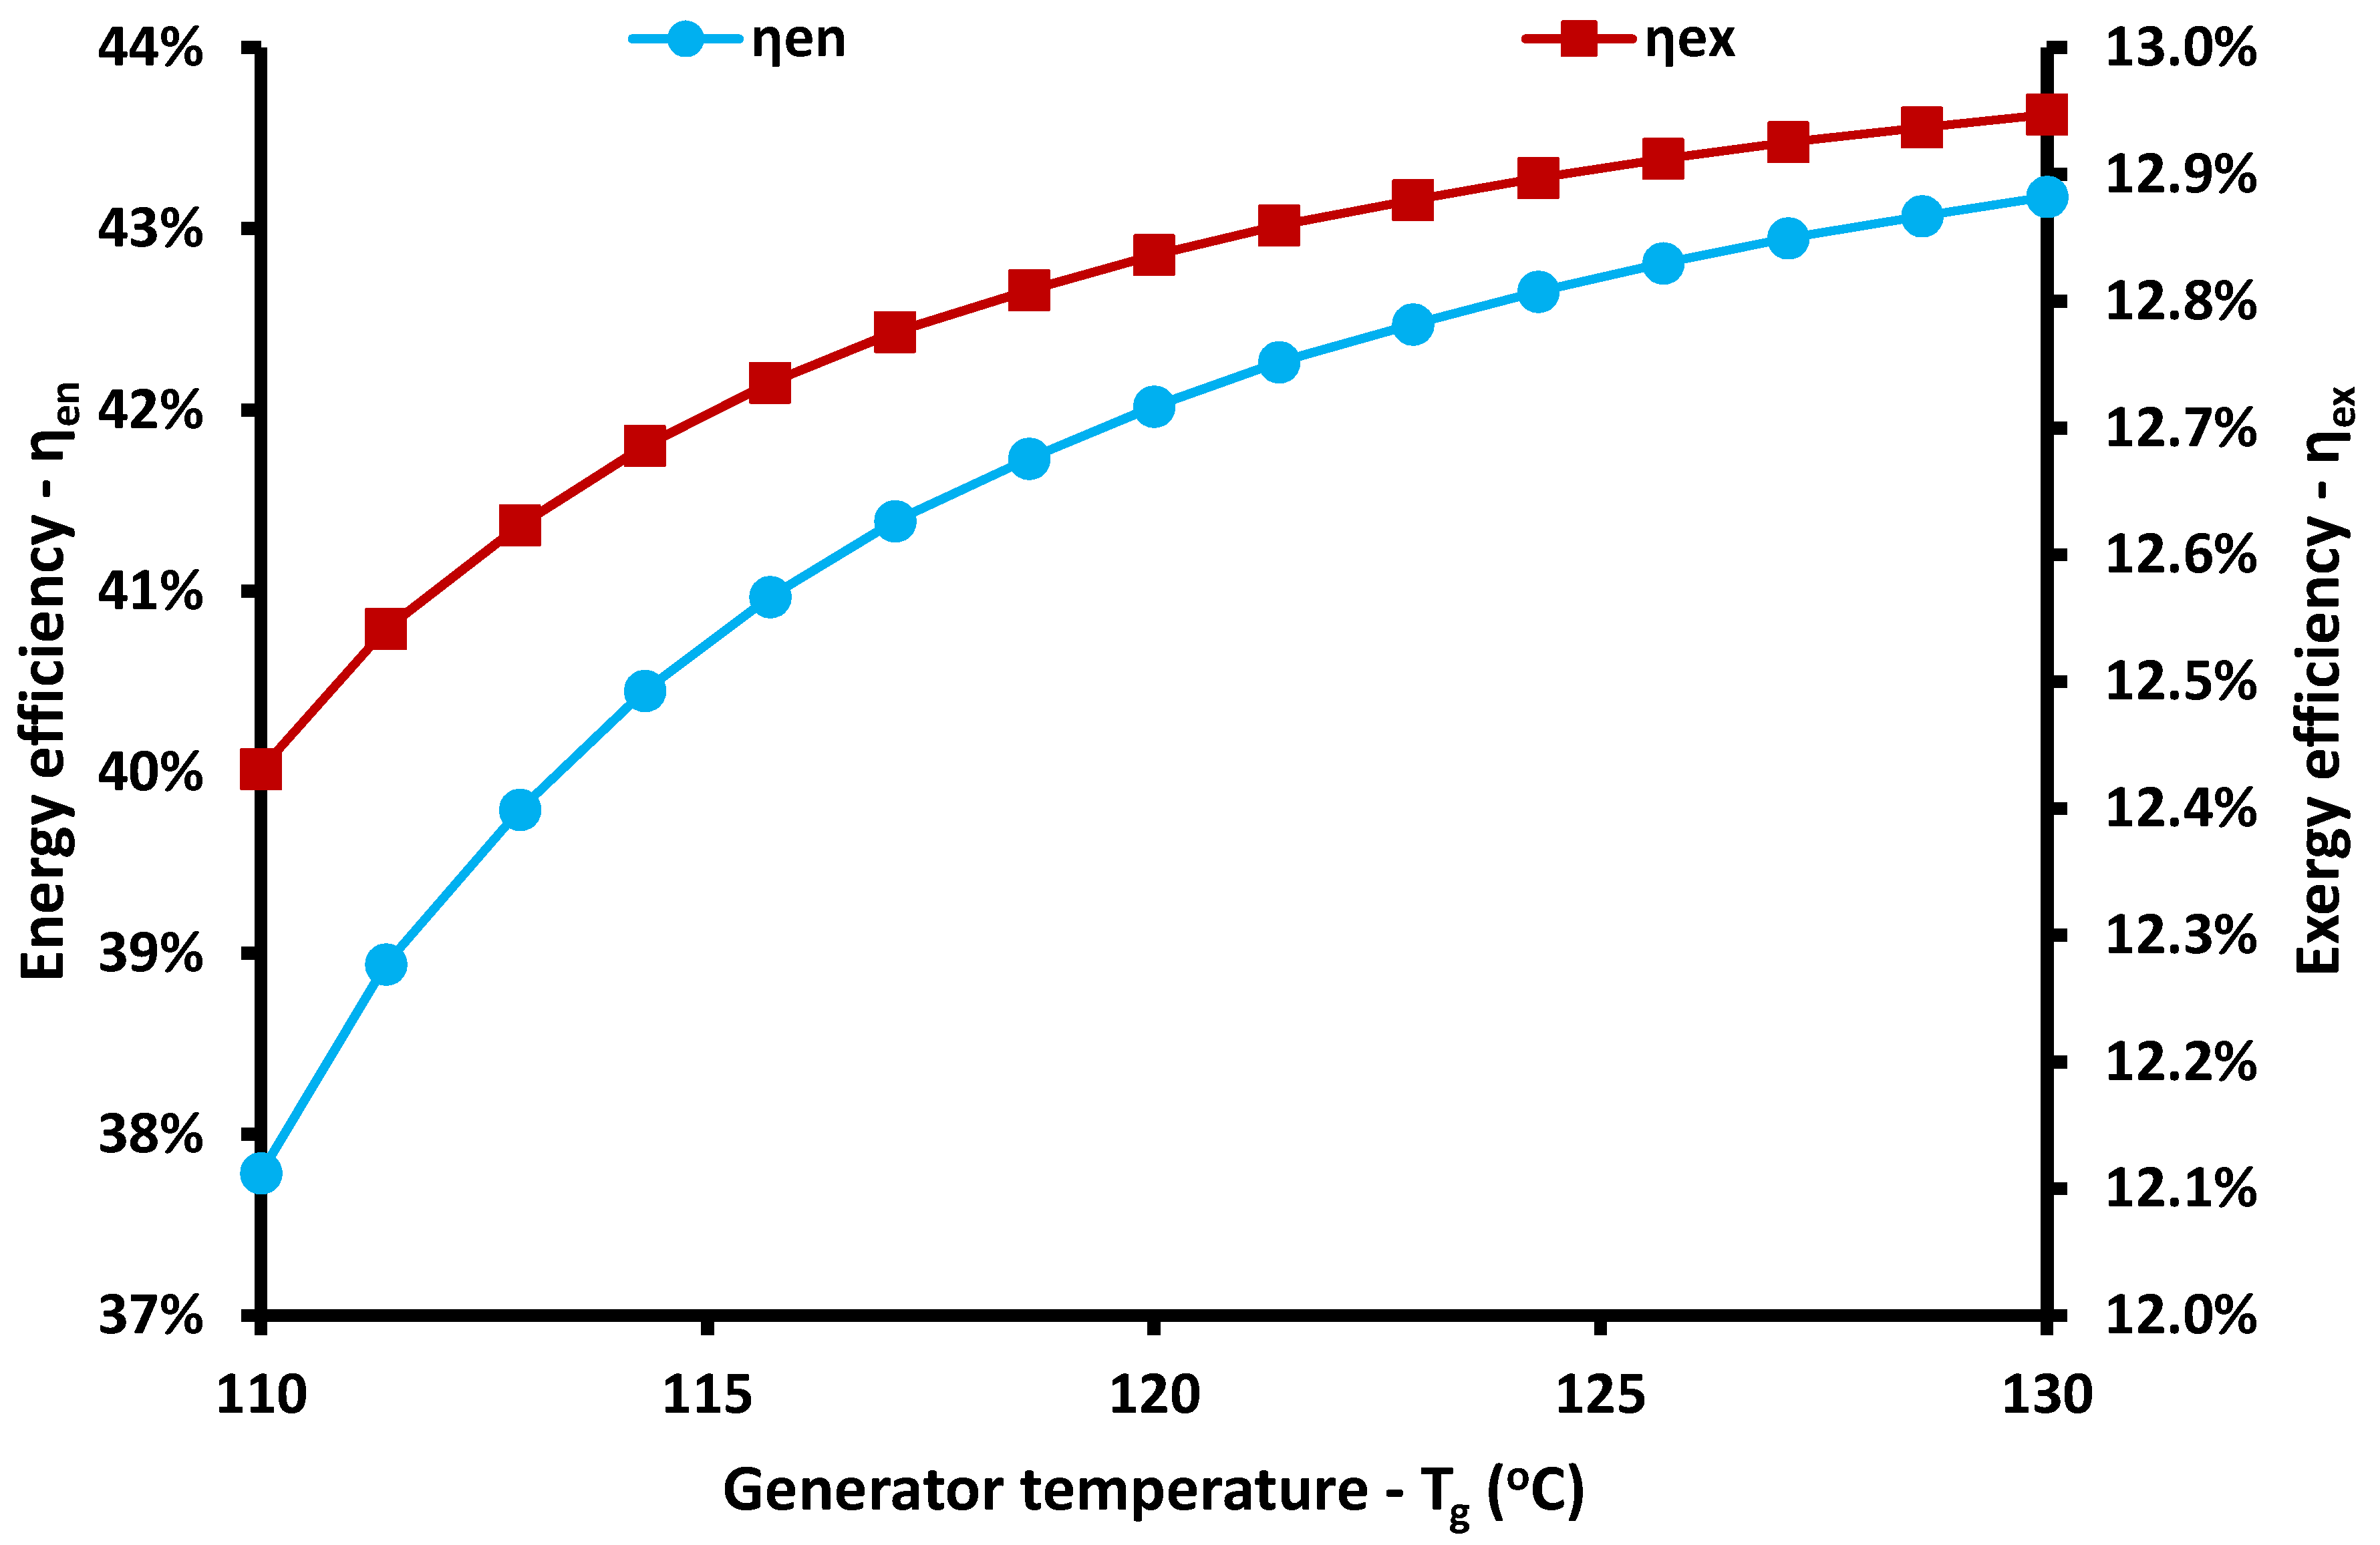
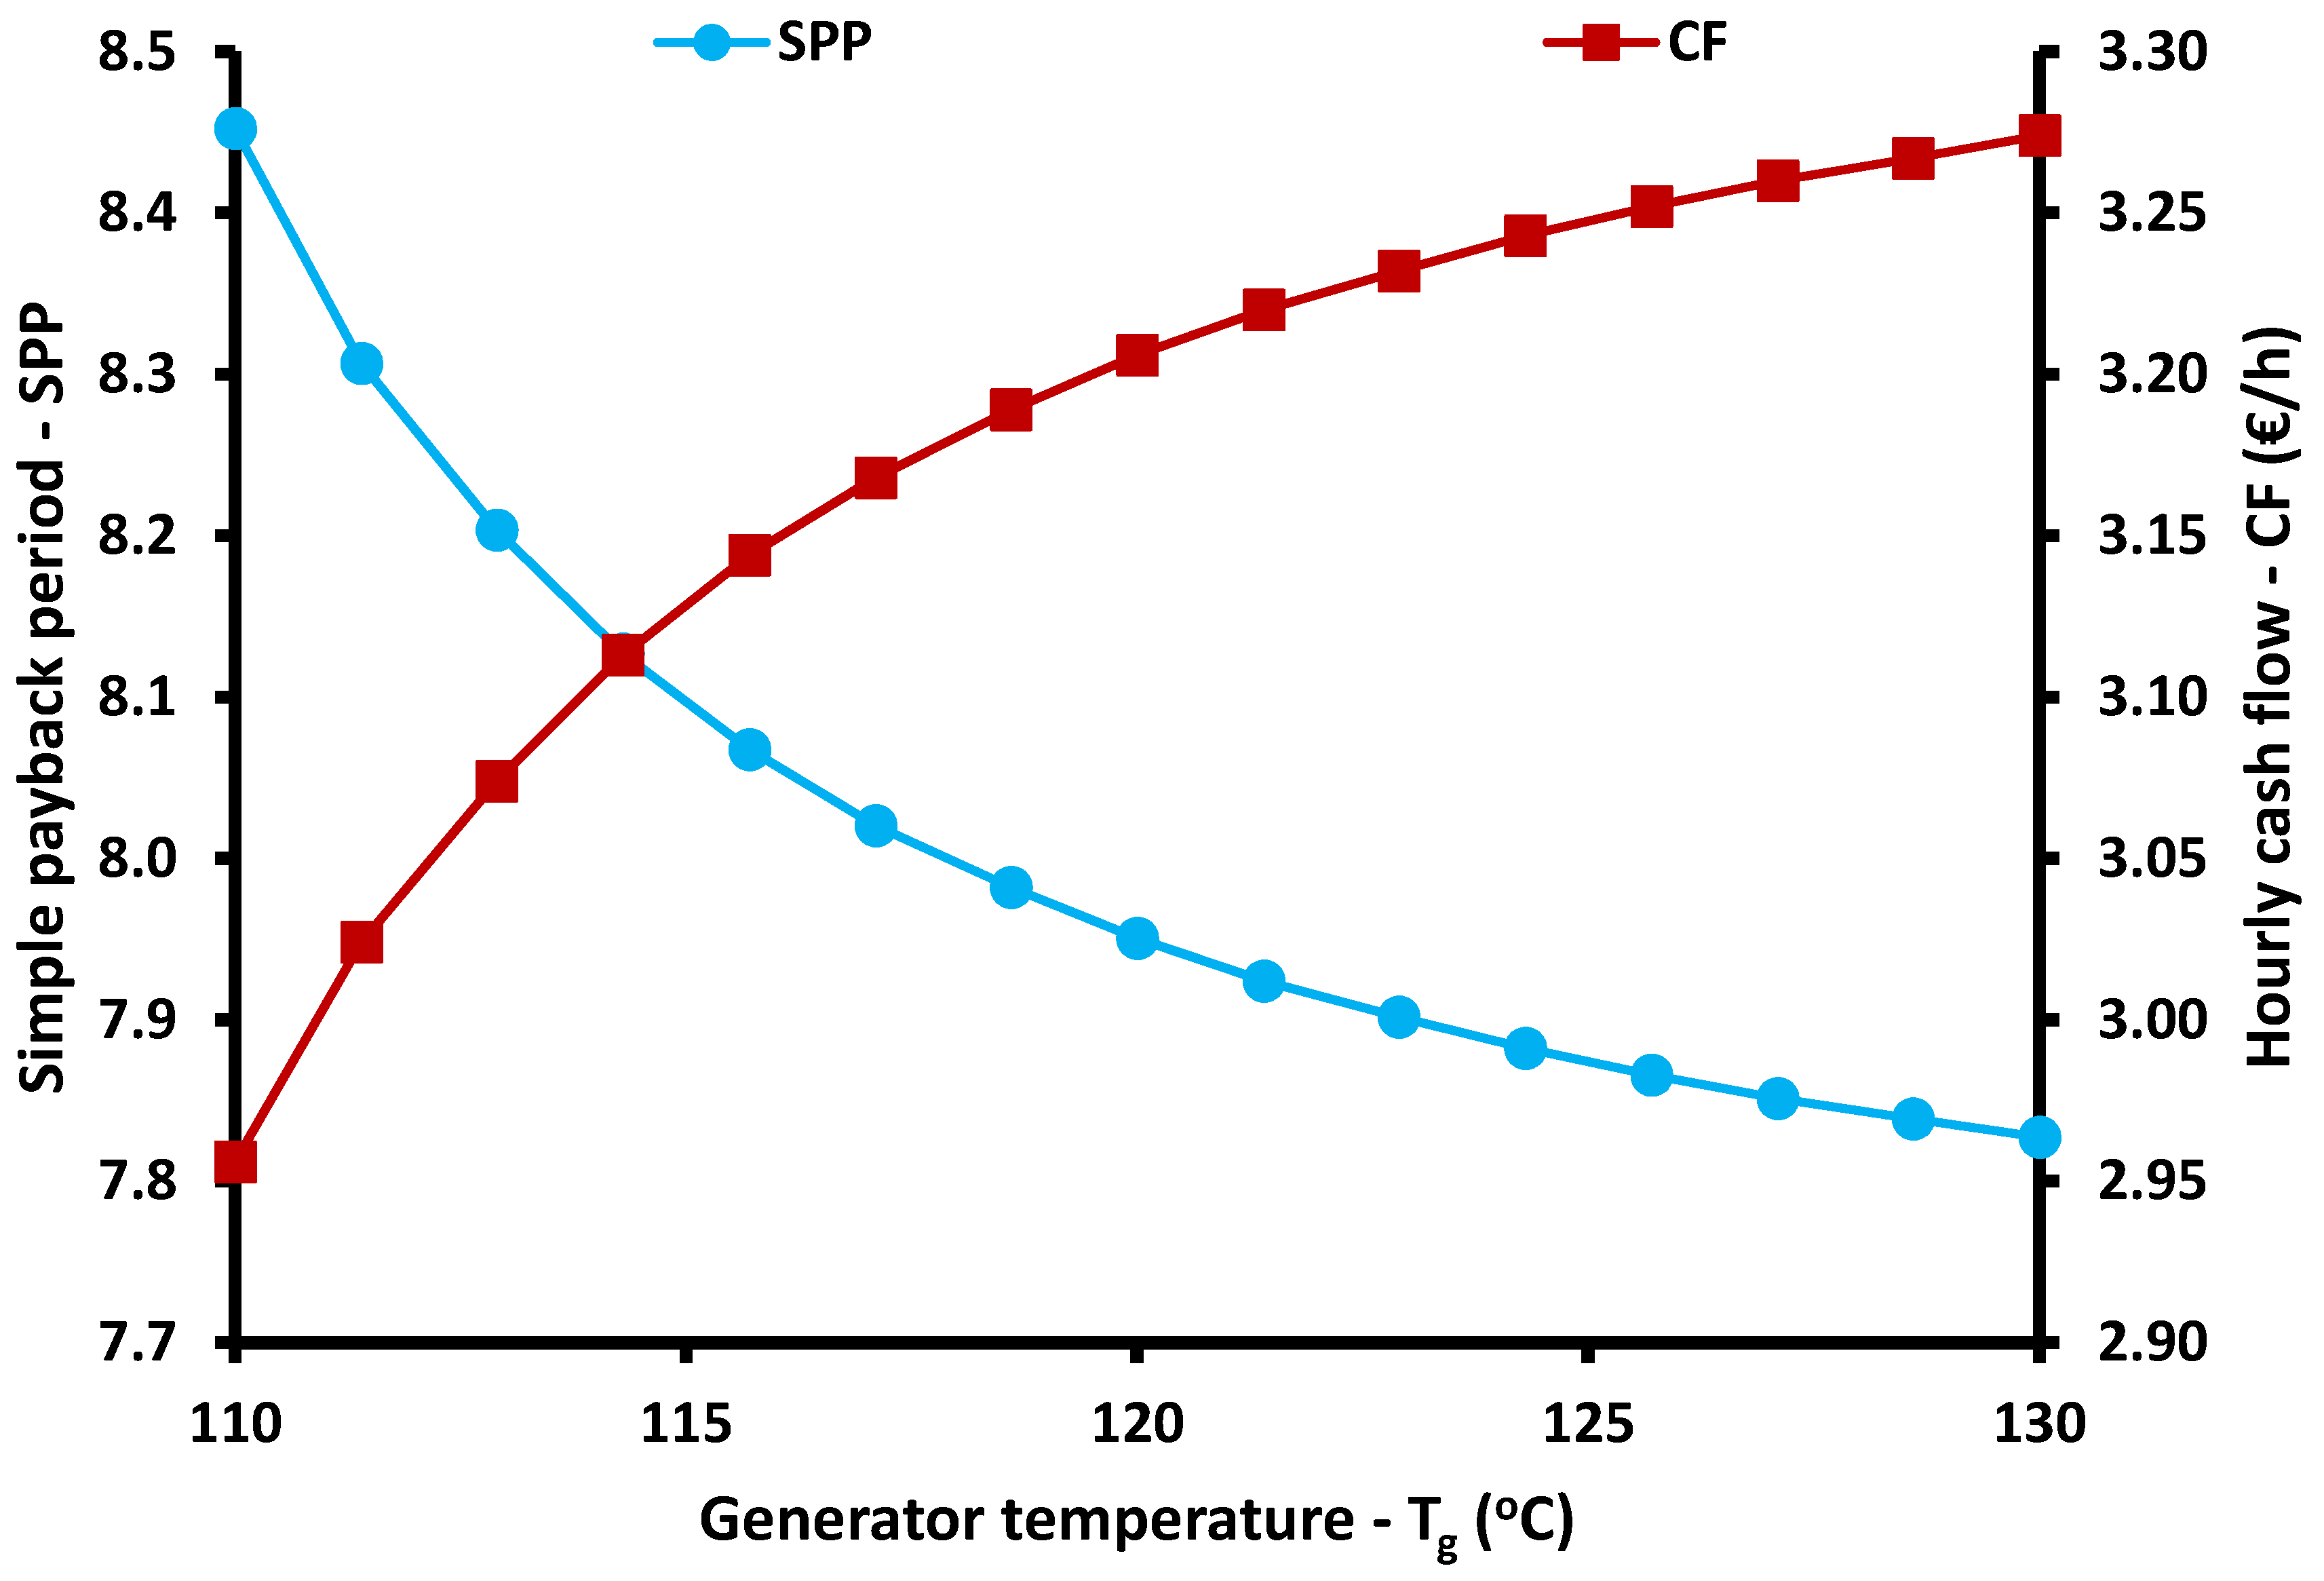
Figure 14, Figure 15 and Figure 16 are devoted to presenting the impact of the generator temperature on the system performance. Figure 14 indicates that higher generator temperature leads to higher electricity cooling and heating production because the higher generator temperature increases the performance of the absorption heat pump. The electricity production is kept constant with the increase of the generator temperature because the heat input in the generator is constant. Figure 15 shows that higher generator temperature leads to an increase in energy and exergy efficiencies. The energy efficiency can reach 43.18%, while the exergy efficiency 12.95%. The increase in the useful outputs leads to higher efficiencies, and so the results of Figure 15 are reasonable. Figure 16 shows that the increase of the generator temperature leads to lower SPP and a higher hourly cash flow rate. The SPP can be reduced by up to 7.82 years, while the cash flow rate can be increased by up to 3.23 €/h.

3.3. Variation of the Solar Irradiation Parameters

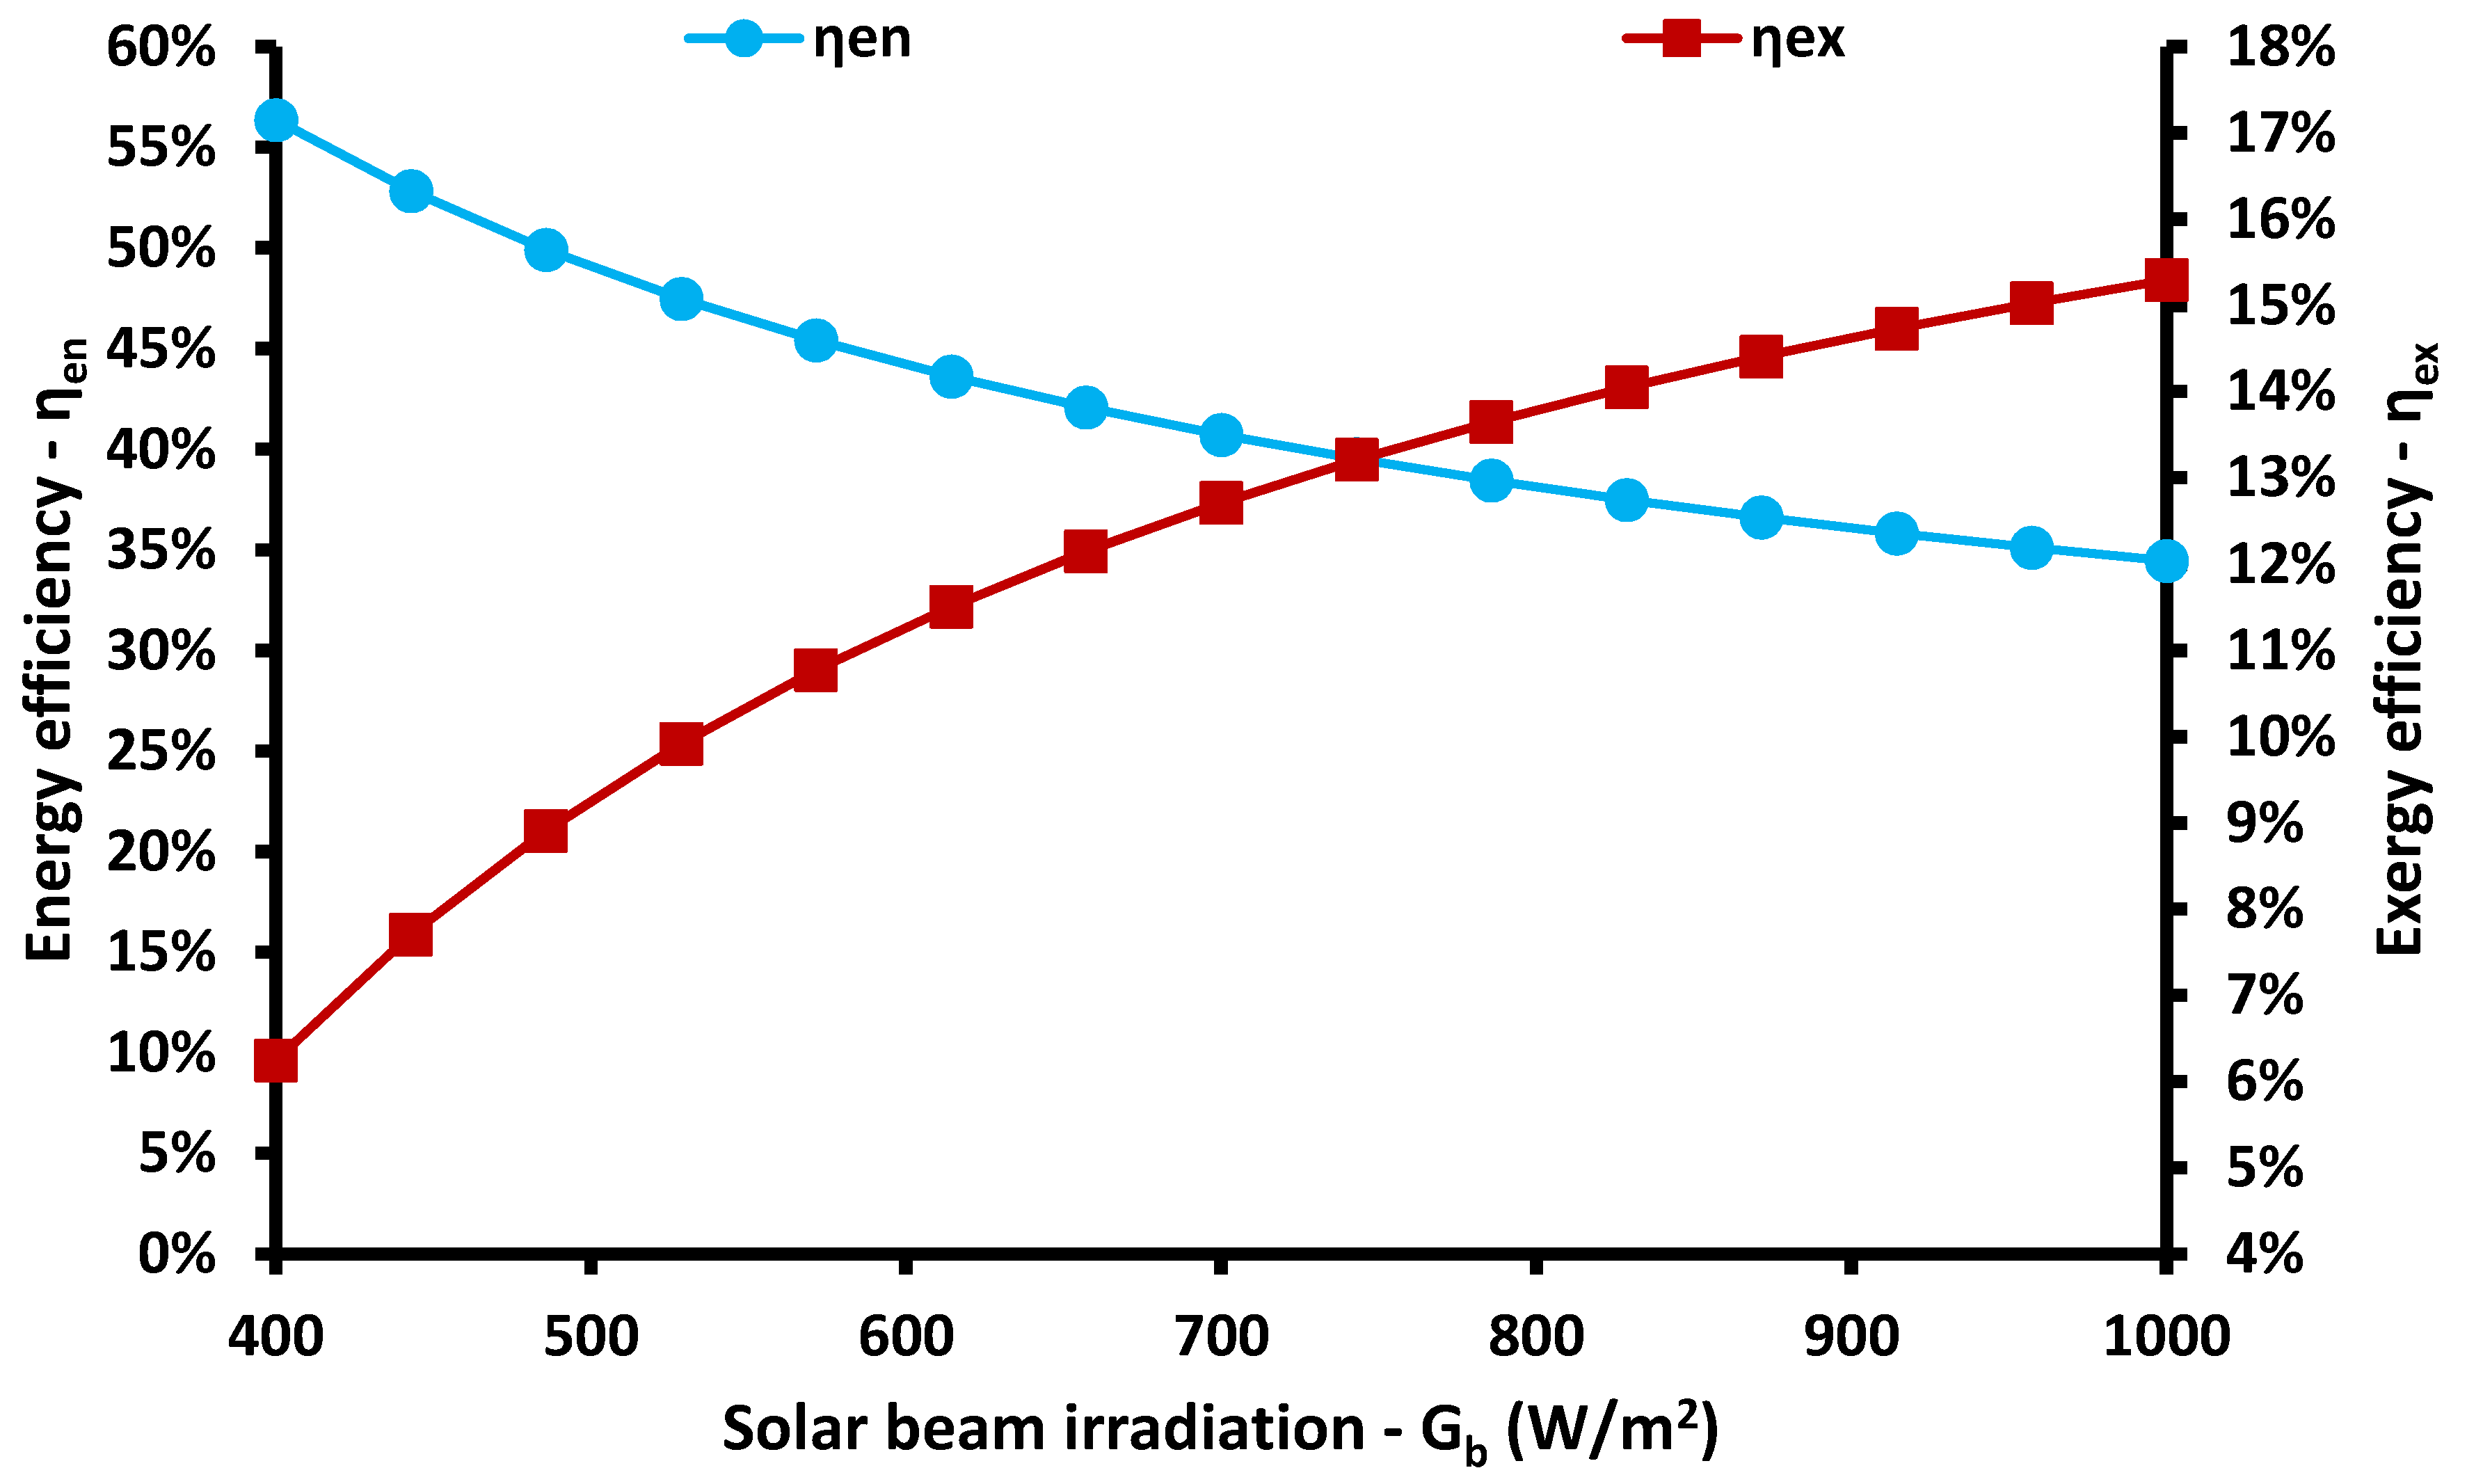
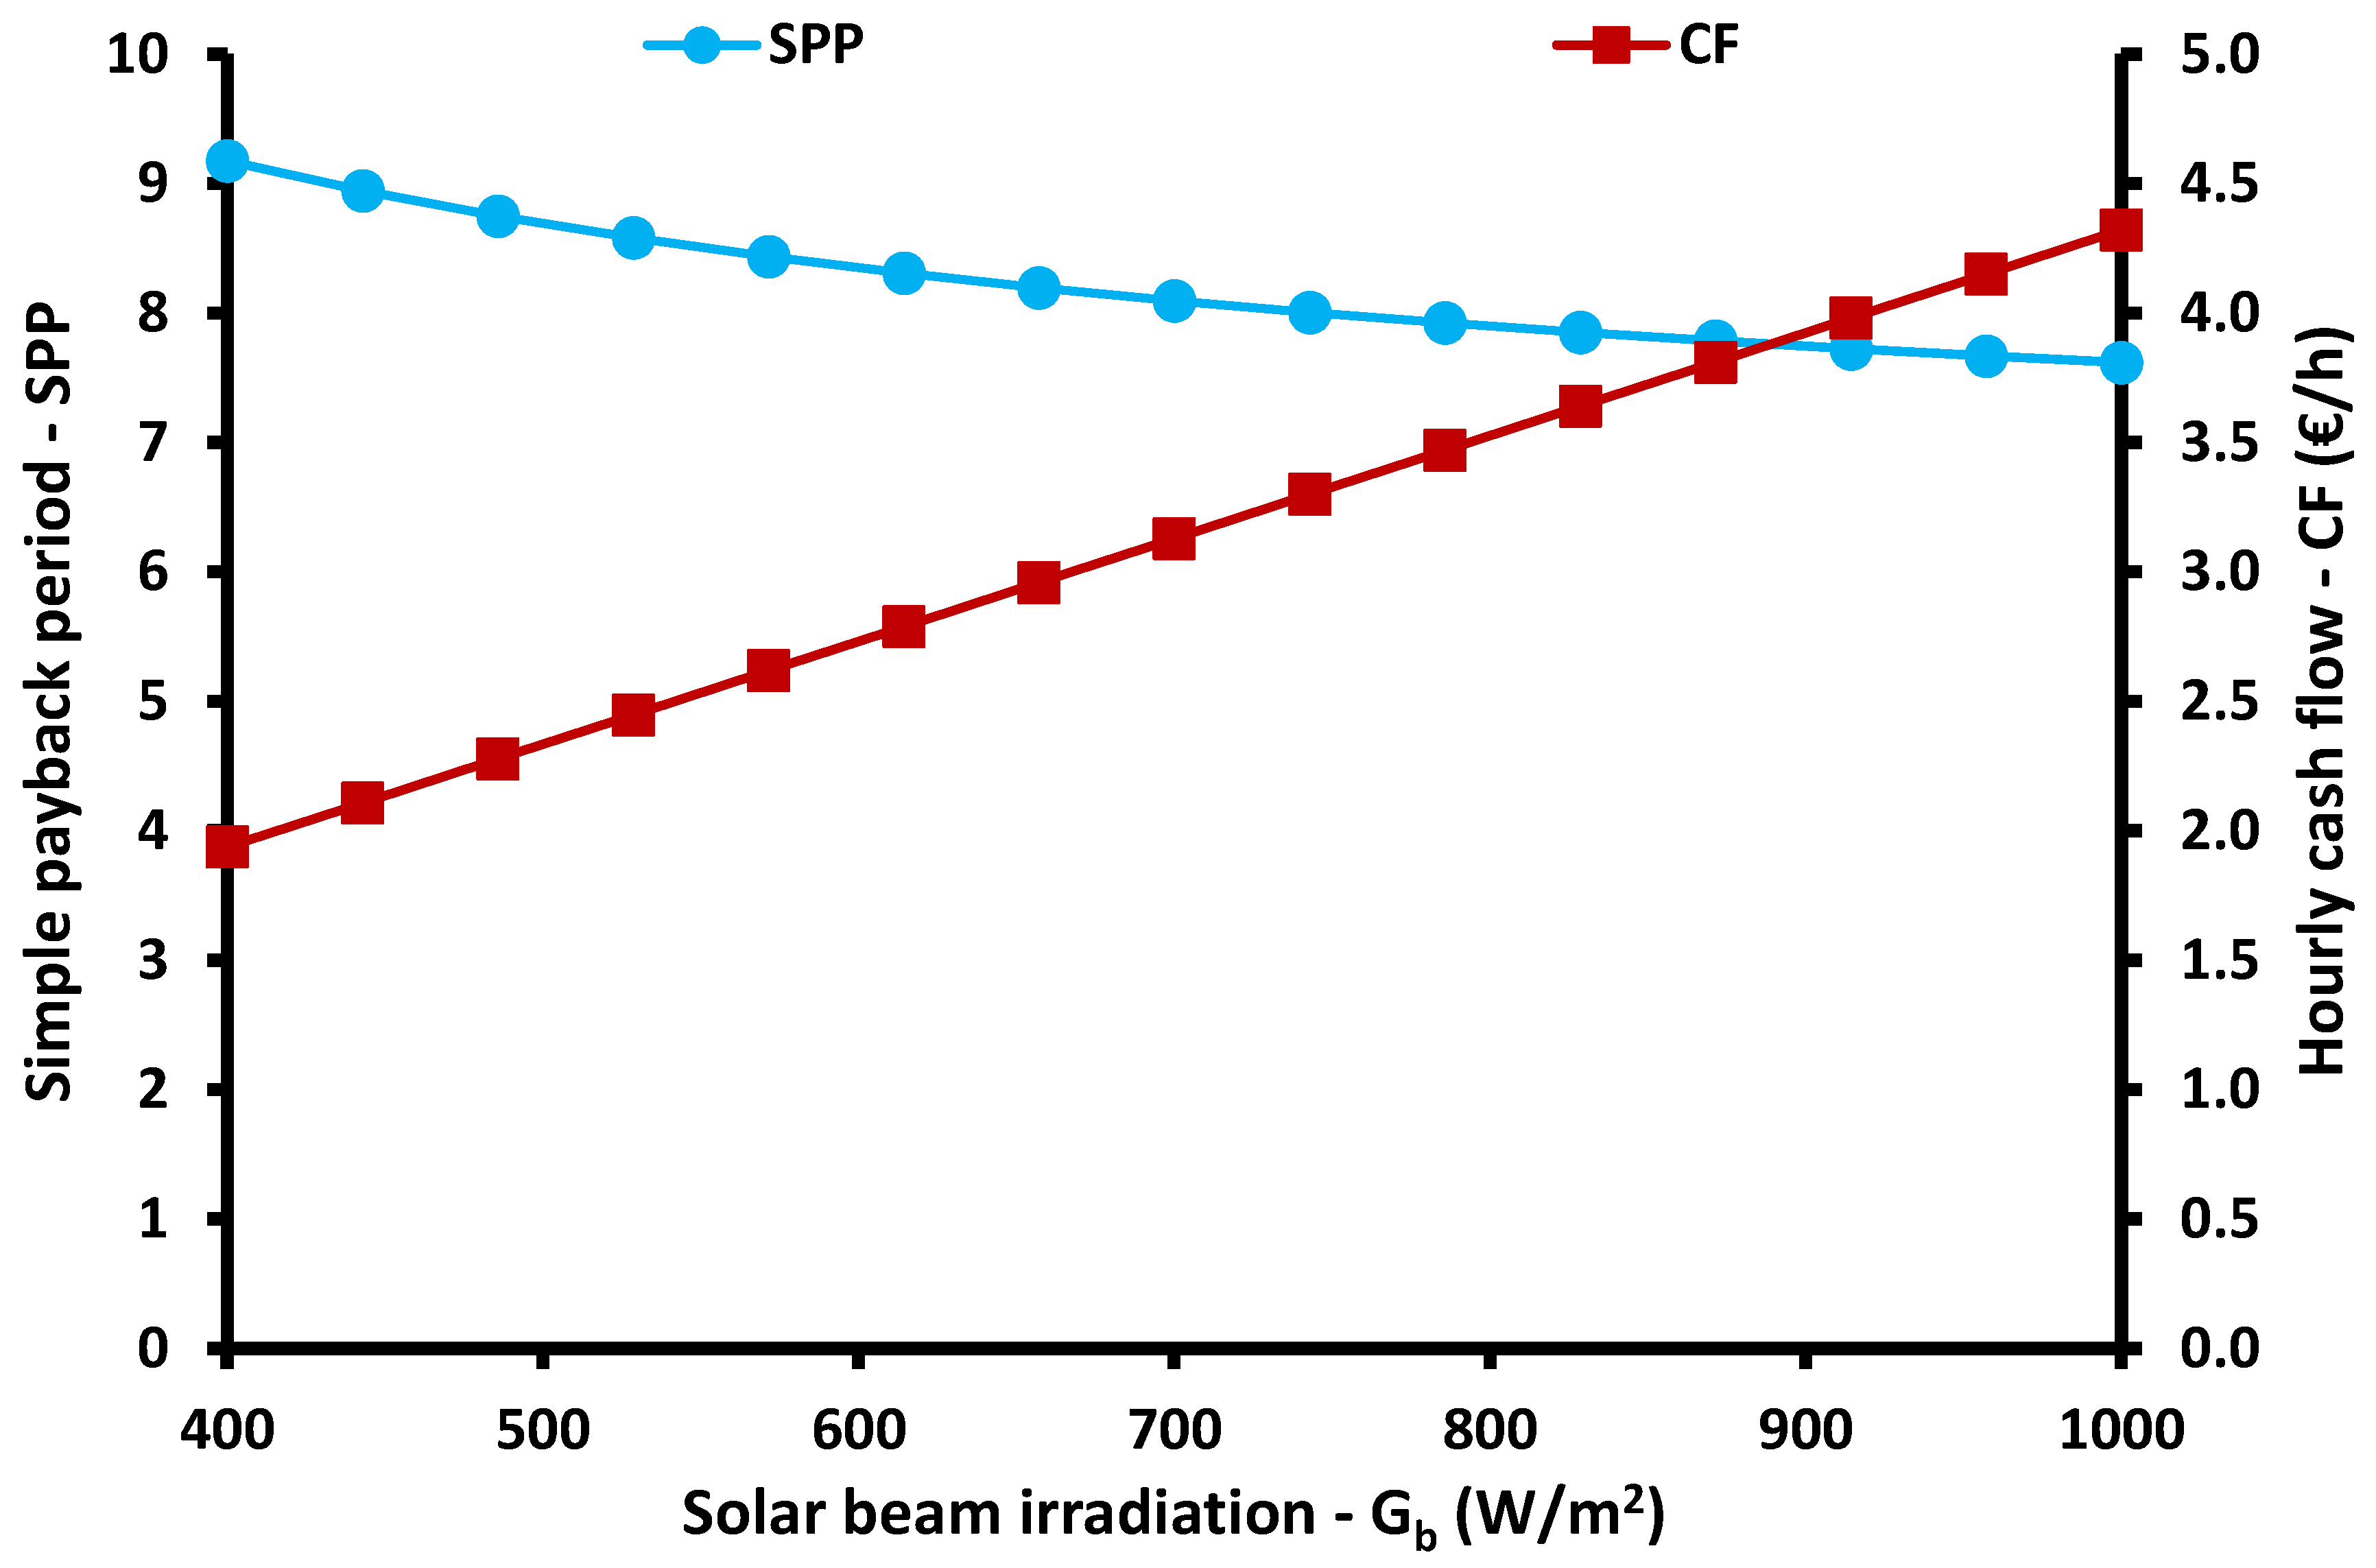
Section 3.3 includes the results of the impact of the solar irradiation level and the incident solar angle on the system performance. Figure 17 shows that higher solar irradiation leads to an approximately linear increase in electricity production, while heating and cooling productions are constant. This is a reasonable result because the higher solar irradiation increases the total useful heat production and consequently the heat input in the HRS, while the generator heat input is constant. The approximately linear increase is justified by the small deviation of the collector thermal efficiency with the solar beam irradiation in the examined range. The maximum electricity production is 12.67 kW for solar beam irradiation at 1000 W/m2. Figure 18 shows that the exergy efficiency increases under higher solar irradiation due to the increase in electricity production. On the other hand, the increase in solar potential does not increase energy efficiency because the cooling and heating production is constant while electricity production does not increase greatly. Figure 19 exhibits the financial behavior of the system, and it is found that higher solar irradiation leads to a more viable investment. Practically, higher solar irradiation leads to more heat input with the same installation, which leads to higher profit with the same investment cost. The minimum SPP is 7.62 years, while the maximum cash flow 4.32 €/h.
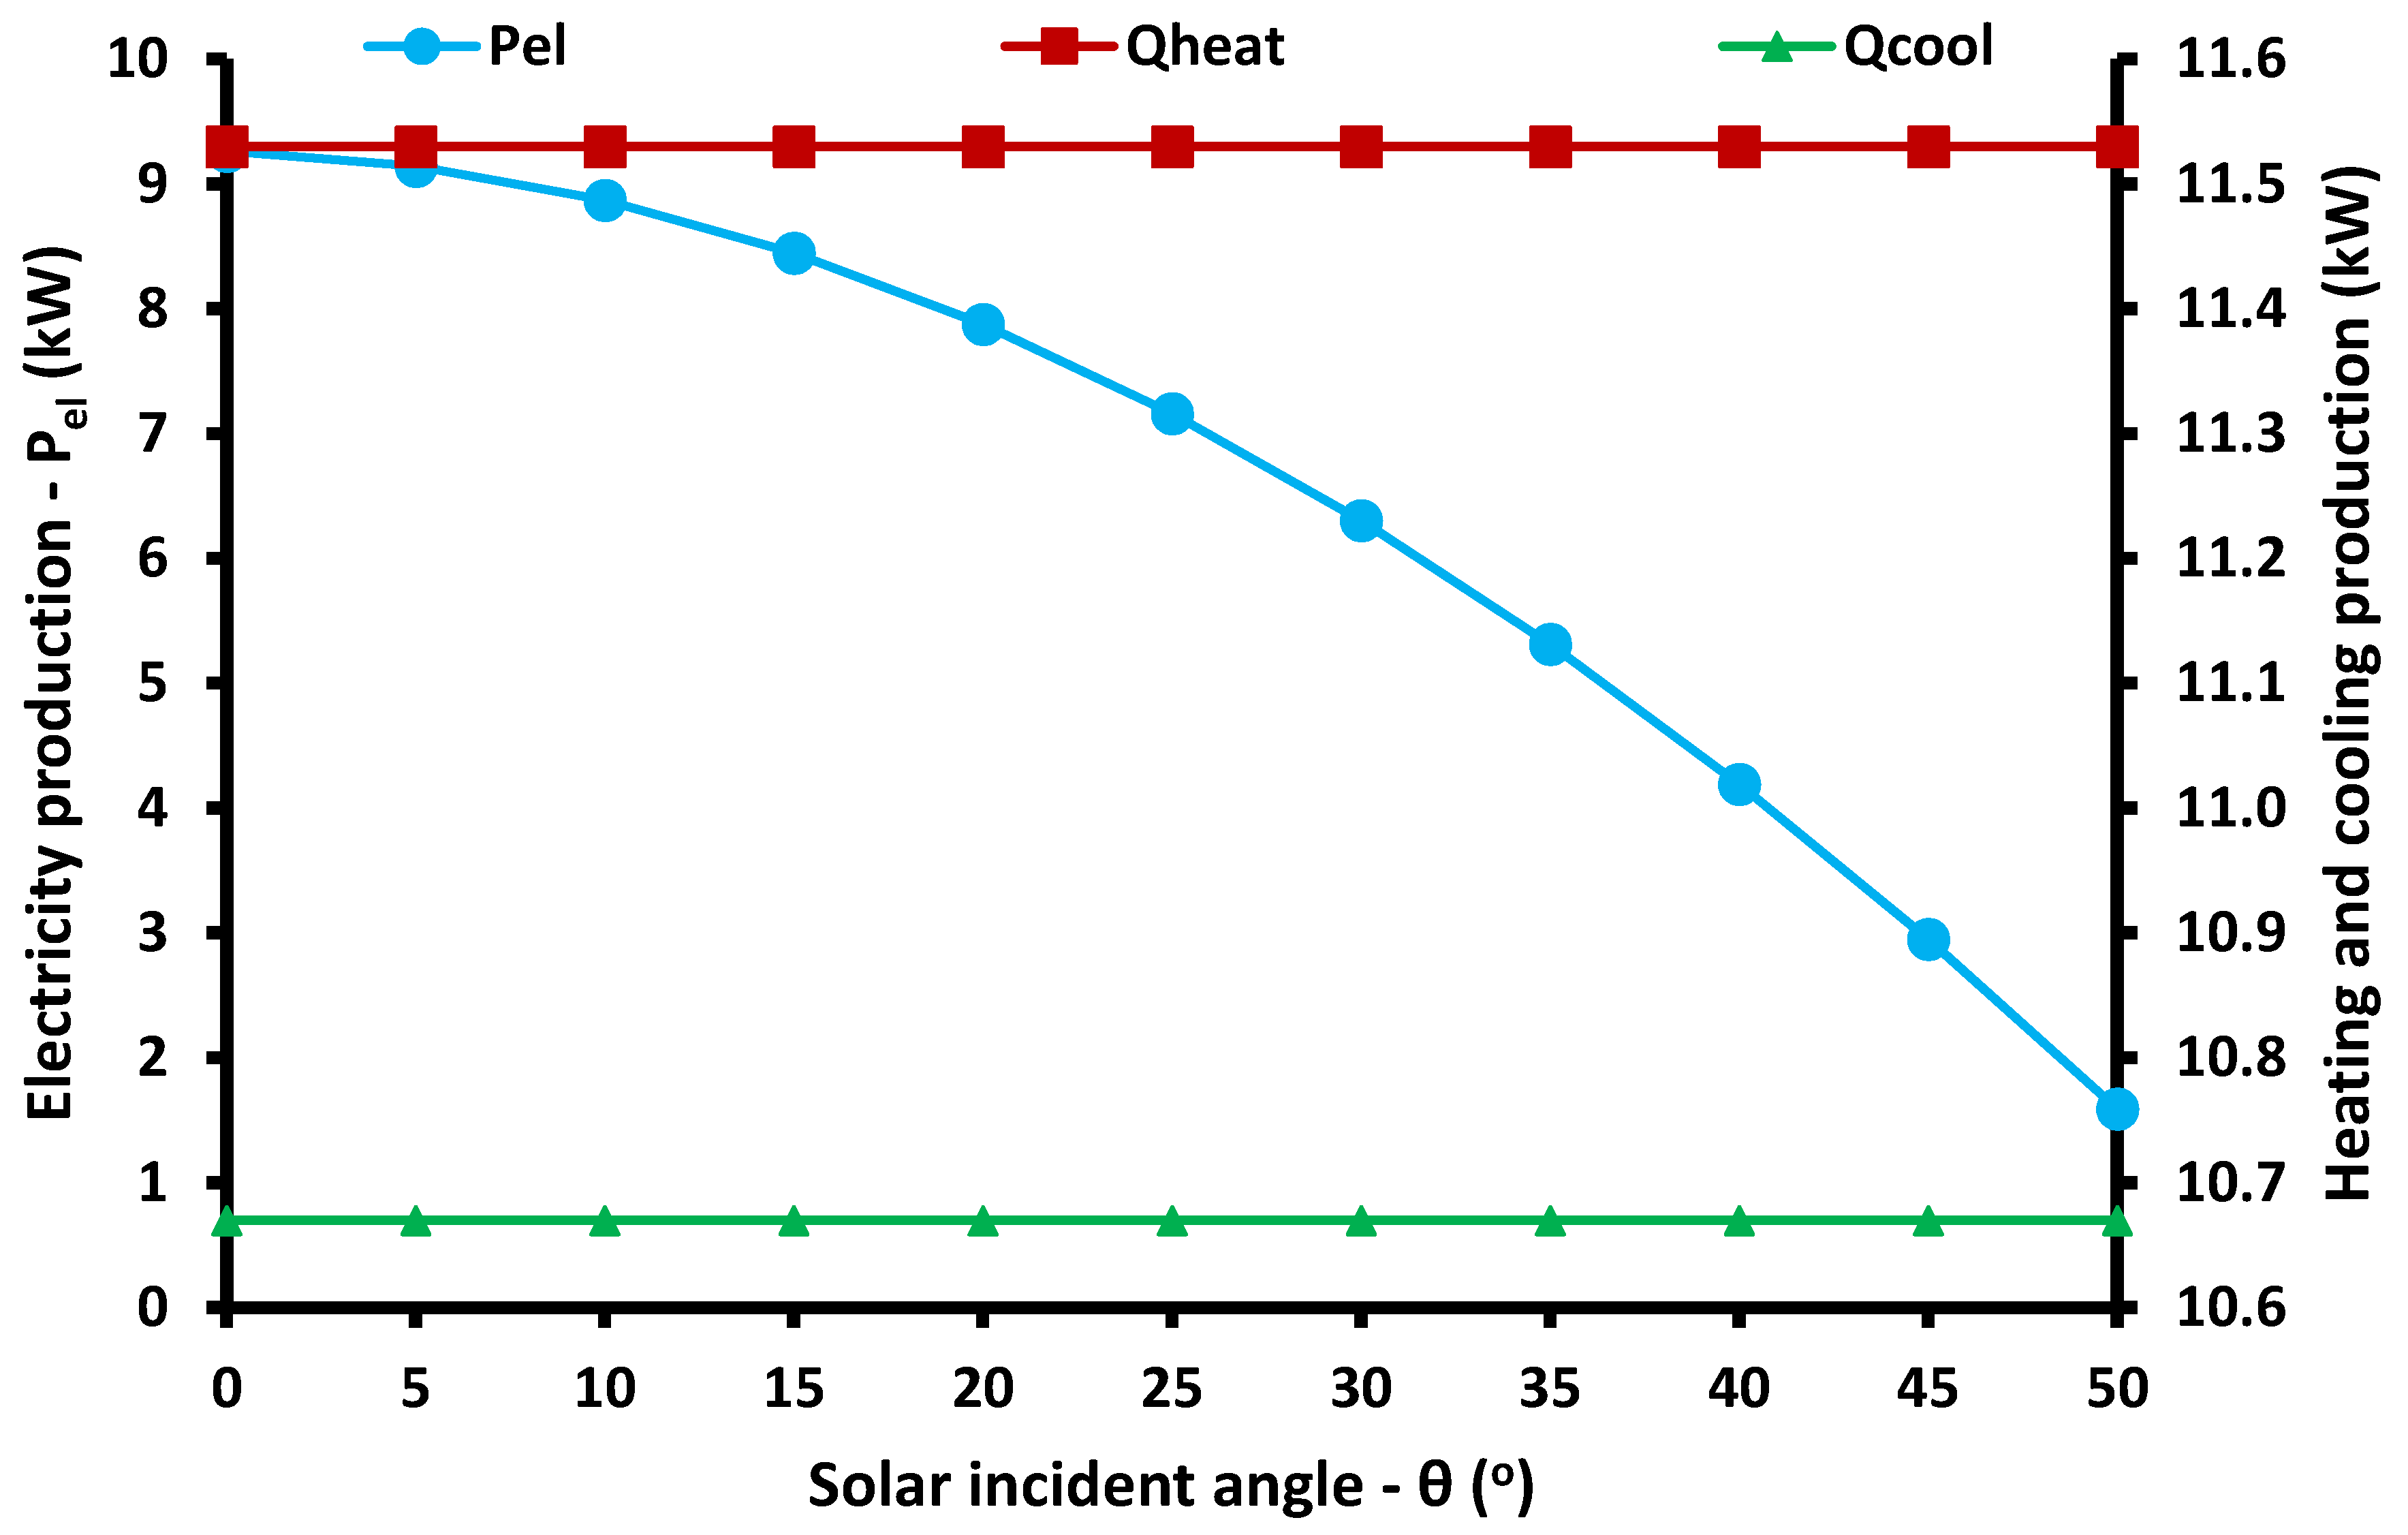
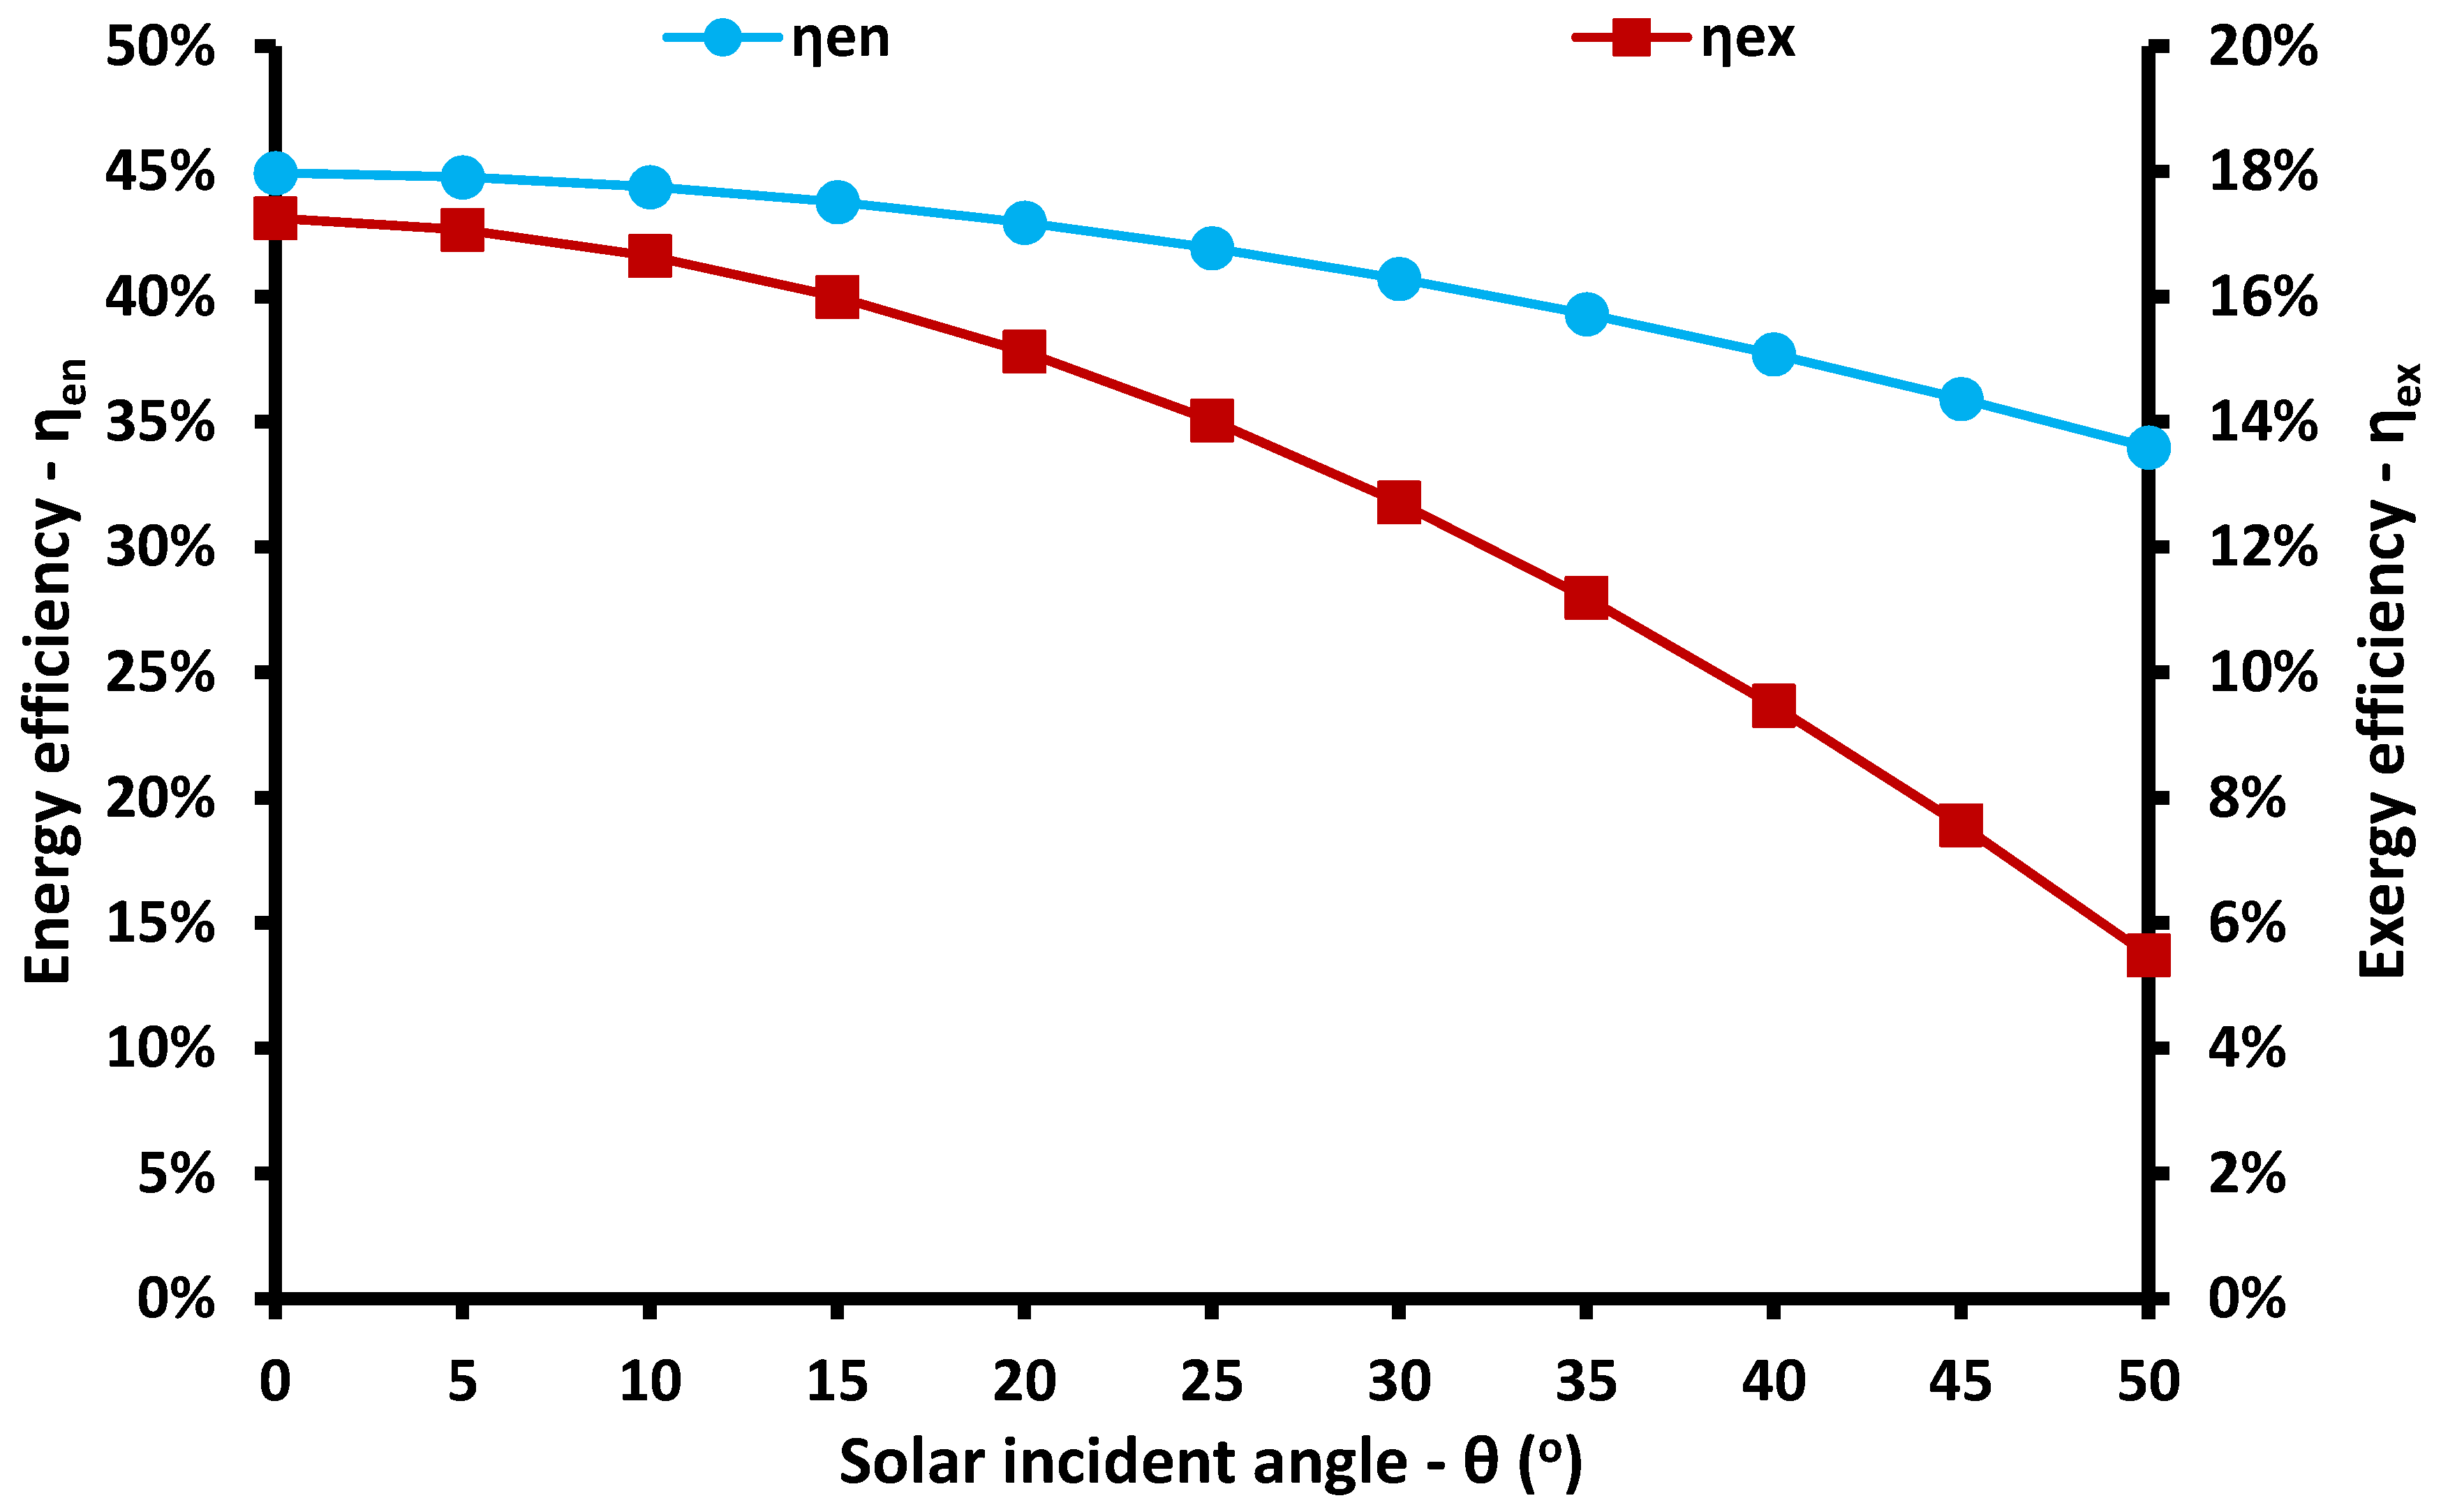
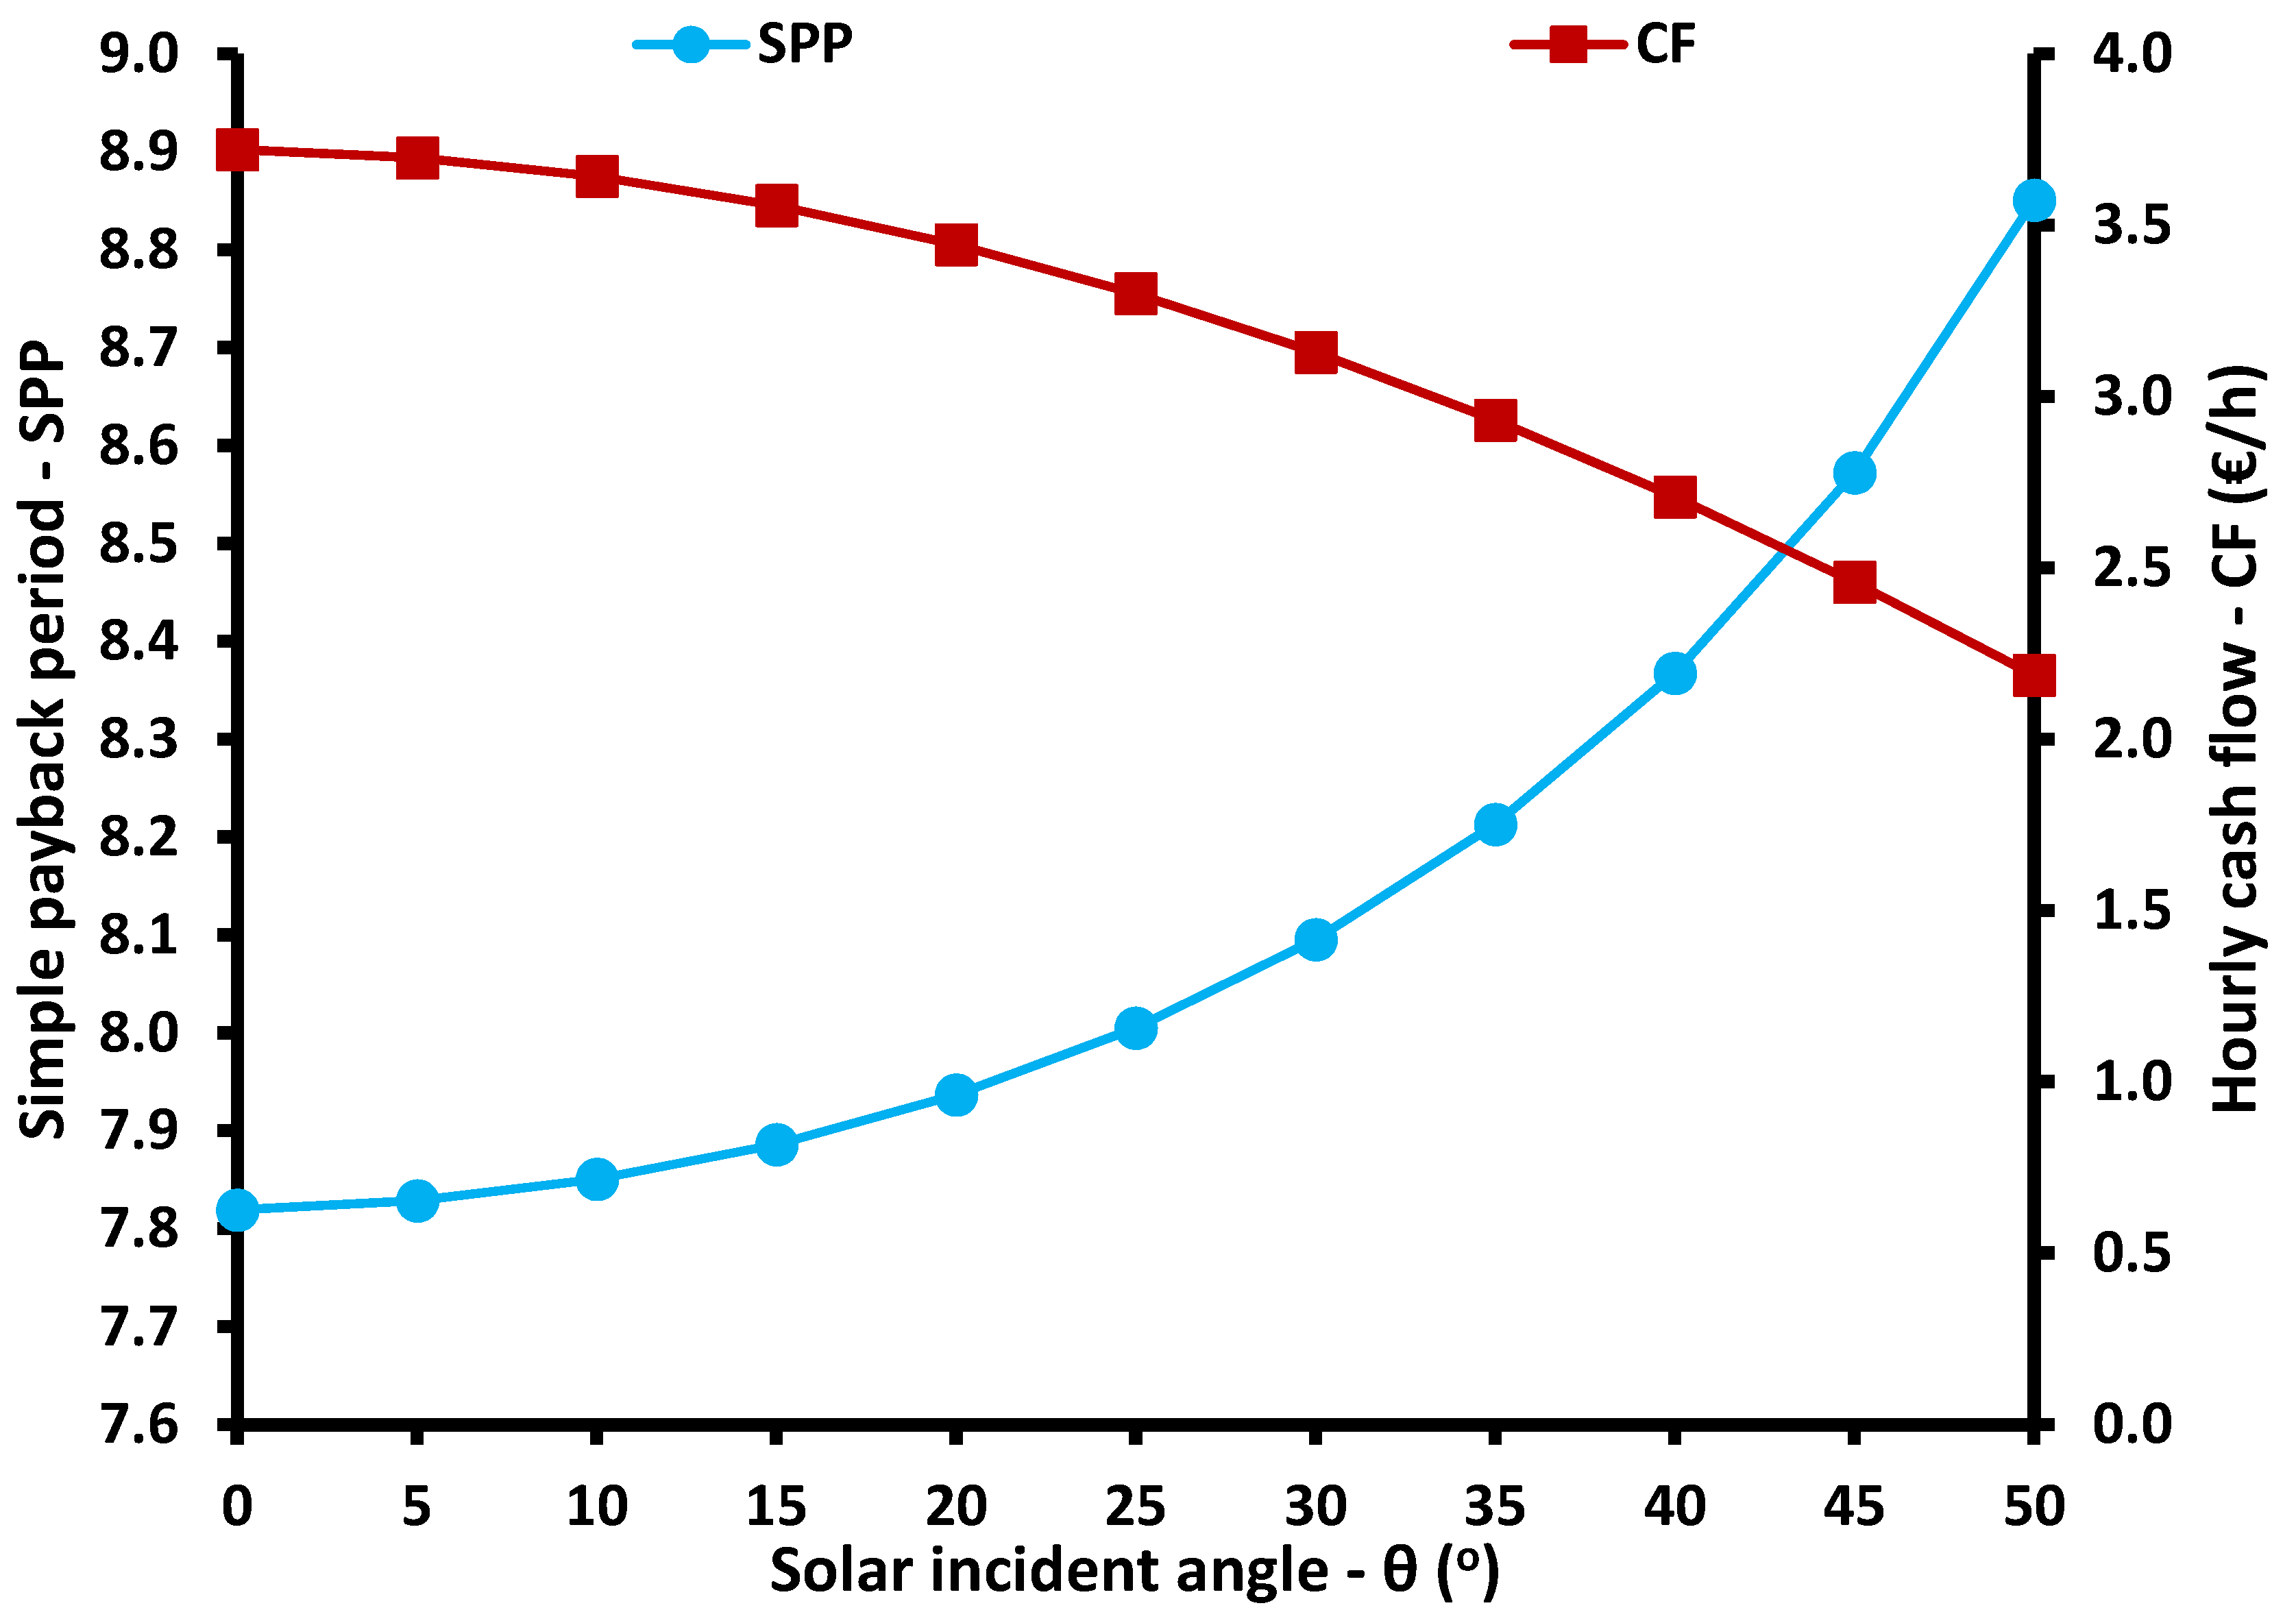
Figure 20, Figure 21 and Figure 22 show the results of the impact of the incident solar angle on the system performance. This angle regards the angle between the sun and the collector aperture which follows the sun with a single-axis tracking system. As a result of the existence of the tracking, the solar angle is not that high under the majority of the operating conditions. The tracking system greatly increases the optical efficiency and this is an important point that has to be taken into consideration in studies such as the present one. Figure 20 shows that electricity production decreases with the increase of the solar angle because there are higher optical losses in the PTC and reduced useful heat production. However, the heating and the cooling remain constant due to the constant heat input in the generator. It is interesting to state that for the examined conditions with 700 W/m2 solar irradiation, the electricity production can reach 9.27 kW for a zero-incident angle, compared with 6.31 kW for a 30° incident angle, which is the default scenario. Figure 21 makes it clear that both energy and exergy efficiencies decrease with the increase of the solar angle. Moreover, in a system with a higher solar angle, the SPP increases and the hourly cash flow decreases, as Figure 22 indicates.

3.4. Yearly Performance and Discussion

The present work studies a solar-driven trigeneration system under steady-state conditions, and the results are extended for estimating the yearly performance. Table 4 includes the total results of the system design which minimizes the SPP. The optimization has been performed by applying the proper settings in the EES and using the optimization variables of the pressure ratio, superheating degree, and generator temperature. It is found that the SPP can be 7.82 years which is a relatively satisfactory value. A simple environmental analysis proved that the equivalent yearly mitigation of CO2 is 35.51 tones. This value was calculated based on values for Greece, i.e., a specific CO2 emission coefficient of 0.989 tones per MWhel [29]. Table 5 includes important results about the ratios of the yearly production quantity. The power-to-heating ratio is 51.48%, the power-to-cooling ratio is 55.65%, and the cooling-to-heating ratio 92.51%. These ratios indicate that the obtained useful outputs are comparable, and there is no wide range among them. This fact is in accordance with the building needs in the examined useful outputs.
The optimization procedure is found to be very important. The results of Table 4 show that the overall optimum value of the pressure ratio is 58.8%, while the analysis of the default scenario (sensitivity analysis) indicates the optimum ratio is 61.4%. On the other hand, the results of the study [10] show that the optimum ratio is 9%. The result in Ref. [10] is different because, in this work, the ORC rejected heat at a high-temperature level in order to feed the AHP. Therefore, in every case, there is a need for a proper optimization procedure.
The literature results [9,10,11,12,13,14,15] indicate that the energy efficiency of other systems ranges from 21% to 150%, while the exergy efficiency from 7% to 56%. Therefore, the obtained efficiency values of this work are inside the usual range, and thus the present system is an acceptable one. Furthermore, the examined system is a relatively easily constructed unit because the devices are all coupled to the solar field loop. Therefore, there is no need for special control of the devices. Moreover, the payback period is acceptable, and energy efficiency is satisfactory. Therefore, this system is a promising one for future systems for achieving sustainability.
In the future, there will be a need for performing a detailed dynamic analysis of this system. Moreover, an idea is to select heating and cooling in specific periods of the year and not the whole annual period. Another point that can be studied is the investigation of the system in other locations with higher or lower solar potential. Lastly, the thermodynamic analysis of this work can be used as the input in future studies on the present system or for similar configurations.

4. Conclusions

The objective of the present study is the examination of a solar-driven trigeneration system for electricity, heating, and cooling production. This system uses parabolic trough collectors operating with Therminol VP-1 and includes an organic Rankine cycle, an absorption heat pump, and a storage tank. The analysis is performed with a model developed by Engineering Equation Solver (EES). The main conclusions of this work are given below:
- In the default scenario, the electricity production is 6.31 kW, the heating production 11.53 kW, the cooling production 10.67%, the energy efficiency 40.72%, the exergy efficiency 12.71%, the payback period 8.1 years, and the hourly cash flow rate 3.13 €/h.
- In the optimized scenario for the minimum payback period, the electricity production is 6.39 kW, the heating production 12.42 kW, the cooling production 11.49%, the energy efficiency 43.30%, the exergy efficiency 13.08%, the payback period 7.82 years, and the hourly cash flow rate 3.29 €/h.
- It is found that there are optimum values for the turbine inlet pressure and the superheating degree in the turbine inlet, which maximize the electricity production, the exergy efficiency, and the energy efficiency, but minimize the simple payback period.
- The increase of the generator temperature increases both the energy and exergy efficiencies. On the other hand, the increase of the generator heat input increases energy efficiency and decreases exergy efficiency.
- The increase in solar irradiation values leads to higher electricity production, higher exergy efficiency, and lower energy efficiency. The increase in the solar angle leads to lower electricity production, energy efficiency, and exergy efficiency.
- Generally, it can be said that the examined system has satisfactory performance, with similar values among the useful outputs. The system is financially viable and it can be installed easily by combining well-established technologies.

Author Contributions

Conceptualization, methodology, investigation, writing—review and editing, writing—original draft preparation, E.B.; supervision, writing—review and editing, writing—original draft preparation, C.T. All authors have read and agreed to the published version of the manuscript.

Funding

This research is co-financed by Greece and the European Union (European Social Fund - ESF) through the Operational Programme «Human Resources Development, Education and Lifelong Learning» in the context of the project “Reinforcement of Postdoctoral Researchers—2nd Cycle” (MIS-5033021), implemented by the State Scholarships Foundation (ΙΚΥ).
Energies 13 01800 i001

Acknowledgments

Evangelos Bellos would like to thanks the State Scholarships Foundation (ΙΚΥ) for its financial support (MIS-5033021).

Conflicts of Interest

The authors declare no conflict of interest.

Nomenclature

AcolCollecting area, m2
cpSpecific heat capacity, kJ kg−1 K−1
C0Capital cost, €
CFHourly cash flow, € h−1
EYearly energy quantity, kWh
GbSolar direct beam irradiation, W m−2
hSpecific enthalpy, kJ kg−1
KIncident angle modifier
KachSpecific cost of the absorption heat pump cycle, € kWcool−1
KcoolCooling cost, € kWhcool−1
KelElectricity cost, € kWhel−1
KheatHeating cost, € kWhheat−1
KorcSpecific cost of the organic Rankine cycle, € kWel−1
KO&MYearly operating and maintenance cost, €
KtankSpecific cost of the storage tank, € m−3
mMass flow rate, kg s−1
PcritCritical pressure, bar
PelNet electricity production, kW
PhighHigh pressure in the organic Rankine cycle, bar
PPPinch point, °C
QHeat rate, kW
SPPSimple Payback Period, years
UTThermal loss coefficient of the tank, W m−2 K−1
TTemperature, °C
TsunSun temperature, K
T0Reference temperature, K
TimeYearly operating period, hours
VtankStorage tank volume, m3
WpPumping work, kW
WTTurbine work production, kW
XLiBr mass concentration, %
YCO2Yearly CO2 mitigation, tones

Greek Symbols

αPressure ratio parameter
ΔΤsHeat source temperature difference, °C
ΔΤshSuperheating in the turbine inlet, °C
ΔTrcTemperature difference in the recuperator, °C
ηenEnergy efficiency
ηexExergy efficiency
ηis,TTurbine isentropic efficiency
ηgGenerator efficiency
ηhexSolution heat exchanger effectiveness
ηmMechanical efficiency
ηth,colCollector thermal efficiency
θIncident solar angle on the collector aperture, °
ρDensity, kg m−3

Subscripts and Superscripts

amAmbient
colCollector
comCompressor
conCondenser
coolCooling
isIsentropic
inInlet
heatHeating
highHigh
hrsHeat recovery system
lossThermal losses in the tank
orcFluid in the organic Rankine cycle
outOutlet
rRefrigerant
sHeat source
satSaturation in the heat recovery system
solSolar
stStorage tank
strStrong
TTurbine
uUseful
wWeak

Abbreviations

AHPAbsorption heat pump
EESEngineering equation solver
HRSHeat recovery system
ORCOrganic Rankine cycle
PTCParabolic trough collector

References

  1. Bartnik, R.; Buryn, Z.; Hnydiuk-Stefan, A.; Skomudek, W.; Otawa, A. Thermodynamic and Economic Analysis of Trigeneration System Comprising a Hierarchical Gas-Gas Engine for Production of Electricity, Heat and Cold. Energies 2020, 13, 1006. [Google Scholar] [CrossRef] [Green Version]
  2. Kasaeian, A.; Bellos, E.; Shamaeizadeh, A.; Tzivanidis, C. Solar-driven polygeneration systems: Recent progress and outlook. Appl. Energy 2020, 264, 114764. [Google Scholar] [CrossRef]
  3. Wu, J.; Han, Y.; Hou, H. A new solar share evaluation method of solar aided power generation (SAPG) system by tracing exergy flows and allocating exergy destruction. Sol. Energy 2020, 198, 542–554. [Google Scholar] [CrossRef]
  4. Nathan, G.J.; Jafarian, M.; Dally, B.; Saw, W.L.; Ashman, P.; Hu, E.; Steinfeld, A. Solar thermal hybrids for combustion power plant: A growing opportunity. Prog. Energy Combust. Sci. 2018, 64, 4–28. [Google Scholar] [CrossRef]
  5. Khaliq, A.; Mokheimer, E.M.A.; Yaqub, M. Thermodynamic investigations on a novel solar powered trigeneration energy system. Energy Convers. Manag. 2019, 188, 398–413. [Google Scholar] [CrossRef]
  6. Bellos, E.; Tzivanidis, C. Alternative designs of parabolic trough solar collectors. Prog. Energy Combust. Sci. 2019, 71, 81–117. [Google Scholar] [CrossRef]
  7. Ozlu, S.; Dincer, I. Development and analysis of a solar and wind energy based multigeneration system. Sol. Energy 2015, 122, 1279–1295. [Google Scholar] [CrossRef]
  8. Sahoo, U.; Kumar, R.; Pant, P.; Chaudhary, R. Development of an innovative polygeneration process in hybrid solar-biomass system for combined power, cooling and desalination. Appl. Therm. Eng. 2017, 120, 560–567. [Google Scholar] [CrossRef]
  9. Al-Sulaiman, F.; Dincer, I.; Hamdullahpur, F. Exergy modeling of a new solar driven trigeneration system. Sol. Energy 2011, 85, 2228–2243. [Google Scholar] [CrossRef]
  10. Bellos, E.; Tzivanidis, C. Parametric analysis and optimization of a solar driven trigeneration system based on ORC and absorption heat pump. J. Clean. Prod. 2017, 161, 493–509. [Google Scholar] [CrossRef]
  11. Almahdi, M.; Dincer, I.; Rosen, M.A. A new solar based multigeneration system with hot and cold thermal storages and hydrogen production. Renew. Energy 2016, 91, 302–314. [Google Scholar] [CrossRef]
  12. Khalid, F.; Dincer, I.; Rosen, M.A. Techno-economic assessment of a renewable energy based integrated multigeneration system for green buildings. Appl. Therm. Eng. 2016, 99, 1286–1294. [Google Scholar] [CrossRef]
  13. Bellos, E.; Vellios, L.; Theodosiou, I.-C.; Tzivanidis, C. Investigation of a solar-biomass polygeneration system. Energy Convers. Manag. 2018, 173, 283–295. [Google Scholar] [CrossRef]
  14. Baghernejad, A.; Yaghoubi, M.; Jafarpur, K. Exergoeconomic optimization and environmental analysis of a novel solar-trigeneration system for heating, cooling and power production purpose. Sol. Energy 2016, 134, 165–179. [Google Scholar] [CrossRef]
  15. Li, H.; Zhang, X.; Liu, L.; Zeng, R.; Zhang, G. Exergy and environmental assessments of a novel trigeneration system taking biomass and solar energy as co-feeds. Appl. Therm. Eng. 2016, 104, 697–706. [Google Scholar] [CrossRef]
  16. F-Chart Software, Engineering Equation Solver (EES). 2015. Available online: http://www.fchart.com/ees (accessed on 21 January 2020).
  17. The European Commission. Development of a Low Cost European Parabolic Trough Collector—EuroTrough; Final Report, Research funded in part by The European Commission in the framework of the Non-Nuclear Energy Programme JOULE III. Contract JOR3-CT98-0231; The European Commission: Brussels, Belgium, 2001. [Google Scholar]
  18. Geyer, M.; Lüpfert, E.; Osuna, R.; Esteban, A.; Schiel, W.; Schweitzer, A.; Zarza, E.; Nava, P.; Langenkamp, J.; Mandelberg, E. EUROTROUGH—Parabolic Trough Collector Developed for Cost Efficient Solar Power Generation. In Proceedings of the 11th Solar PACES International Symposium on Concentrated Solar Power and Chemical Energy Technologies, Zurich, Switzerland, 4–6 September 2002. [Google Scholar]
  19. Bellos, E.; Tzivanidis, C.; Antonopoulos, K.A. Exergetic, energetic and financial evaluation of a solar driven absorption cooling system with various collector types. Appl. Therm. Eng. 2016, 102, 749–759. [Google Scholar] [CrossRef]
  20. Bellos, E.; Tzivanidis, C.; Belessiotis, V. Daily performance of parabolic trough solar collectors. Sol. Energy 2017, 158, 663–678. [Google Scholar] [CrossRef]
  21. Therminol VP-1. Available online: http://twt.mpei.ac.ru/tthb/hedh/htf-vp1.pdf (accessed on 21 January 2020).
  22. Duffie, J.A.; Beckman, W.A. Solar Engineering of Thermal Processes, 3rd ed.; John Wiley and Sons Inc.: Hoboken, NJ, USA, 2006. [Google Scholar]
  23. Montes, M.J.; Abánades, A.; Martínez-Val, J.; Valdés, M. Solar multiple optimization for a solar-only thermal power plant, using oil as heat transfer fluid in the parabolic trough collectors. Sol. Energy 2009, 83, 2165–2176. [Google Scholar] [CrossRef] [Green Version]
  24. Mata-Torres, C.; Escobar, R.; Cardemil, J.M.; Simsek, Y.; Matute, J.A. Solar polygeneration for electricity production and desalination: Case studies in Venezuela and northern Chile. Renew. Energy 2017, 101, 387–398. [Google Scholar] [CrossRef]
  25. Petela, R. Exergy of undiluted thermal radiation. Sol. Energy 2003, 74, 469–488. [Google Scholar] [CrossRef]
  26. Bellos, E.; Tzivanidis, C. Multi-objective optimization of a solar driven trigeneration system. Energy 2018, 149, 47–62. [Google Scholar] [CrossRef]
  27. Tzivanidis, C.; Bellos, E.; Antonopoulos, K.A. Energetic and financial investigation of a stand-alone solar-thermal Organic Rankine Cycle power plant. Energy Convers. Manag. 2016, 126, 421–433. [Google Scholar] [CrossRef]
  28. Bellos, E.; Tzivanidis, C. Assessment of linear solar concentrating technologies for Greek climate. Energy Convers. Manag. 2018, 171, 1502–1513. [Google Scholar] [CrossRef]
  29. Bellos, E.; Tzivanidis, C.; Tsifis, G. Energetic, Exergetic, Economic and Environmental (4E) analysis of a solar assisted refrigeration system for various operating scenarios. Energy Convers. Manag. 2017, 148, 1055–1069. [Google Scholar] [CrossRef]
Figure 1. The examined solar-driven trigeneration system.
Energies 13 01800 g001
Figure 2. Electricity, heating, and cooling for different pressure ratio parameters.
Energies 13 01800 g002
Figure 3. Energy and exergy efficiency for different pressure ratio parameters.
Energies 13 01800 g003
Figure 4. Simple payback period and hourly cash flow for different pressure ratio parameters.
Energies 13 01800 g004
Figure 5. Electricity, heating, and cooling for different superheating levels.
Energies 13 01800 g005
Figure 6. Energy and exergy efficiency for different superheating levels.
Energies 13 01800 g006
Figure 7. Simple payback period and hourly cash flow for different superheating levels.
Energies 13 01800 g007
Figure 8. Electricity, heating, and cooling for different heating source temperature difference values.
Energies 13 01800 g008
Figure 9. Energy and exergy efficiency for different heating source temperature difference values.
Energies 13 01800 g009
Figure 10. Simple payback period and hourly cash flow for different heating source temperature difference values.
Energies 13 01800 g010
Figure 11. Electricity, heating, and cooling for different generator heat input values.
Energies 13 01800 g011
Figure 12. Energy and exergy efficiency for different generator heat input values.
Energies 13 01800 g012
Figure 13. Simple payback period and hourly cash flow for different generator heat input values.
Energies 13 01800 g013
Figure 14. Electricity, heating, and cooling for different generator temperature levels.
Energies 13 01800 g014
Figure 15. Energy and exergy efficiency for different generator temperature levels.
Energies 13 01800 g015
Figure 16. Simple payback period and hourly cash flow for different generator temperature levels.
Energies 13 01800 g016
Figure 17. Electricity, heating, and cooling for different solar irradiation levels.
Energies 13 01800 g017
Figure 18. Energy and exergy efficiency for different solar irradiation levels.
Energies 13 01800 g018
Figure 19. Simple payback period and hourly cash flow for different solar irradiation levels.
Energies 13 01800 g019
Figure 20. Electricity, heating, and cooling for different solar angles.
Energies 13 01800 g020
Figure 21. Energy and exergy efficiency for different solar angles.
Energies 13 01800 g021
Figure 22. Simple payback period and hourly cash flow for different solar angles.
Energies 13 01800 g022
Table 1. Data for financial analysis [26,27].
ParametersSymbolsValues
Electricity cost(Kel)0.20 € kWhel−1
Heating cost(Kheat)0.10 € kWhheat−1
Cooling cost(Kcool)0.067 € kWhcool−1
PTC-specific cost(Kcol)250 € m−2
Tank-specific cost(Ktank)1000 € m−3
ORC-specific cost(Korc)3000 € kWel−1
AHP-specific cost(KAHP)1000 € kWcool−1
Operation and maintenance cost(KO&M)1% of the capital cost
Table 2. Main parameters of the present work.
ParametersSymbolsValues
Cooling temperature level (Tcool) 5 °C
Heating temperature level (Theat) 60 °C
Collecting area (PTC) (Acol) 100 m2
Solar field flow rate (mcol) 2 kg s−1
Storage tank volume (Vtank) 4 m3
Tank thermal loss coefficient (UT) 0.5 W m−2 K−1
Pinch point (temperature difference) (PP) 5 °C
Motor efficiency (ηmotor) 80%
Turbine isentropic efficiency (ηis,T) 85%
Generator efficiency (ηg) 98%
Mechanical efficiency (ηm) 99%
Solution heat exchanger effectiveness (ηhex) 70%
Recuperator temperature differenceTrec) 10 °C
Condenser temperature level (Tcon) 40 °C
Ambient temperature (Tam) 25 °C
Yearly operating period (Time) 2500 h
Table 3. Parametric analysis data.
ParametersSymbolsValues
DefaultMinimumMaximum
SuperheatingΔΤsh (°C)20040
Pressure ratioα (-)90%50%90%
Source temperature differenceΔΤs (°C)0040
Heat input in the generatorQg (kW)15020
Generator temperatureTg (°C)115110130
Solar irradiationGb (W m−2)7004001000
Solar angleθ (°)30050
Table 4. Final results for the optimized system for minimum SPP.
ParameterSymbolsValues
Energy efficiency(ηen)43.30%
Exergy efficiency(ηex)13.08%
Electricity production(Pel)6.39 kW
Heating production(Qheat)12.42 kW
Cooling production(Qcool)11.49 kW
Yearly electricity yield(Eel)15,985 kWh
Yearly heating yield(Eheat)31,050 kWh
Yearly cooling yield(Ecool)28,725 kWh
Yearly solar energy(Esol)175,000 kWh
Simple payback period(SPP)7.82 years
Cash flow(CF)3.29 €/h
Pressure ratio(α)0.5882
Superheating degreeΤsh)27.81 K
Generator temperature(Tg)130 °C
Yearly CO2 mitigation(YCO2)35.51 tones
Table 5. Important ratio values of the yearly energy amounts.
ParameterValue
Power-to-heating ratio0.5148
Power-to-cooling ratio0.5565
Cooling-to-heating ratio0.9251
Power-to-solar ratio0.0913
Heating-to-solar ratio0.1774
Cooling-to-solar ratio0.1641