Abstract
This study provides a double elastic steel sheet (DESS) piezoelectric energy harvester system, in which the vibration generated by the deformation and clap of two elastic steel sheets is assisted by a piezo patch to generate electric energy. The system is combined with energy storage equipment to propose a complete solution forgreen energy integration. This study buildsexperimentallyon the model of the proposed system to explore its voltage, power output and energy collection efficiency. This study also builds atheoretical model of a nonlinear beam with the piezo patch, including the piezoelectric coupling coefficient and current equation. This nonlinear problem is analyzed by the method of multiple scales (MOMS). The system frequency response wasobserved using fixed points plots. The perturbation technique and numerical method wereused to mutually validate the experimental results; the concept of DESS vibration energy harvester (DESS VEH) is proved feasible. In order to prolong the lifetime of the clapping of DESS piezo patch, a camber protector design is proposed. The findings show that the power-generating effect is best when the piezo patch is placed at the peak of the third mode of the DESS system, and the high camber protector is used to generate electric energy.
1. Introduction
The control and application of vibration are very extensive; the study of converting the energy derived from vibration into electric energy—vibration energy harvester (VEH)—has been one of the key points of the research and development of green energy technology. The conventional principle of power generation of the VEH system can be divided into electromagnetic type and piezoelectric type. The electromagnetic type uses vibration to change the distance between a metal coil and magnet and the coil generates an induced current as the magnetic flux is changed. In addition, the Bistable Energy Harvester (BEH), which considers the nonlinear vibration phenomenon based on this architecture, can be applied to the VEH system [1]. Stanton et al. [2] provided a theoretical model and used numerical simulation and experimental method to fully demonstrate the operational benefits of BEH. The piezoelectric vibration energy harvester (piezo-VEH) system uses vibration to deform the piezoelectric patch (piezo patch), and the electric field is changed to generate current. This method is free of any additional power supply, and it has better electromechanical coupling, thus, the product can fit the microelectromechanical system (MEMS) process. In addition, as it is free of coils and magnets, its application area is wide. The energy transmission path of piezo-VEH is derived from the vibrating mechanical energy in the environment, such as the engine vibration of a moving car, the vibration of a suspension bridge, and the ground vibration induced by a mobile load. Roundy et al. [3] proposed an energy harvester concept for the low-flux wireless sensor of MEMS and compared multiple technologies for converting conventional energy into electric energy. Roundy et al. [4] further implemented their previous concept [3] and indicated that the piezoelectric vibration energy can be successfully converted into utilizable electric energy, and this is the origin of piezoelectric VEH. Sodano et al. [5] also proved the feasibility of converting piezoelectric vibration energy into electric energy; however, as only this new concept was verified at that time, it is only applied to micro voltage.
After extensive studies by numerous scholars, the application and efficiency of piezo-VEH have improved. Sodano and Inman [6] successfully converted vibration energy into electric energy by adding piezoelectric to a cantilever beam. Erturk and Inman [7] provided an analytic method to estimate the mechanical response, volt, current and power output, as generated by fixed-free Euler–Bernoulli beam vibration. Rajora et al. [8] analyzed the piezo patch, the thickness and position of different materials, and attached the electric energy conversion benefit of a simple vibration supported beam. Masana and Daqaq [9] analyzed the transversal vibration of an axial stress fixed-fixed beam, assumed this beam to be a nonlinear Bernoulli–Euler beam, and applied the method of multiple scales (MOMS) to obtain the analysis result. They used the fixed-point plot to analyze the transversal vibration amplitudes of this beam and proved that the disturbance in axial direction can control the amplitude of this nonlinear beam in the transversal direction.
The piezo-VEH can be applied to aircraft. Li et al. [10] studied the flow–solid interaction of a long elastic plate fixed on the trailing edge of a wing, with the piezo patch attached on this elastic plate. The resulting wing vibration and vibration of the elastic plate from the wake formed an aeroelastic energy harvester system. They further reviewed the electric energy conversion effect of this kind of research from 2009–2016, and indicated that its application to UAVs, MAVs, long span aircrafts andHALEs (high altitude long endurance) is feasible. Wu et al. [11] proposed an analytic piezo-aeroelastic energy harvester system integrated with the plunge and pitch vibration of a wing, in order to obtain (convert) more electric energy. Moreover, they used this model in the main rotor of a helicopter [12], considering the vibration of pitch–plunge–leadlag. They adopted the ONERA dynamic model to simulate the vibration of blade–vortexinteraction, which was resulted from the aerodynamic environment of the main rotor of the helicopter. Koszewnik and Oldziej [13] installed the VEH system on a 6-rotor-copter UAV. The PZT (piezo patch) was attached near the root of the copter rotor arm. One dimension and single degree-of-freedom model was built. The finite element based numerical method was performed. Experiment studies of the VEH efficiency on the copter UAV were carried out and verified with the simulation results. Their results indicated that itis possible to prolong the flight duration time of copters by using VEH installed on the UAV platform. The clapping or vibro-impact is often used in piezoelectric energy harvester systems since impact improves harvesting efficiency through frequency up-conversion [14]. The vibro-impact in VEH systems usually happens between flexible beams and relatively rigid stoppers. Fu et al. [15] proposed a three-degree-of-freedom vibro-impact model to implement a triboelectric energy harvesting system. The one-dimensional nonlinear rigid body dynamic motion was investigated. Their theoretical analysis proved that the impact motion of a mass on the PZT could help harvesting energy from low-frequencyambient vibrations. Their further studies [16] applied the triboelectric energy harvesting model on cantilever beams. The mass and the VEH system were installed at the free end of the beams.Experimental results showed that a rather larger tip mass ratio performs better over its electricity generation at high frequencies. Therefore, a higher exciting frequency or higher elastic beam mode on this impact VEH system may be worthy of investigating.
The aforesaid applications of VEH are based on the concept of mechanics, where the AC generated by vibration is mostly irregular turbulent electric energy, which must be rectified and filtered before steady DC is delivered. Therefore, the vibration energy (e.g., structural vibration or flow vibration) in the aforesaid transmission environment can be converted into electric energy. A complete piezo-VEH system must have an interfacing circuit for converting the AC generated by the vibration system into DC, as well as an electricity storage (charging) system with the voltage output function. Ottman et al. [17] proposed a theory for a piezoelectric rectifier system, where the converted electric energy of VEH is rectified, and an optimized electric energy system is provided. Referring to the circuit device, the present study uses a bridge rectifier, capacitor and LED to design simple energy storage equipment and proves this piezoelectric system can convert mechanical energy into electric energy, which is stored and used.
This paper discusses a fixed-free double elastic steel sheet (DESS) system, which is fixed to a vibration mass base. This system uses a shaker to continuously import simple harmonic external force, in order to simulate the VEHsystem, which can be fixed on a suspension bridge, the body of automobile or motorcycle, the trailing edge of an aircraft wing and even under the main rotor of the rotorplane. The inexhaustible vibration force is used as the basis of vibration energy. Moreover, as the piezo patch is installed in an appropriate position on an elastic steel sheet of the DESS System, it can convert the vibration energy into electric energy. In terms of the advantages and technological innovation of this setup, the vibration of the elastic steel sheet can induce deformation for the piezo patch to convert electric energy (this is commonly used in VEH systems). Furthermore, a force is directly applied by the natural flapping of two elastic steel sheets to the piezo patch to obtain additional electric energy, thus, the effect of 1 + 1 > 2 is performed. The 1 + 1 > 2 effect represents that the proposed DESS VEH model not only includes twoelastic sheets with the deformation effect on the PZT, but also uses the clapping effect of the twoelastic sheets to make an extra power generation of the VEH system. The results show that the DESS design is far better than the single elastic sheet vibration system. According to the authors’ knowledge, there was no such clapping of DESS VEH device presented before. In addition to experimentally validating the feasibility of this conception, this paper uses the theoretical model of a nonlinear elastic beam to simulate the vibration of a long elastic steel sheet, which is coupled with the piezoelectric equation to calculate the theoretical electric energy conversion power of the system. This paper also analyzes the vibration condition of the DESS system to select the best piezo patch position to obtain the maximum electric energy. A convex lag for PZT protector, which is fixed on the piezo patch, is designed to protect the PZT from the damage resulted by long-term flapping. Finally, this study presents a bridge rectifier, where the output current is converted and stored in a Ni–H battery, which can keep charging, in order to attain the goals of complete system integration and practical application. It is noteworthy that the innovative concept of the clapping DESS VEH system proposed in this study lays stress on improving the vibration system, such as the combination of deformation, impact pressure and optimum location of the piezo patch, in order to create better electric energy conversion effect than the common used piezo-VEH system. This study proposes a preliminary concept of rectification and energy storage, and the feasibility of this concept is proved.
2. Experimental Analysis of DESS VEH System
2.1. Experimental Setup of DESS VEH System
Figure 1 shows the experimental model of DESS. The two elastic steel sheets were 480 mm long, 20 mm wide and 0.2 mm thick. One end was fixed to the mass of the base; a shaker was used to import the harmonic force of different frequencies into the base mass to simulate the vibration condition of the vibrating object equipped with the DESS. The base mass was placed on the ball slide rail. This ball slide rail and its fixed base were fixed to an H-shaped scaffold. The bi-morph type piezo patch (produced by Superex TechnologyTM)was used in this study and was covered by a protector. The proposed DESS VEH system was shown in Figure 2. The specifications of the piezo patch are shown in Table 1. Figure 3 shows the flow chart of the overall experimental process. The signal generator generates a waveform to the signal amplifier, the signal amplifier sends the signal to the shaker; the shaker drives the vibrating body to move. This study uses a laser displacement gauge to obtain the amplitude data of the various vibrating bodies, which were processed by a low-pass filter and sent to the IMCTM system.The computer calculates the amplitude and output voltage data of the various frequencies, and the experimental process wasthus completed.
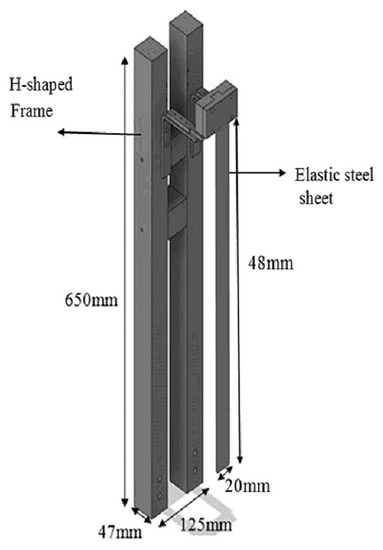
Figure 1.
Experimental model of double elastic steel sheet (DESS).
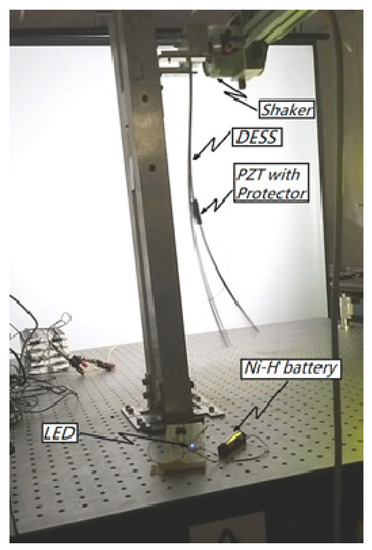
Figure 2.
The double elastic steel sheet (DESS)vibration energy harvester (VEH) system.

Table 1.
Piezo patch specifications.
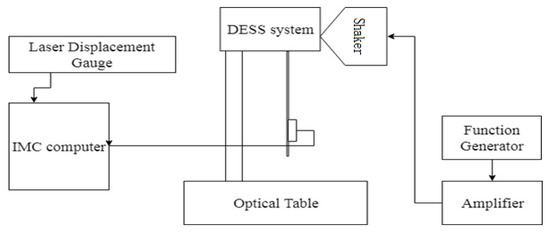
Figure 3.
Experimental flow chart.
2.2. Mode Shape of Fixed-Free Beam System
The general piezo patch VEH system uses the deformation or stress of the piezo patch to generate electric energy, thus, this section theoretically analyzes the frequency and amplitude of the single elastic steel sheet (SESS)forcing system, in order to judge the location of the piezo patch in the SESS or DESS system. First, this steel sheet was assumed to be an Eluer–Bernoulli beam, and the equation of motion is expressed as follows:
where u is the deformation of Y-dir., I is the moment of inertia, is the beam density, A is the beam cross section.
The boundary conditions are:
Based on the separation of variables and boundary conditions, the characteristic equation is:
The mode shape is:
The first three eigenvalues (, n = 1–3) are 1.8751, 4.6941 and 7.8548, respectively. The relationship between dimensionless frequency and in Equation (4) can be expressed as , the relation between the dimensional natural frequency and dimensionless natural frequency is , where is the dimensional natural frequency, m is the mass of the elastic steel and l is the length of the elastic steel. Motivated by this, the first three dimensional frequencies were about 1.2 Hz, 6.7 Hz and 18.6 Hz. In order to verify the correctness of this system mode, we used ANSYS to build the model of the base mass and DESS, the density of the elastic steel, Young’s modulus and Poisson’s ratio were set, and a sine wave was applied to the base mass. Figure 4 shows the third mode of DESS, where the peak amplitude was observed at 0.3 and 0.7 times of length of DESS. Moreover, we use an impact hammer and Fast Fourier Transform (FFT) to obtain the natural frequency diagram of this system. Figure 5 showsthe result from the impact hammer experiment. The data were obtained by applying FFT from the output signals. The experiment set up allows a rather flexible boundary condition on the beam fixed end than the theoretical model. A small value of frequency may be added to the system and hence the first mode frequency was a little higher than the theoretical value. For the higher frequency modes, this small frequency does not seem to have much effect. The peaks on Figure 5 are the nature frequencies of this system.As seen, the natural frequencies of this system were about 1.4 Hz, 6.7 Hz and 18.6 Hz, which match the theoretical value. These frequencies were used to excite the first three modes in the following VEH experiments.
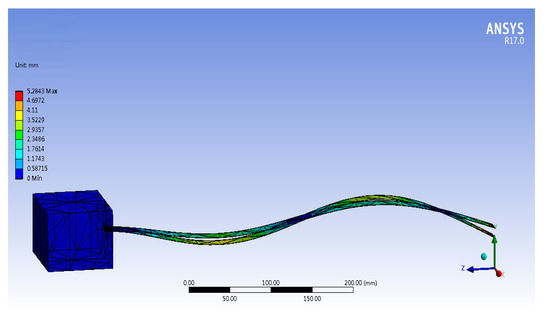
Figure 4.
DESS 3rd modevibration mode.
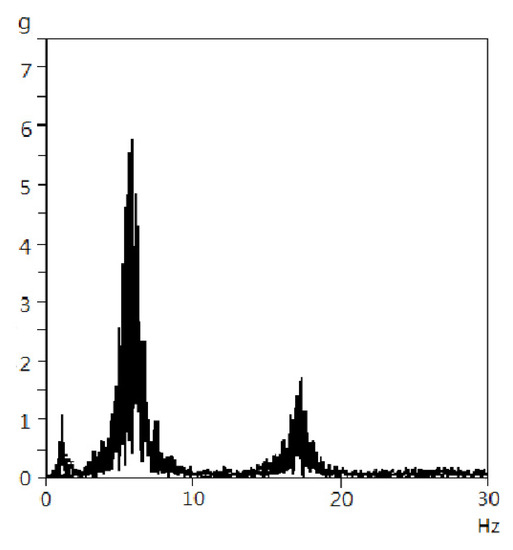
Figure 5.
Beam frequency response.
2.3. SESS Test
This experiment uses a bridge rectifier to convert AC into DC. An LED was installed on this system, and whether this LED couldemit light continuously was observed. The piezo patchwas placed at the root and peak of the first mode of the SESS system, and the power benefit was observed. As the power benefit was low, and the graphic representation was difficult to observe, it was made into Table 2 for comparison. It is noted that the 1st mode natural frequency 1.4 Hz was used as the excitation frequency for the 1st mode. Table 2 shows the power benefit generated at the root of the first mode was larger than the power benefit at the peak of the first mode; however, it was experimentally observed that neither of them can light up the LED.
Table 2.
SESS (single elastic steel sheet) power generated at the root and the peak of the first mode.
2.4. Implementation of the DESS PZT Protector
In the experimental process of DESS, this study finds that the DESS flaps too frequently, meaning the benefit of the piezo patch will be reduced, and it was likely to be damaged. Thus, this study discusses the implementation of the piezo patch protector. This experiment was divided into two parts: (1) a PZT clapping protector was designed to avoid the impact damaging the piezo patch. Figure 6a is the schematic diagram of PZT protector made by AutoCAD. The zoom of the threeviewsof the protector product model is provided in Figure 6b to demonstrate the design of the protector. The embedded trench of the PZT protector clamps the piezo patch and elastic steel to avoid the impact damaging the piezo patch; (2) different contact cambers were used to investigatewhether the camber height has direct effect on power generation during flapping. The camber height was set as “a”, and the length of the protector was “b”. This experiment tests four camber shapes: no protector, low camber (a/b = 0.135), medium camber (a/b = 0.16) and high camber (a/b = 0.185). The four cambers were tested by the same external force and location. The protector was printed by a 3D printer. The piezo patchwas placed at the peak of the third mode, and the power benefits of the four cambers were compared, where the purpose was to discuss whether the cambers can influence the power benefit. The data are shown in Figure 7a–d. The swing and clap of DESS result in a lot of power noises, thus, the error value of ±1 standard deviation was filtered from Figure 7, and the reliable interval was averaged. The middle-dotted line in Figure 7a–d is the average value of the reliable interval; the upper and lower solid lines are ±1 standard deviation. The results are shown in Table 3. As seen, the high camber protector generates 2.21 V voltage to the DESS system, while the voltage generated by the other protectors was lower than 2 V; thus, the protector with better efficiency was the high camber protector. The higher camber PZT protect device shows a better power generation. It was probably because that the top of the higher camber was sharper than the lower one. The contact area with the other impact steel sheet was much less and thus has more stress. The higher stress may associate with a higher impact on the PZT and therefore, a better power generation was obtained.
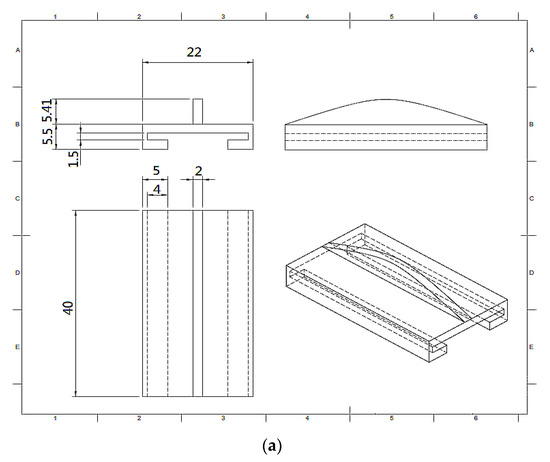
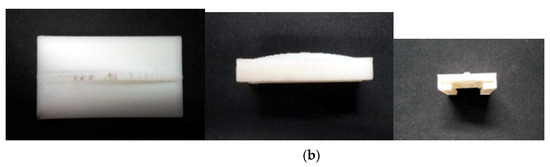
Figure 6.
(a) Schematic diagram of PZT (piezo patch) protector made by AutoCAD. (b) Three-view of the protector product model.
Figure 7.
DCPower benefits of different cambers of the PZT protector. (a) no protector, (b) low camber, (c) medium camber, (d) high camber.
Table 3.
Power benefits of different cambers of the PZT protector.
2.5. DCPower Benefit of Different Modes
The piezo patchwas placed at the node point and peak of each mode of the DESS system, the DC generated by the 1st, 2nd and 3rd mode under different conditions was measured, and the ±1 standard deviation was filtered from the generated power, in order to remove the experimental error. It was also noted that the first three modes’ natural frequencies, 1.4 Hz, 6.7 Hz and 18.6 Hz, were used to excite the first three modes, respectively.The data were tabulated for comparison and Table 4 compares the power benefits of the piezo patch placed at the peak and node point of different modes of the DESS system. As seen, the DC power benefit at the root of the first mode was better than that at the peak and the power benefits at the peak of the second mode and the third mode were better than that at the node point. The steel sheets clapping increases the voltage generated by the piezo patch, but deformation still plays a role in the power generating of the piezo patch. The elastic steel has larger deformation at the peak; thus, more electric quantity can be collected by clapping another elastic steel. A 400 mVpp with sine wave input was applied on this VEH system by an amplifier and a function generator. Table 4 gives the output values of the SESS and DESS systems. The displacement was up to 15% of the beam length. If the same input force but a higher mode frequency (more than the 4th mode) was applied, an irregular motion was observed. This was probably due to that long elastic steels impact with each other in high frequency motion causes a rather unsteady vibration. The output voltage shows large fluctuation and was not suitable for power storage. Only up to the 3rd mode was considered in this system. In addition, the power benefits of the SESS and DESS systems were compared, and the results are shown in Table 4. As seen, the results of the piezo patch placed in the maximum power benefit positions of 1–3 modes of SESS and DESS systems. The power benefits of different modes of DESS were better than the power benefit of SESS. The impact between the elastic sheet of the harvester and the camber on the PZT protector was a passive motion. The impact force depends on the beam mode vibration shape and frequency. For a same input load, the higher frequency mode demonstrates a fast vibration motion and associates with a higher power generation.
Table 4.
Power benefits of the SESS and DESS systems, (R) represents piezo patch placed at the root, (P) represents piezo patch placed at the peak, (N) represents piezo patch placed at the node.
2.6. ACPower Benefits of Different Modes
Regarding the AC experiment, much like the DC experiment, the piezo patchwas placed on the maximum power benefit positions of the 1st–3rd modes of the SESS and DESS system, respectively. The results are shown in Figure 8 (SESS) and Figure 9 (DESS). As the swings of the elastic steel sheets in the second and third modes result in a lot of noise, the AC voltage was converted into a voltage effective value by using the root mean square (RMS). First, the RMS of AC voltage per second was taken, and the moving average figures of the first, second and third modes of SESS and DESS can be got, respectively. Once the RMS values were obtained (see the right-hand column in Figure 8 and Figure 9), the standard deviation can be got. The error value of ±1 standard deviation was chosen and filtered out and the reliable interval was averaged.It is noted that the middle-dotted line in Figure 8 and Figure 9 was the average value of the reliable interval and the upper and lower solid lines were ±1 standard deviation. According to the above experimental results, the DESS VEHsystem has much higher power benefit than the generating efficiency of a single sheet.The generating efficiency of a single or double sheet in the second mode was not higher than that in the third mode, its power benefit wasmuch steadier than the third mode. Table 5 shows the AC test. As seen, the voltage generated by the third mode of DESS was much higher than the voltage in the third mode of a single sheet. In other words, when the piezo patchwas in operation, an additional external force would change the electric energy abruptly, the LED can emit light. The first three beam modes vibrations with PZT and the impact motions were observed. The first two modes have less vibration frequencies and also less impact forces applied on the PZT. Since the peak of the beam motion has the largest displacement—and also the higher frequency the faster the clapping motion—the optimal placement of the piezo patchwas near the peak of the third cantilevered beam mode. There was additional electric energy driving the bridge rectifier, which was stored in the Ni–H battery (detailed below), and the applicability of the piezoelectric VEHsystem was enhanced. Due to clap and/or swing motion of the steel sheets, harmonic motions cannot be seen in this system. Note that the average value and the reliable range are zoomed to show the detail. The irregularDC outputs in Figure 7, Figure 8 and Figure 9 may be due to their detailed scales. The fluctuation ranges were quite small comparing with the AC cases.
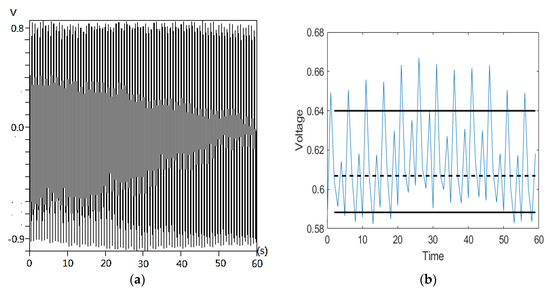
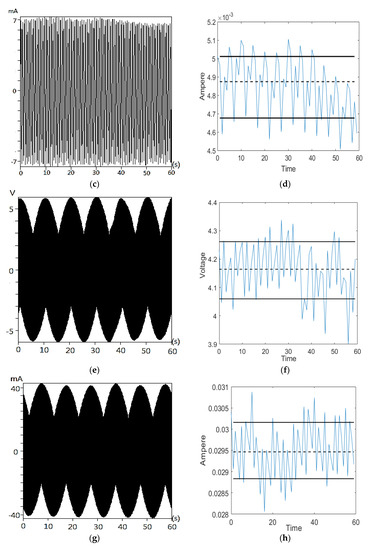
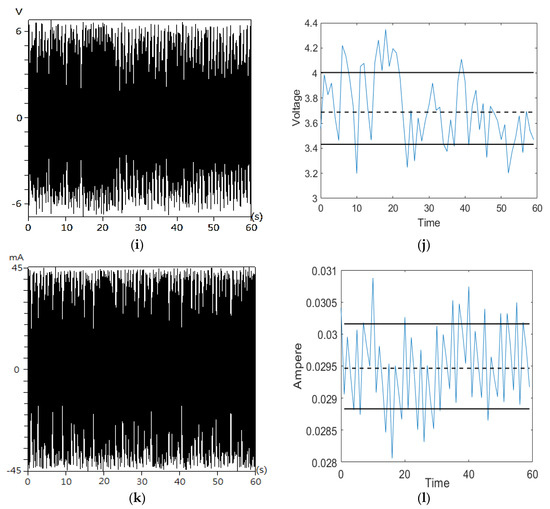
Figure 8.
Experimental power benefit data of SESS system, (a) 1st mode voltage, (b) 1st mode RMS voltage, (c) 1st mode ampere, (d) 1st mode RMS ampere, (e) 2nd mode voltage, (f) 2nd mode RMS voltage, (g) 2nd mode ampere, (h) 2nd mode RMS ampere, (i) 3rd mode voltage, (j) 3rd mode RMS voltage, (k) 3rd mode ampere, (l) 3rd mode RMS ampere.
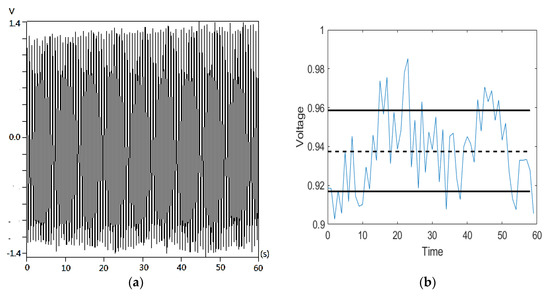
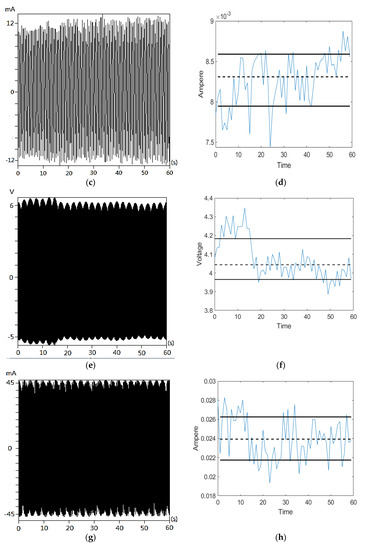
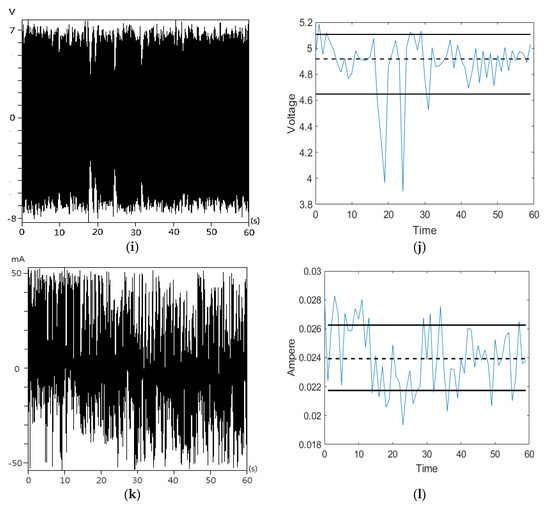
Figure 9.
Experimental power benefit data of DESS system. (a) 1st mode voltage, (b) 1st mode RMS voltage, (c) 1st mode ampere, (d) 1st mode RMS ampere, (e) 2nd mode voltage, (f) 2nd mode RMS voltage, (g) 2nd mode ampere, (h) 2nd mode RMS ampere, (i) 3rd mode voltage, (j) 3rd mode RMS voltage, (k) 3rd mode ampere, (l) 3rd mode RMS ampere.
Table 5.
AC testof the SESS and DESS systems ((R) represents piezo patch placed at the root, (P) represents piezo patch placed at the peak).
3. Theoretical Modeling of DESS Vibration System and Piezo PatchCoupled VEH
This section builds the theoretical model of a nonlinear beam, piezo patch, piezoelectric coupling coefficient and current equation. The method of multiple scales (MOMS) was used to analyze this nonlinear problem. The results were mutually validated with experimental results. The concept of VEH was proved feasible, and an accurate theoretical analysis model is provided.
3.1. Theoretical Analysis of Equation of Motion of SESS Nonlinear Beam
The SESS system was considered first, where the main body of the elastic steel sheet was assumed to be a fixed-free nonlinear cantilever beam as shown in Figure 10, which refers to the nonlinear beam theory of Nayfeh and Pai [18] andwas coupled with the piezo patch-current equation. It was assumed that the DESS system uses the second elastic steel sheet to apply the clapping force to the original (first) elastic steel sheet by concentrated load, as shown in Figure 11.
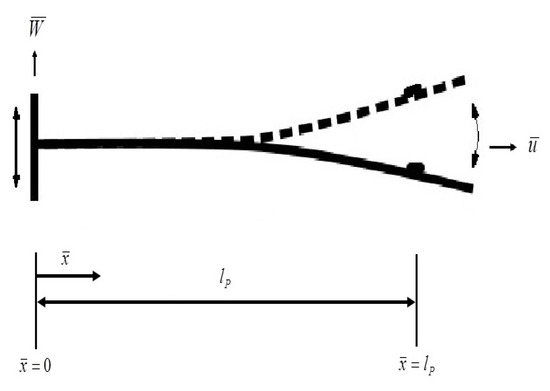
Figure 10.
Schematic diagram of SESS system.
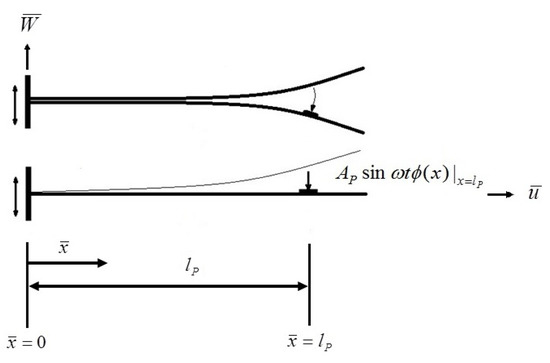
Figure 11.
Schematic diagram of DESS system.
The initial status of the beam was considered straight, and each cross-section was a plane that follows stress-strain laws. Using Newton’s 2nd Law, Euler’s angle transformation and Taylor series expansion, this study derives the basic equations of motion for the nonlinear beam, but excludes any rotations in the beam; i.e., limiting it to planar motions. According to the nonlinear 2D Euler–Bernoulli beam theory, the equations of motion for the 2D beam are, as follows:
where m is the beam mass, E is the Young's modulus of the beam, A is the cross sectional area of the beam, IA is the moment of inertia of the beam, denotes d/, denotes d/, and F is the uniform distributed simple harmonic load, in order to simulate the vibration force under a suspension bridge, on the automobile (motorcycle) body, on a plane’s trailing edge wing and under the main rotor of a rotary wing aircraft. In terms of the boundary conditions, one end of the beam is fixed, and the other end is free. The correlation between and can be found under the boundary conditions, where represents the function of , and the motion equation of the beam can be reduced to the equation of the simple direction. The detailed procedures please see Refs. [19,20]. The equation of the transverse motion of the elastic beam can be expressed by Newton's method, as follows:
where are the nonlinear geometry terms and is the structural damping term. The first term on the right of the equation is the shortening effect, also known as nonlinear inertia. Equation (6) is nondimensionalized and the nonlinear beam equation can be obtained:
where is the beam’s spatial coordinate on the horizontal axis, x represents the dimensionless variable of .Equation (7) is the dimensionless equation of motion, where denotes d/dx, denotes d/ and f is the dimensionless simple harmonic external force. Appendix A shows other dimensionless coefficient settings, as well as the definitions of the coefficients. The boundary conditions of this model are:
3.2. Theoretical Modeling of Piezo Patch
This study only considers the Coulomb force (electric force) applied by the piezo patch to the nonlinear beam. The effects of layers and the material properties of the piezo patch on the beam were not considered in this study. According to Harne [1] and Roundy [3], the piezoelectric equation for the piezo patch is:
The Coulomb force (electric force) applied by the piezo patch to the nonlinear beam is:
where and are the positions of the PZT from one end to the other end, Cf is the piezoelectric coupling coefficient and Cp is the capacitance of the piezoelectric patch. Each term is divided by , and a dimensionless piezo patch equation is obtained.
where a and b are the dimensionless values of and , , , ,
Equation (11) is arranged to obtain:
The Coulomb force applied by the piezo patch to the nonlinear beam is divided by (i.e., divided by ) and arranged to obtain a dimensionless value:
where . Finally, a nonlinear beam equation with the piezo patch is obtained:
3.3. Theoretical Model of DESS System and Piezo Patch Coupled VEH
The DESS system assumes one elastic steel sheet applies clapping force to another elastic steel sheet (SESS) by concentrated load, as shown in Figure 11. If the piezo patch is placed at of SESS and the clapping force from the of another elastic steel sheet is expressed as , we assume . The formulation of the impact force is FTP = and the integration gives FTP = , the dimensionless expression is , then , as shown in Figure 11. Where AP is the beam's dimensionless amplitude and is the position of the piezo patch (dimensionless). Finally, a DESS nonlinear equation that considers the piezo patch deformation and the clapping force applied to piezo patch is obtained.
Only bending mode was considered in the theoretical model. Equations (5)–(7), (14), (15) detail the nonlinear bending motion of the DESS VEH system. The slender beam model was assumed to ignore the coupled torsional motion. However, the proposed model integrates the clapping motion of the beams, the best PZT position and the beam vibration mode for best power generation. The system frequency response was detailed and presented in Section 4.
4. System Frequency Response Analysis
This study adopted MOMS to analyze the frequency response and fixed points of the nonlinear equation, which involve dividing the time scale into fast and slow time scales. Suppose T0 = is the fast-time term, T1 = is the slow-time terms and , , where is the time scale of small disturbances and is a minimum value; MOMS is a technique used for small perturbations. We considered weak damping and nonlinearity. The structural damping was always used to simulate a solid material when it flexes. As for the simulation of steel sheet vibrations, the damping coefficient was rather small.Under the assumptions of small perturbations and weakly nonlinear vibrations, we scaled the dimensionless structural damping coefficient (), the forcing term and the other nonlinear terms in the order of . The structural damping coefficient was not derived experimentally in this study, however, a small value of (0.1) was chosen throughout this theoretical analysis. As is a minimum value, the effect of high order terms on the system was neglected. The term composed of the order of in Equation (15) is:
The term composed of the order of is:
Considering the frequency response of the system, the simple harmonic external force term f is assumed to be , where is the tuned frequency and = 0 () represents the beam’s nth mode natural frequency. The boundary conditions of the aforesaid equation and equation are:
The direction is divided into time and space by using the separation of variables, defined as and substituted in Equation (16) to obtain:
The characteristic equation can be obtained by using boundary condition:
cos αl cosh αl = −1
The mode shape of the mth mode can be expressed as the following equation:
The general solution of can be expressed as the following equation:
where is the phase angle and is the eigenvalue.
Regarding frequency response analysis, it was assumed that the piezo patch will not have substantial effect on the amplitude of this elastic beam. Assuming and and substitute into Equations (15) and (16). The orthogonal method was used to obtain the following equation:
Order of :
Order of :
where Q1 is detailed in Appendix B. The term on the right-hand side of Equation (26) contains the coupling condition of the different modes of this beam. Thus, the first three modes of this beam were considered in this analysis due to the coupling effects. Moreover, considering the frequency response of the system, the simple harmonic external force term (f) was assumed to be . For each mode n (n = 1, 2, and 3), the , and terms (secular terms) were selected, and let the secular terms be zero to obtain the solvability condition. As the frequency response analysis method for different modes was the same, based on concise layout and taking the first mode as an example, the secular terms of the first mode are multiplied by and let , in order to determine the frequency response of the system at the fixed points (steady state), let
From Equation (27) we have . Let and then, the real part and imaginary part of the first mode secular terms are squared and added up with the real and imaginary parts of the second and third modes secular terms to obtain solvability conditions. For the sake of simplicity, the solvability conditions are shown in Equations (A1)–(A5) in Appendix C. Equations (A1)–(A5) were calculated by numerical method (the Levenberg–Marquardt algorithm (NEQNF of IMSL solver)) and the fixed point plot of amplitudes A01, A02, A03 and tuned frequency () of this system were made. Figure 12, Figure 13 and Figure 14 show the fixed-point plot of amplitudes A01, A02, A03 and tuned frequency () to observe the frequency response. Figure 12a is the first mode fixed point plot of disturbing the first mode, where the peak amplitude wasverified by time response; Figure 12b,c shows the amplitudes of the second mode and the third mode when disturbing the first mode and the amplitude was very low compared with the amplitude of the first mode. In a similar manner, as shown in Figure 13 and Figure 14, when disturbing the second mode, the amplitudes of the first mode and the third mode were very low, except for the second mode. When disturbing the third mode, the amplitudes of the first mode and the second mode were very low, except the third mode, meaning different modes do not transfer energy to each other with specific frequency disturbance. Thus, the power benefit of each mode can be analyzed independently in the analysis of the VEH system.
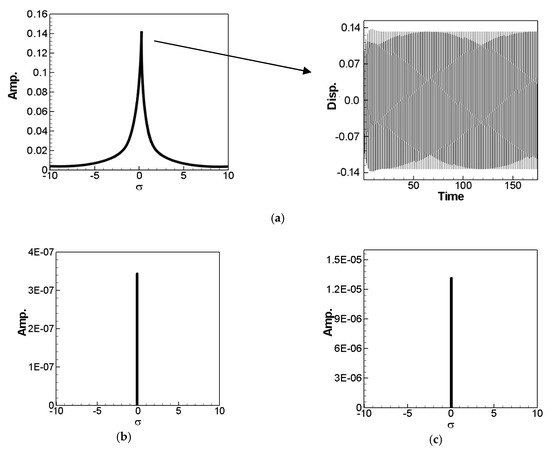
Figure 12.
Fixed point plots when exciting the 1st mode, (a) 1st mode Fixed point plot and time response, (b) 2nd mode Fixed point plot, (c) 3rd mode Fixed point plot.
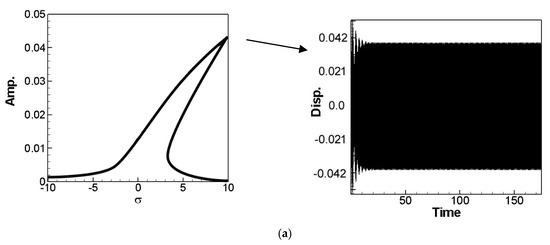
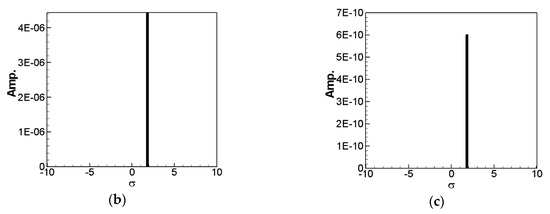
Figure 13.
Fixed point plots when exciting the 2nd mode, (a) 2nd mode Fixed point plot and time response, (b) 1st mode Fixed point plot, (c) 3rd mode Fixed point plot.
Figure 14.
Fixed point plots when exciting the 3rd mode, (a) 3rd mode Fixed point plot and time response, (b) 1st mode Fixed point plot, (c) 2nd mode Fixed point plot.
5. DESS and Piezo PatchCoupled VEH System Analysis
This section analyzes the power benefit of a double fixed-free nonlinear beam with a piezo patch and the theoretical feasibility was verified by the experimental results. The perturbation technique was used to analyze the nonlinear beam equation (Equation (14) of DESS with a piezo patch. The deformation (W) of the beam is expressed in the following form:
where is the value of the equilibrium state. The value can be obtained by the fixed-pointplots in Section 4 and is the perturbation term. Equation (28) is substituted into Equation (14) and orthogonalized. The perturbation equation is expressed as follows:
Q1n is detailed in Appendix B, is solved in Section 4 (i.e., A0n); AP is the deformation of DESS at lP, as obtained by the Equation (23) vibration mode (mode shape) and multiplied by amplitude A0n; is the disturbance value (unknowns). The in Equation (29) was computed by the 4th order Runge–Kutta method and the response graph of voltage V and time t of this system was drawn. The numerical simulations were compared with experimental results to verify the feasibility of this theoretical model. The results are detailed below.
6. Experimental and Theoretical Verification
6.1. Analysis of the Power Benefits of SESS and DESS
In order to verify the accuracy of the numerical simulation and experimental result, the numerical solutions of different modes were computed by using the experimentally applied external force, frequency, elastic steel sheet quality, length and locations of the piezo patch in different modes. The voltage and time response plot of the SESS and DESS coupled system was obtained by using the 4th order Runge–Kutta method. The first mode AC voltage of SESS was−0.3 to 1.2 V (Figure 15a); the second mode AC voltage was −5 to 8 V (Figure 15b); the third mode AC voltage was −5.5 to 4 V (Figure 15c). The first mode AC voltage of DESS was −1 to 2.3V (Figure 15d); the second mode AC voltage was −7 to 7.5 V (Figure 15e); the third mode AC voltage was −8 to 6 V (Figure 15f). For verification with experimentation, the AC voltage was converted into an AC voltage effective value by using the root mean square (RMS). First, the RMS of AC voltage per second was taken and the moving average figures of the first, second and third modes of SESS and DESS can be obtained, respectively. The first, second and third mode voltage moving average of SESS was shown in Figure 16a–c, respectively; the first, second and third mode voltage moving average of DESS was shown in Figure 16d–f, respectively. Finally, an AC voltage effective value was obtained by averaging the first, second and third modes of SESS, which were about 0.665933 V, 4.020549 V and 3.805492 V, respectively. The first, second and third modes of DESS were about 1.211152 V, 4.416669 V and 5.068068 V, respectively. For convenient comparison, the optimal benefit results of SESS and DESS of numerical simulation and experimental results are compiled in Table 6. The “Displacement” was the magnitude of the displacement of the elastic steel sheet and the displacement of SESS was slightly different from that of DESS, as based on concise layout; however, the same value was not filled in DESS. In Table 6, the “Range of the output voltage” was the range of the AC voltage of different modes; the “Root mean square voltage” was the effective value of the voltage of different modes; the “Error with Experiment Results” was the relative error between the numerically simulated effective value of voltage and the experimentally measured effective value of voltage.
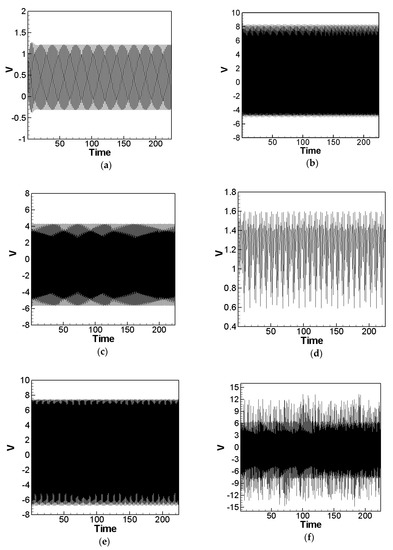
Figure 15.
Nonlinear numerical simulation of AC voltage, (a) SESS 1st mode, (b) SESS 2nd mode, (c) SESS 3rd mode, (d) DESS 1st mode, € DESS 2nd mode, (f) DESS 3rd mode.
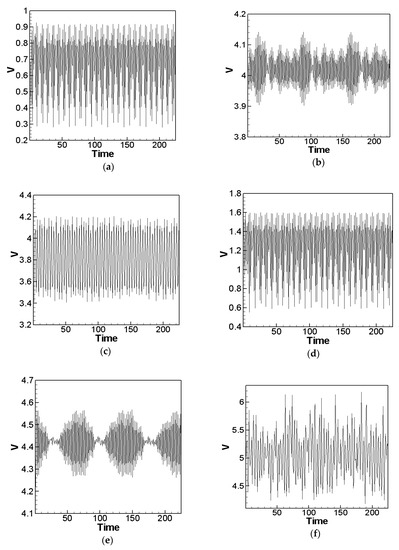
Figure 16.
Numerical simulation of AC voltage—RMS (moving average). (a) SESS 1st mode, (b) SESS 2nd mode, (c) SESS 3rd mode, (d) DESS 1st mode, (e) DESS 2nd mode, (f) DESS 3rd mode.
Table 6.
Theoretical and experimental resultants of power benefits of SESS and DESS systems.
Comparing the values in Table 6, the order of power benefits of SESS was second mode > third mode > first mode; the order of power benefits of DESS was third mode > second mode > first mode. The error of different modes was 3.01%–29.1%, which was in a reasonable range. Generally, the displacement of the low mode was larger than that of the high mode, while the high mode has better power benefit for higher frequency. Most of the slender beam VEH systems put the PZTs near the beam root to get larger forces or moments on the PZTs and hence to obtain a higher power energy. In the work of Li et al. [10] considered the nonlinear LCO motion of the airfoils. The PZTs were installed near the beam root and the first mode of the beam was considered. In the present work, a longer steel sheet or beam was required to show the higher mode effects. The vibrations of the beams provide not only a large deformation on the installed PZT but also a direct impact force on the PZT. Therefore, by just adding an extra steel sheet, the power generation was better than a single PZT beam.
6.2. Comparison between Linear and Nonlinear Elastic Steel Sheet Systems
In order to verify the accuracy of the nonlinear ESS, the benefits of linear SESS and DESS systems were analyzed. The results were compared with the nonlinear ESS system, in order to prove the necessity of the nonlinear system assumption. First, the nonlinear terms of Equation (15) were removed and the linear beam VEH systems of SESS and DESS were obtained:
The deformation of each mode was expressed as , substituted in Equations (30) and (31) and orthogonalized,
The response of voltage V and time t of the different modes of SESS and DESS were obtained by using the 4th order Runge–Kutta method and averaged to obtain the AC voltage effective value of linear SESS and DESS, respectively. For convenient comparison, the aforesaid results and the results of the nonlinear system are compiled into Table 7. As seen, the errors of the different modes of SESS and DESS of the linear system and experimental measurement were larger than different modes of SESS and DESS of the nonlinear system. Therefore, the simulation result of the linear ESS system was inaccurate and the assumption of the nonlinear system was correct.
Table 7.
Power benefits of linear and nonlinear systems.
It was noted that instead of the frequently studied 1st mode vibration VEH system, the purpose of this study was to discover if there was any higher mode vibration that can generate more power. Since up to the 3rd mode was considered in the present work, a longer steel sheet or beam was required to show the higher mode effects. The DESS model was designed to be mainly installed on a main body like airplane wing trailing, under the helicopter rotor and the suspension bridge.Comparing with those main bodies, the length of the devise was suitable and will not affect the normal function of the aircrafts. Unlike the wireless network, the power generated by the PZTs were collected by wires and applied or stored in other devices. The power density cannot be compared for a shorter vibration model or a longer one. Most of the slender beam VEH systems put the PZTs near the beam root to get larger moments on the PZTs and hence to obtain a higher power energy. In the work of Li et al. [10] considered the nonlinear LCO motion of the airfoils. The PZTs were installed near the beam root, and the first mode of the beam was considered. In the present work, a longer steel sheet or beam was required to show the higher mode effects. Results show that the 3rd mode plays an important role in power generation.
7. Design and Implementation of the DESS Energy Storage System
In order to attain the goals of complete system integration and practical application, an energy storage system was demonstrated and the electric energy generated by the piezo patch was stored and used. This energy storage equipment comprises a bridge rectifier, capacitor, LED, Schottky diode and Ni–H battery. It was noted that the power generation from the proposed DESS VEH was not high enough to store in a Li battery. The NI–H battery was rather a better choice for low power storage device.
7.1. Introduction to Electronic Modules
The bridge rectifier comprised four pairwise diode assemblies. Figure 17 shows the schematic diagram of the bridge rectifier. The capacitor was an electrolytic capacitor, and the electric energy generated by the piezo patch was an alternating current. To store the electric energy in the capacitor, the AC must be converted by the bridge rectifier into direct current, and the other end of the bridge rectifier was connected to a LED to verify that the electric energy generated by the piezo patch can successfully drive the bridge rectifier and LED. A capacitance was connected in series in front of the LED, which stores electricity and stabilizes voltage, thus, the LED with a capacitor can emit light stably.
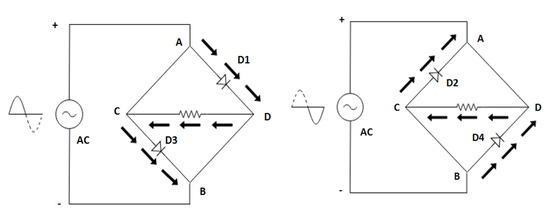
Figure 17.
Schematic diagram of the Bridge Rectifier.
7.2. General Description of the Energy Storage System
A simple electricity storage system was made by using a resistor, Schottky diode andNi–H battery. First, a 30-ohm resistance was connected to the LED in parallel, and the Schottky diode was connected to the cathode of the LED. Finally, the anode of the battery box was connected to the Schottky diode. The circuit diagram was shown in Figure 18. The total voltage generated by the third mode of the DESS system was about 4.7V, and this voltage was assumed to be Vtotal. The Schottky diode drops the voltage to 0.6V when the current was 1A. However, the current supplied by the DESS system was about 30mA, thus, the voltage drop was approximately 0.25V, and this voltage was set as V2. The voltage of the Ni–H battery was about 1.4V after it was fully charged, and this voltage was set as V3. The residual voltage V1 was supplied to the LED; Vtotal = V1 + V2 + V3 according to circuit diagram, where the higher the battery voltage, the lower the voltage of the LED. As a result, the fully charged Ni–H battery reduces the light intensity of the LED.
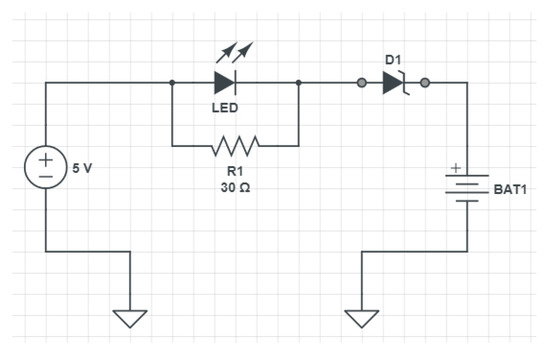
Figure 18.
Circuit diagram of the energy storage system.
7.3. Energy Storage Efficiency
In the demonstration of energy storage efficiency, an Arduino nano board was used to make a simple dynamometer, where the working voltage, current, and power can be measured using Arduino IDE. The voltage before the Ni–H battery was charged, as measured by the Arduino dynamometer, was 0.86V, the current was 0.01A, and the power was about 0.01W (Figure 19a). The Ni–H battery was charged in the DESS system, measured by dynamometer after one hour, and the voltage was 1.09V, the current was 0.18A and the power was 0.20W (Figure 19b). The aforesaid measurement experiment proves this system can smoothly charge one Ni–H battery with insufficient electric quantity and the Ni–H battery can be charged for other electric appliances.
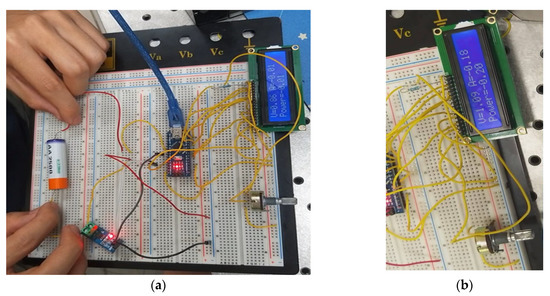
Figure 19.
Arduino nano board dynamometer. (a) Ni–H battery before charged, (b) Ni–H battery charged after one hour.
8. Conclusions
This study proposes the concept of DESS, improves the VEH system proposed by predecessors. This system can be installed on general micro mechanical devices, and it can be also placed on the trailing edge of a wing or under the main rotor of a rotary wing aircraft. The mechanical energy was collected and converted into electric energy and a preliminary model of a complete solution of green energy integration was built. The following conclusions were obtained:
- The proposed DESS is a brand-new concept that is combined with the deformation of elastic steel and the flapping effect of another elastic steel sheet. The power benefit of the piezo patch was greatly improved and the generated electric energy was much higher than SESS. The 1 + 1 > 2 benefit was achieved.
- In order to prolong the lifetime of the DESS piezo patch, this study proposes a high camber protector, which is a more effective design.
- This study provides the best location of the piezo patch. Previous experiments indicated that the optimum location in the SESS system was nearby the fixed end of a fixed-free beam. As the stress was the highest, the electric energy generated by the piezo patch was the highest. In the DESS system, the maximum deformation and best location of the flap must be simultaneously considered. As there would be obvious vibration nearby the natural frequency, there would be obvious peak and nodal points. Considering these physical phenomena, the location of the piezo patch in DESS—meaning where the peak of ESS has the best effect—was obtained.
- The relative error between the theoretical and numerical results, and the experimentally measured voltage was in the reasonable range. Thus, the theoretical accuracy of the energy conversion of the nonlinear beam and piezo patch coupling system built in this study was verified.
- The power benefit of DESS was better than the power benefit of SESS. The order of the power benefits of SESS was second mode > third mode > first mode; the order of the power benefits of DESS was third mode > second mode > first mode. To sum up the findings, the effect was the best when the piezo patch was placed at the peak of the third mode of the DESS system and the high camber protector was used to generate electric energy.
- The error of the nonlinear elastic steel sheet VEH system was lower than the error of the linear elastic steel sheet VEH system, meaning it was closer to the experimental value; thus, it was necessary to assume the nonlinear system.
- A simple energy storage system was presented by using electronic modules and a Ni–H battery. The electric energy generated by the proposed system was demonstrated to be usable.
Author Contributions
Conceptualization, Y.-R.W. and M.-S.W.; methodology, Y.-R.W.; experimental analysis, M.-S.W.; theoretical analysis, Y.-R.W. and B.-Y.C.; writing—original draft preparation, Y.-R.W.; writing—review and editing, Y.-R.W., M.-S.W. and B.-Y.C. All authors have read and agreed to the published version of the manuscript.
Funding
This research was funded by the Ministry of Science and Technology of Taiwan, Republic of China, Grant Number MOST 107-2218-E-006-044.
Conflicts of Interest
The authors declare no conflict of interest.
Appendix A
Appendix B
Appendix C
The real part and imaginary part of the first mode secular terms are squared and added up to obtain:
Moreover, the secular terms of the second mode are multiplied by and the real part is:
The imaginary part is:
The Secular Terms of the third mode are multiplied by and the real part is:
The imaginary part is:
References
- Harne, R.L.; Wang, K.W. A review of the recent research on vibration energy harvesting via bi-stable systems. Smart Mater. Struct. 2013, 22, 12. [Google Scholar] [CrossRef]
- Stanton, S.C.; McGehee, C.C.; Mann, B. Nonlinear dynamics for broadband energy harvesting: Investigation of a bistable piezoelectric inertial generator. Phys. D Nonlinear Phenom. 2010, 239, 640–653. [Google Scholar] [CrossRef]
- Roundy, S.; Wright, P.K.; Pister, K.S.J. Micro-Electrostatic Vibration-to-Electricity Converters. In Proceedings of the IMECE2002, ASME International Mechanical Engineering Congress & Exposition, New Orleans, LA, USA, 17–22 November 2002. [Google Scholar]
- Roundy, S.; Wright, P.K.; Rabaey, J.M. A study of low level vibrations as a power source for wireless sensor nodes. Comput. Commun. 2003, 26, 1131–1144. [Google Scholar] [CrossRef]
- Sodano, H.A.; Inman, D.; Park, G. A Review of Power Harvesting from Vibration Using Piezoelectric Materials. Shock. Vib. Dig. 2004, 36, 197–205. [Google Scholar] [CrossRef]
- Sodano, H.A.; Park, G.; Inman, D.J. Estimation of Electric Charge Output for Piezoelectric Energy Harvesting. Strain 2004, 40, 49–58. [Google Scholar] [CrossRef]
- Erturk, A.; Inman, D.J. A distributed parameter electro- mechanical model for cantilevered piezoelectric energy harvesters. J. Vib. Acoust. 2008, 130, 15. [Google Scholar] [CrossRef]
- Rajora, A.; Dwivedi, A.; Vyas, A.; Gupta, S.; Tyagi, A. Energy Harvesting Estimation from the Vibration of a Simply Supported Beam. Int. J. Acoust. Vib. 2017, 22, 186–193. [Google Scholar] [CrossRef]
- Masana, R.; Daqaq, M.F. Electromechanical Modeling and Nonlinear Analysis of Axially Loaded Energy Harvesters. J. Vib. Acoust. 2010, 133, 011007. [Google Scholar] [CrossRef]
- Li, D.; Wu, Y.; Da Ronch, A.; Xiang, J. Energy harvesting by means of flow-induced vibrations on aerospace vehicles. Prog. Aerosp. Sci. 2016, 86, 28–62. [Google Scholar] [CrossRef]
- Wu, Y.; Li, D.; Xiang, J.; Da Ronch, A. A modified airfoil-based piezoaeroelastic energy harvester with double plunge degrees of freedom. Theor. Appl. Mech. Lett. 2016, 6, 244–247. [Google Scholar] [CrossRef]
- Wu, Y.; Li, D.; Xiang, J. On the Energy Harvesting Potential of an Airfoil Based Piezo-Aeroelastic Harvester from Coupled Pitch-Plunge-Lead-Lag Vibrations. In Proceedings of the 58th AIAA/ASCE/AHS/ASC Structures, Structural Dynamics, and Materials Conference, Grapevine, TX, USA, 9–13 January 2017. [Google Scholar] [CrossRef]
- Koszewnik, A.; Oldziej, D. Performance assessment of an energy harvesting system located on a copter. Eur. Phys. J. Spéc. Top. 2019, 228, 1677–1692. [Google Scholar] [CrossRef]
- Lin, Z.; Zhang, Y.-L. Dynamics of a mechanical frequency up-converted device for wave energy harvesting. J. Sound Vib. 2016, 367, 170–184. [Google Scholar] [CrossRef]
- Fu, Y.; Ouyang, H.; Davis, R.B. Nonlinear dynamics and triboelectric energy harvesting from a three-degree-of-freedom vibro-impact oscillator. Nonlinear Dyn. 2018, 92, 1985–2004. [Google Scholar] [CrossRef]
- Fu, Y.; Ouyang, H.; Davis, R.B. Triboelectric energy harvesting from the vibro-impact of three cantilevered beams. Mech. Syst. Signal Process. 2019, 121, 509–531. [Google Scholar] [CrossRef]
- Ottman, G.; Hofmann, H.; Bhatt, A.; Lesieutre, G. Adaptive piezoelectric energy harvesting circuit for wireless remote power supply. IEEE Trans. Power Electron. 2002, 17, 669–676. [Google Scholar] [CrossRef]
- Nayfeh, A.H.; Pai, P.F. Linear and Nonlinear Structural Mechanics; Wiley: Hoboken, NJ, USA, 2004. [Google Scholar]
- Wang, Y.-R.; Kuo, T.-H. Effects of a Dynamic Vibration Absorber on Nonlinear Hinged-Free Beam. J. Eng. Mech. 2016, 142, 04016003. [Google Scholar] [CrossRef]
- Wang, Y.; Feng, C.; Chen, S. Damping effects of linear and nonlinear tuned mass dampers on nonlinear hinged-hinged beam. J. Sound Vib. 2018, 430, 150–173. [Google Scholar] [CrossRef]

© 2020 by the authors. Licensee MDPI, Basel, Switzerland. This article is an open access article distributed under the terms and conditions of the Creative Commons Attribution (CC BY) license (http://creativecommons.org/licenses/by/4.0/).