Effect of Pore Size Heterogeneity on Hydrocarbon Fluid Distribution, Transport, and Primary and Secondary Recovery in Nano-Porous Media

Abstract
1. Introduction
2. Model and Methodology
2.1. Flash Calculation with Large Gas–Oil Capillary Pressure
2.2. Molecular Diffusion Model
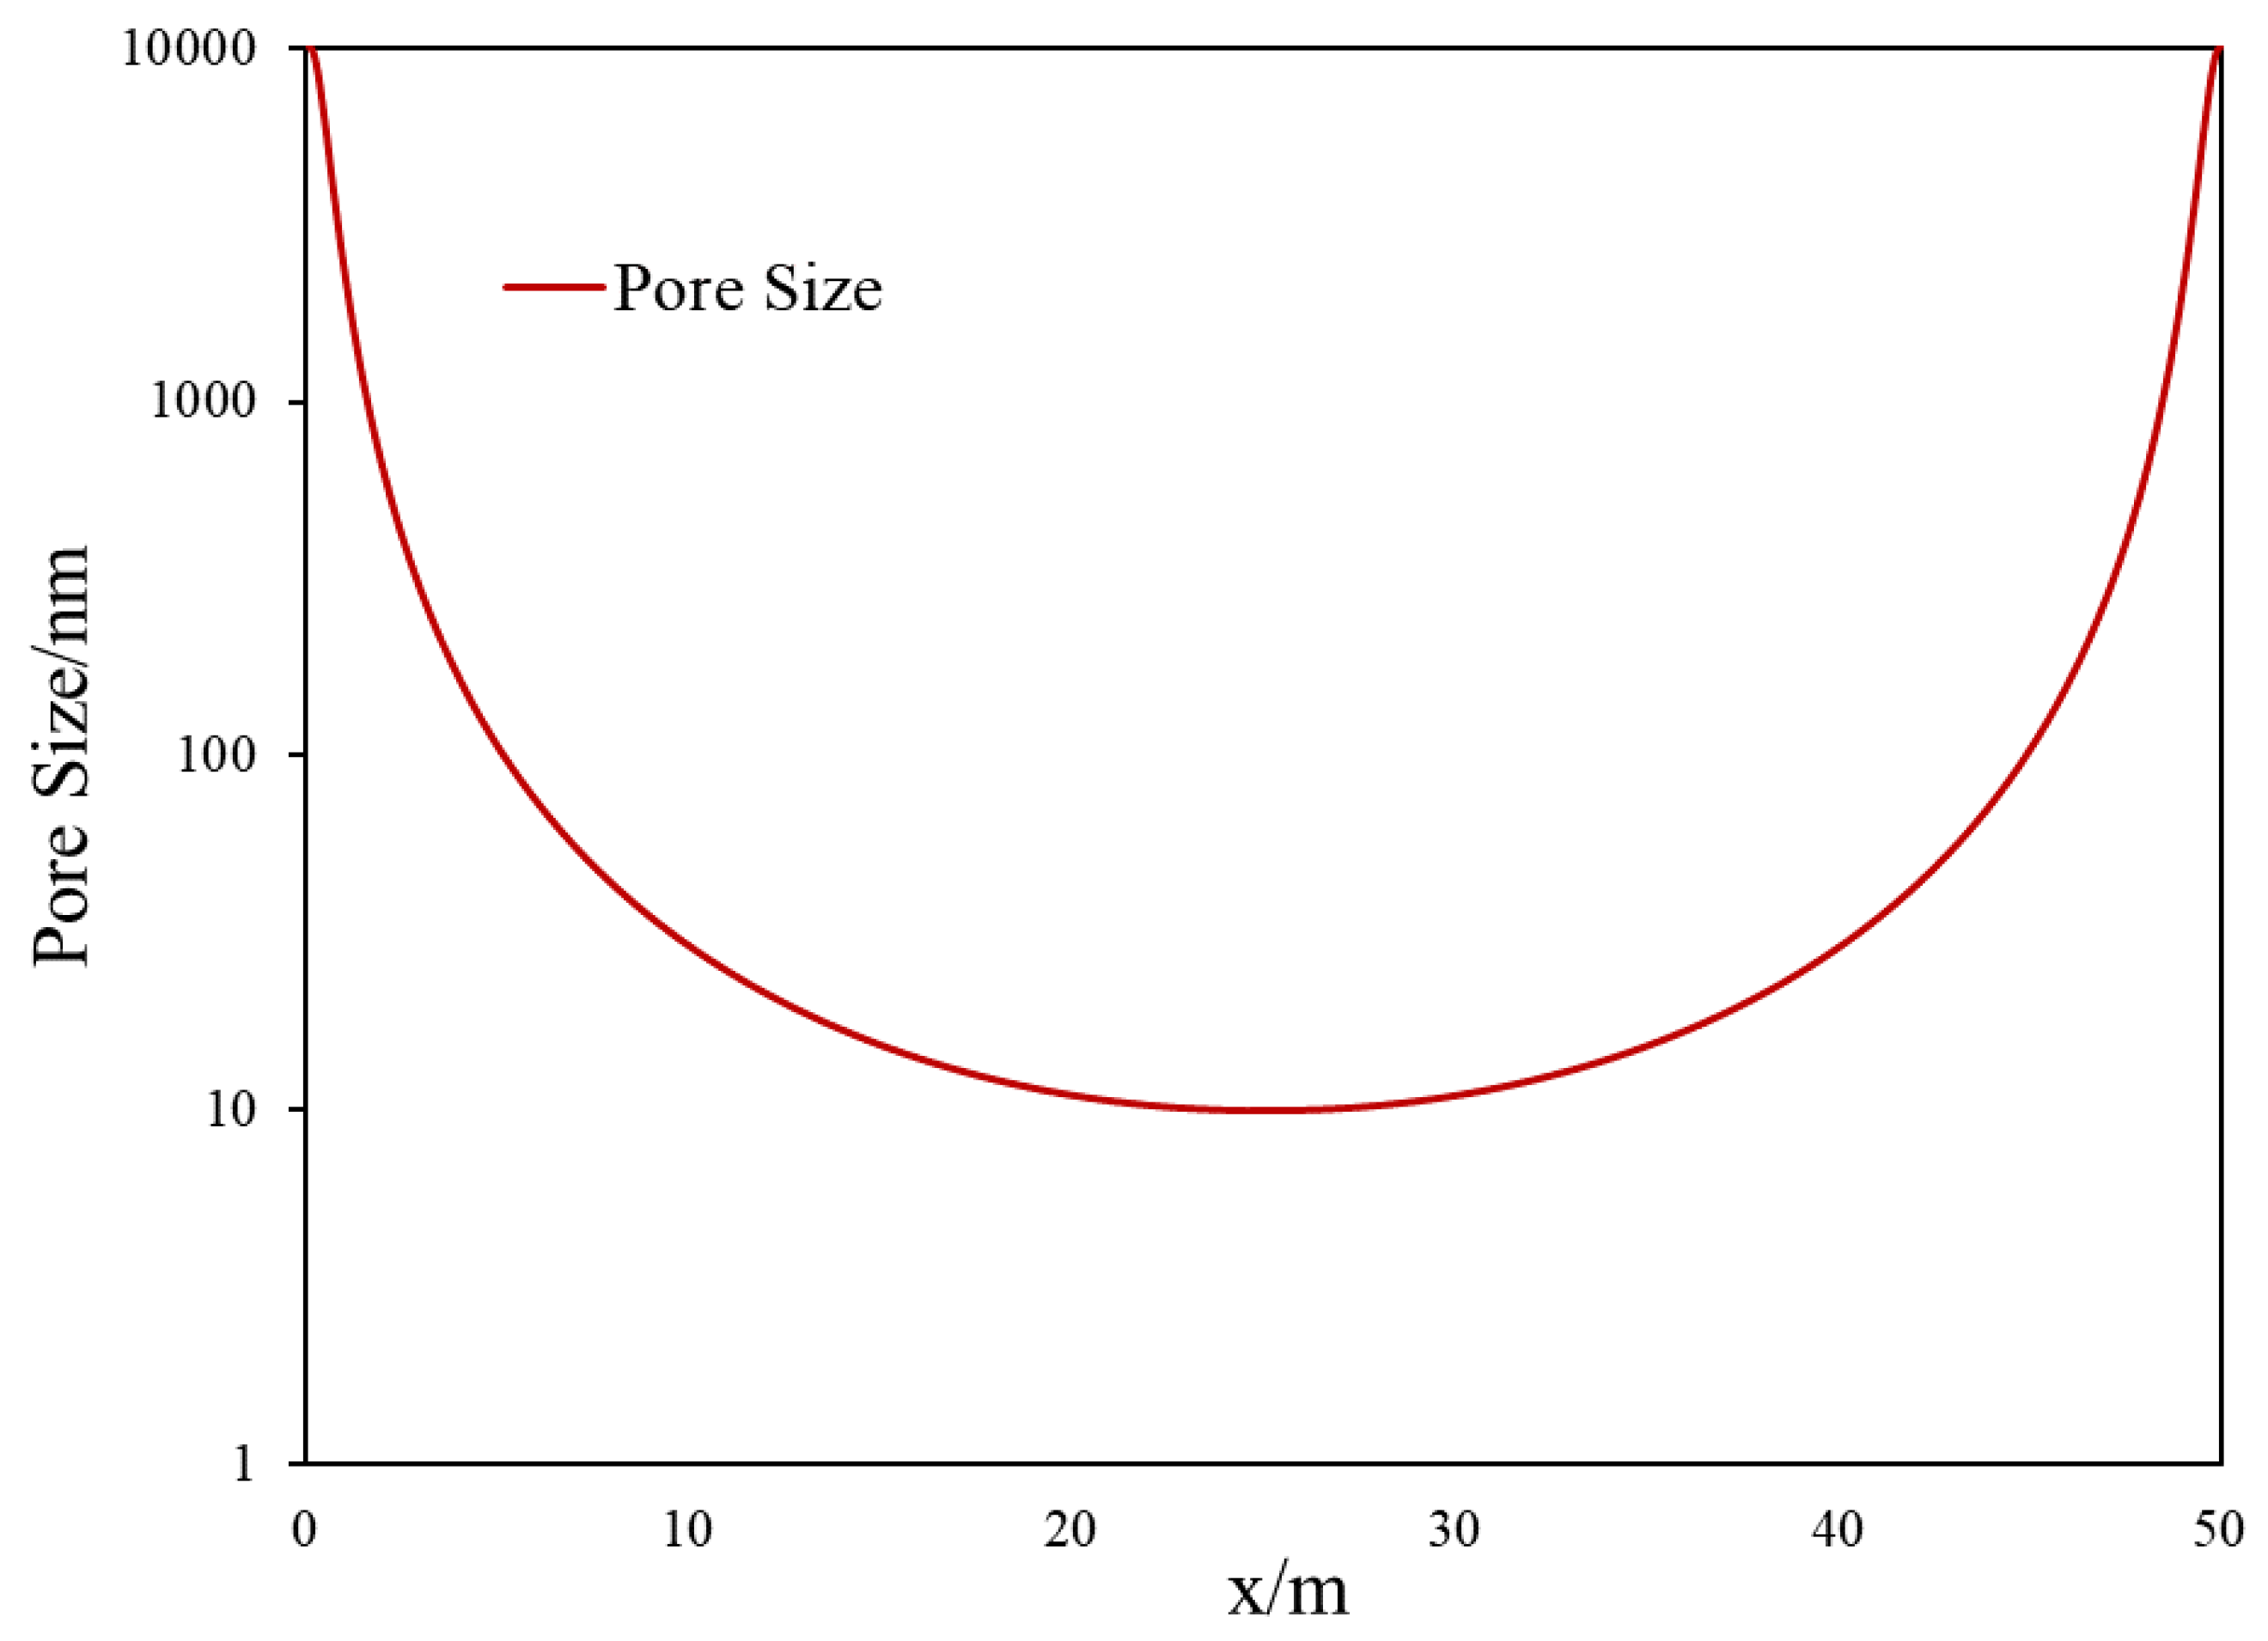
2.3. Heterogeneous Pore-Size Domain Set Up for Matrix–Fracture Interface
2.4. Slim Tube Simulation
3. Results
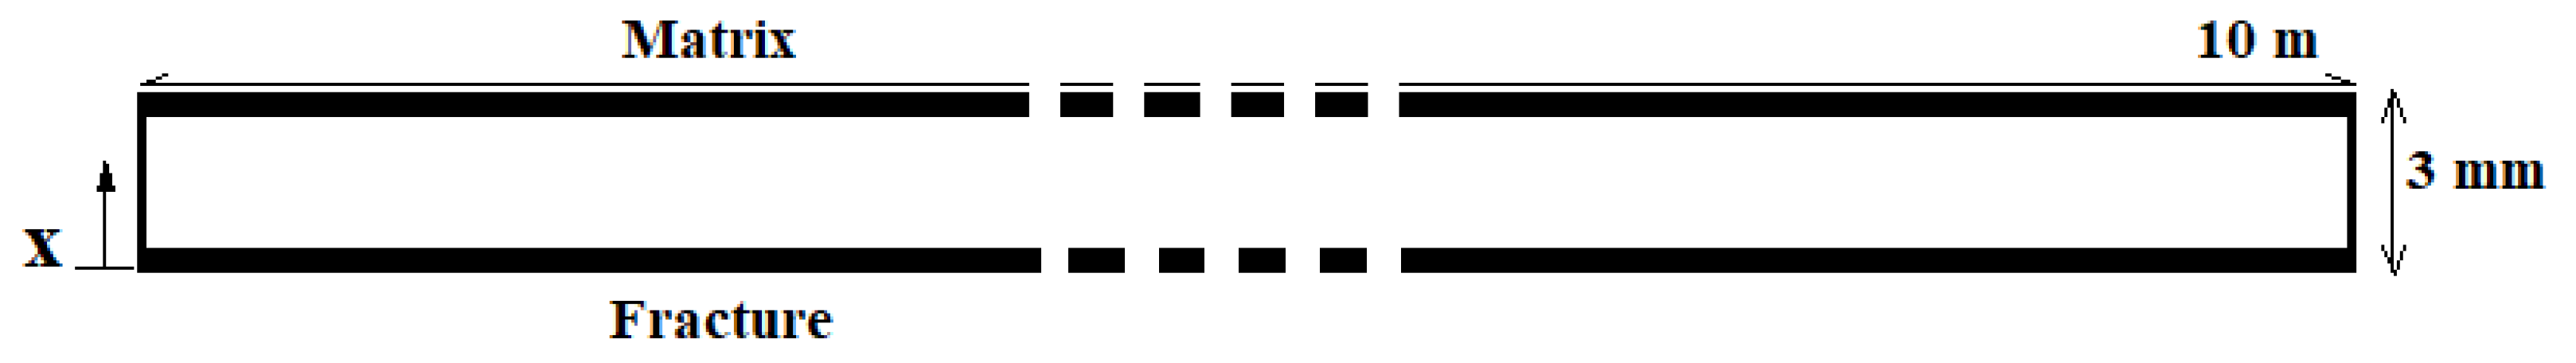
3.1. Matrix–Fracture System
3.1.1. Effect of Diffusion on Mass Transfer
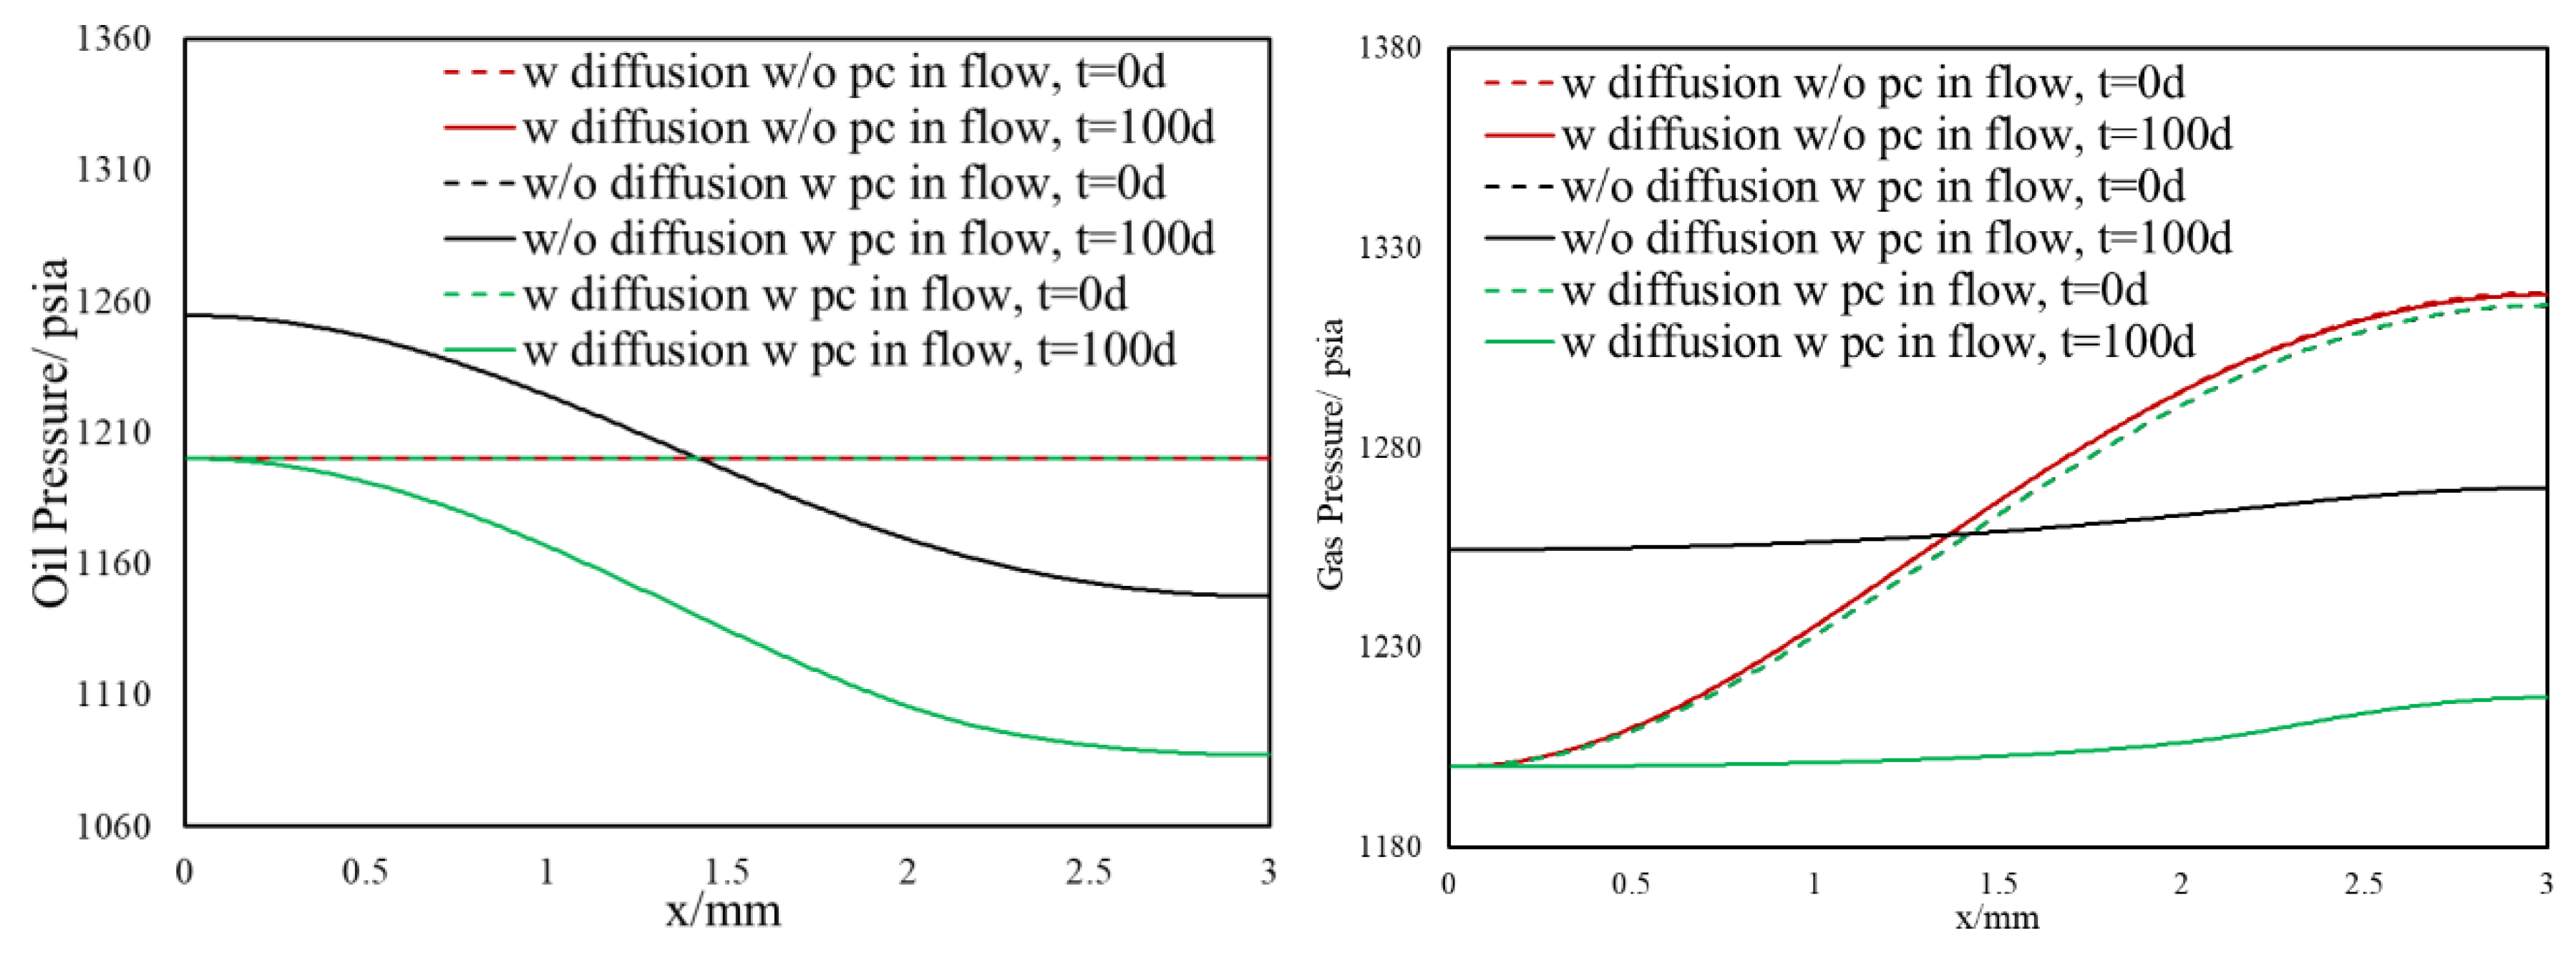
3.1.2. Inclusion of Capillary Pressure in Flow
3.1.3. Diffusion and Capillary Pressure in Flow
3.2. Slim Tube Simulations and MMP
4. Discussion
5. Conclusions
- For the first time, we proposed a new drive for mass transfer of two-phase oil gas multicomponent fluids in highly heterogeneous nano-porous media with pore size distribution.
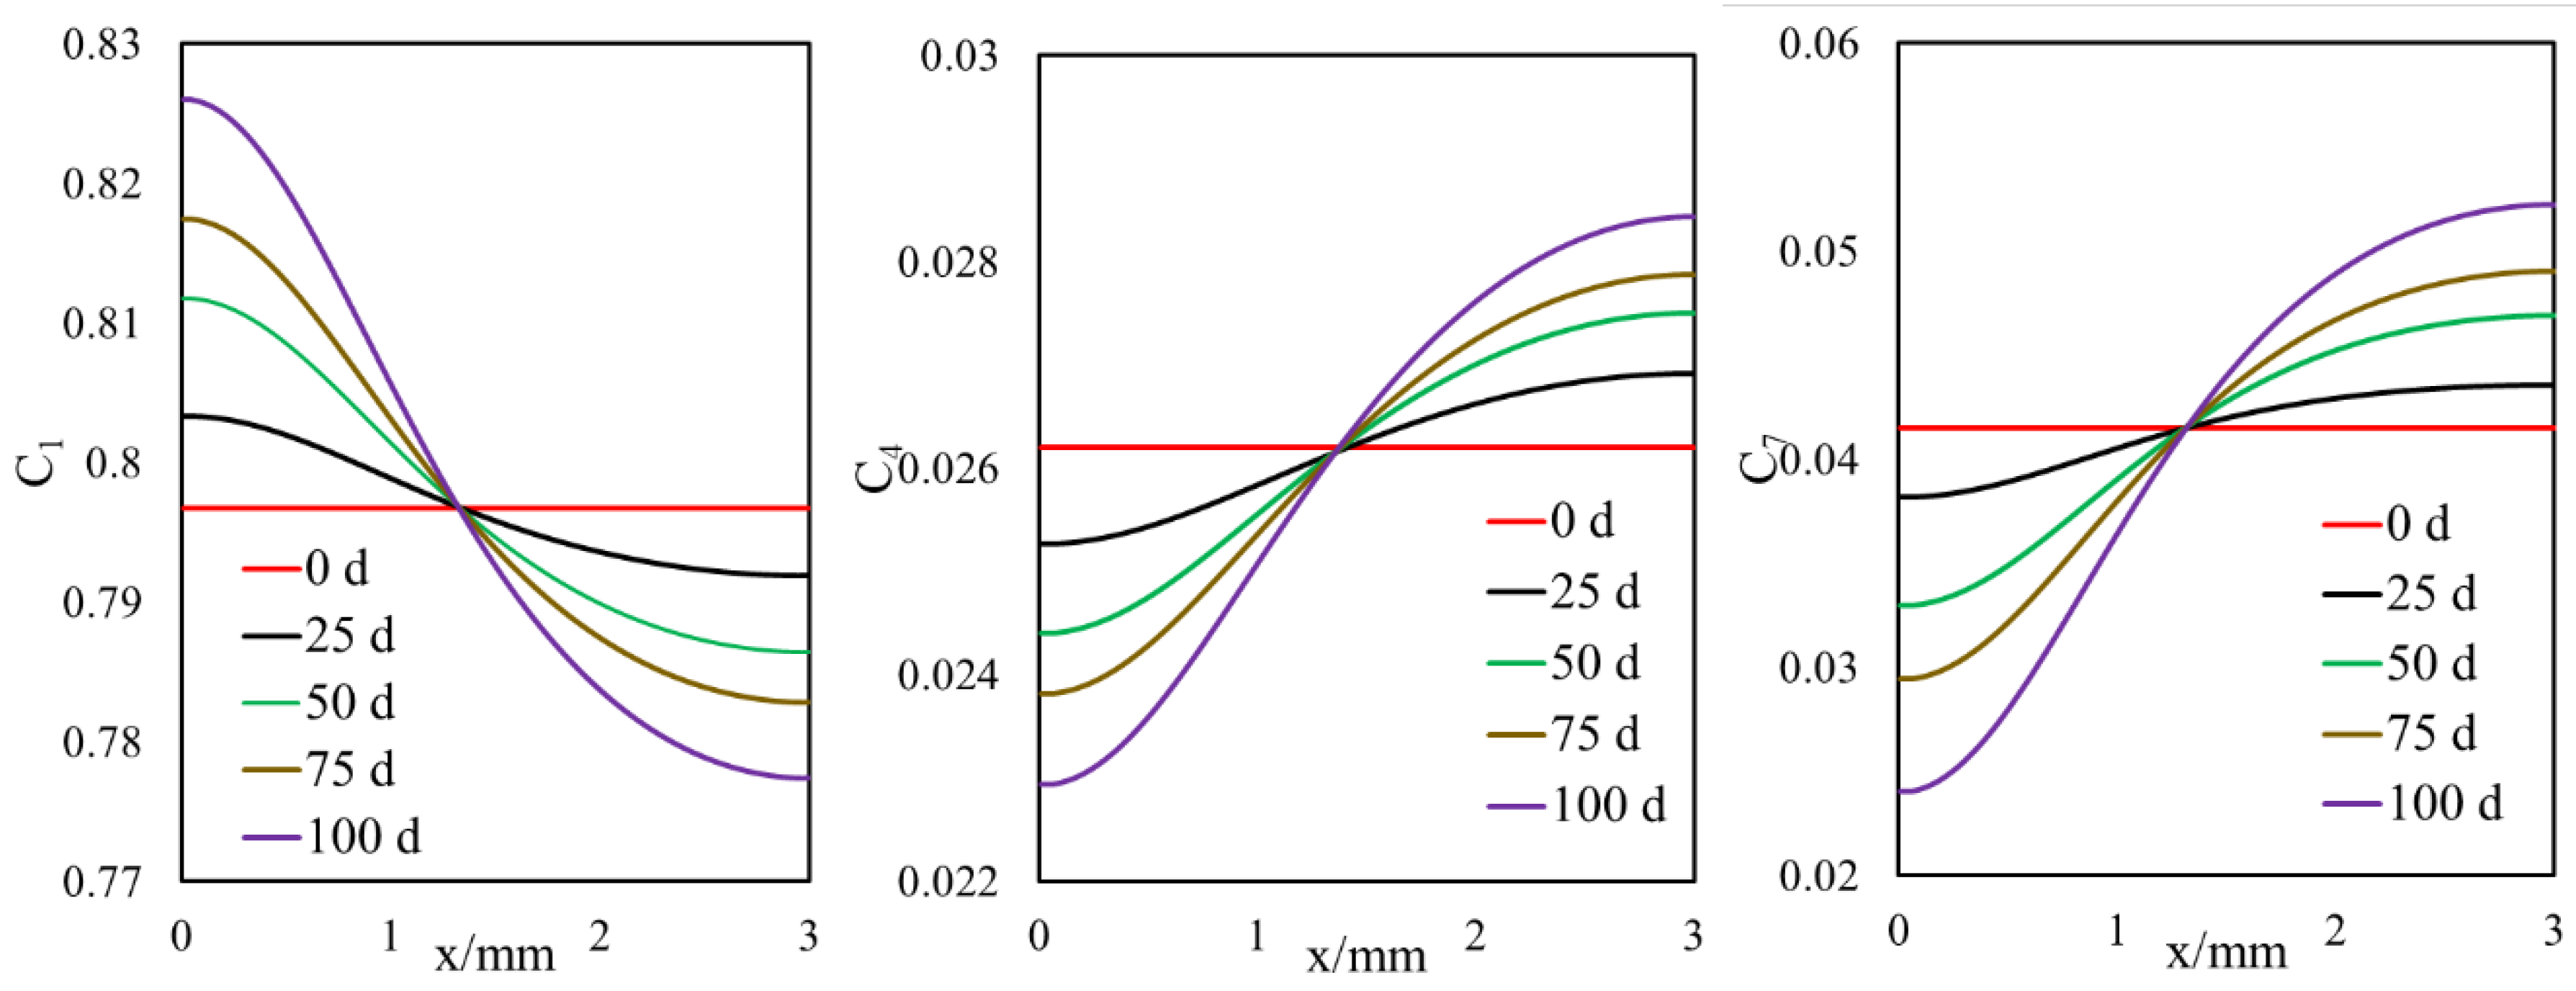
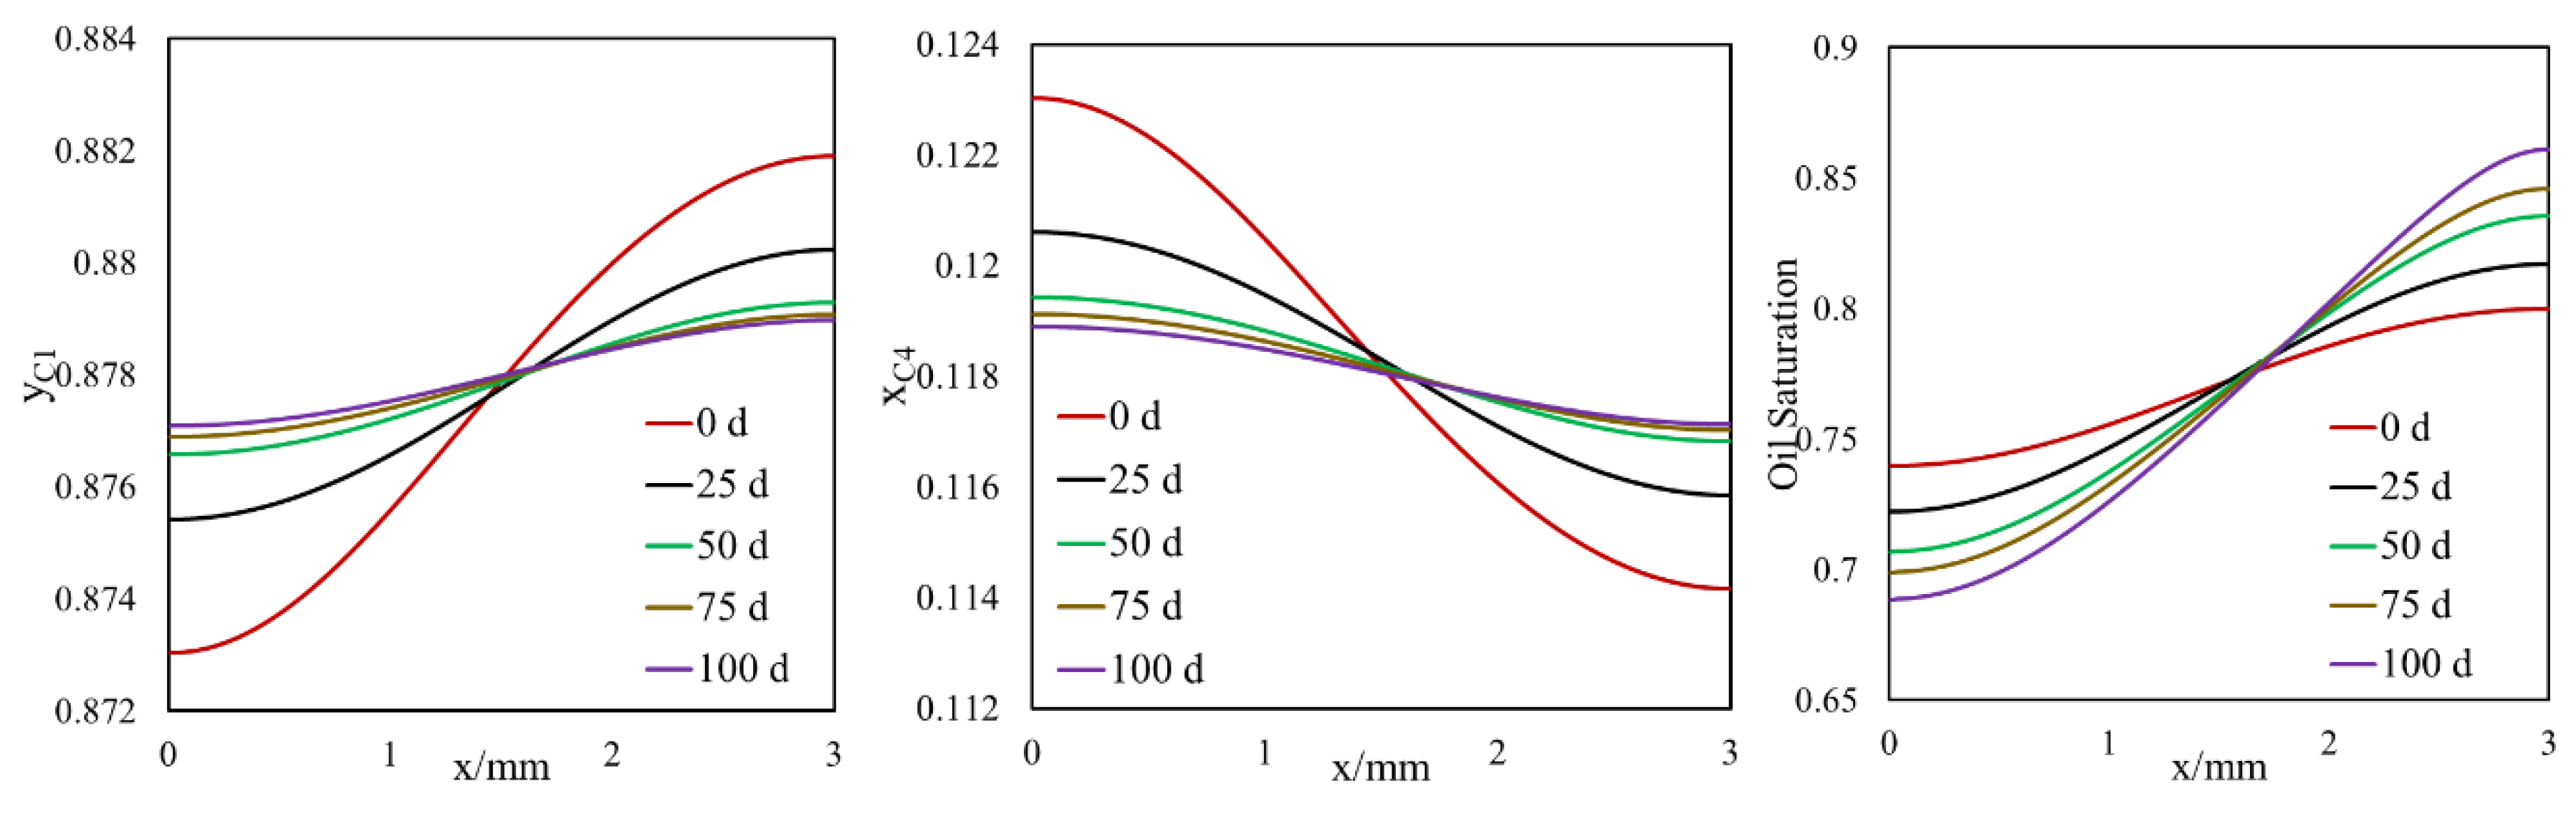
- Owing to the high gas–oil capillary in nanopores, in heterogeneous porous media with a pore size distribution, phase compositions are altered, and different phase compositions are observed in pores with different sizes.
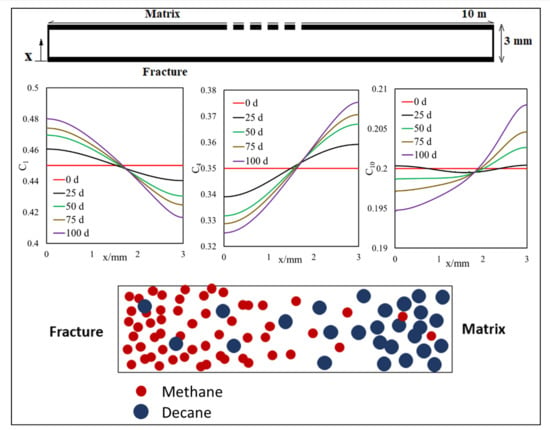
- Different phase compositions in neighboring pores (or fracture and matrix) with different pore sizes result in composition gradients and this phase composition gradient is the driving force for molecular diffusion.
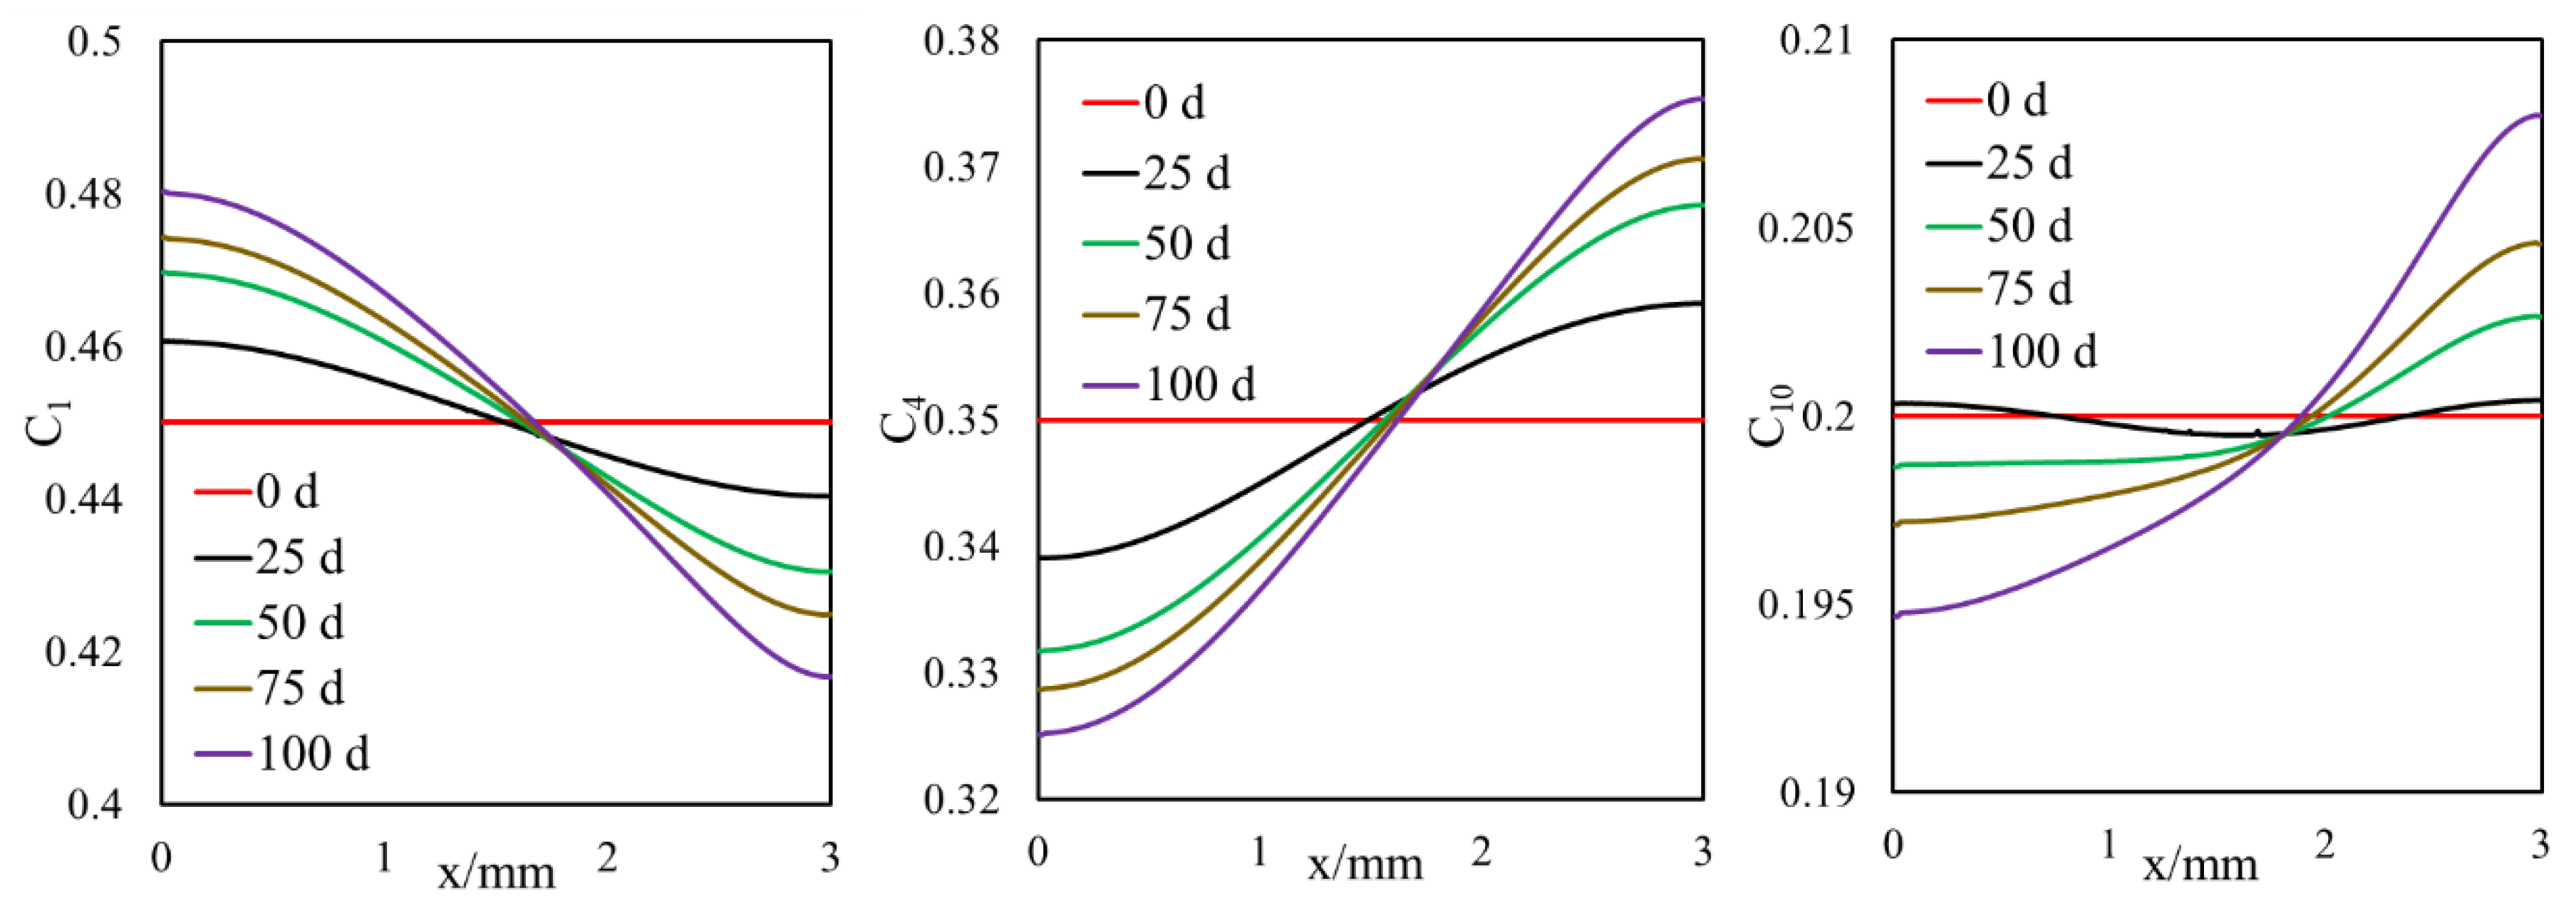
- A selective component mass transfer is observed at the matrix–fracture interface.
- Such selective matrix–fracture component mass transfer is caused by diffusion while the inclusion of capillary pressure in flow will also that.
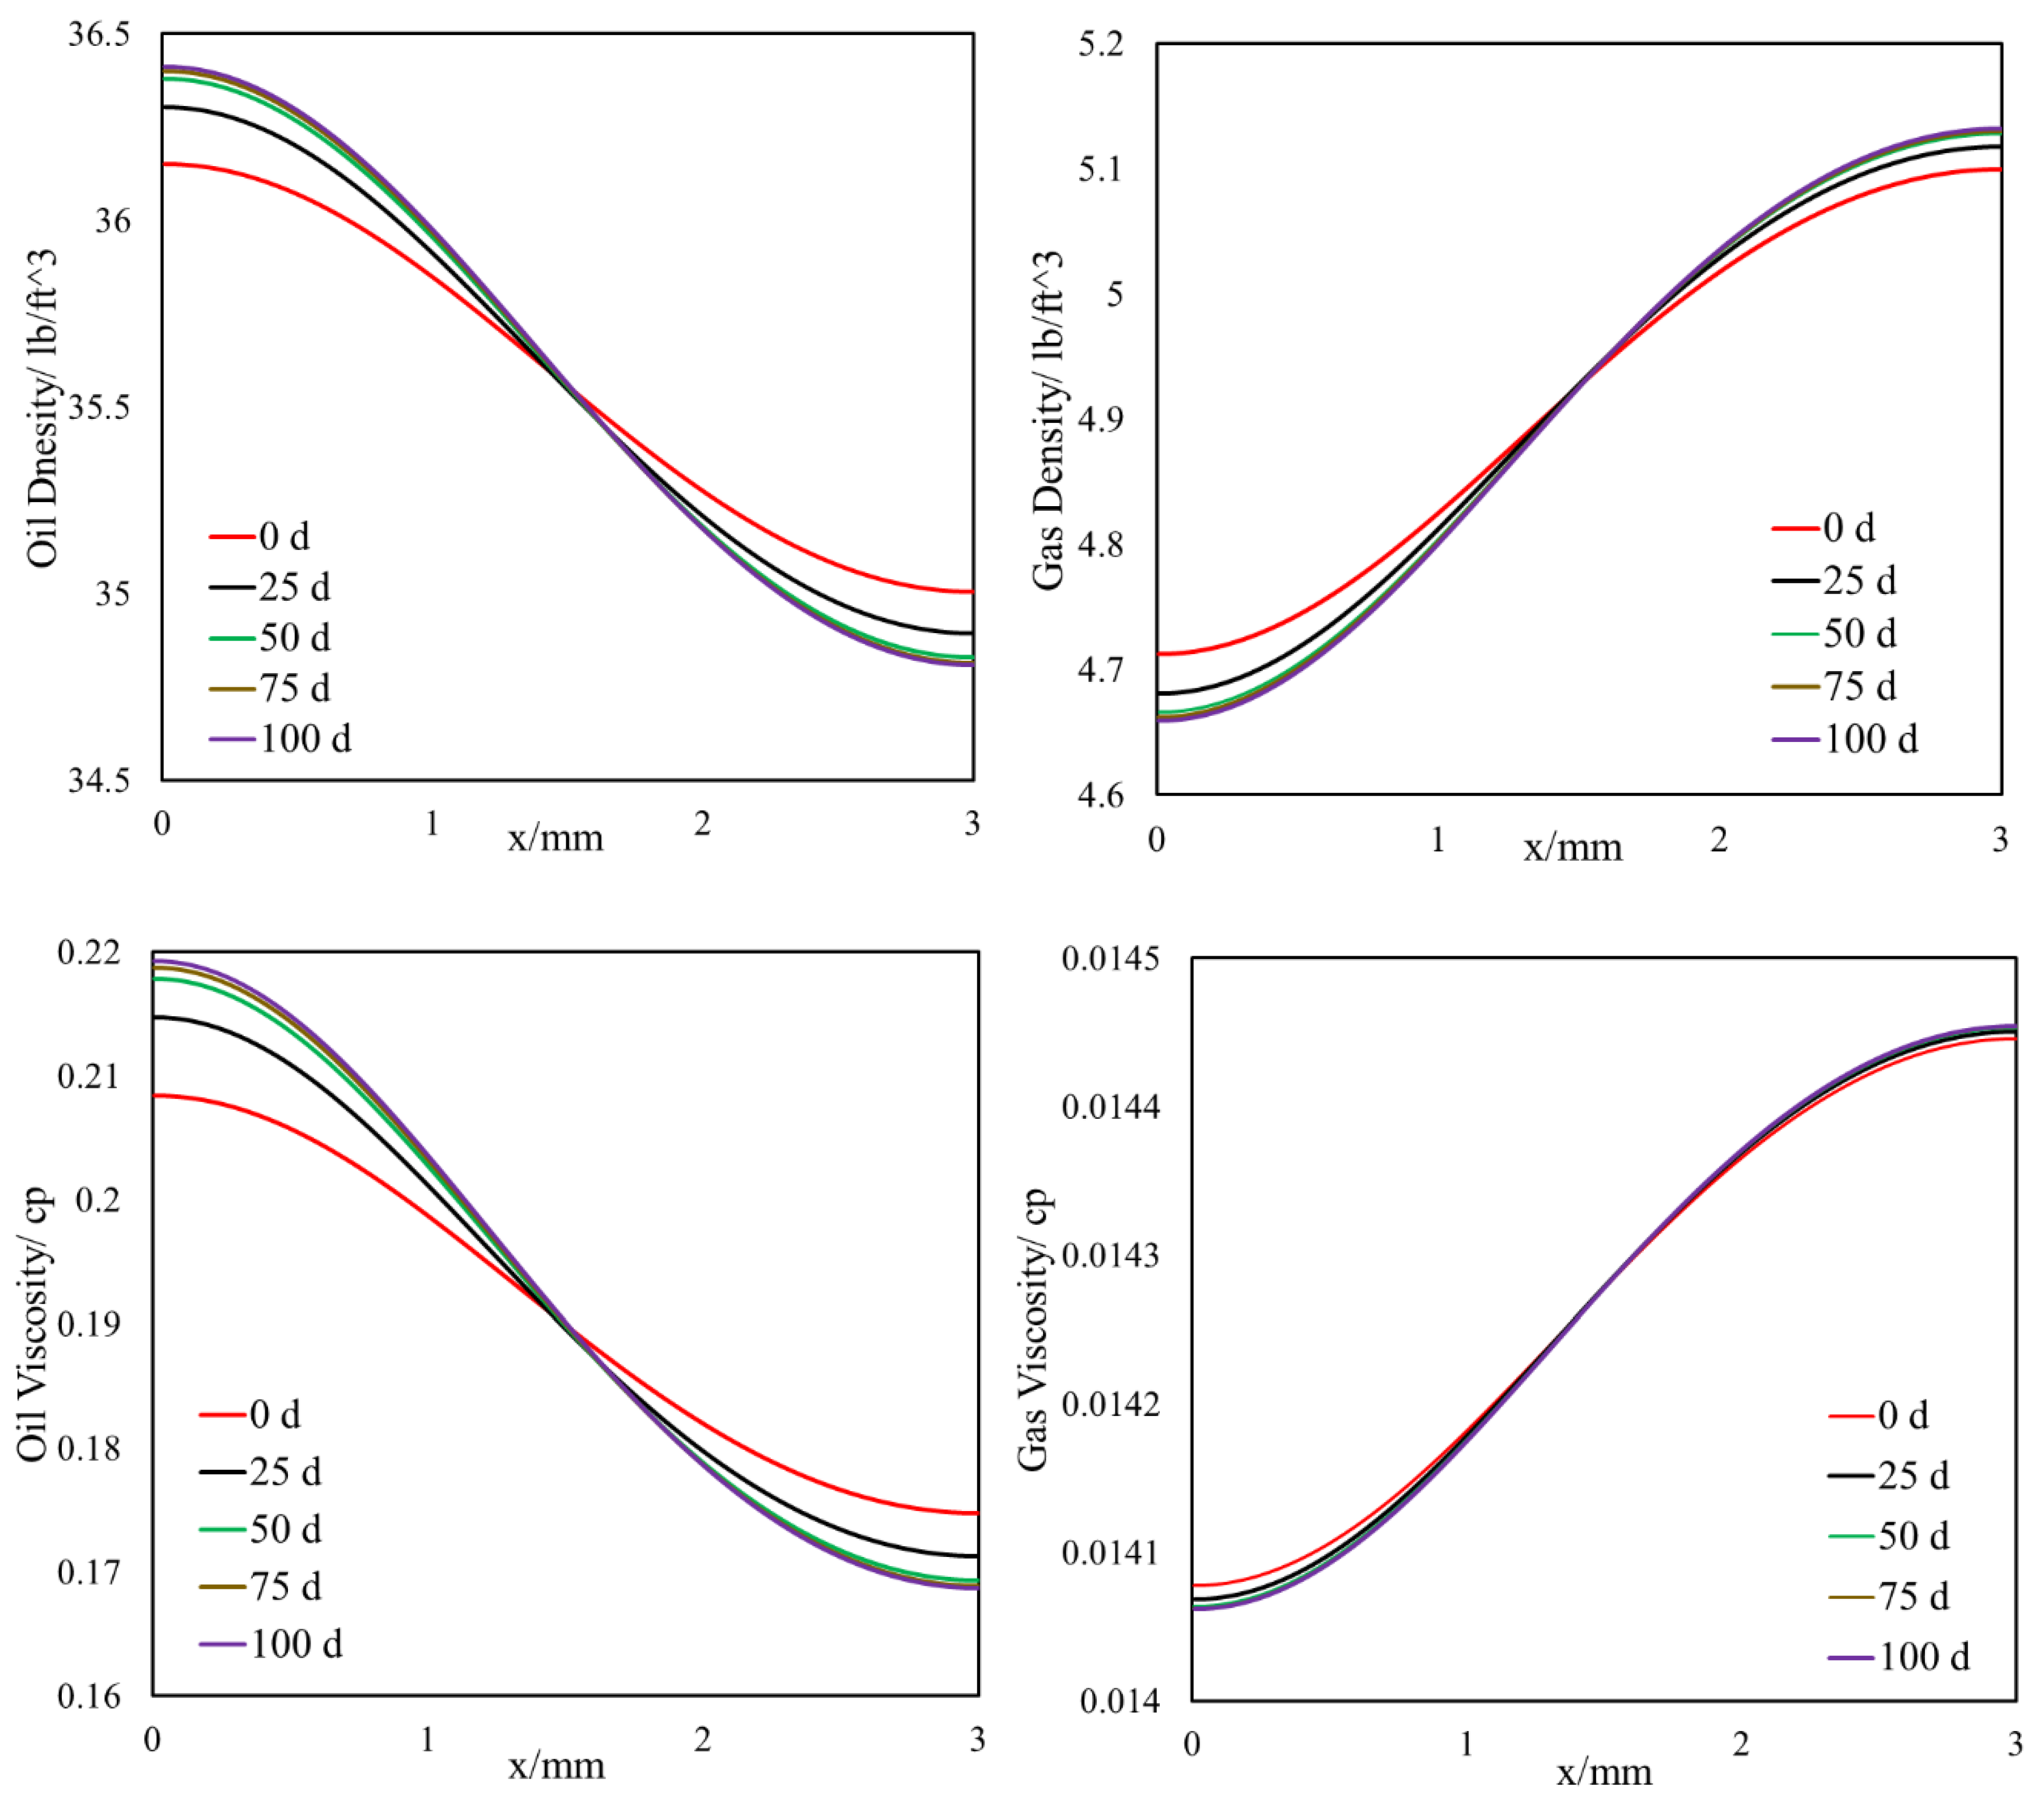
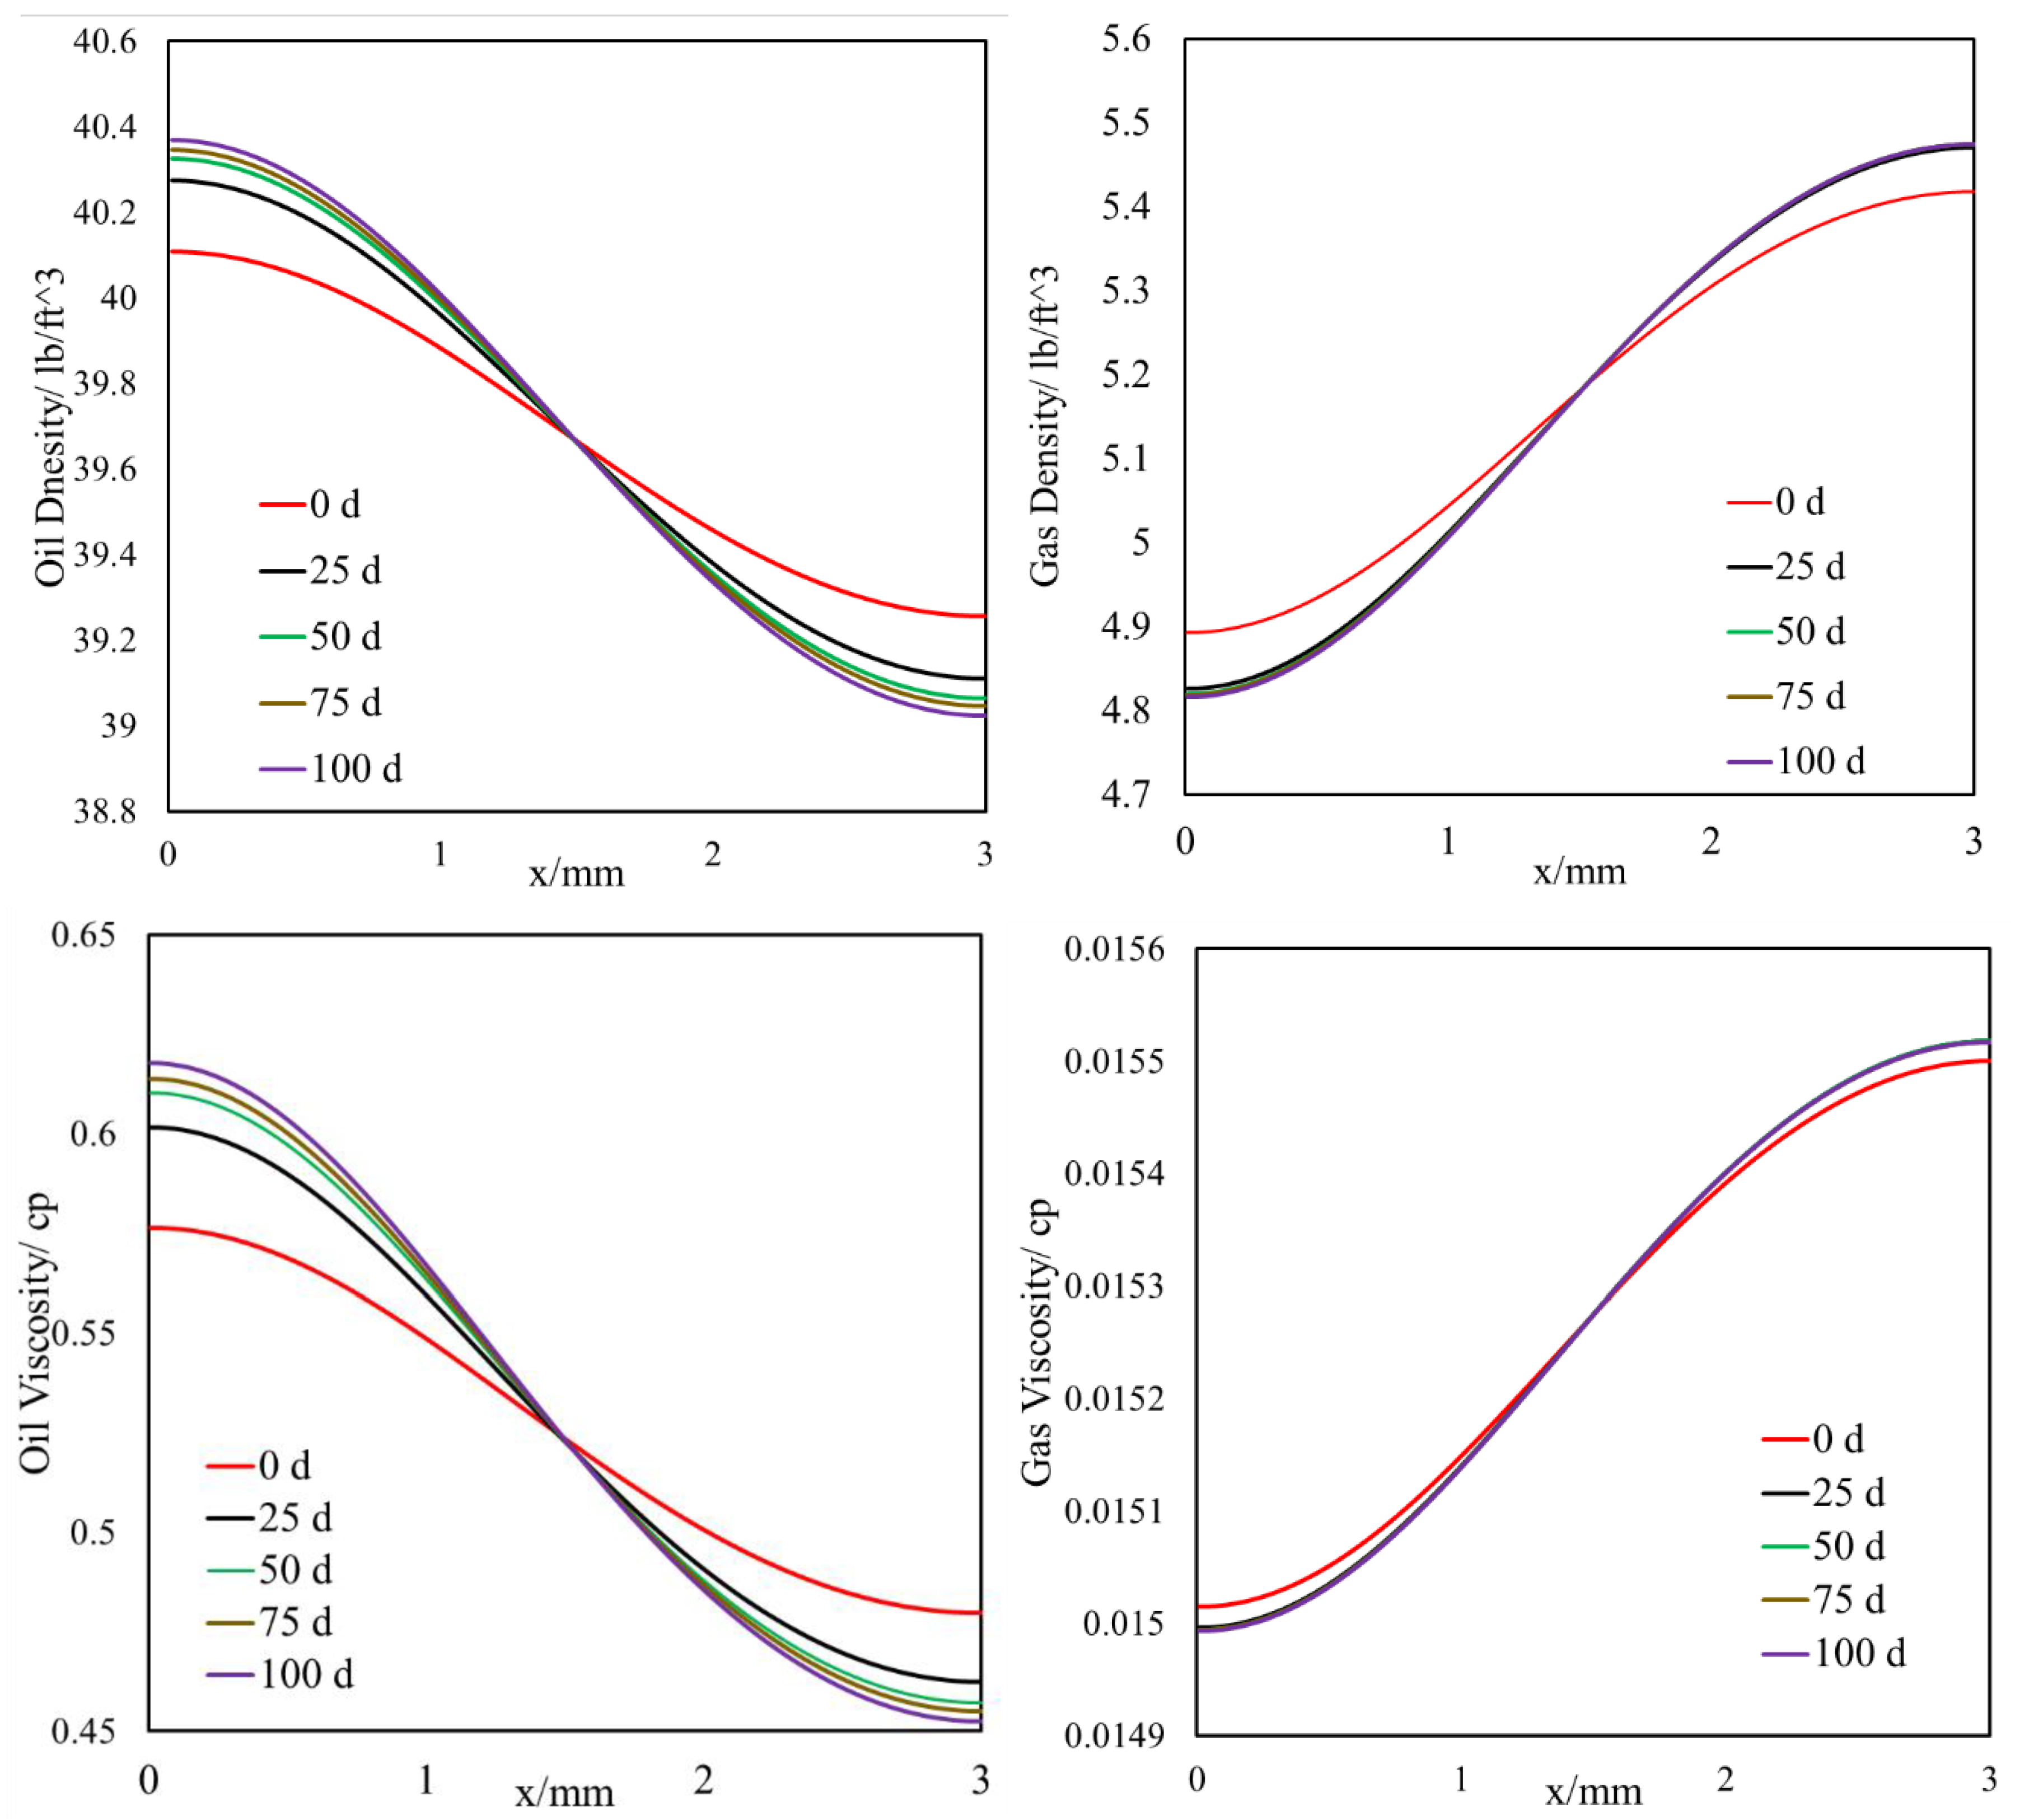
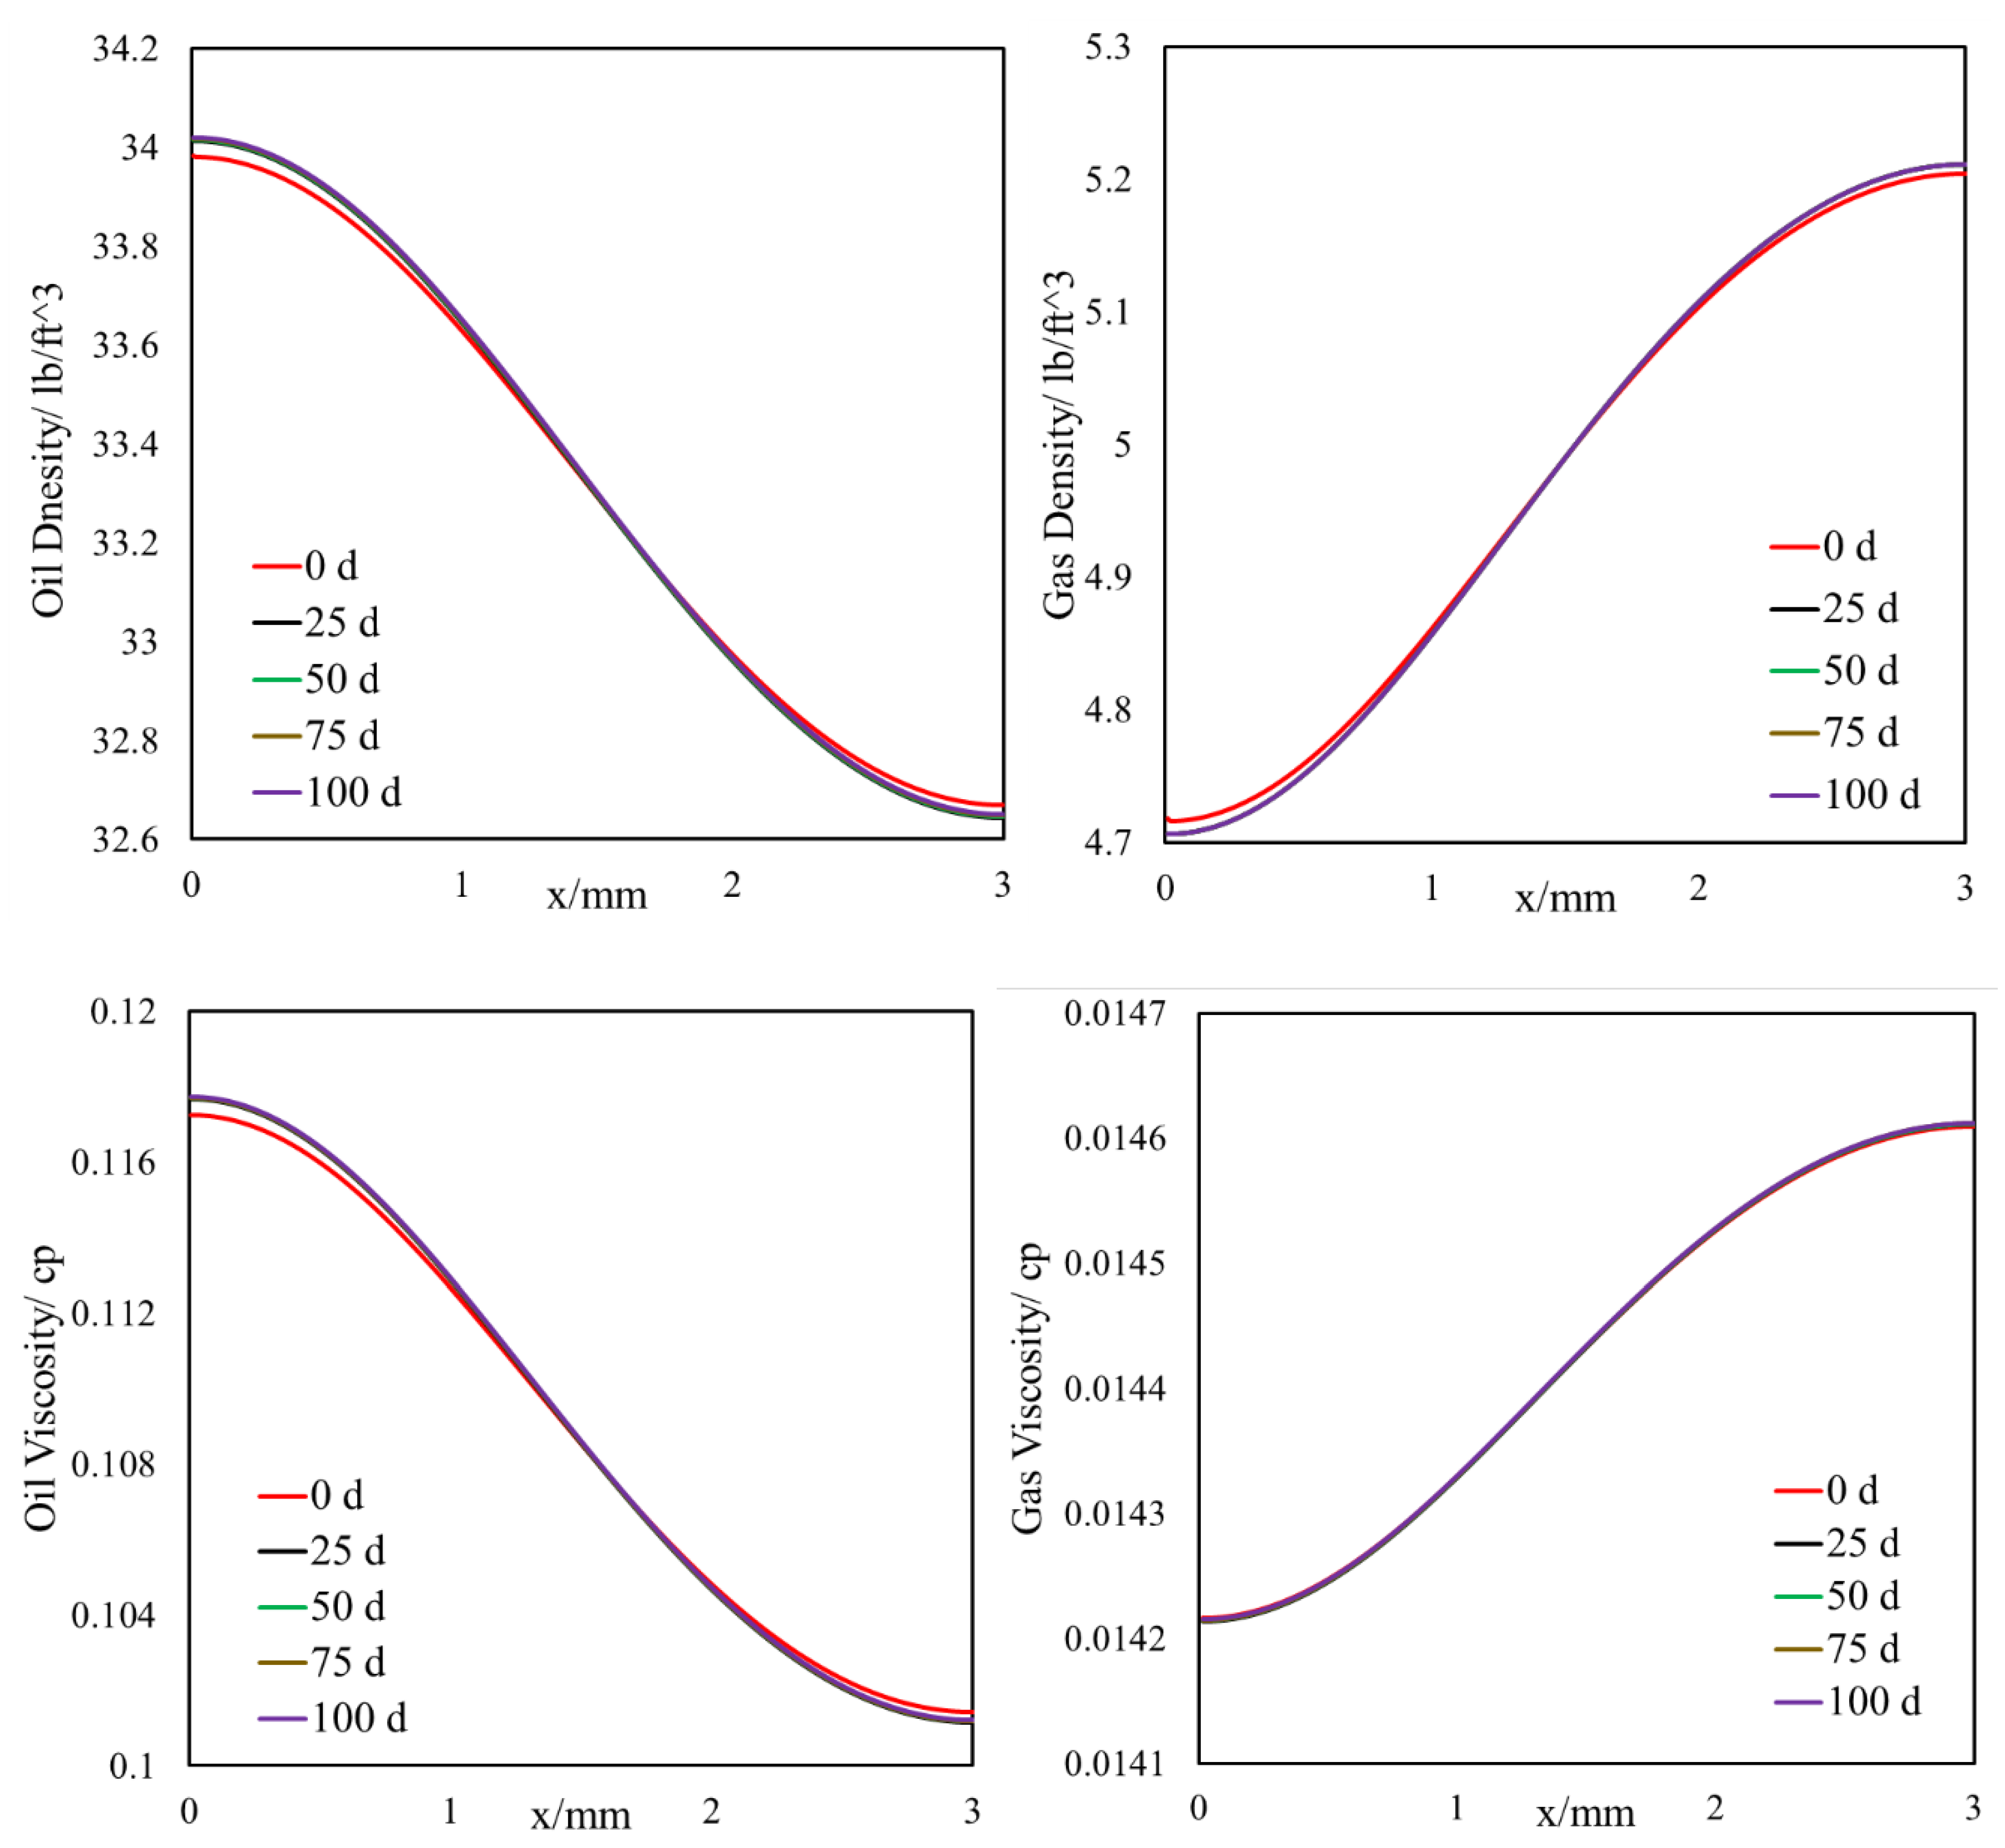
- The light components accumulate in the bulk region (or fracture) and the heavier components accumulate in the nanopore region (shale matrix). The maximum compositional change is around 10%.
- This selective component mass transfer is valid for different shale fluids and the fluid properties also deviate from original values and the maximum difference is about 5%.
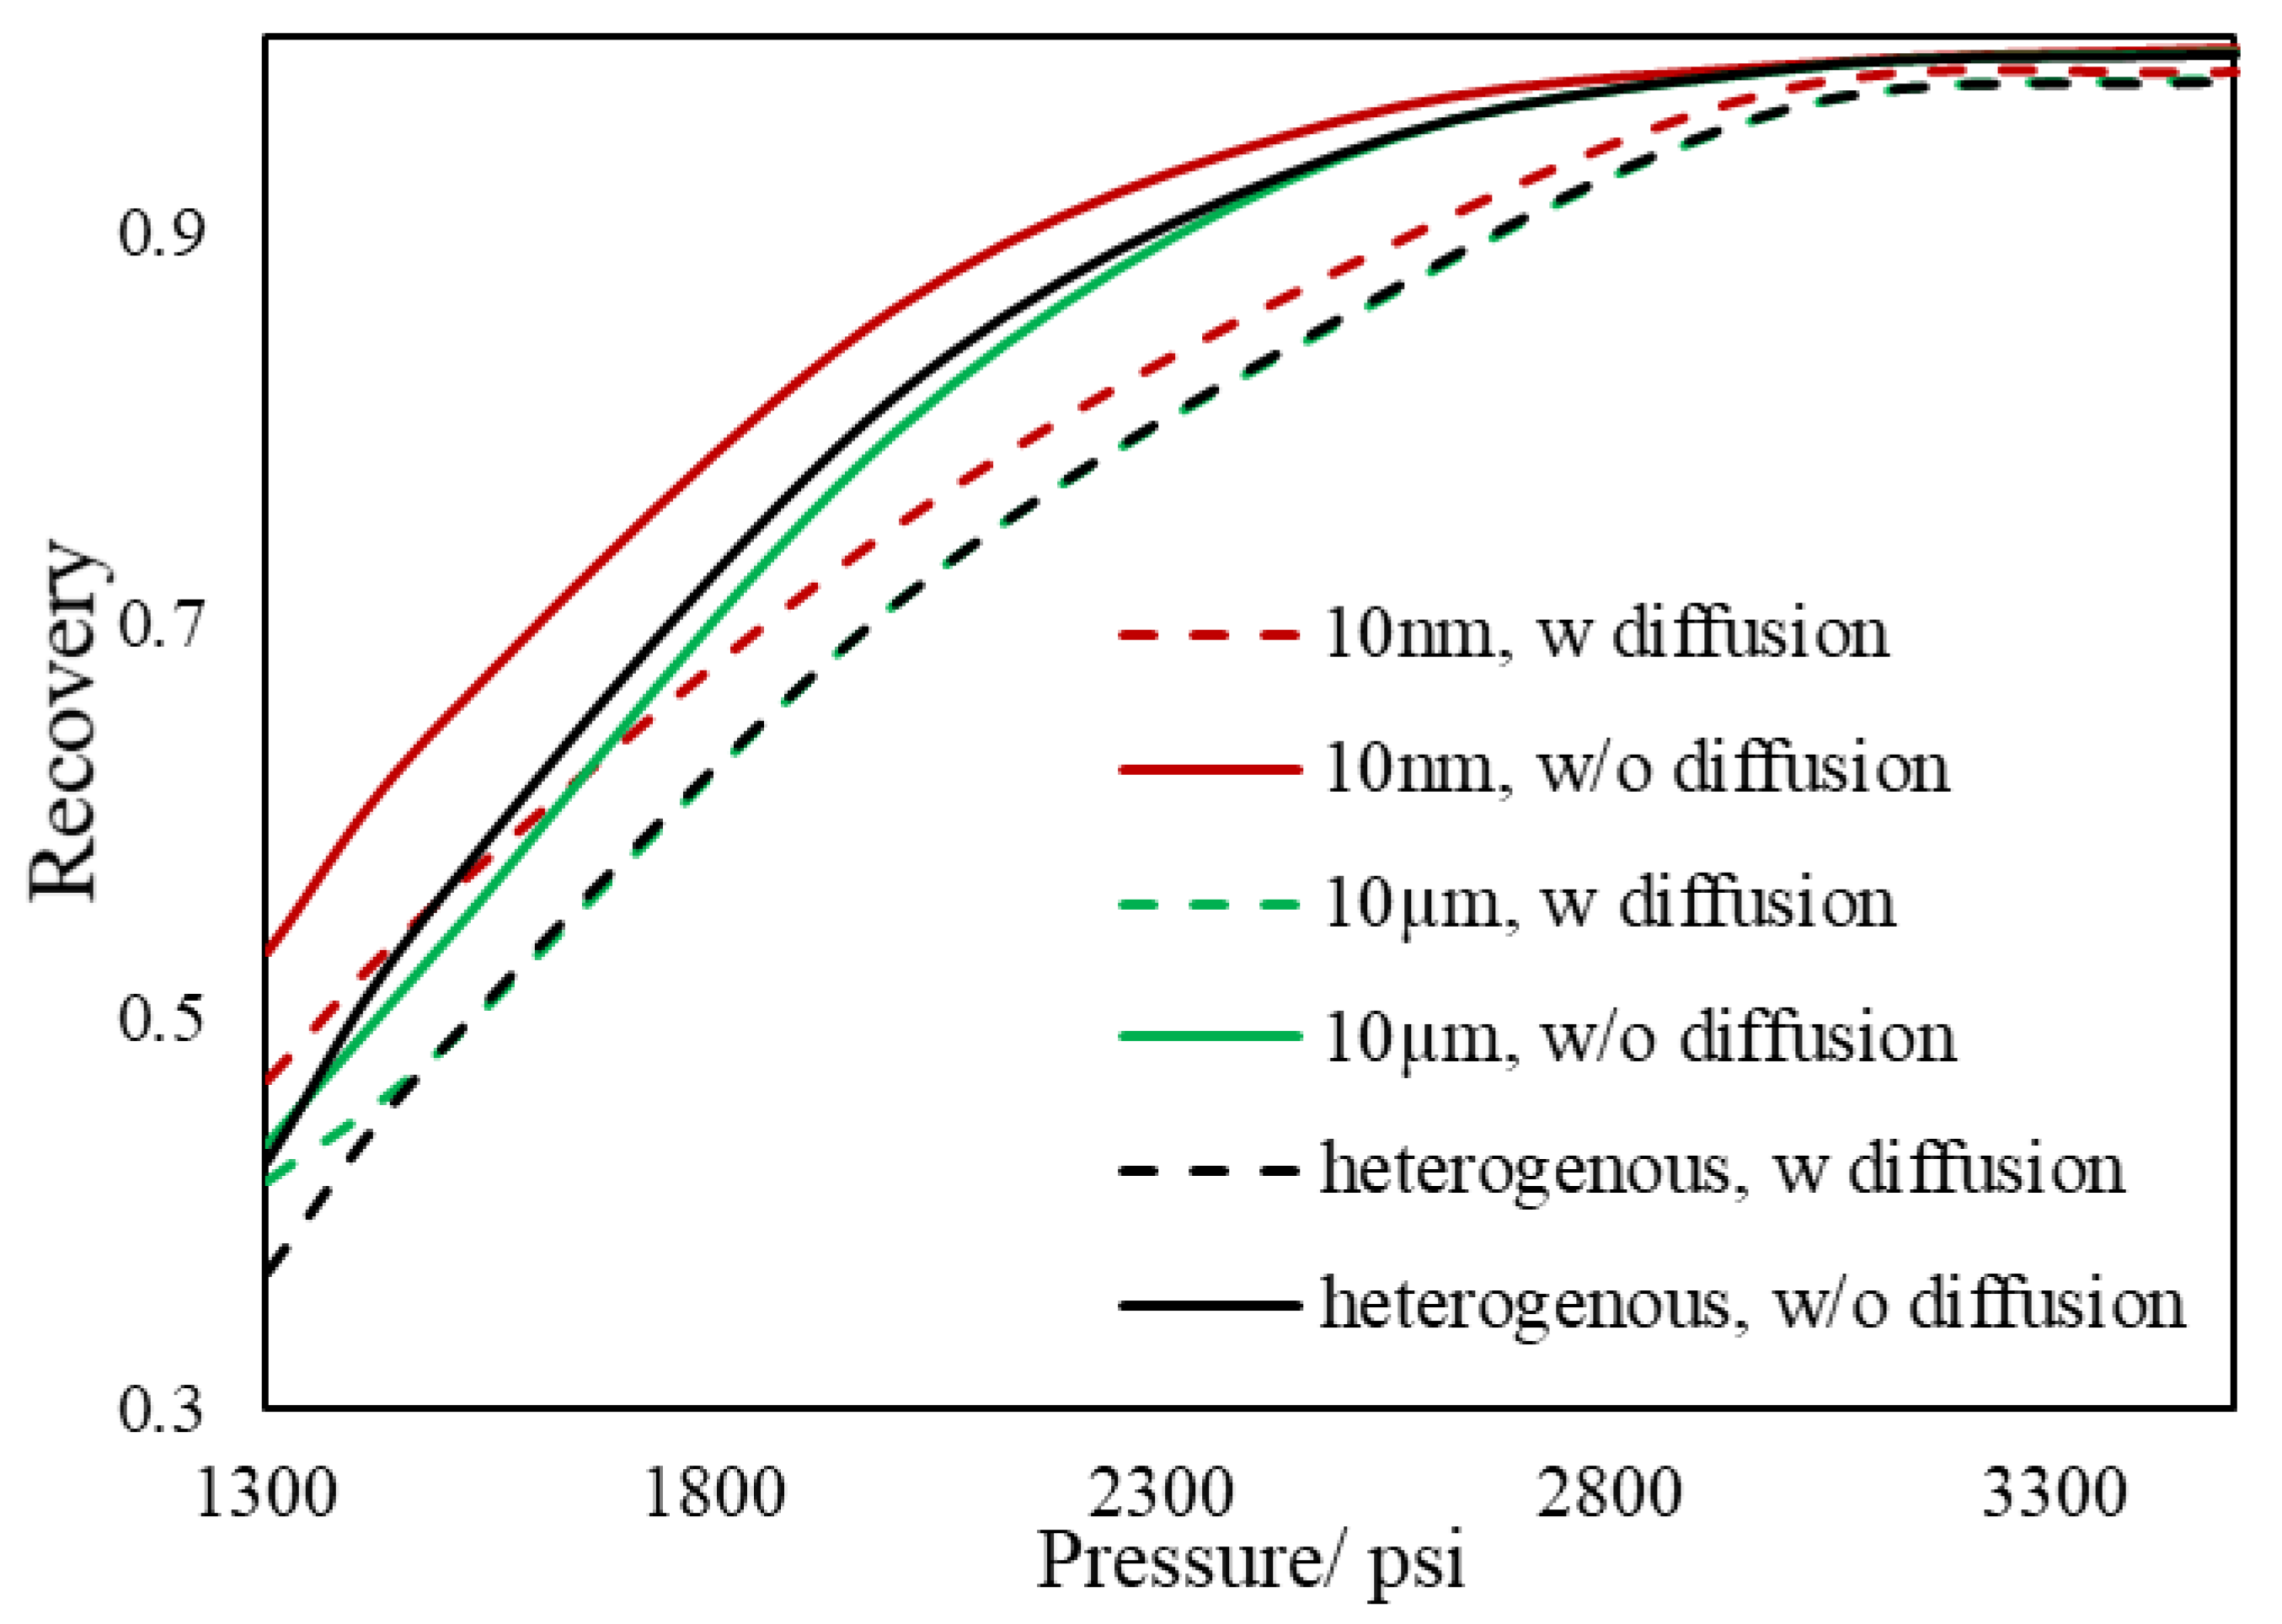
- During primary recovery, diffusion is only important for ultra-tight rocks with permeabilities smaller than 1 nd. However, for gas injection, diffusion becomes important for reservoirs with hither permeabilities.
- Based on our results, the heterogeneous pore size reservoir rarely changes the multi-contact MMP.
- The value of MCMMP increases with permeability decreasing and will get to the value of FCMMP as mass transport is advection-free and completely diffusion-dominated (permeability equals to zero).
Author Contributions
Funding
Conflicts of Interest
Nomenclature
| vapor pressure (psi) | |
| liquid pressure (psi) | |
| capillary pressure (psi) | |
| adjusting parameter for the reference pressure | |
| parachor of component (g1/4·cm3/(mol·s1/2)) | |
| flow of phase α (mol/s) | |
| Fickian diffusion flow of phase α | |
| mass fraction of component in phase | |
| mass density of phase (g/cm3) | |
| saturation of phase | |
| diffusion coefficient of component in phase (cm2/s) | |
| binary diffusion coefficient between component and (cm2/s) | |
| molar density of phase (mol/cm3) | |
| reduced molar density of phase | |
| molar weight of component (g/mol) | |
| collision diameter | |
| collision integral of the Lennard-Jones potential | |
| critical volume of component (cm3/mol) | |
| acentric factor of component | |
| critical pressure of component (atm) | |
| critical temperature of component (K) | |
| characteristic Lennard-Jones energy (ergs) | |
| Boltzmann’s constant (=1.3805 × −16 ergs/K) |
References
- Boyer, C.; Kieschnick, J.; Lewis, R.E.; Water, G. Producing gas from its source. Oilfield Rev. 2006, 18, 36–49. [Google Scholar]
- King, G.E. Thirty Years of Gas Shale Fracturing: What have we learned? In Proceedings of the 2010 SPE Annual Technical Conference and Exhibition, Florence, Italy, 19–22 September 2010; pp. 1–50. [Google Scholar]
- Kuila, U.; Prasad, M. Understanding pore-structure and permeability in shales. In Proceedings of the 2011 SPE Annual Technical Conference and Exhibition, Denver, CO, USA, 19–22 September 2011; pp. 1–13. [Google Scholar]
- Shapiro, A.A.; Potsch, K.; Kristensen, J.G.; Stenby, E.H. Effect of low permeable porous media on behavior of gas condensates. In Proceedings of the 2000 SPE European Petroleum Conference, Paris, France, 24–25 October 2000; pp. 1–8. [Google Scholar]
- Nojabaei, B.; Johns, R.T.; Chu, L. Effect of Capillary Pressure on Phase Behavior in Tight Rocks and Shales. SPEREE 2013, 16, 281–289. [Google Scholar] [CrossRef]
- Tan, S.P.; Piri, M. Equation-of-state modeling of confined-fluid phase equilibria in nanopores. Fluid Phase Equilibria 2015, 393, 48–63. [Google Scholar] [CrossRef]
- Brusilovsky, A.I. Mathematical simulation of phase behavior of natural multicomponent systems at high pressures with an equation of state. SPE Reserv. Eng. 1992, 7, 117–122. [Google Scholar] [CrossRef]
- Zarragoicoechea, G.; Kuz, V.A. Critical shift of a confined fluid in a nanopore. Fluid Phase Equilib. 2004, 220, 7–9. [Google Scholar] [CrossRef]
- Singh, S.K.; Sinha, A.; Deo, G.; Singh, J.K. Vapor-Liquid phase coexistence, critical properties, and surface tension of confined alkanes. J. Phys. Chem. C 2009, 113, 7170–7180. [Google Scholar] [CrossRef]
- Teklu, T.W.; Alharthy, N.; Kazemi, H.; Yin, X.; Graves, R.M.; AlSumaiti, A.M. Phase behavior and minimum miscibility pressure in nanopores. Spe Reserv. Eval. Eng. 2014, 17, 396–403. [Google Scholar] [CrossRef]
- Ma, Y.; Jin, L.; Jamili, A. Modifying van der Waals equation of state to consider influence of confinement on phase behavior. In Proceedings of the 2013 SPE Annual Technical Conference and Exhibition, New Orleans, LO, USA, 30 September–2 October 2013; pp. 1–12. [Google Scholar]
- Chordia, M.; Trivedi, J.J. Diffusion in naturally fractured reservoirs- A- Review. In Proceedings of the 2010 SPE Asia Pacific Oil and Gas Conference and Exhibition, Brisbane, Queensland, Australia, 18–20 October 2010; pp. 1–32. [Google Scholar]
- Moortgat, J.; Firoozabadi, A. Fickian diffusion in discrete-fractured media from chemical potential gradients and comparison to experiment. Energy Fuels 2013, 27, 5793–5805. [Google Scholar] [CrossRef]
- Du, F.; Nojabaei, B. A Review of gas injection in shale reservoirs: Enhanced oil/gas recovery approaches and greenhouse gas control. Energies 2019, 12, 2355. [Google Scholar] [CrossRef]
- Ghorayeb, K.; Firoozabadi, A. Numerical study of natural convection and diffusion in fractured porous media. SPE J. 2000, 5, 12–20. [Google Scholar] [CrossRef]
- Darvish, G.R.; Lindeberg, E.G.B.; Holt, T.; Kleppe, J.; Utne, S.A. Reservoir Conditions Laboratory Experiments of CO2 Injection into Fractured Cores. In Proceedings of the 2006 SPE Europec/EAGE Annual Conference and Exhibition, Vienna, Austria, 12–15 June 2006; pp. 1–15. [Google Scholar]
- Hoteit, H.; Firoozabadi, A. Numerical modeling of two-phase flow in heterogeneous permeable media with different capillarity pressures. Adv. Water Resour. 2008, 31, 56–73. [Google Scholar] [CrossRef]
- Simonnin, P.; Noetinger, B.; Nieto-Draghi, C.; Marry, V.; Rotenberg, B. Diffusion under confinement: Hydrodynamic finite-size effects in simulation. J. Chem. Theory. Comput. 2017, 13, 2881–2889. [Google Scholar] [CrossRef] [PubMed]
- Sobecki, N.; Nieto-Draghi, C.; Di Lella, A.; Ding, D.Y. Phase behavior of hydrocarbons in nano-pores. Fluid Phase Equilibria 2019, 497, 104–121. [Google Scholar] [CrossRef]
- Guo, W.; Yu, R.; Zhang, X.; Hu, Z. Physical and mathematical modeling of gas production in shale matrix. Oil Gas Sci. Technol.-Rev. IFP Energies Nouv. 2018, 73, 12. [Google Scholar]
- Peng, Z.; Li, X.; Sun, Z. A relative permeability model for CBM reservoir. Oil Gas Sci. Technol.-Rev. IFP Energies Nouv. 2020, 75, 2. [Google Scholar]
- Wang, S.; Sobecki, N.; Ding, D.; Zhu, L.; Wu, Y.S. Accelerating and stabilizing the vapor-liquid equilibrium (VLE) calculation in compositional simulation of unconventional reservoirs using deep learning based flash calculation. Fuel 2019, 253, 209–219. [Google Scholar] [CrossRef]
- Ding, D.Y.; Farah, N.; Bourbiaux, B.; Wu, Y.S.; Mestiri, I. Simulation of matrix/fracture interaction in low-permeability fractured unconventional reservoirs. SPE J. 2018, 23, 1389–1411. [Google Scholar] [CrossRef]
- Elputranto, R.; Akkutlu, I.Y. Near fracture capillary end effect on shale gas and water production. In Proceedings of the 2018 SPE/AAPG/SEG Unconventional Resources Technology Conference, Houston, TX, USA, 23–25 July 2018; pp. 1–14. [Google Scholar]
- Cronin, M.; Emami-Meybodi, H.; Johns, R.T. Diffusion-dominated proxy model for solvent injection in ultratight oil reservoirs. SPE J. 2019, 24, 660–680. [Google Scholar] [CrossRef]
- Zhang, K.; Liu, Q.; Wang, S.; Feng, D.; Wu, K.; Dong, X.; Dong, X.; Chen, S.; Chen, Z. Effects of nanoscale pore confinement on CO2 displacement. In Proceedings of the 2016 SPE/AAPG/SEG Unconventional Resources Technology Conference, San Antonio, TX, USA, 1–3 August 2016; pp. 1–20. [Google Scholar]
- Wang, S.; Ma, M.; Chen, S. Application of PC-SAFT equation of state for CO2 minimum miscibility pressure prediction in nanopores. In Proceedings of the 2016 SPE Improved Oil Recovery Conference, Tulsa, OK, USA, 11–13 April 2016; pp. 1–17. [Google Scholar]
- Zhang, K.; Nojabaei, B.; Ahmadi, K.; Johns, R.T. Effect of gas/oil capillary pressure on minimum miscibility pressure for tight reservoirs. SPE J. 2019. Preprint. [Google Scholar] [CrossRef]
- MRST: The MATLAB Reservoir Simulation Toolbox. Available online: www.sintef.no/MRST (accessed on 16 November 2019).
- Nojabaei, B.; Siripatrachai, N.; Johns, R.T.; Ertekin, T. Effect of large gas–oil capillary pressure on production: A compositionally-extended black oil formulation. J. Pet. Sci. Eng. 2016, 147, 317–329. [Google Scholar] [CrossRef]
- Pederson, K.S.; Christensen, P.L. Phase Behavior of Petroleum Reservoir Fluids; CRC Press, Taylor & Francis Group: Boca Raton, FL, USA, 2007. [Google Scholar]
- Sigmund, P.M. Prediction of molecular diffusion at reservoir conditions. Part I‒measurement and prediction of binary dense gas diffusion coefficients. J. Can. Pet. Technol. 1976, 15, 48–57. [Google Scholar] [CrossRef]
- Sigmund, P.M. Prediction of molecular diffusion at reservoir conditions. Part II‒estimating the effects of molecular diffusion and convective mixing in multi-component systems. J. Can. Pet. Technol. 1976, 15, 53–62. [Google Scholar] [CrossRef]
- Elamin, A.; Fathi, E.; Ameri, S. Simulation of multi-component gas flow and condensation in Marcellus shale reservoir. In Proceedings of the Unconventional Resources Conference, Woodlands, TX, USA, 10–12 April 2013; pp. 1–14. [Google Scholar]


| Cell Numbers | 400 × 10 |
| Size of the system/m | 0.003 × 10 |
| Initial pressure/psia | 1200 |
| Pore size/nm | As shown in Figure 3 |
| Porosity | 0.06 |
| Permeability/nd | 0.1 |
| Component | Critical Pressure (psia) | Critical Temperature (R) | Acentric Factor | Molecular Weight (lbm/lb mol) | Parachor |
|---|---|---|---|---|---|
| C1 | 667.2 | 343.08 | 0.008 | 16.043 | 74.8 |
| C4 | 551.1 | 765.36 | 0.193 | 58.124 | 189.6 |
| C10 | 353.76 | 1070.831 | 0.5764 | 134 | 372.86 |
| Component | C1 | C4 | C10 |
|---|---|---|---|
| C1 | 0 | 0.119 | 0.008 |
| C4 | 0.119 | 0 | 0.0847 |
| C10 | 0.008 | 0.0847 | 0 |
| Cell Numbers | 50 × 1 |
| Size of the system/m | 50 × 1 |
| Initial pressure/psia | 1300/1500/2000/2500/3000/3500 psi |
| Pore size/nm | 10 µm/heterogeneous (Figure 3) |
| Porosity | 0.06 |
| Permeability | 10 µd/1 µd/100 nd |
| Wells position (Injection/production) | Left end/Right end (x = 0 m/x = 50 m) |
© 2020 by the authors. Licensee MDPI, Basel, Switzerland. This article is an open access article distributed under the terms and conditions of the Creative Commons Attribution (CC BY) license (http://creativecommons.org/licenses/by/4.0/).
Share and Cite
Zhang, K.; Du, F.; Nojabaei, B. Effect of Pore Size Heterogeneity on Hydrocarbon Fluid Distribution, Transport, and Primary and Secondary Recovery in Nano-Porous Media. Energies 2020, 13, 1680. https://doi.org/10.3390/en13071680
Zhang K, Du F, Nojabaei B. Effect of Pore Size Heterogeneity on Hydrocarbon Fluid Distribution, Transport, and Primary and Secondary Recovery in Nano-Porous Media. Energies. 2020; 13(7):1680. https://doi.org/10.3390/en13071680
Chicago/Turabian StyleZhang, Kaiyi, Fengshuang Du, and Bahareh Nojabaei. 2020. "Effect of Pore Size Heterogeneity on Hydrocarbon Fluid Distribution, Transport, and Primary and Secondary Recovery in Nano-Porous Media" Energies 13, no. 7: 1680. https://doi.org/10.3390/en13071680
APA StyleZhang, K., Du, F., & Nojabaei, B. (2020). Effect of Pore Size Heterogeneity on Hydrocarbon Fluid Distribution, Transport, and Primary and Secondary Recovery in Nano-Porous Media. Energies, 13(7), 1680. https://doi.org/10.3390/en13071680