Article

Optimization and Assessment of the Protective Shed of the Eastern Wu Tomb

1
School of Architecture, Southeast University, Nanjing 210096, China
2
Key Laboratory of Urban and Architectural Heritage Conservation of Ministry of Education (Southeast University), Nanjing 210096, China
*
Author to whom correspondence should be addressed.
Energies 2020, 13(7), 1652; https://doi.org/10.3390/en13071652
Submission received: 2 March 2020 / Revised: 25 March 2020 / Accepted: 27 March 2020 / Published: 2 April 2020
(This article belongs to the Special Issue Recent Developments in Building Physics)

Abstract

:
The Eastern Wu tomb in Shangfang Town, Nanjing City is a brick tomb of the Six Dynasties in China, which is very famous for its big scale and complex structure. After being excavated, biodeterioration occurred on the interior wall of the tomb chambers due to the fluctuation of environmental factors, which threatens the cultural value of this architectural heritage. Biodeterioration is highly related to the mild temperature and the high humidity in the tomb chamber and condensation on the wall surface. To reduce biodeterioration in the Eastern Wu tomb, environment monitoring was carried out and the effect of the current protective shed on the Eastern Wu tomb was examined. The hygrothermal transfer model of the protective shed was developed to evaluate the effects of the optimization of the protective shed for reducing the condensation on the wall surface. The results show that condensation on the wall surface of the site was reduced by 53% in a year after the functional space utilizing solar energy was added to the protective shed.

1. Introduction

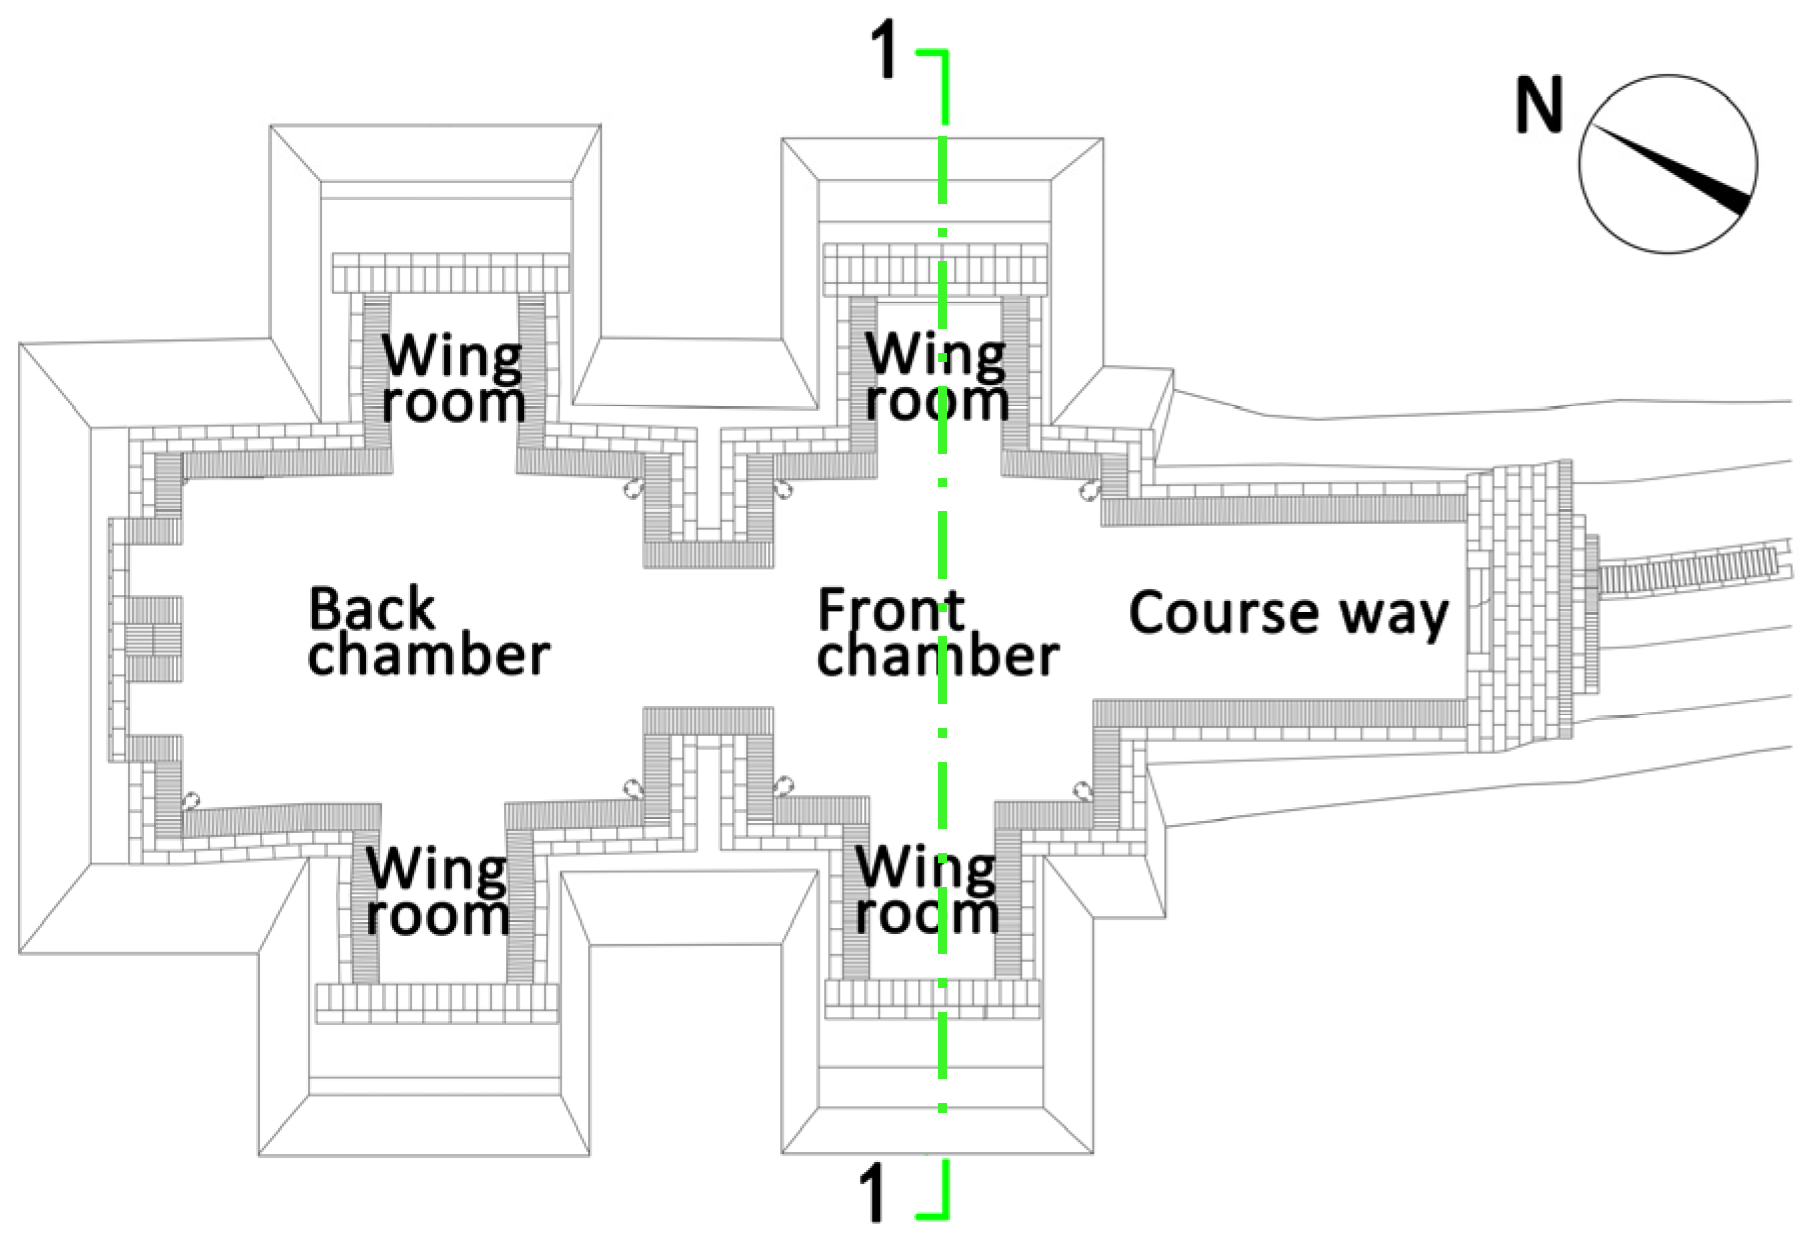
The Eastern Wu tomb is located in Shangfang town, Nanjing city, China and was discovered in December 2005. The identity of the tomb owner is unknown, but it is estimated to be an emperor or a king [1]. The ancient tomb is one of the largest and most complex brick structured tombs of the Eastern Wu dynasty in China with the most large-scale porcelain unearthed [2], and has been listed as a national-level cultural relics preservation unit. The tomb is surrounded by mountains and is now under a protective shed built in May 2007. The protective shed is enclosed by 0.24 m-thick brick walls made of brick and slope roof made of corrugated steel sheets. Figure 1 and Figure 2 show the indoor scene of the protective shed and the plan of the Eastern Wu tomb, respectively. Immediately after the protective shed construction was finished in 2007, a lot of mold-like microbial species grew on the walls of both the front and back tomb chambers. As shown in Figure 3a, the mold mainly grows in the lower part of the wall surface near the ground. Under microbiological activities, the brick is under destruction and the pattern on the brick surface is obviously blurred or disappeared as Figure 3b shows.
Microorganism colonization can cause biodeterioration to porous building materials, and bring intertwined damage aesthetically, physically and chemically to architectural heritage. Colonization and growth of microorganisms induce the surface discoloration and deterioration of architectural heritages [3,4,5]. Even when the microorganisms are not alive, the contamination they leave is still difficult to remove. Because architectural heritages are composed of porous materials, such as soil, mortar, plaster, brick and so on, mycelium penetrates into the micro pores of materials easily [6,7] and brings damage physically. The metabolites of microorganisms can dissolve building materials [8,9], which brings damage chemically. Besides, chemical and physical weathering always interacts with biological weathering [10,11]. Biodeterioration has long-term and continuous influences on the aesthetic and historic value of architectural heritages. The inhibition of mold growth is essential for the protection of architectural heritages.
The microbial spores exist ubiquitously in the environment [12]. The surface of architectural heritages are rough with numerous micro pores, which is easy for spores to deposit, be absorbed, and colonize on the surface. After that, once the ambient conditions like temperature, humidity etc. are suitable, spores will become active and microbial reproduction begins. According to previous studies, there was no mold growth after 95 days of incubation if ambient temperature was below 5 °C or above 40 °C [13]. It was pointed out [14,15,16] that the correlation curve of growth and temperature shows a shape of a mountain with a peak at about 25 °C for most common microorganisms. As for relative humidity, ambient relative humidity exceeding 75% highly accelerates the growth of microorganisms [17]. Most of the archaeological sites are connected to the ground and some are semi-underground, so the sites are usually in a relatively stable ambient temperature between 15 °C and 25 °C. In the study on the correlation between microbiological reproduction and environmental factors, French scholar Bastian F et al. [18] studied the biodeterioration in the prehistoric cave paintings in Lascaux, France. The study showed that visitors changed the original environment in the caves, leading to the outbreak of different types of mold, which affected the color and structure of the murals. Spanish scholar Saiz-Jimenez C [19,20] studied the influence of environmental factors on biodeterioration in prehistoric caves in Altamira, Spain. Clarke [21] and Rowan [22] analyzed the biodeterioration phenomenon on the surface of buildings combined with the temperature and humidity inside buildings based on the minimum temperature and humidity growth range curves of different fungi. Sedlbauer et al. [23] studied the mold propagation process under the influence of temperature, humidity and nutrients, and developed one digital prediction technology, which has been widely used to predict the degradation of materials caused by microbiological factors on the surface of architectural heritages. Li Y et al. [24] in Kyoto university Japan, carried out experiments and simulations on environmental issues related to mural degradation in Takamatsuzuka Tumulus in Japan.
Usually, Ancient tombs are easily influenced by the underground water and rising damp. Ancient tombs are directly connected with the outer ground. In an open display environment, the continuous moisture evaporation and fluctuation of temperature and humidity will occur on ancient tombs, which easily leads to local condensation on the tomb wall, and a high moisture content of materials and promotes the vigorous reproduction of mold. At present, in the field of ruins site protection, mold-proof reagents such as borax, Kathon [25,26] or microwave irradiation such as ultraviolet [27] are mainly applied to the cultural relics as methods to reduce biodeterioration. However, the mold-proof reagents are recommended to spray every year since they cannot prevent the spread of microbial spores and growth in suitable environments [25]. Moreover, the use of mold-proof reagents and ultraviolet irradiation may produce a contamination or cause secondary damages to the cultural relics. In recent years, nanomaterials are being applied to reduce biodeterioration [28] gradually. However, as a new type of material, the stability of nanocomposites needs to be enhanced [29,30]. Biological colonization of the pore materials constantly occurs on the wet surface in suitable environment where condensation intermittently appears and keeps some dust substrates with high temperature, and high humidity. Therefore, surface cleaning methods and sterilization methods are supposed to be “Cosmetic Measures” to facilitate the inhibition of mold growth. To improve the physical environment state of the site itself will have a lasting effect on inhibiting the biodeterioration.
In this study, the Eastern Wu tomb under a protective shed is taken as an example to explore a method to control biodeterioration based on passive (assisted by fan operation) environmental regulation. This paper aims to analyze and assess the inhibition effect of biodeterioration by optimizing the protective shed design through environmental measurement and numerical simulation. First, we developed a hygrothermal transfer model, and validated it by using the monitored data. Next, the protective shed was optimized (attached by a functional space utilizing the solar radiation), and the simulation results of the indoor environment of the tomb before and after optimization were compared. Finally, the effect of the functional space utilizing the solar radiation on the reduction of biodeterioration was evaluated. The research results of this paper will contribute to provide theoretical reference for the design and optimization of protection facilities for ancient tombs.

2. Modeling of Eastern Wu Tomb

2.1. Hygrothermal Transfer Equations

A two-dimensional (2D) numerical simulation analysis was carried out on the heat and moisture transfer of the Eastern Wu tomb and the surrounding soil under the effect of the protective shed. The model was based on the theory of heat and moisture transfer in porous materials driven by the temperature and water chemistry potential [31,32].
The basic heat and moisture balance is given by Equations (1) and (2).
Heat:
( c ρ ) a p T t = · [ ( λ + λ T g ) T + r λ μ g μ ]
Moisture:
ρ w ψ μ μ t = · [ λ μ ( μ g n ) + λ T T ]
Here, ( c ρ ) a p is apparent heat capacity of the material [J/m3 K], λ is thermal conductivity [W/m K], T is temperature [K], μ is water chemical potential [J/kg], λ T g is moisture conductivity related to temperature gradient (gas phase) [kg/m s K], λ μ g is moisture conductivity related to water chemical potential gradient (gas phase) [kg/m s (J/kg)], r is heat of gas/liquid phase change [J/kg], ρ w is the density of liquid water [kg/m3], ψ is volumetric water content [m3/m3], λ μ is moisture conductivity related to water chemical potential gradient [kg/m s (J/kg)], λ T is moisture conductivity related to temperature gradient [kg/m s K], and g is the gravity acceleration [9.8 (m/s2)].
The relationship between water chemical potential μ and relative humidity H is as follows:
μ = R v T ln ( H )
Here, Rv is the gas constant for water vapor [Pa·m3/k mol K].

2.1.1. Boundary Condition

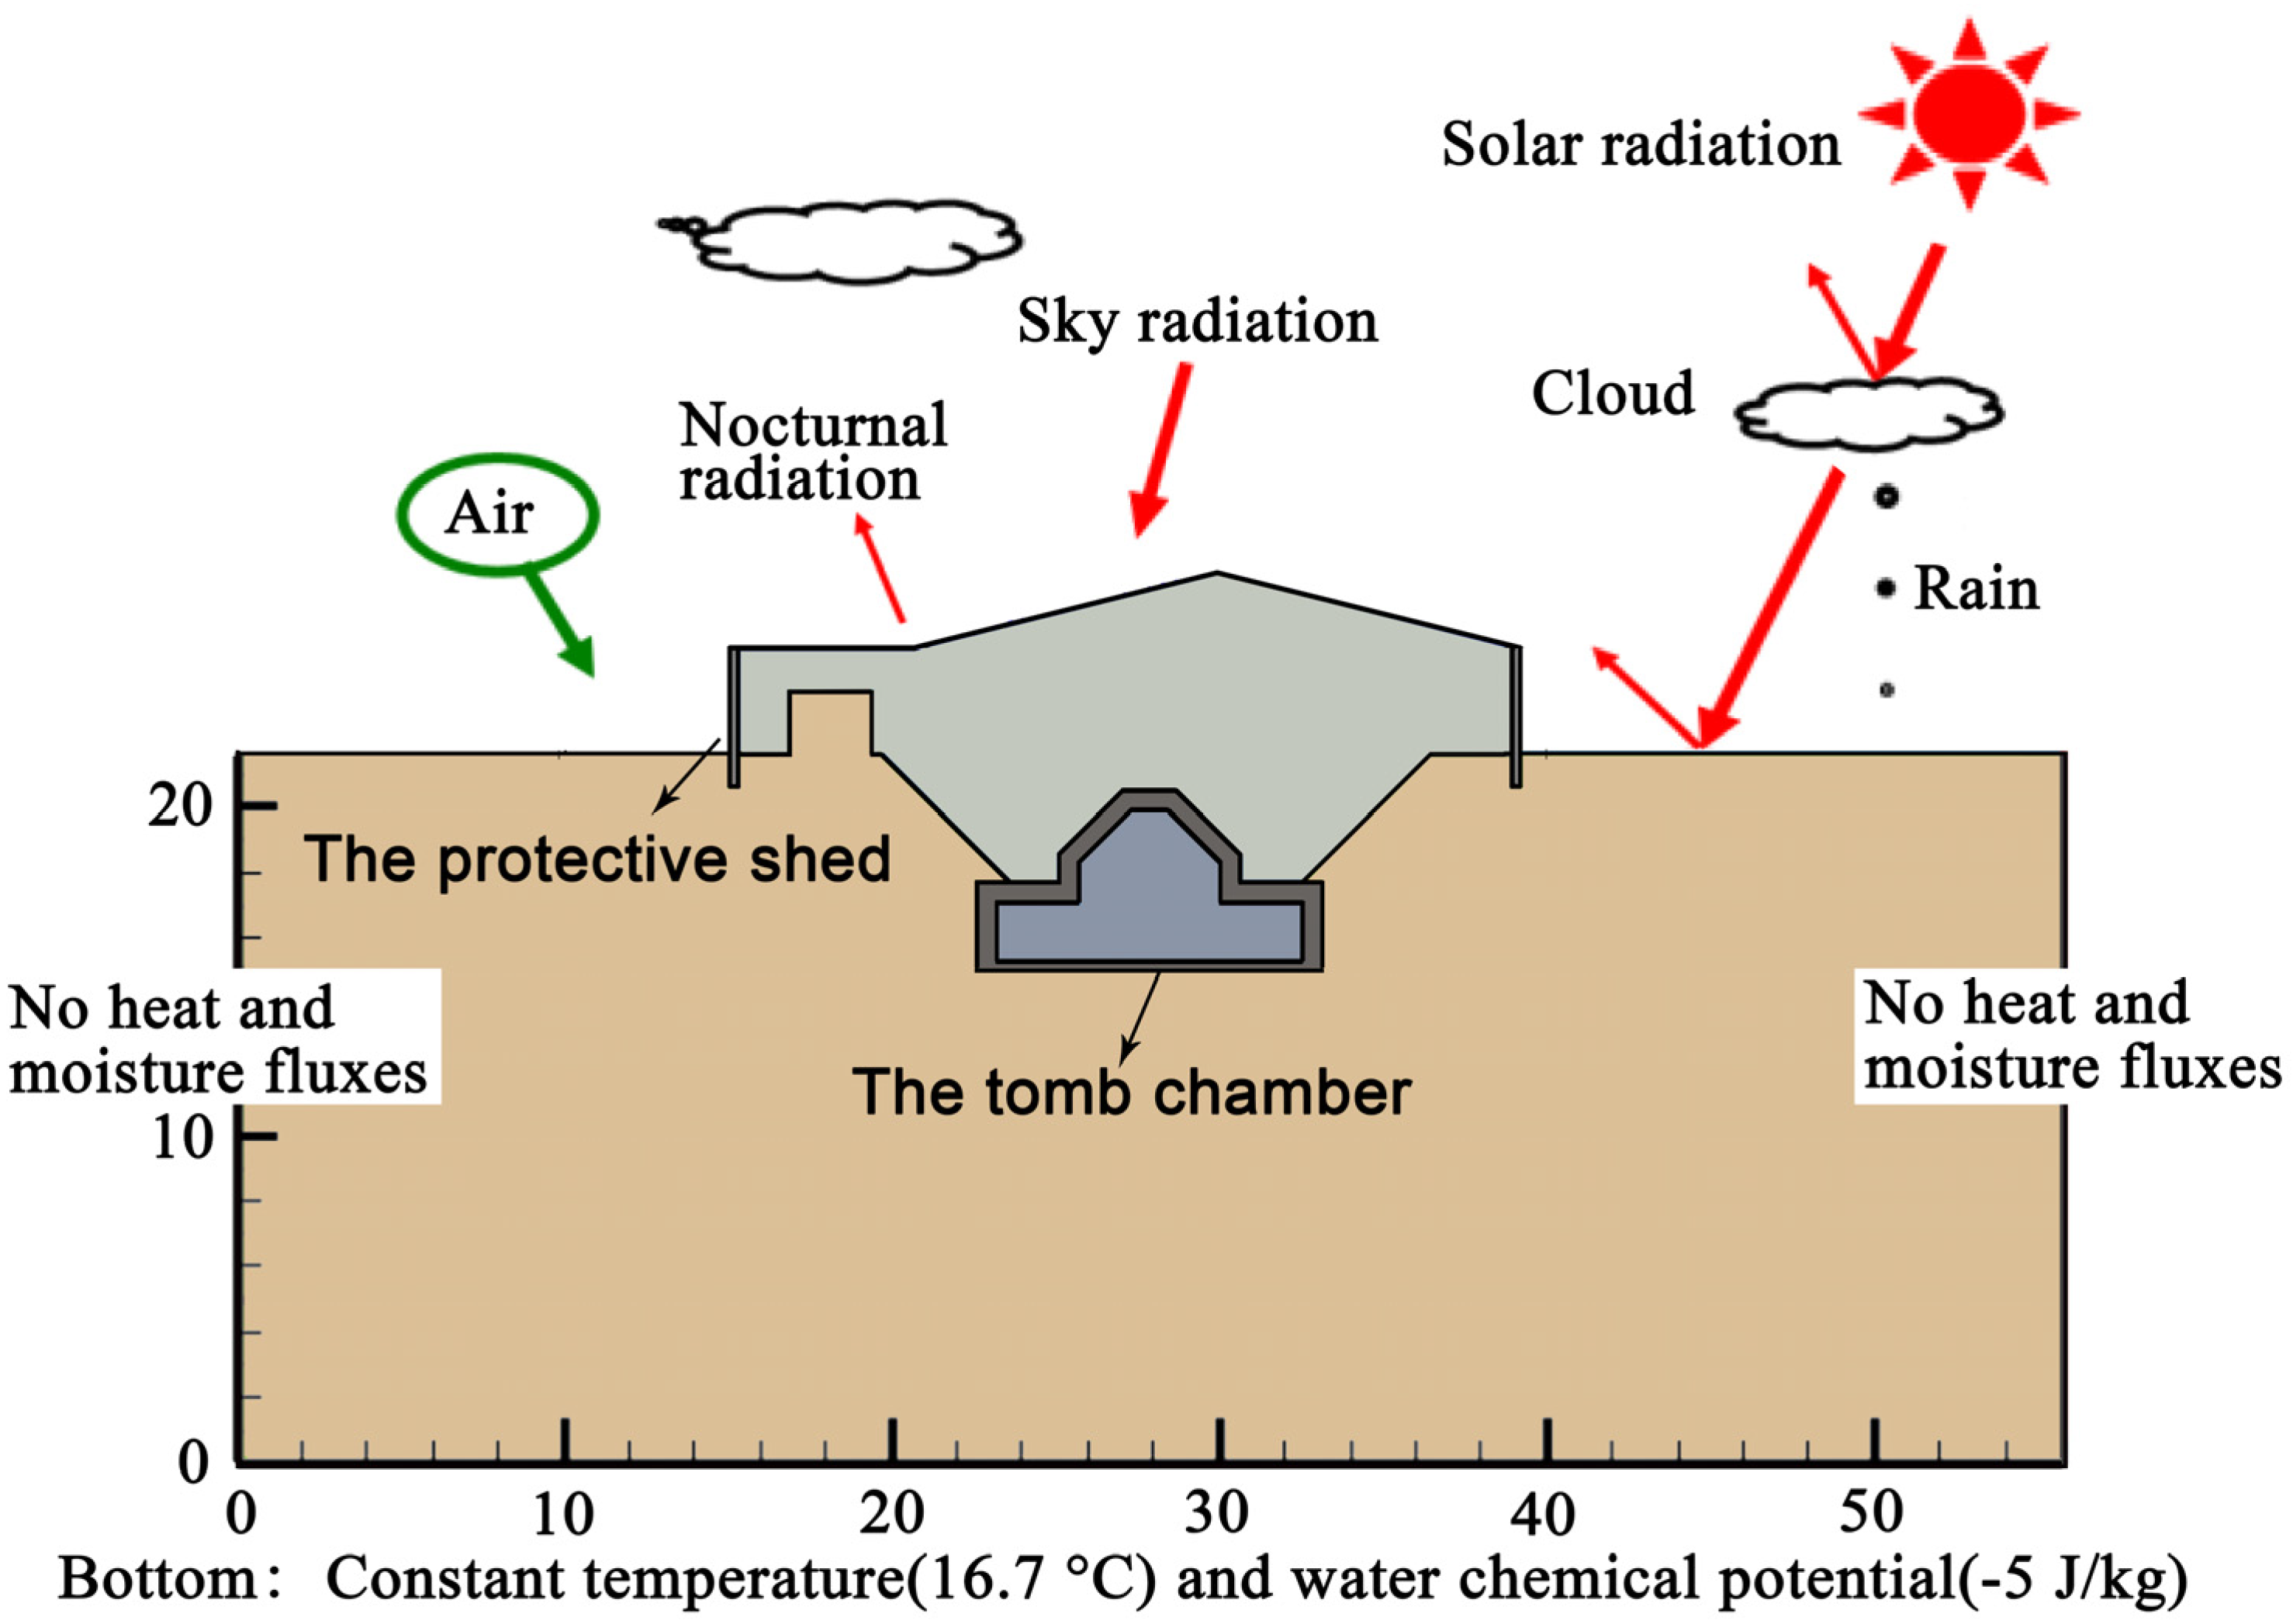
The ground surface around the protective shed is regarded as a bare area, which can receive solar radiation and rain. The equations of heat and moisture transfer at this boundary are given as follows:
Heat:
( α + r α T ) ( T o T s ) + r α μ ( μ o μ s ) + q s o l + q n o c = ( λ + r λ T g ) T n | s r λ μ g μ n | s
Moisture:
α μ ( μ o μ s ) + α T ( T o T s ) + J s = λ μ ( μ n | s g > n j ) λ T T n | s
Here, α is heat transfer coefficient [W/m2 K], αT is moisture transfer coefficient related to temperature difference [kg/m2/s K], αμ is moisture transfer coefficient related to water chemical potential difference [kg/m2/s (J/kg)], is solar radiation [W/m2], q n o c is nocturnal radiation [W/m2], and Js is rainfall [kg/m2/s]. The subscript o represents outside, s represents surface of the ground in contact with the air.
The equations of heat and moisture transfer at the boundary of the outside surface of the protective shed, and the inner surface of the tomb or the protective shed are almost the same as Equations (4) and (5) except for the solar radiation and rain. The steel roof of the protective shed is damp-proofed, thus only heat flow is considered at the boundary of the ceiling surface of the protective shed.

2.1.2. Heat and Moisture Balance in the Tomb Chamber and the Protective Shed

The heat and moisture balance equations of the air in the tomb chamber are as follows:
Heat:
c γ V r T r t = j = 1 m 1 S j α j ( T j T r ) + c γ V r N r ( T b T r )
Moisture:
c V r P r t = j = 1 m 1 S j α m j ( P j P r ) + c V r N r ( P b P r )
Here, c γ is the volumetric heat capacity of air [J/m3 K], V is air volume [m3], T is the temperature of air [K], P is water vapor pressure [Pa], S is area of the wall surface [m3], αm is moisture transfer coefficient [kg/m2/s Pa], N is the air change rate [1/s], and c is the moisture capacity of air [kg/m3 Pa]. The subscript r represents tomb chamber, b represents protective shed.
For the air in the protective shed, heat and moisture balance equations are given as follows:
Heat:
c γ V b T b t = j = 1 m 2 S b g j α j ( T b g j T b ) + j = 1 m 3 S b r j α j ( T b r j T b ) + j = 1 m 4 S b i j α j ( T b i j T b ) + c γ V b N b ( T o T b ) + c γ V r N r ( T r T b )
Moisture:
c V b P b t = j = 1 m 2 S b g j α m j ( P b g j P b ) + j = 1 m 3 S b r j α m j ( P b r j P b ) + j = 1 m 4 S b i j α m j ( P b i j P b ) + c V b N b ( P o P b ) + c V r N r ( P r P b )
Here, superscript bg represents ground surface in contact with the air in the protective shed, br represents tomb surface in contact with the air in the protective shed, bi represents inside surface of the protective shed.

2.2. Monitoring of Meteorological Conditions and Indoor Environment

The climatic data around the Eastern Wu tomb were monitored from July 20th, 2015 to June 20th, 2017. The monitoring mainly consisted of three parts: meteorological parameters (temperature, relative humidity, solar radiation, wind speed, and wind direction); the indoor environment of the protective shed and the tomb chamber (temperature and relative humidity); and the height of the underground water level (Figure 4).
The equipment used in the monitoring were automatic weather station (HOBO U30-NRC, Onset company, Bourne, MA, USA), and temperature and relative humidity recorder (RTR-53A, T&D company, Nagano, Japan). The weather station monitored air temperature, relative humidity, wind direction, wind speed, atmospheric pressure, precipitation, solar radiation, and water content of soil.

2.3. Material Used in the Model

The brick chamber of the Eastern Wu tomb is 4.2 m wide, 4.4 m deep, and 4.8 m high; the two wing rooms are both 1.7 m wide, 2.5 m deep, and 1.9 m high. The tomb is surrounded by plain fill and silty clay (Figure 4). The plain fill is composed of silty soil and clay with few impurities, formed by manual disturbance and handling of landfills. The equilibrium water content and the thermal conductivity of the soil surrounding the tomb chamber were measured, and the moisture conductivities were estimated from the measured equilibrium water content and particle size distribution, according to the Arya–Paris model [33]. The brick wall of the tomb is about 0.6 m thick. The equilibrium water content, thermal conductivity, and moisture conductivity of the tomb brick from the Eastern Wu tomb were derived from reference values [34].

2.4. Simulation Procedures

Simulation model and grid division: the cross-section 1-1 of the front chamber shown in Figure 2 was simulated. It was divided into 326 × 250 grid cells. Figure 5 shows the outline of the calculation region and the boundary conditions. The mesh was set dense in the area covering the tomb chamber and the protective shed. An explicit control volume method with a time step of 60 s was adopted.
Monitoring data: the outdoor temperature, relative humidity, global solar radiation, and rainfall collected by the weather station near the protective shed from 1 January to 31 December 2016 were input into the numerical model as the boundary conditions. At the bottom of the calculation region, the temperature of 16.7 °C (annual average temperature in Nanjing) and the water chemical potential of −5 J/kg (nearly moisture saturation state) were given. On the leftmost and rightmost boundaries of the calculation region, no heat and moisture fluxes were assumed.
The air exchange rate (based on the volume of the tomb front chamber) between the tomb chamber and the protective shed and air exchange rate (based on the volume of the protective shed) between the protective shed and the outside are listed in Table 1.

2.5. Model Validation

The monitored and simulated air temperatures in the tomb chamber in 2016 are compared in Figure 6a. The monitored annual temperature fluctuated between −1.4~28.9 °C (average: 16.1 °C) and the calculated value is between 0.7~30.7 °C (average: 17.0 °C). As for the relative humidity in the tomb chamber in Figure 6b, the monitored relative humidity (RH) was 89.2% ± 9.8% and the calculated value was 90.6% ± 9.4%. The trends of change and fluctuation range of the calculated temperature and relative humidity agree well with those of the monitored results, thus the proposed simulation model can be regarded as reliable. The following section discusses the hygrothermal behavior in the underground tomb chamber predicted by this simulation model.

3. Optimization of Protective Shed Design with a Functional Space

Biodeterioration is highly related to the mild temperature and high humidity in the tomb chamber and the condensation on the wall surface [35]. The main reason for the occurrence of condensation is that the hot and wet outdoor air meets a cold wall. Thus, increasing the wall temperature or reducing the air absolute humidity is an effective measure to reduce condensation.
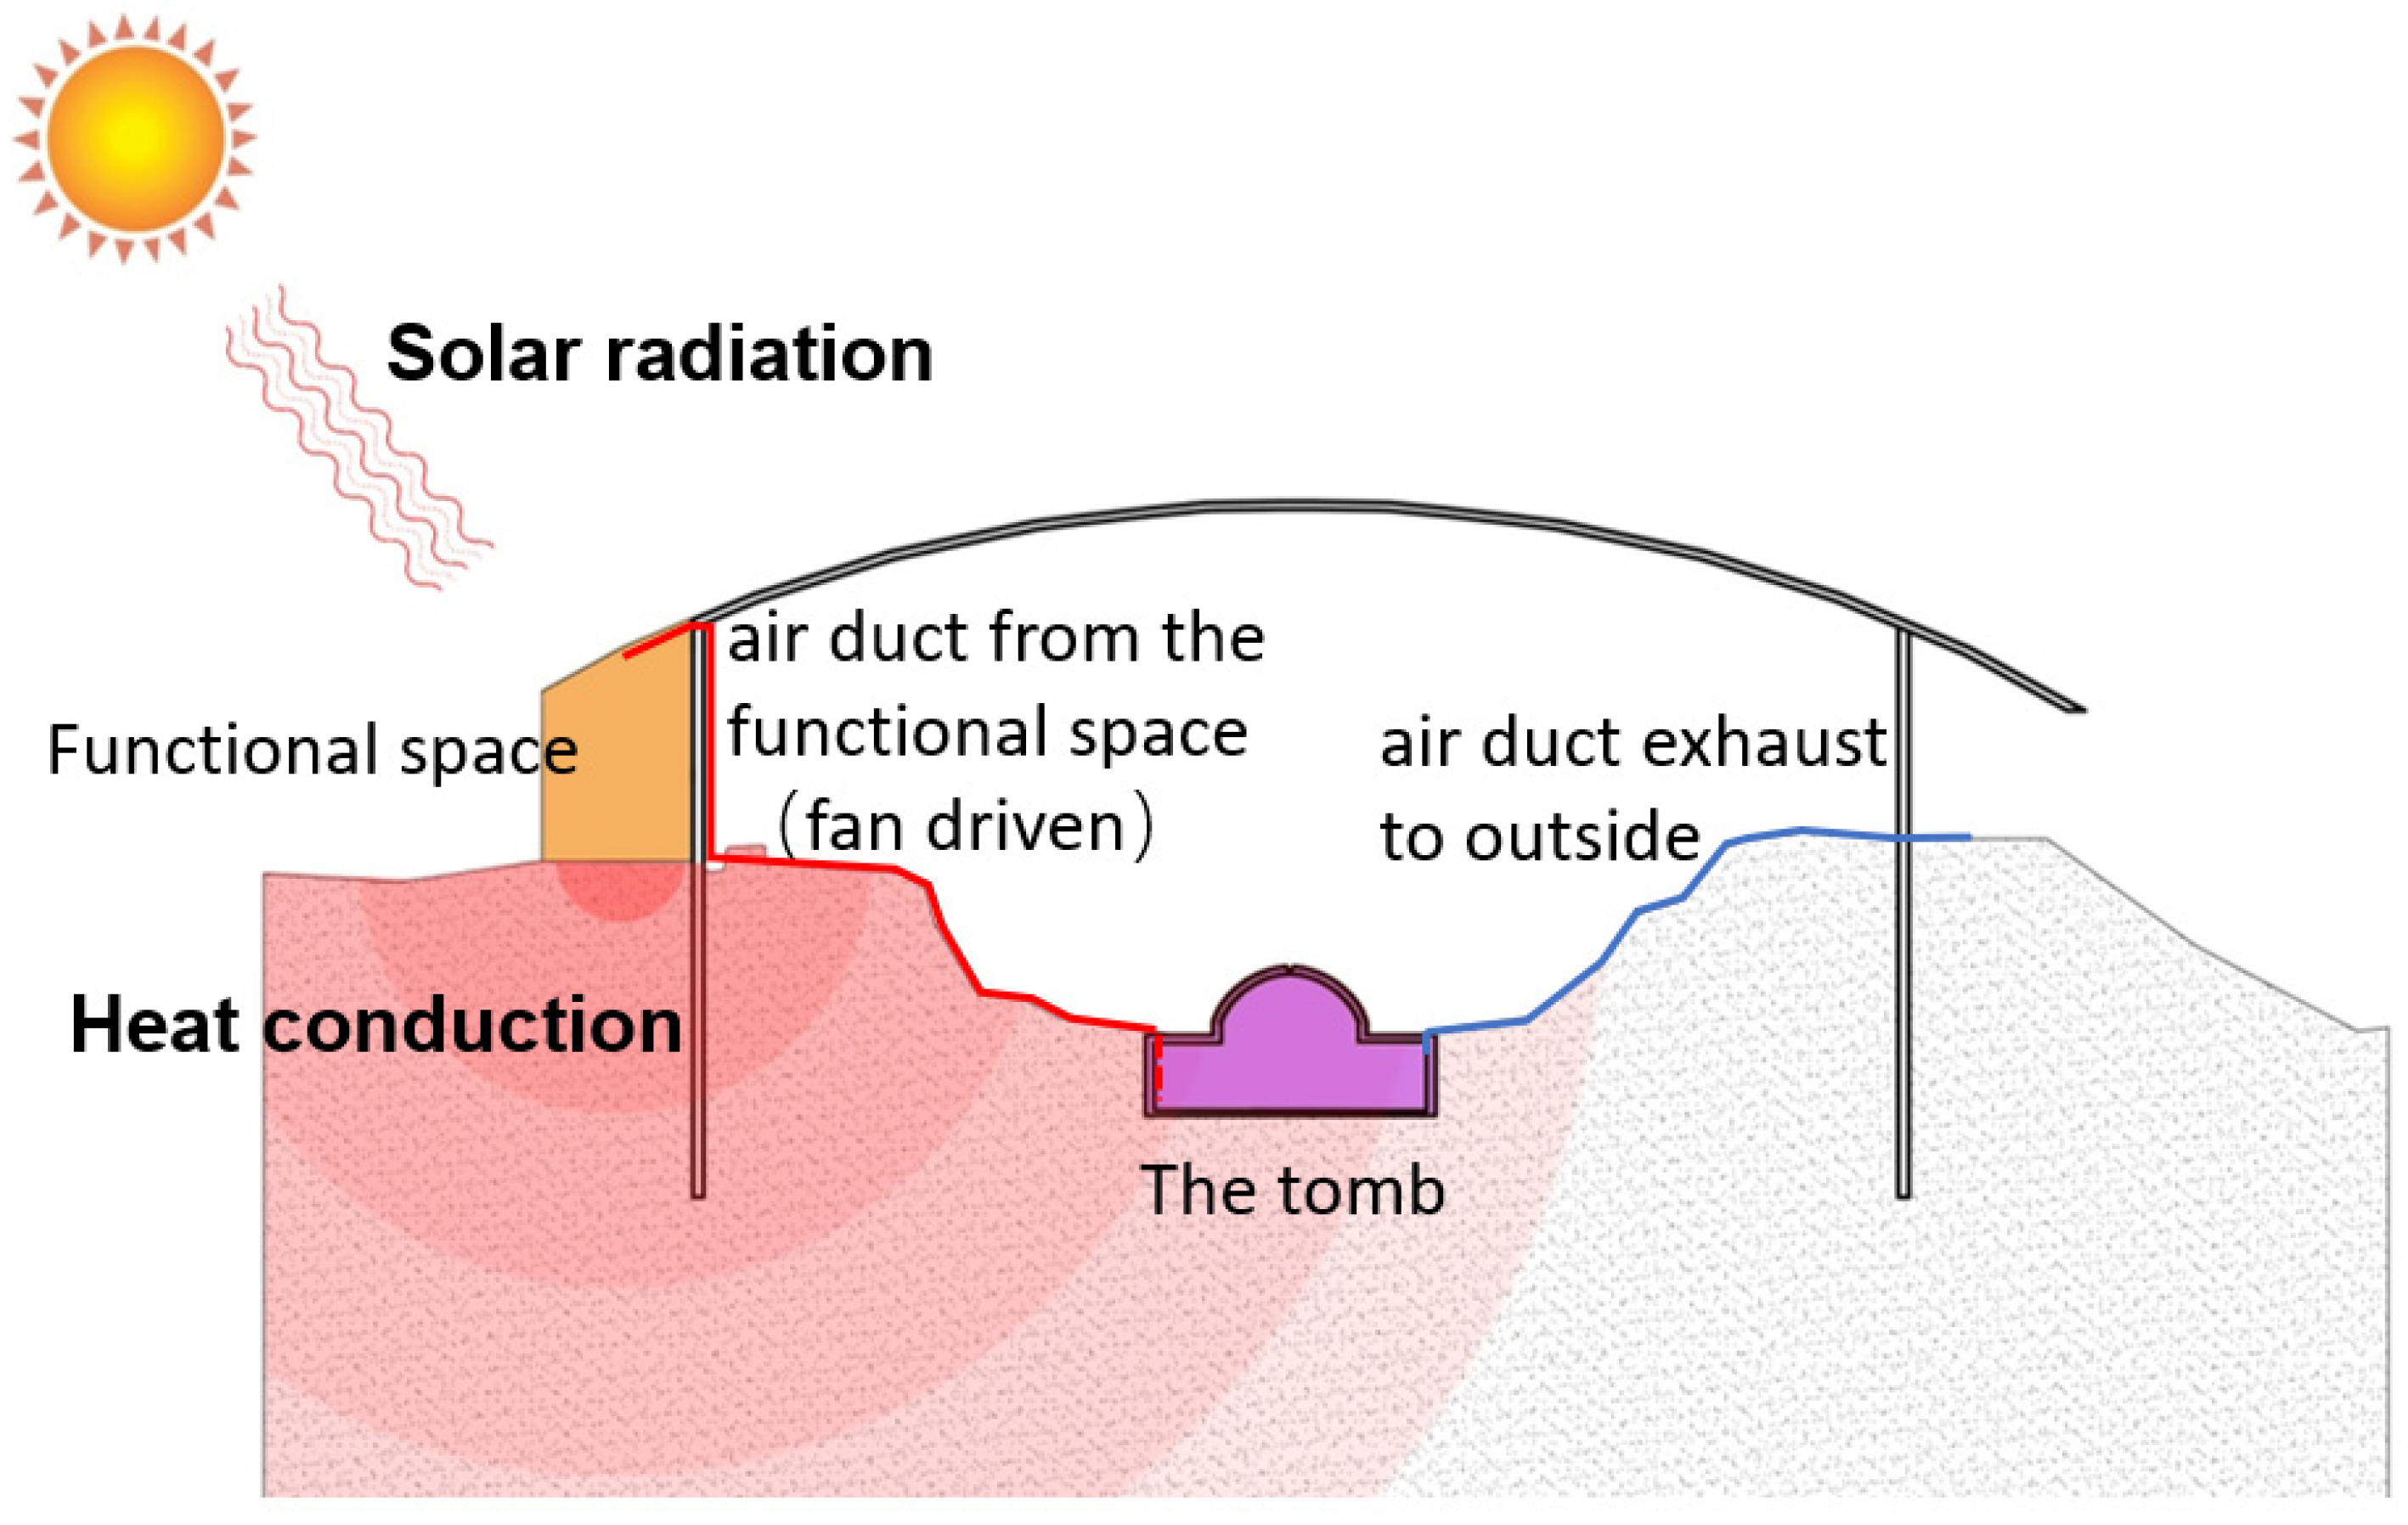
As a passive method to raise the surface temperature of the tomb brick wall and decrease the air absolute humidity for avoiding condensation, placing a functional space like a sunroom adjacent to the protective shed is proposed.
As shown in Figure 7, the functional space is enclosed by glass walls and roof to receive solar radiation. The glass wall is a double-glazing panel, which has a large transmittance of solar radiation and a small transmittance of heat. The ground and side wall adjacent to the protective shed are covered by vapor proofing film such as PMPC (a patented (#US 7,179,761) vapor/ water proofing membrane composed of an exclusive plasmatic core suspended mid-point between two layers of a homogeneous, bituminous material) to avoid the evaporation from the ground and the side wall. The air heated by the solar radiation in the functional space is transferred to the tomb chamber through the air conduct driven by a fan, then exhausted to the outside through another air duct driven by a fan. At the same time, the functional space supplies heat to the tomb chamber by heat conduction through the ground.
In this situation, only heat transfer between the surface around the functional space and the air in it is considered. The heat balance at the ground surface in contact with the air in the functional space is as follows:
α ( T s T f ) + q s o l R T + q n o c = λ T x
Here, RT is radiation transmission. The subscript s represents surface of the ground in contact with the air, f represents functional space.
The equation of heat transfer at the boundary of the side wall adjacent to the protective shed is almost the same as Equation (10) except for the solar radiation.
The functional space exchanges air with the tomb chamber and the outside. From late fall to winter (November–February), the outdoor air has low absolute humidity but low temperature when without the solar radiation, thus not suitable to be transferred into the tomb chamber. Thus, only the air heated by the solar radiation and with high temperature is supplied.
The heat and moisture balance in the functional space are as follows:
Heat:
c γ V f T f t = j = 1 m 5 S f g j α j ( T f g j T f ) + j = 1 m 6 S f b j α j ( T f b j T f ) + j = 1 m 7 S f i j K ( T o T f ) + c γ V f N f ( T o T f )
Moisture:
c V f P f t = c V f N f ( P o P f )
Here, K is coefficient of heat transfer of glass. The subscript o represents outside, f represents functional space. The superscript fg represents ground surface in contact with the air in the functional space, fb represents protective shed surface in contact with the air in the functional space, fi represents inside surface of the functional space.
In this situation, the heat and moisture balance in the tomb chamber are as follows:
Heat:
c γ V r T r t = j = 1 m 1 S j α j ( T j T r ) + c γ V r N r ( T b T r ) + c γ V f N f ( T f T r )
Moisture:
c V r P r t = j = 1 m 1 S j α m j ( P j P r ) + c V r N r ( P b P r ) + c V f N f ( P f P r )
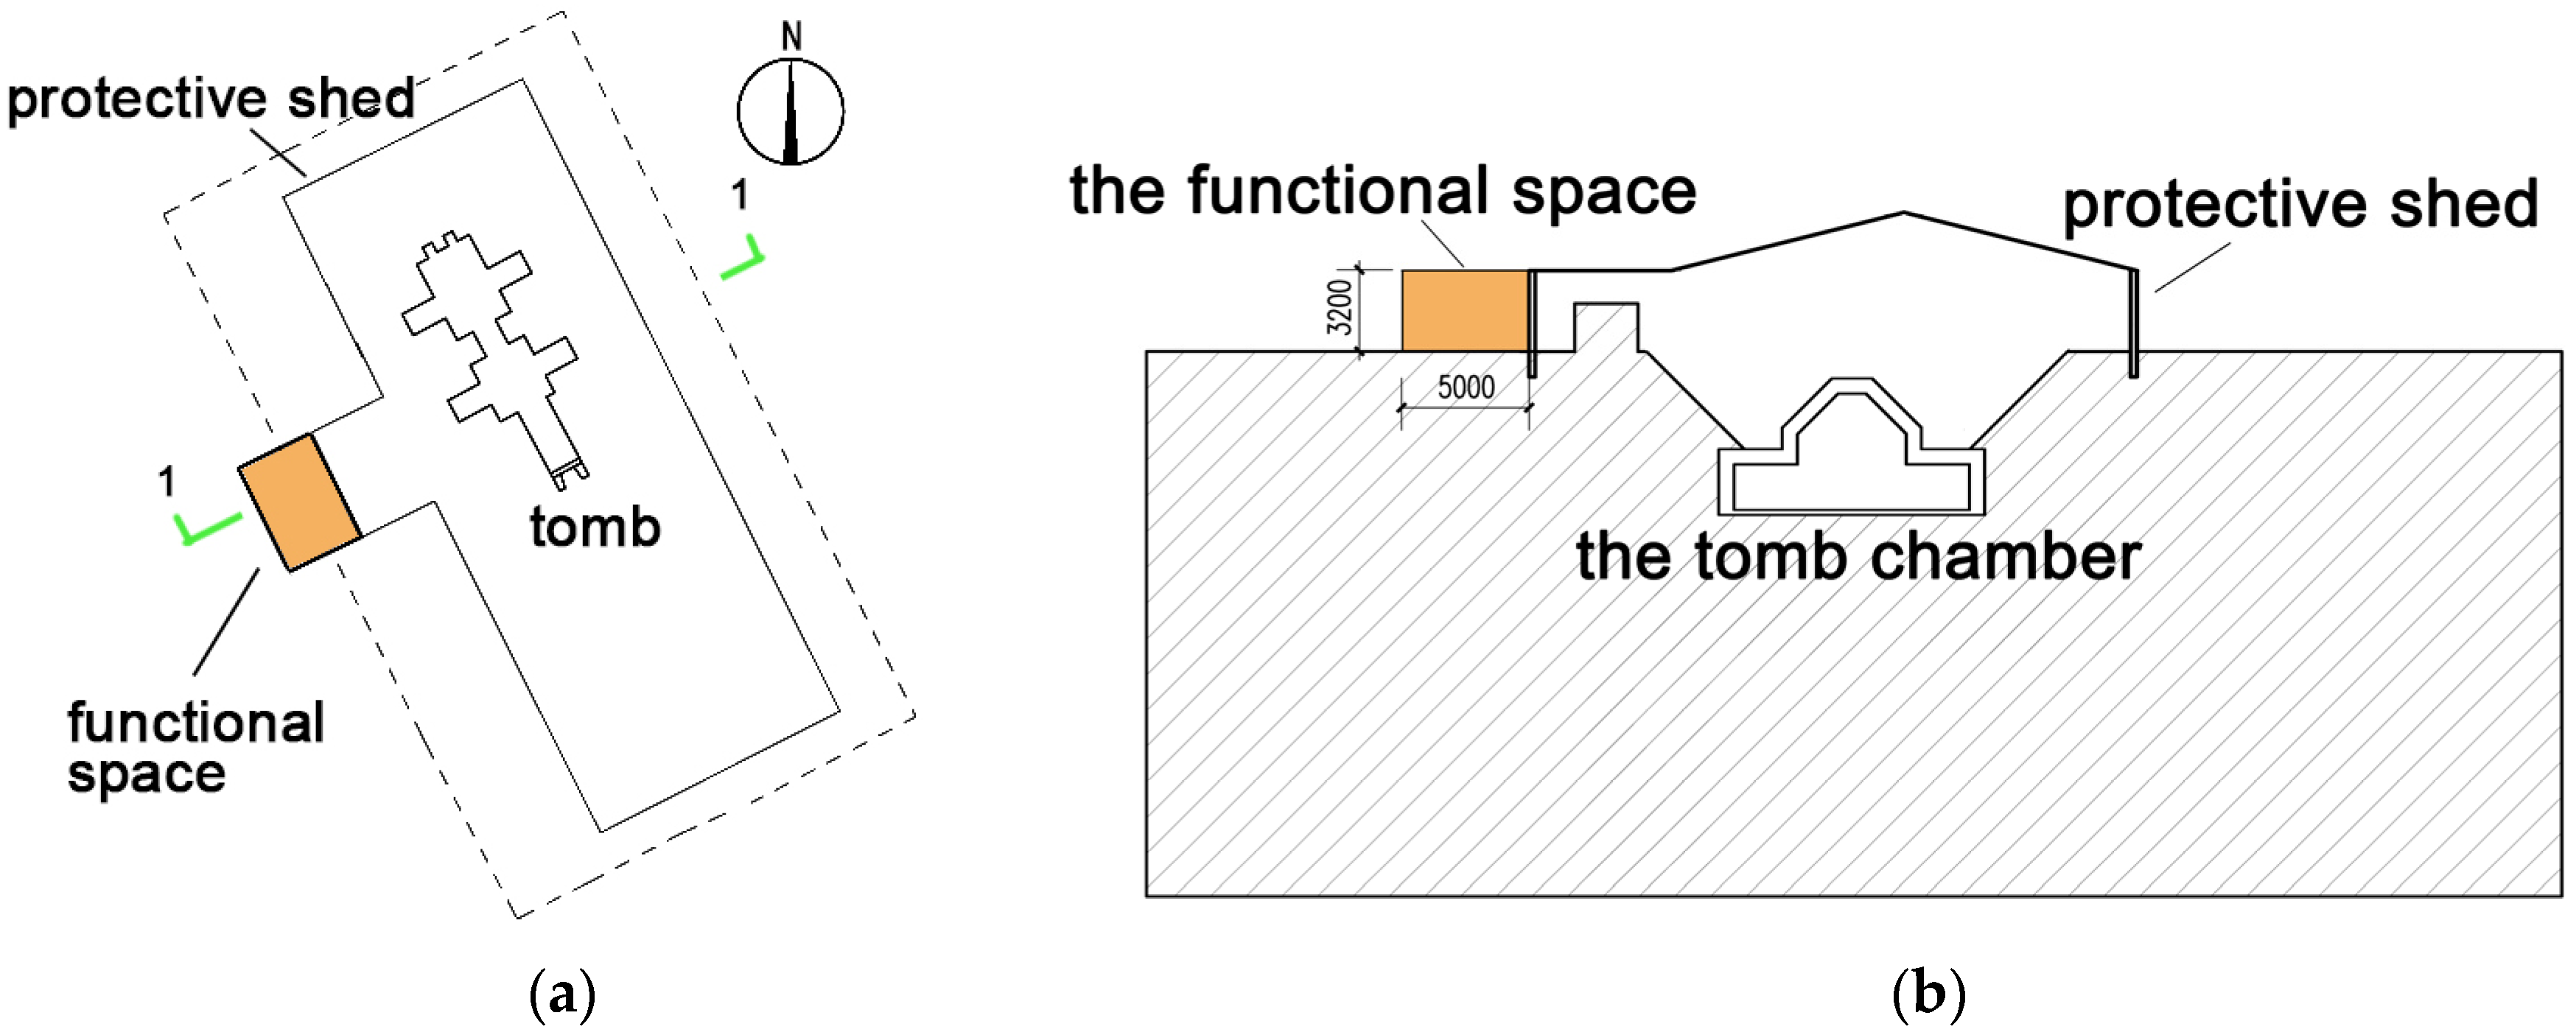
Considering the given protective shed and the direction of the local solar radiation characteristics, the functional space was designed. As shown in Figure 8, the functional space was placed in the orange colored area considering the distance to the tomb and the sunlight’s direction. The glass wall enclosing the functional space is 3.2 m high and the glass roof is 5 m wide.
In this two-dimensional (2D) numerical model, the volumes of the tomb, the protective shed, and the functional space were set at 26.2, 130, and 16 m3, respectively. The air exchange rates (based on the volume of the functional space) between the functional space and the tomb chamber was controlled as listed in Table 2 depending on the time of the year and the temperatures of them.
Because of the air balance, the air exchange rate between the functional space and the outside is equal to that between the functional space and the tomb (both based on the volume of the functional space).

4. Results and Discussion

4.1. Changes of Surface Temperature and Water Content on the Internal Wall

To examine the change in the surface temperature and water content on the internal wall of the tomb chamber after the functional space was added, four simulation points on the internal wall surface were selected. As shown in Figure 9, points 1 and 3 are on the surface of the inner facade of the wing rooms, point 2 is on the surface of the brick ground, and point 4 is on the surface of the ceiling. In order to compare the difference between the ‘original’ case and the ‘functional space-added’ case, the annual cycle steady state will be discussed here.
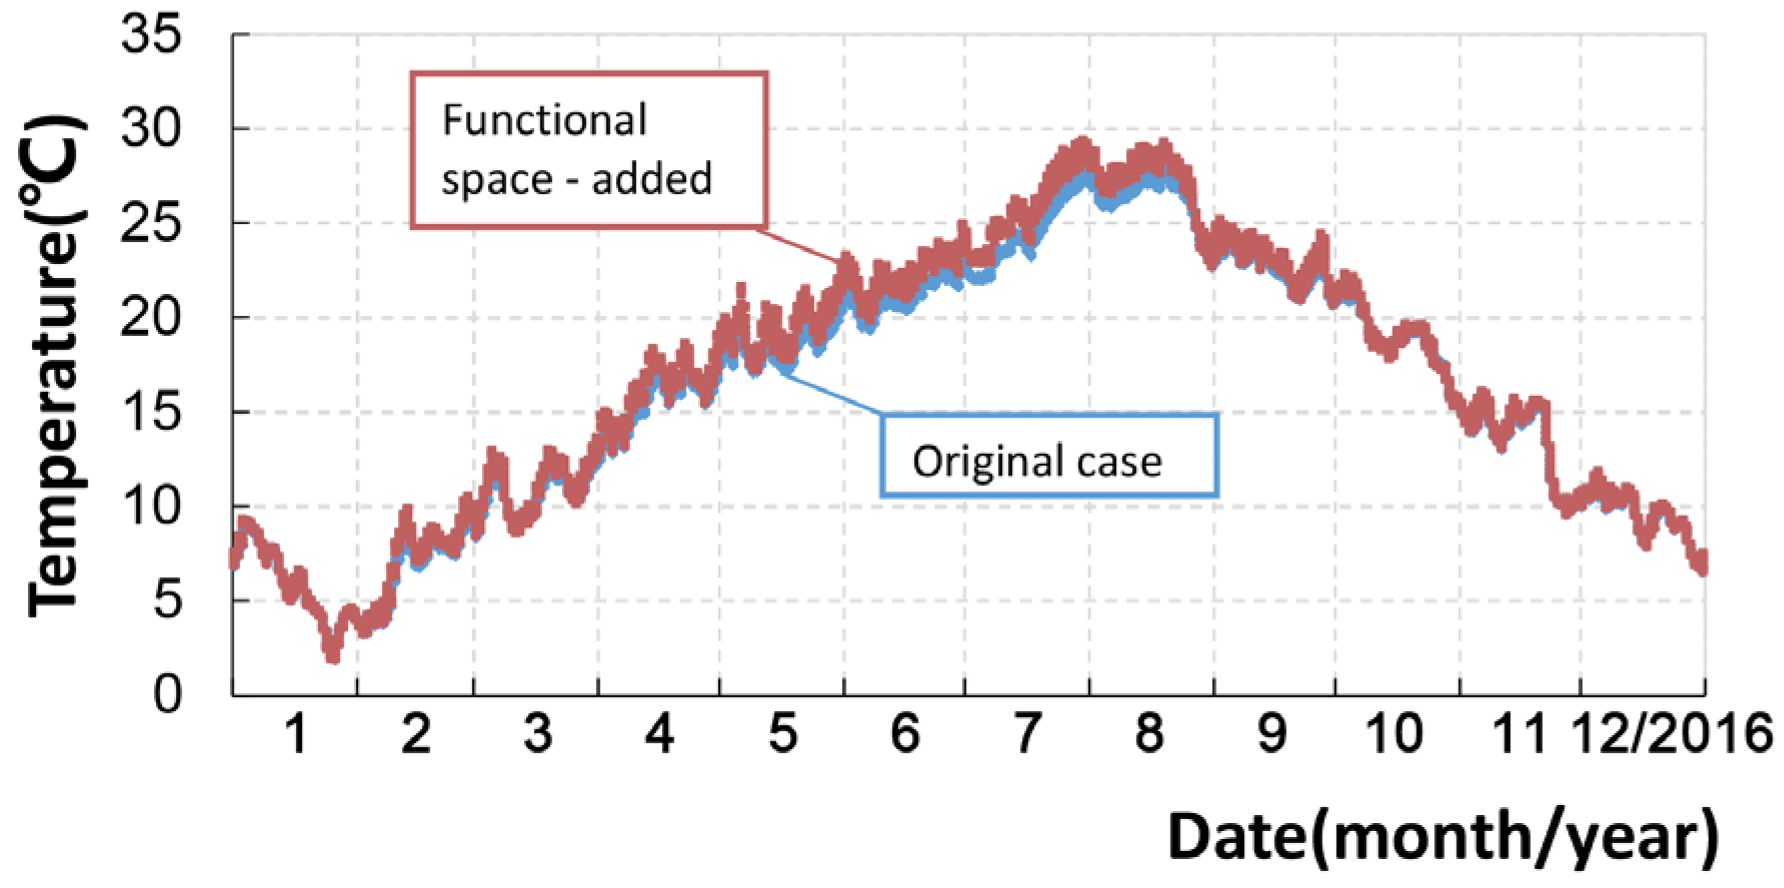
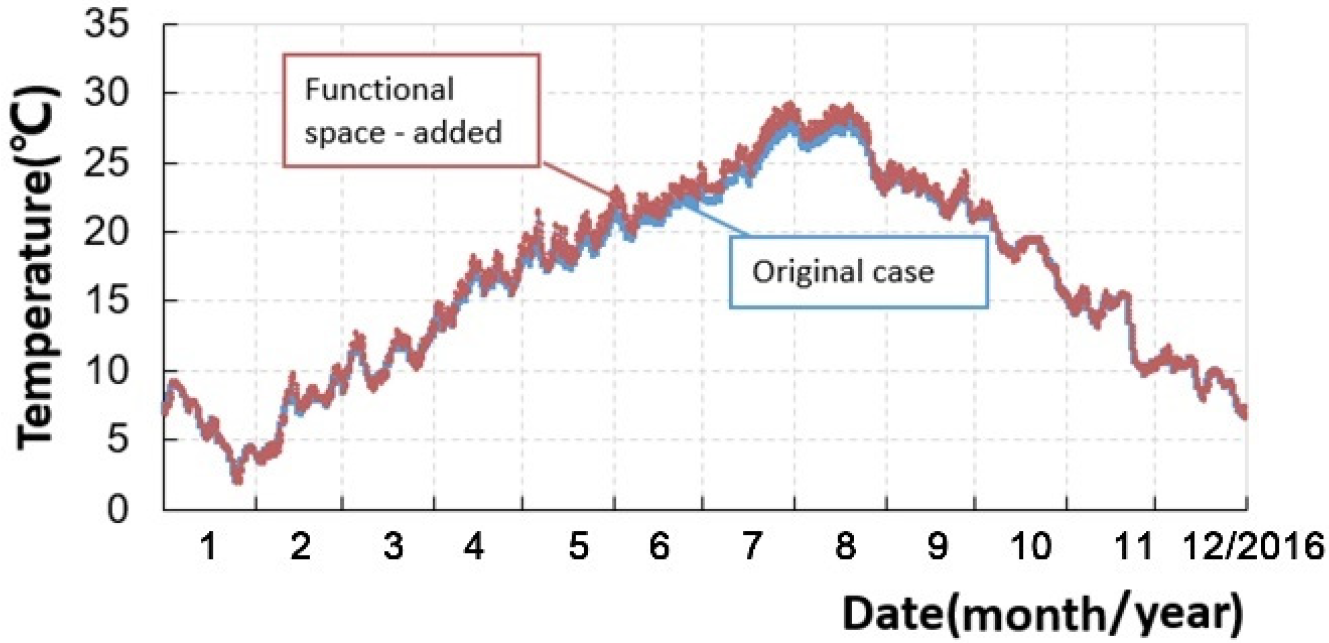
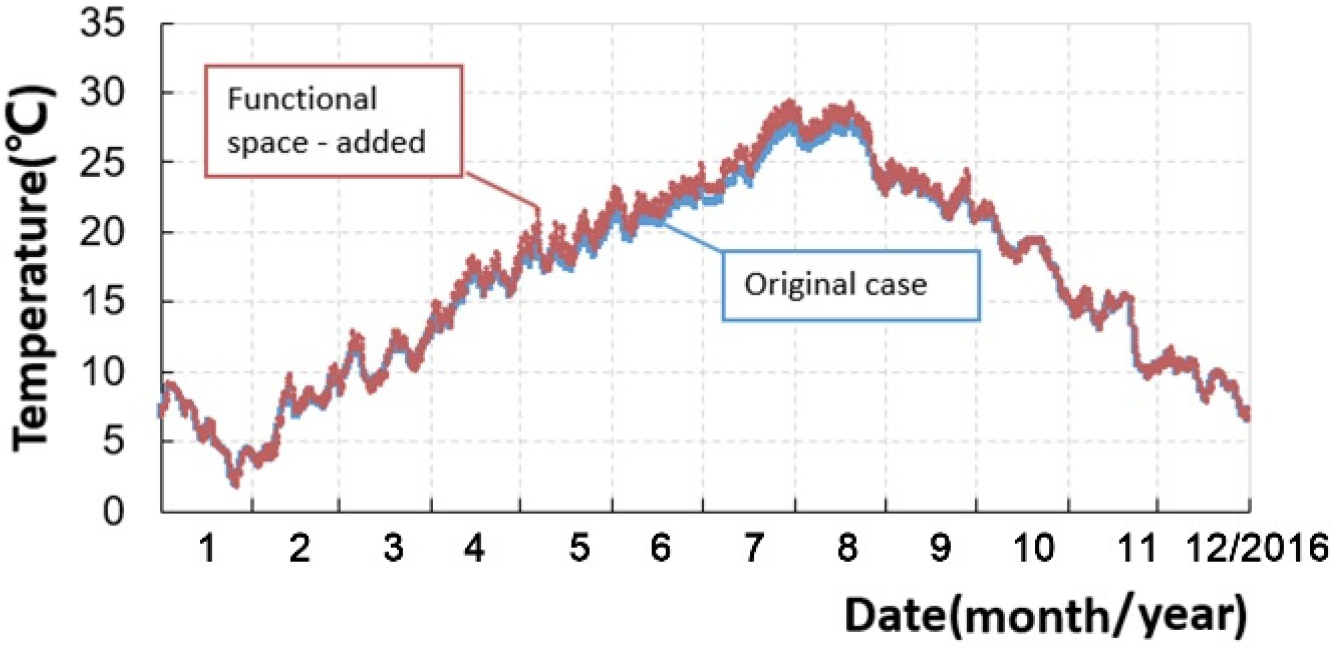
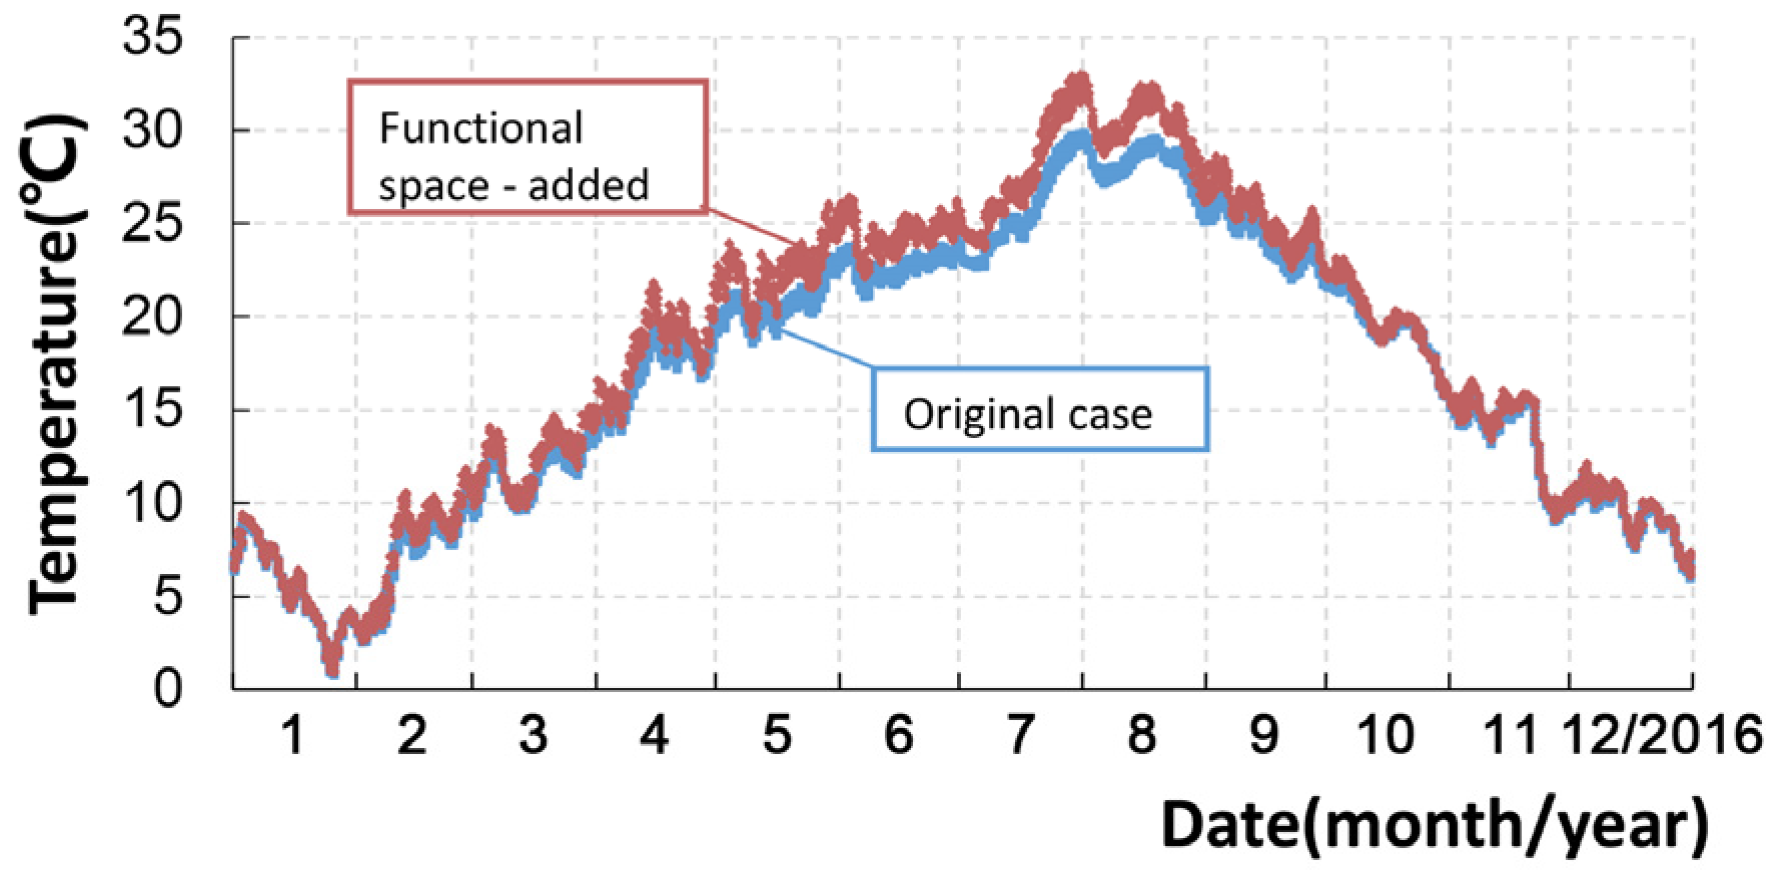
Figure 10, Figure 11, Figure 12 and Figure 13 show the temperatures at the four points before and after the functional space was added to the protective shed. After the functional space was added, the temperature of all four points increased about 0.5 °C at points 1 to 3, and about 1.0 °C at point 4, respectively. The temperature on the lower side of the tomb chamber (points 1(+0.5 °C) to 3(+0.5 °C)) increased less than on the upper side(+1.0 °C), because of the large heat capacity of the ground. The temperature difference between the points 1 and 3 was very small, indicating that the effect of the heat conduction through the ground was very small. The temperature at the four points increased 0.7 °C on average.
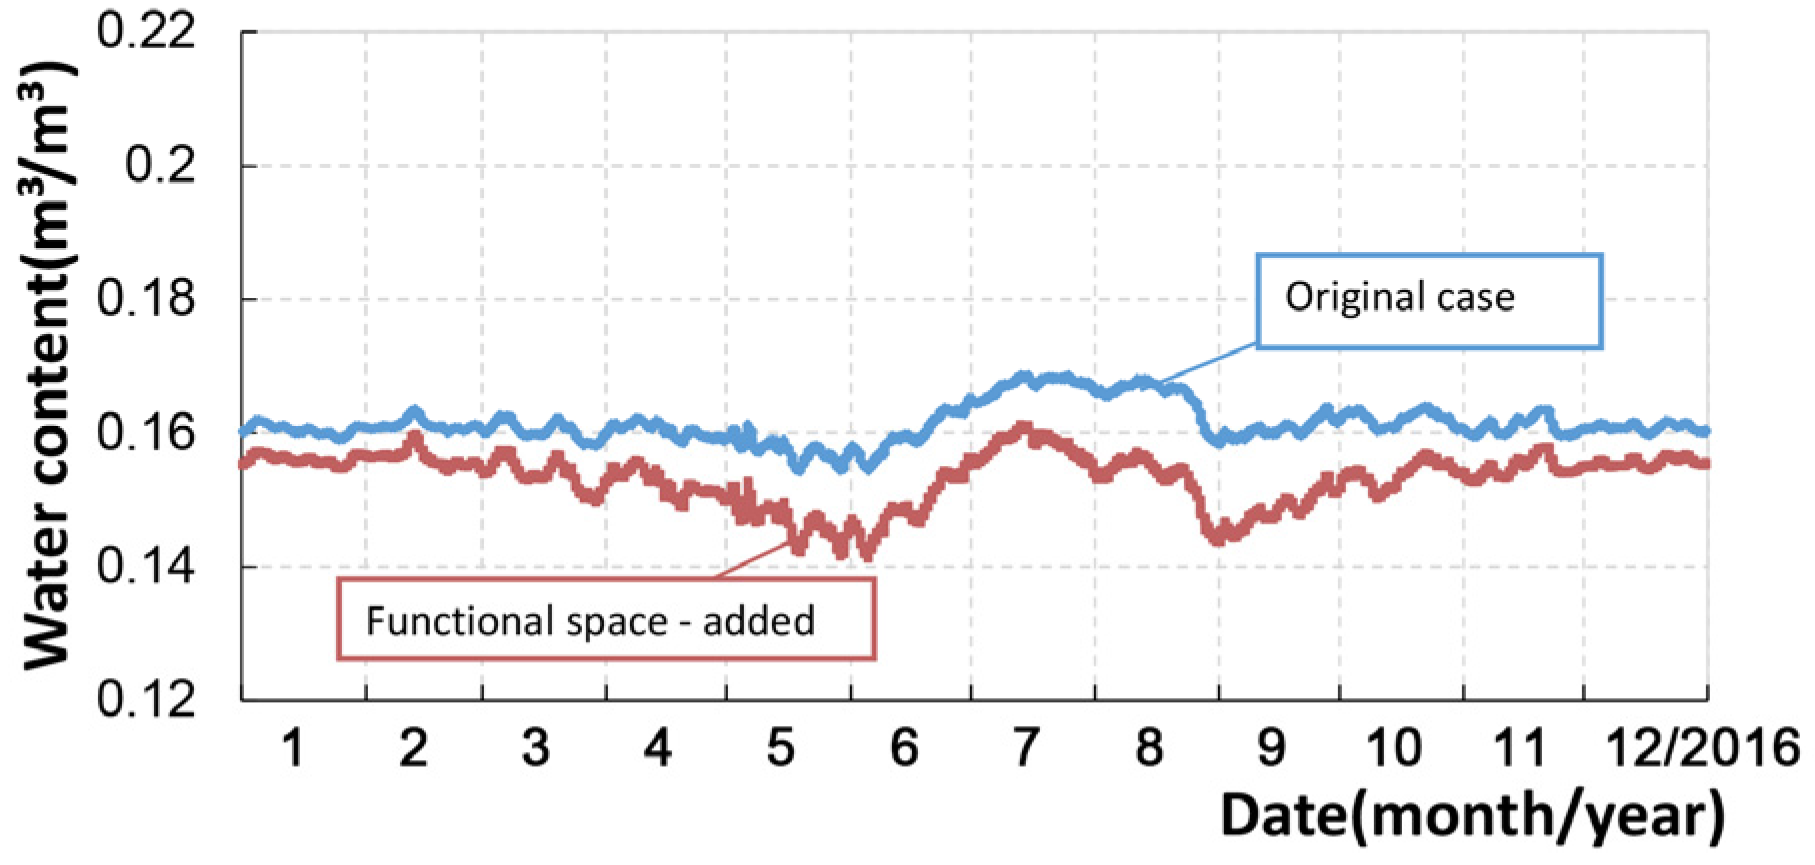
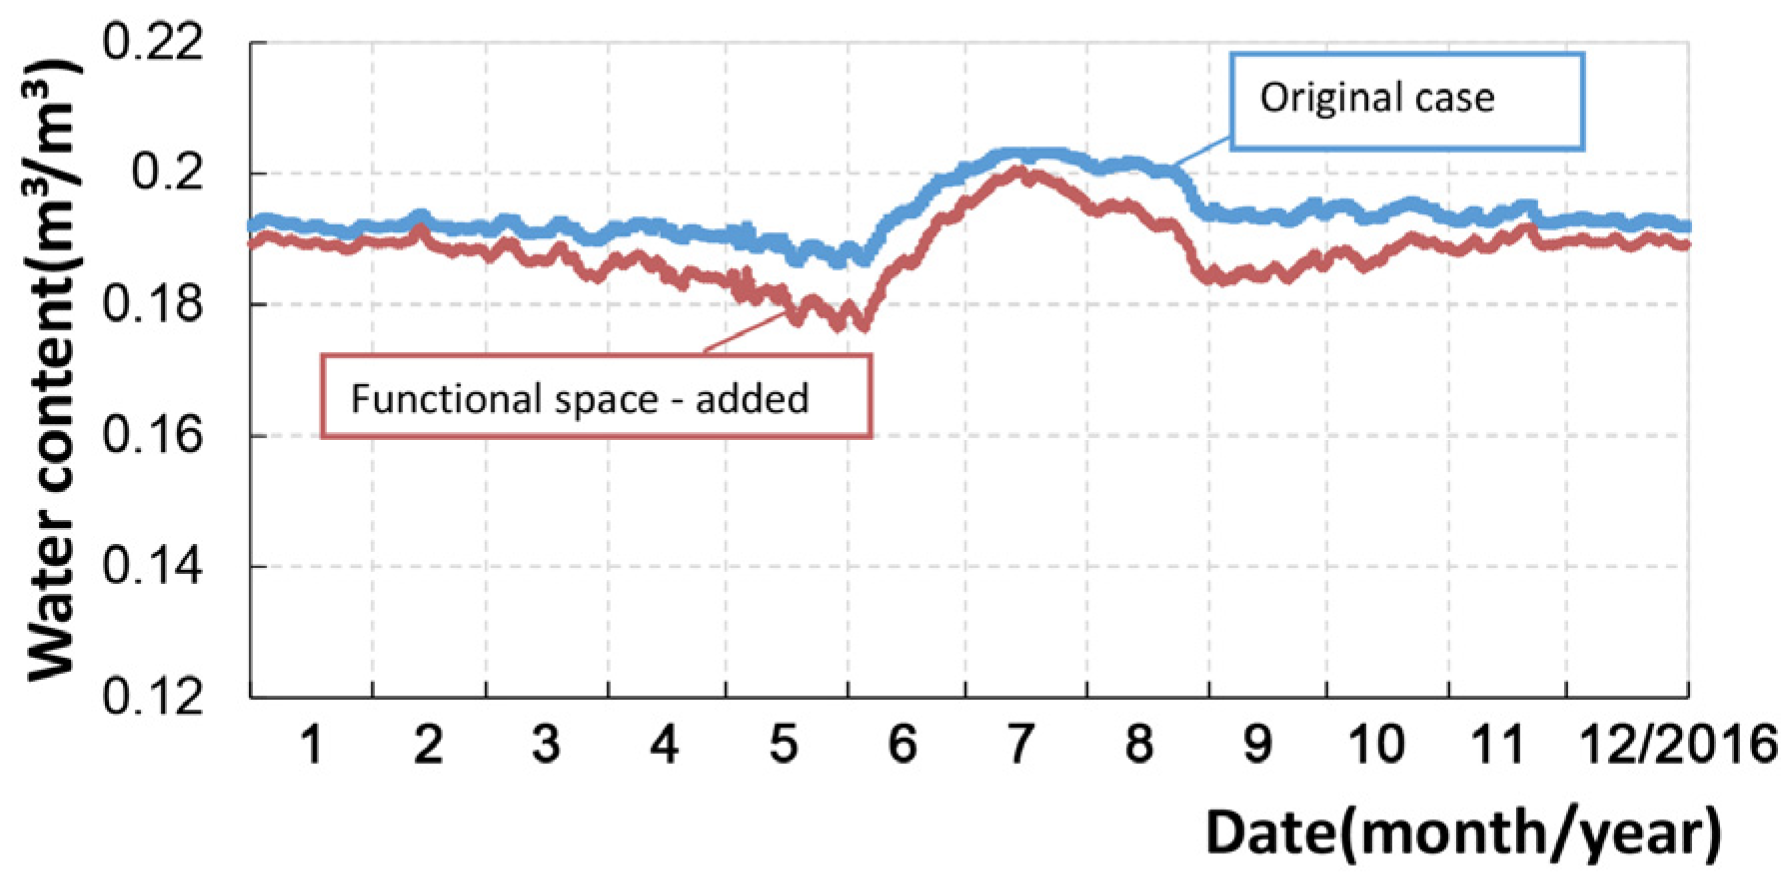
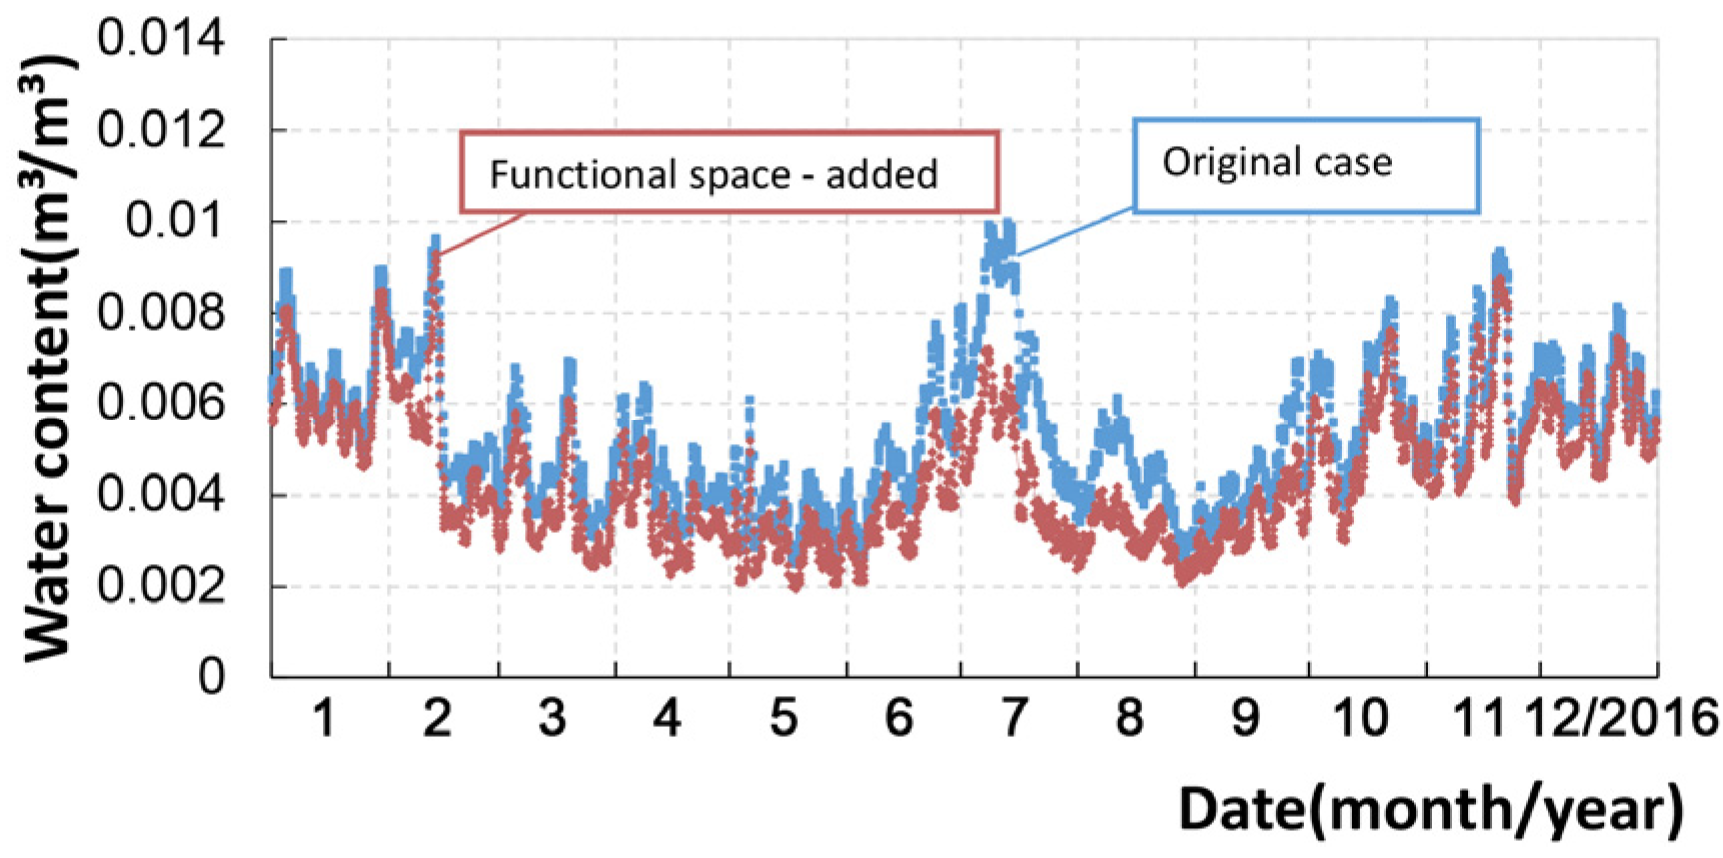
Figure 14, Figure 15, Figure 16 and Figure 17 show the water content at the four points before and after the functional space was added to the protective shed. After the functional space was added, the water content at all four points decreased, about 0.008 m3/m3 at point 1, 0.005 m3/m3 at point 2, 0.007 m3/m3 at point 3, and 0.001 m3/m3 at point 4, respectively.

4.2. Changes of the Air Temperature and Humidity in the Tomb Chamber

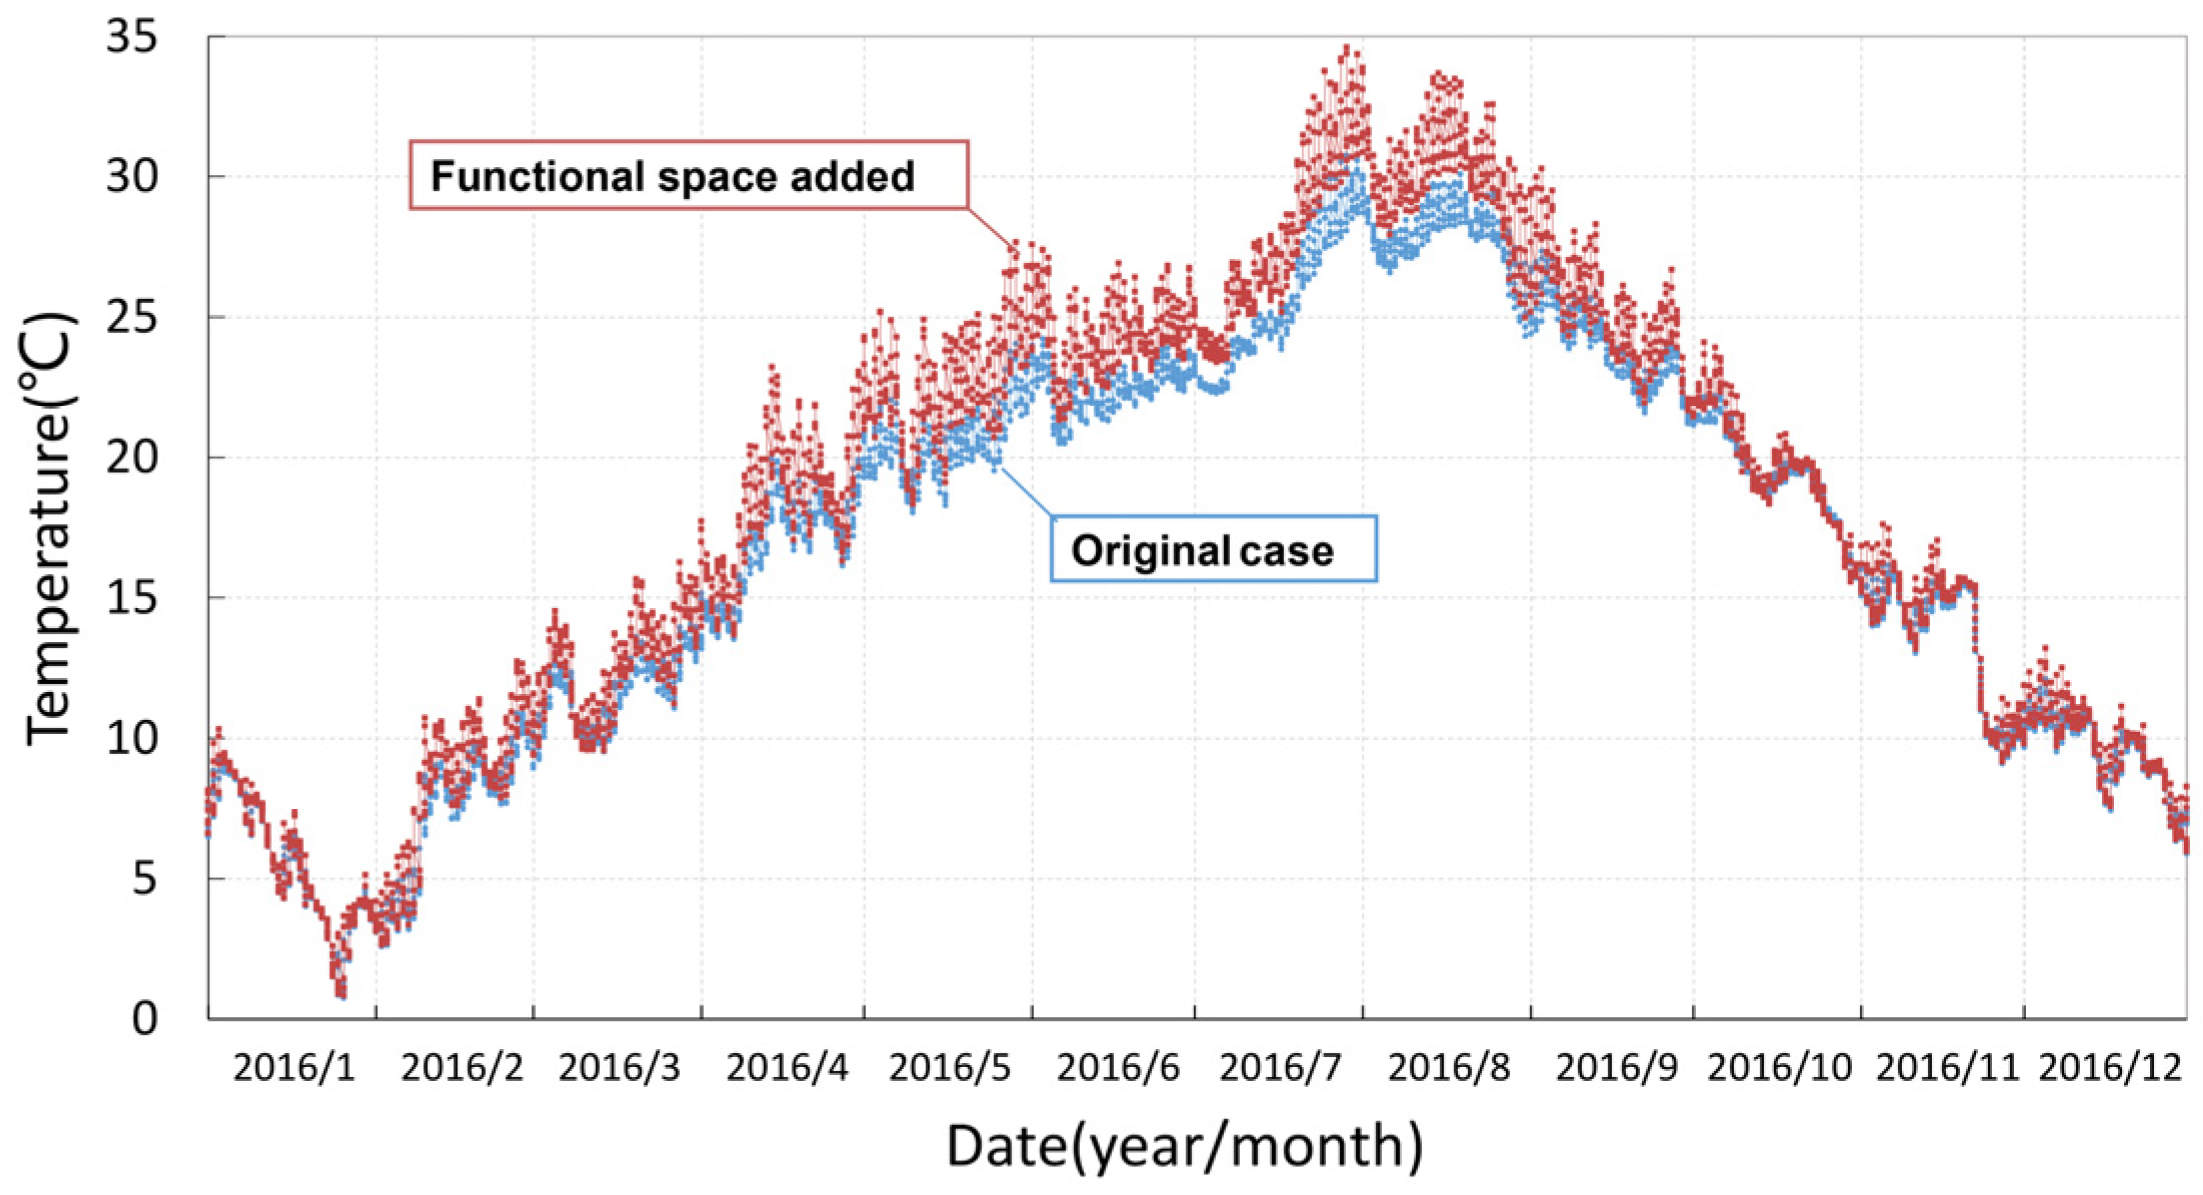
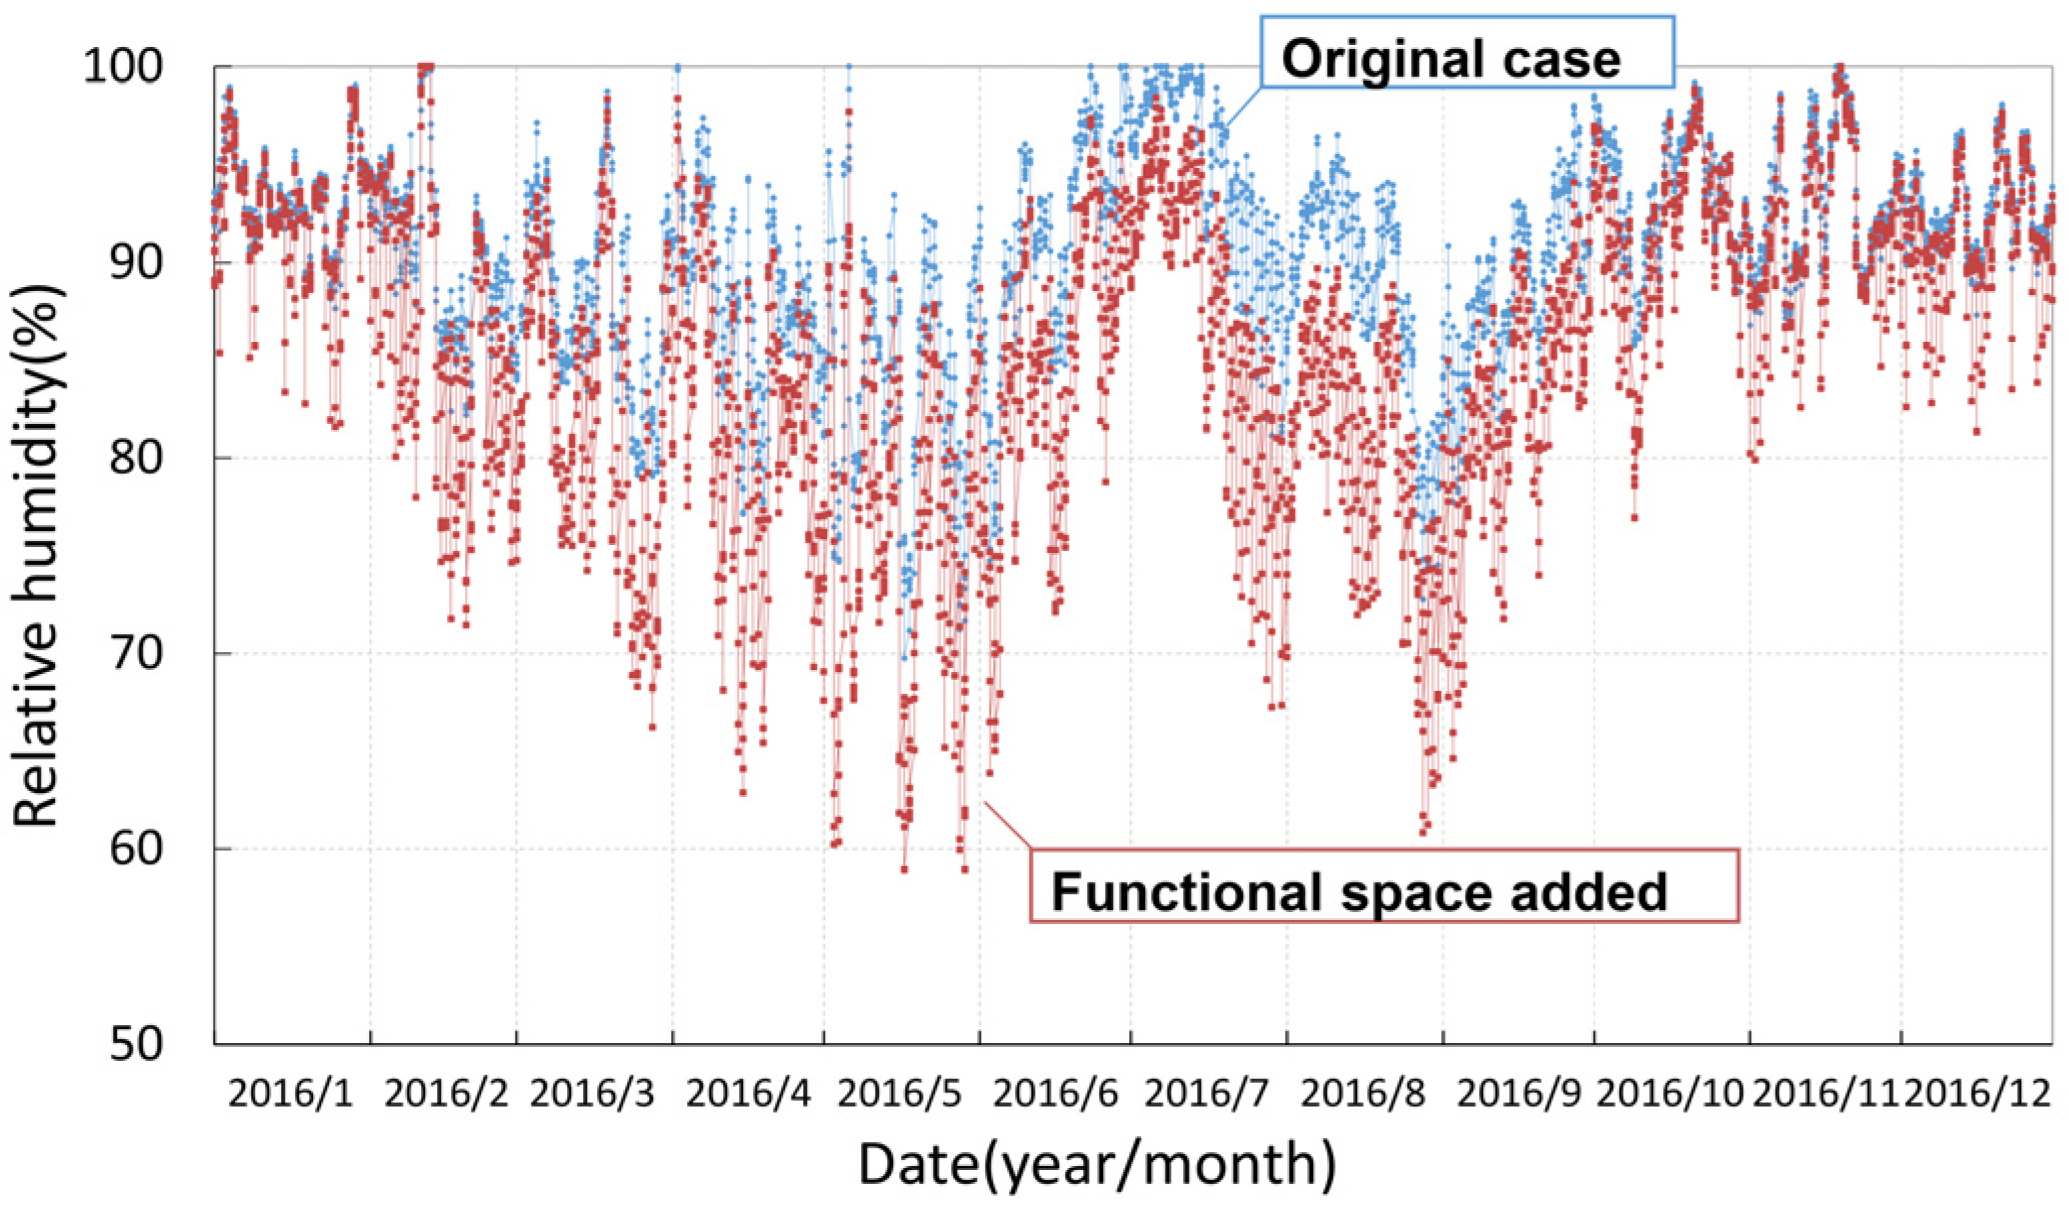
The air temperature, relative humidity, and absolute humidity in the tomb chamber before and after the functional space was added are shown in Figure 18, Figure 19 and Figure 20:
It can be seen in Figure 18 that after the functional space was added, temperature in the tomb chamber increased in the whole year and by about 4 °C in summer. Even in winter, the temperature in the tomb chamber increased. As Table 3 shows, the temperature in the tomb chamber fluctuated between 0.7~30.7 °C throughout the year, and the average temperature was 17.0 °C in the original case. After the functional space was added, the temperature fluctuated between 0.8~34.6 °C, and the average temperature increased up to 18.2 °C. The maximum and the minimum temperatures increased by 3.9 °C and 0.1 °C compared to those in the original case, respectively. The annual average of the temperature in the tomb chamber increased by about 1.2 °C.
Figure 19 shows that after the functional space was added, relative humidity in the tomb chamber decreased in the whole year and by about 10% in late spring and late summer. Table 4 shows the statistics of the relative humidity in the tomb chamber. It can be seen that the addition of the functional space decreased the relative humidity of the air in the tomb chamber, which means the air in the tomb chamber became dryer. Especially, in the rainy season (June and July), almost RH100% decreased to 95%.
Figure 20 shows that after the functional space was added, absolute humidity in the tomb chamber increased only a little in summer, but kept nearly the same as the original case in spring, winter and autumn. Table 5 shows the statistics of the absolute humidity in the tomb chamber. It can be seen that the addition of the functional space increased the absolute humidity of the air in the tomb chamber by 0.003 kg/m³ in summer.

4.3. Occurrence in Condensation

In this study, condensation was defined to occur when the water chemical potential of the wall surface is higher than −30 J/kg (the pore air is near 99.98% RH) and water vapor comes in. This definition of condensation was used to evaluate the risk of relative severe condensation [36].
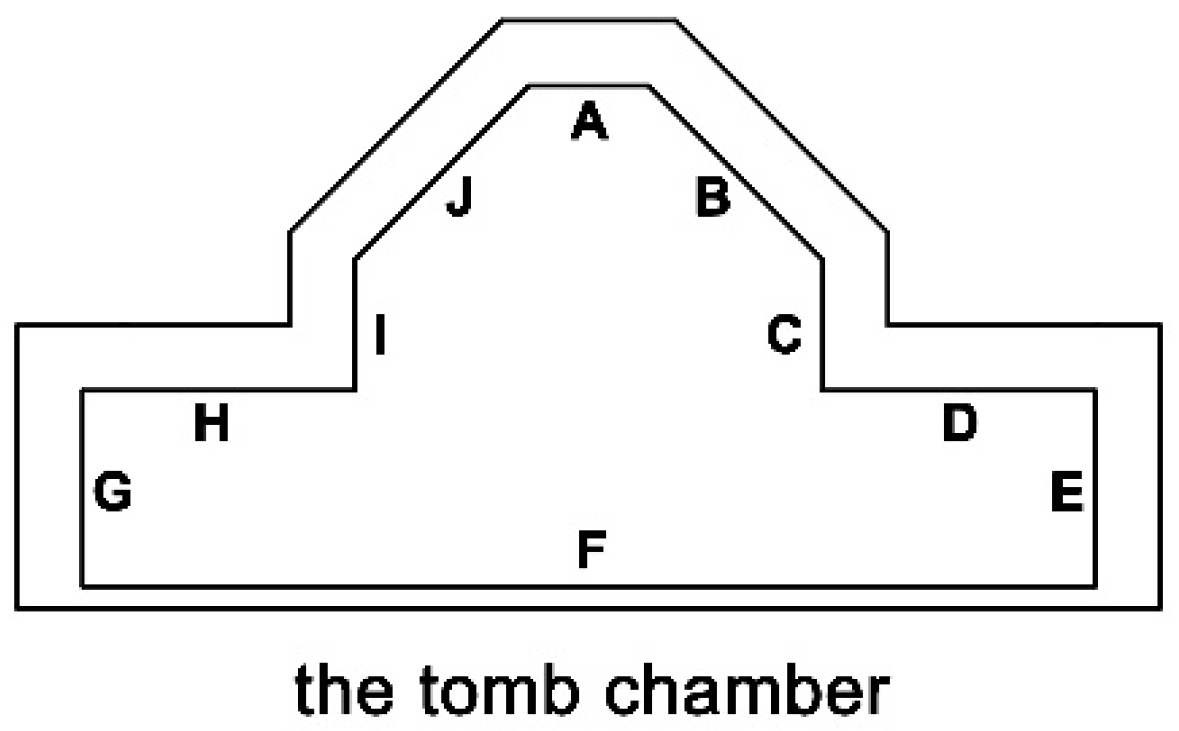
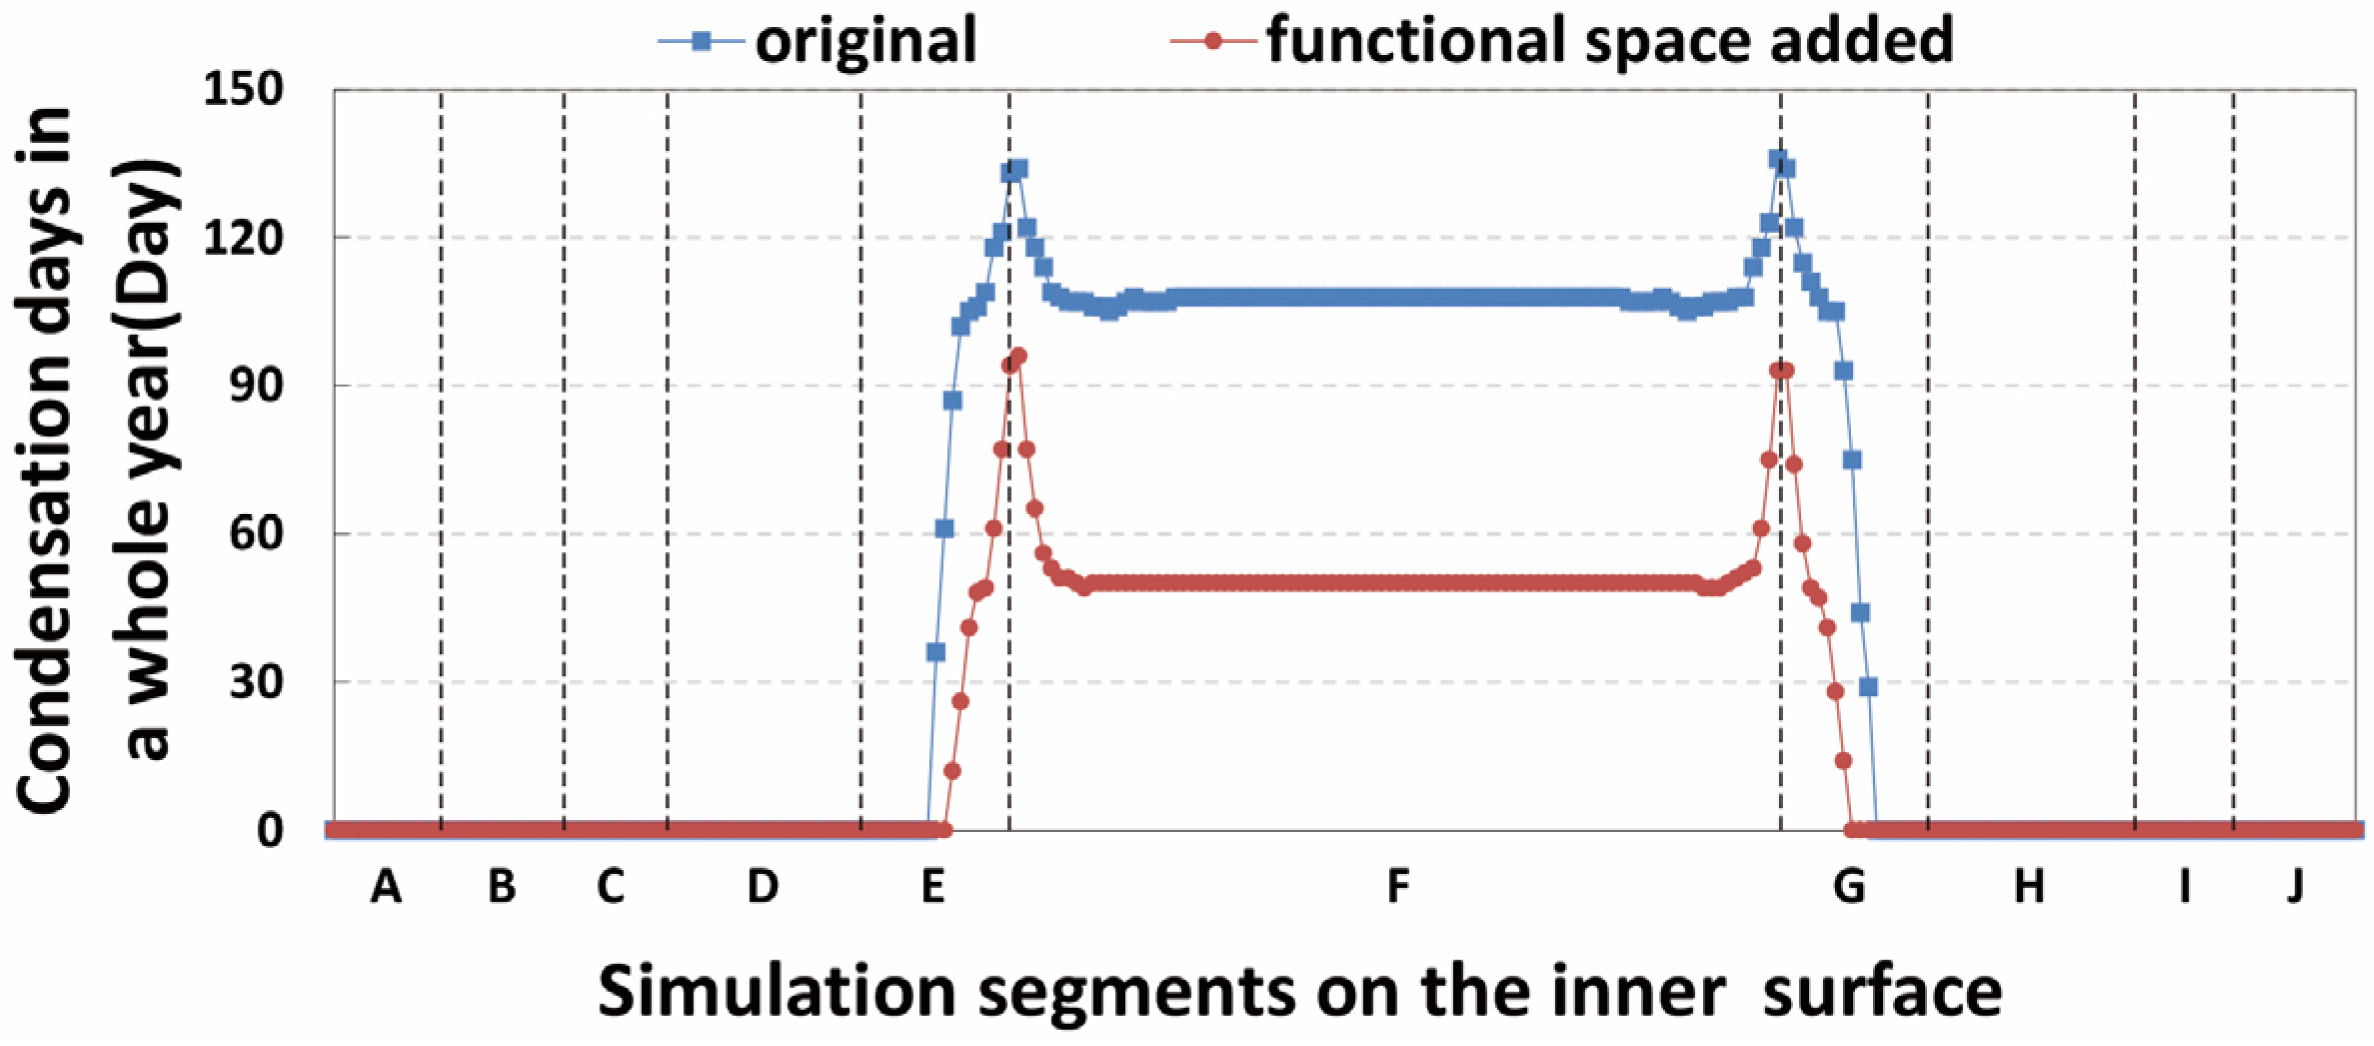
To examine the areas where condensation occurs, the inner wall surface of the tomb chamber was divided into ten segments marked by letters “A” to “J” as shown in Figure 21. Figure 22 compares the condensation days on each segment between the original case and the functional space added case.
It can be seen that there were no condensation days on segments A to D and segments H to J both in the original case and the functional space added case, which means that no condensation occurred on the surface of the inner wall on the upper side of the tomb. This is because only the lower part of the tomb is covered by soil, while the outside wall surface of the upper part of the tomb is exposed to air.
Both before and after the functional space was added, condensation occurred on segments E to G, that is, the bottom side of the tomb chamber (the ground of the tomb chamber and inner facade of the wing rooms) (Figure 3a). Maximum condensation occurred between segments E and F and between segments F and G, that is, at the corner of the wing rooms. After the functional space was added, condensation days on segments E to G reduced by about 50 days in the whole year (Table 6).
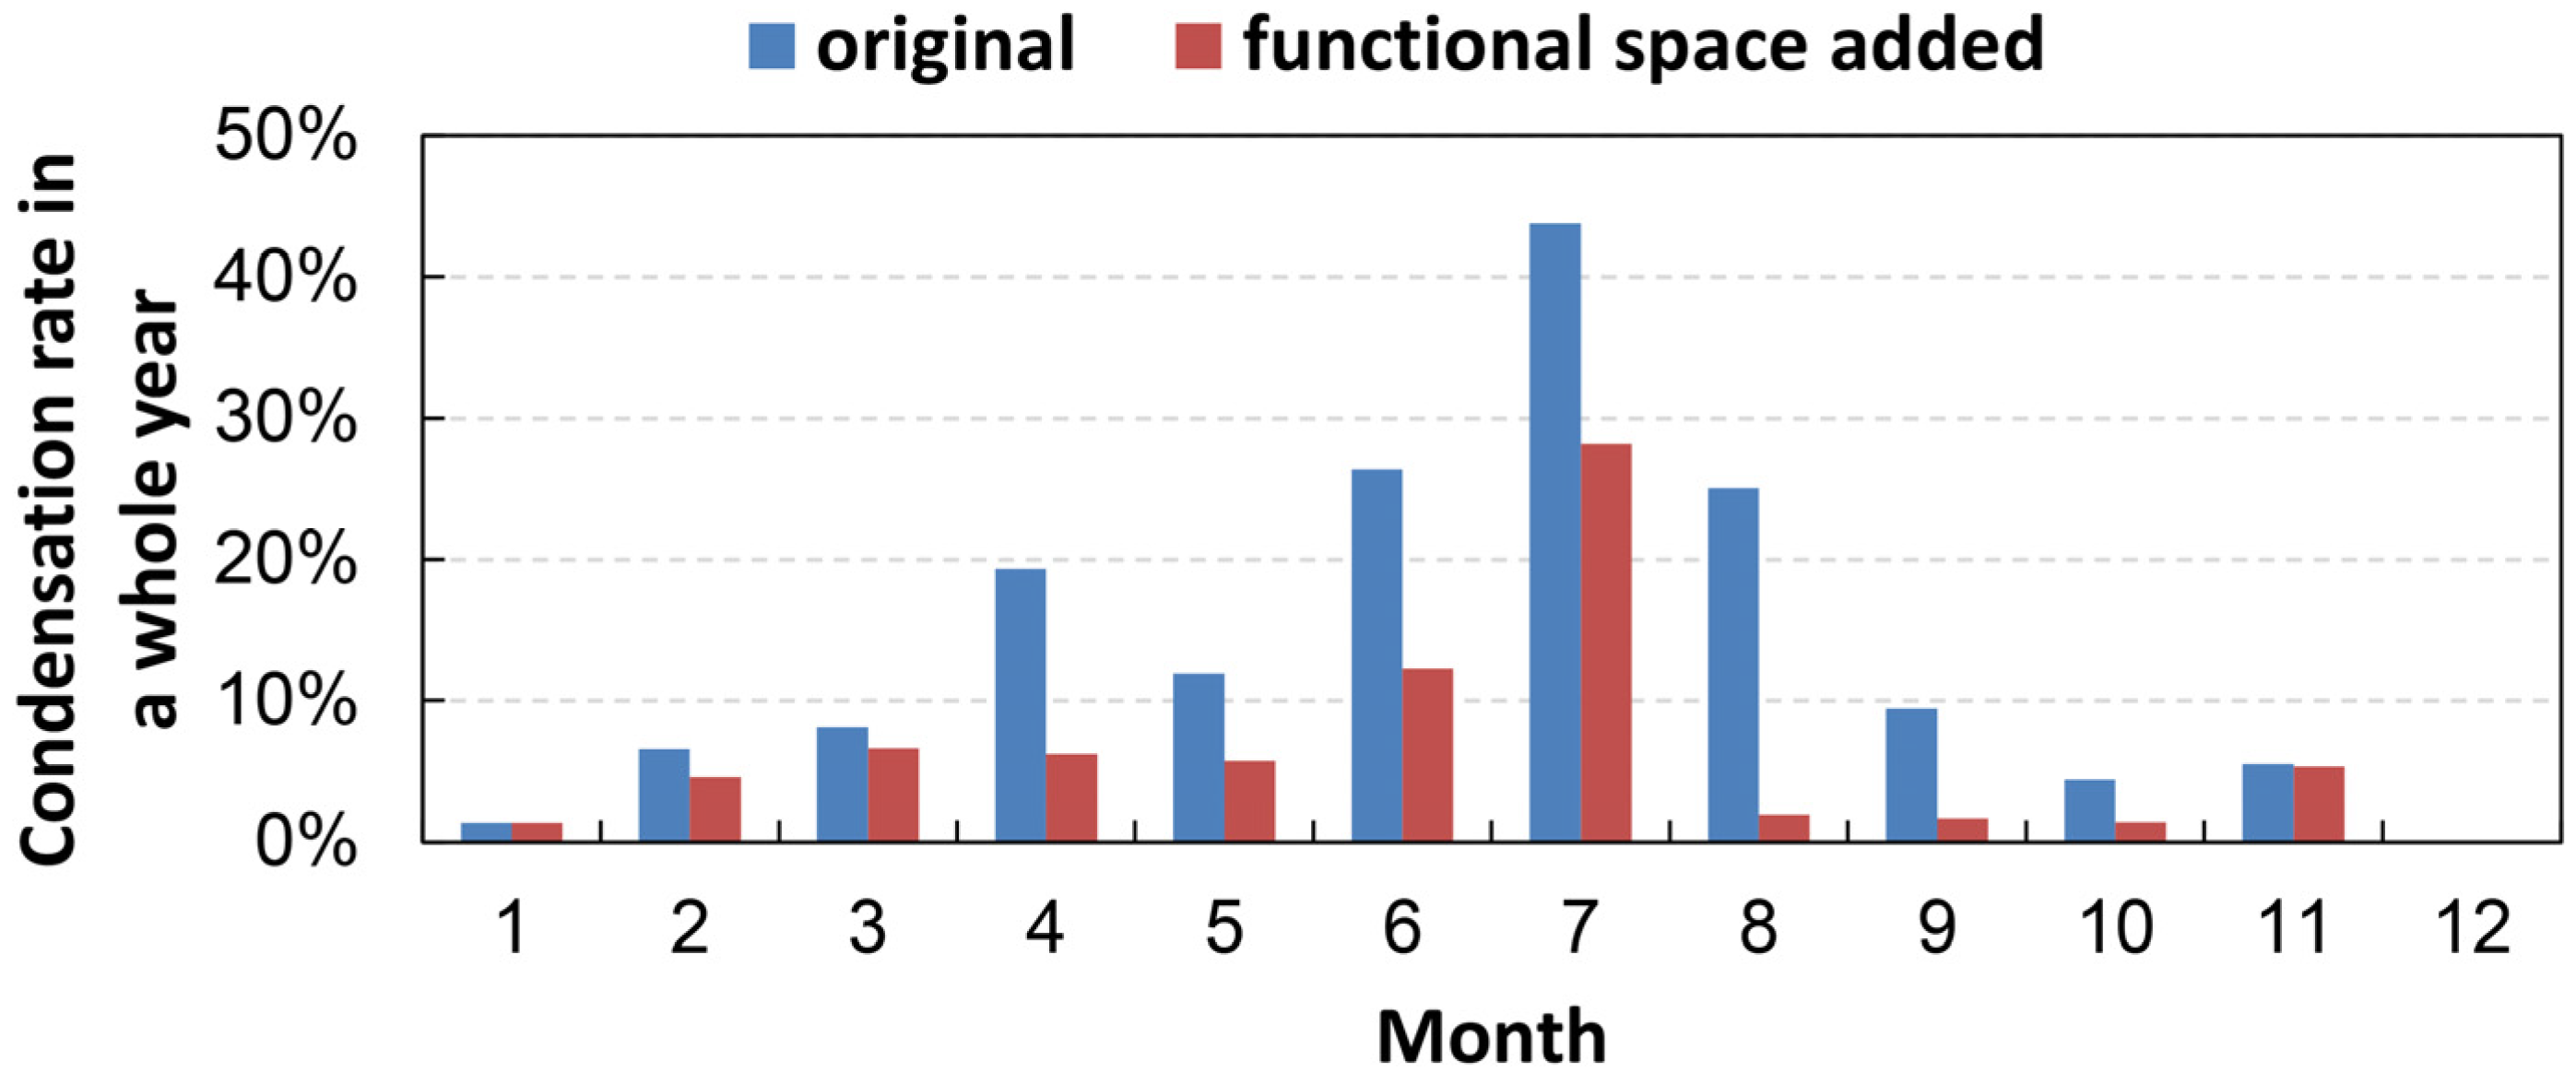
To examine how the fraction of condensation area in the inner surface of the tomb chamber changed in a whole year, the condensation fraction on the wall surface in each month is shown in Figure 23.
Figure 23 shows that condensation frequently occurred from April to August in the original case while it occurred from June to July after the functional space was added. The condensation occurred nearly the whole year even after the functional space was added. This may be because the ground water level is high, about 60 cm below the tomb floor. Under the influence of the underground water, the water content at the lower part of the tomb remains high all year round.
Even after the functional space was added, condensation still occurred, but the average condensation rate through the whole year reduced by 53% from 13.5% to 6.3% (Table 7).
It is clear that the addition of the functional space was effective to reduce the occurrence of condensation in the tomb chamber. The increase in the temperature on the tomb wall surface shown in Figure 10, Figure 11, Figure 12 and Figure 13 is the main reason for the reduction of the condensation. When the condensation on the wall surface decreases, the growth of microorganisms on the wall surface can be expected to be inhibited.

5. Conclusions

Biodeterioration is highly related to the mild temperature and the high humidity in the tomb chamber and the condensation on the wall surface. After a functional space utilizing solar energy was added to the protective shed of the Eastern Wu tomb, the annual average temperature on the surface of the tomb chamber increased about 0.7 °C, the relative humidity of the air in the tomb chamber decreased by about 5.0%, and the condensation occurrence on the wall surface was reduced by 53%.
For the protection of masonry building heritage, functional spaces such as sunrooms can reduce the condensation on the wall surface of the building, and thus are effective at suppressing biodeterioration in the site and conserving architectural heritage. Compared with the spraying of mold-proof reagents on the architectural heritage or the irradiation of the site with microwave irradiation, this method is less intrusive to the heritage itself.
Meanwhile, the functional space in this study is a simple, passive and economic environmental control system with no management costs over time (when with a fan driven by solar panel), which is very important for conservation management. Architects can consider specific designs like this functional space when designing protective and display facilities for architectural heritage.

Author Contributions

Conceptualization, Y.L.; methodology, Y.L., Y.F. and Z.K.; validation, Y.L., S.H., and Y.F.; formal analysis, Y.F.; investigation, Y.L., Y.F., and Z.K.; resources, Y.L.; data curation, Y.L. and Z.K.; writing—original draft preparation, Y.F.; writing—review and editing, Y.L. and S.H.; visualization, Y.F.; supervision, Y.L. and S.H.; project administration, Y.L.; funding acquisition, Y.L. All authors read and agreed to the published version of the manuscript.

Funding

This research was funded by the China National Key R&D Program during the 13th Five-year Plan Period (Grant No. 2019YFC1520700) and the National Nature Science Foundation of China (Grant No. 51878140).

Conflicts of Interest

The authors declare no conflicts of interest. The funders had no role in the design of the study; in the collection, analyses, or interpretation of data; in the writing of the manuscript; or in the decision to publish the results.

References

  1. Wang, Z.; Ma, T.; Gong, J. Surmising the Tomb Owner of the Eastern Wu at Shangfang Village, Jiangning District, Nanjing: Concurrently Discussing the Clan Tombs of the Eastern Wu. Southeast Cult. 2009, 3, 41–50. [Google Scholar]
  2. Wang, Z.; Ma, T.; Gong, J.; Zhou, W.; Xu, C.; Zhou, R.; Cui, S.; Dong, B.; Wang, Q.; Li, Y. Excavation of the tomb of State Wu of the Three Kingdoms Period in Shangfang town, Nanjing City. Cult. Reli. 2008, 12, 4–35. [Google Scholar]
  3. Kiurski, J.S.; Ranogajec, J.G.; Ujhelji, A.L.; Radeka, M.M.; Bokorov, M.T. Evaluation of the effect of lichens on ceramic roofing tiles by scanning electron microscopy and energy-dispersive spectroscopy analyses. Scanning 2005, 27, 113–119. [Google Scholar] [CrossRef] [PubMed]
  4. Radeka, M.; Kiurski, J.; Markov, S.; Marinkovi-Neduin, R.; Ranogajec, J. Microbial deterioration of clay roofing tiles. In WIT Transactions on the Built Environment; WIT Press: Ashurst, UK, 2007; Volume 95, pp. 567–575. [Google Scholar] [CrossRef] [Green Version]
  5. Vasanthakumar, A.; DeAraujo, A.; Mazurek, J.; Schilling, M.; Mitchell, R. Microbiological survey for analysis of the brown spots on the walls of the tomb of King Tutankhamun. Int. Biodeterior. Biodegrad. 2013, 79, 56–63. [Google Scholar] [CrossRef]
  6. Savković, Ž.; Unković, N.; Stupar, M.; Franković, M.; Jovanović, M.; Erić, S.; Šarić, K.; Stanković, S.; Dimkić, I.; Vukojević, J.; et al. Diversity and biodeteriorative potential of fungal dwellers on ancient stone stela. Int. Biodeterior. Biodegrad. 2016, 115, 212–223. [Google Scholar] [CrossRef]
  7. Tonon, C.; Favero-Longo, S.E.; Matteucci, E.; Piervittori, R.; Croveri, P.; Appolonia, L.; Meirano, V.; Serino, M.; Elia, D. Microenvironmental features drive the distribution of lichens in the House of the Ancient Hunt, Pompeii, Italy. Int. Biodeterior. Biodegrad. 2019, 136, 71–81. [Google Scholar] [CrossRef]
  8. Larbi, J.A. Microscopy applied to the diagnosis of the deterioration of brick masonry. Constr. Build. Mater. 2004, 18, 299–307. [Google Scholar] [CrossRef]
  9. Ranogajec, J.; Radosavljević, S.; Marinković-Nedućin, R.; Živanović, B. Chemical corrosion phenomena of roofing tiles. Ceram. Int. 1997, 23, 99–103. [Google Scholar] [CrossRef]
  10. Albertano, P.; Bruno, L.; Bellezza, S.; Paradossi, G. Polysaccharides as a Key Step in Stone Bio-Erosion. In Proceedings of the 9th International Congress on Deterioration and Conservation of Stone, Venice, Italy, 19–24 June 2000; Elsevier: Amsterdam, The Netherlands, 2000; pp. 425–432. [Google Scholar] [CrossRef]
  11. Suihko, M.L.; Alakomi, H.L.; Gorbushina, A.; Fortune, I.; Marquardt, J.; Saarela, M. Characterization of aerobic bacterial and fungal microbiota on surfaces of historic Scottish monuments. Syst. Appl. Microbiol. 2007, 30, 494–508. [Google Scholar] [CrossRef]
  12. Hyvärinen, A.; Meklin, T.; Vepsäläinen, A.; Nevalainen, A. Fungi and actinobacteria in moisture-damaged building materials—Concentrations and diversity. Int. Biodeterior. Biodegrad. 2002, 49, 27–37. [Google Scholar] [CrossRef]
  13. Smith, S.L.; Hill, S.T. Influence of temperature and water activity on germination and growth of Aspergillus restrictus and A. versicolor. Trans. Br. Mycol. Soc. 1982, 79, 558–560. [Google Scholar] [CrossRef]
  14. Sedlbauer, K.; Krus, M. A New Model for Mould Prediction and Its Application in Practice. In Proceedings of the 2nd International Conference on Building Physics, Antwerp, Belgium, 14–18 September 2003; pp. 921–927. [Google Scholar]
  15. Hens, H.; Senave, E. IEA Annex 14: The Zolder Case Study. Indoor Air 1991, 1, 213–228. [Google Scholar] [CrossRef]
  16. Vereecken, E.; Roels, S. Review of mould prediction models and their influence on mould risk evaluation. Build. Environ. 2012, 51, 296–310. [Google Scholar] [CrossRef] [Green Version]
  17. Grant, C.; Hunter, C.A.; Flannigan, B.; Bravery, A.F. The moisture requirements of moulds isolated from domestic dwellings. Int. Biodeterior. 1989, 25, 259–284. [Google Scholar] [CrossRef]
  18. Bastian, F.; Jurado, V.; Nováková, A.; Alabouvette, C.; Saiz-Jimenez, C. The microbiology of Lascaux Cave. Microbiology 2010, 156, 644–652. [Google Scholar] [CrossRef] [PubMed] [Green Version]
  19. Saiz-Jimenez, C.; Cuezva, S.; Jurado, V.; Fernandez-Cortes, A.; Porca, E.; Benavente, D.; Cañaveras, J.C.; Sanchez-Moral, S. Paleolithic art in peril: Policy and science collide at altamira cave. Science 2011, 334, 42–43. [Google Scholar] [CrossRef] [Green Version]
  20. Saiz-Jimenez, C. Microbiological and environmental issues in show caves. World J. Microbiol. Biotechnol. 2012, 28, 2453–2464. [Google Scholar] [CrossRef]
  21. Clarke, J.A.; Johnstone, C.M.; Kelly, N.J.; McLean, R.C.; Anderson, J.A.; Rowan, N.J.; Smith, J.E. A technique for the prediction of the conditions leading to mould growth in buildings. Build. Environ. 1999, 34, 515–521. [Google Scholar] [CrossRef]
  22. Rowan, N.J.; Johnstone, C.M.; McLean, R.C.; Anderson, J.G.; Clarke, J.A. Prediction of toxigenic fungal growth in buildings by using a novel modelling system. Appl. Environ. Microbiol. 1999, 65, 4814–4821. [Google Scholar] [CrossRef] [Green Version]
  23. Sedlbauer, K.; Krus, M.; Zillig, W.; Künzel, H.M. Mold Growth Prediction by Computational Simulation. In Proceedings of the IAQ Conference, San Francisco, CA, USA, 4–7 November 2001. [Google Scholar]
  24. Li, Y.; Ogura, D.; Hokoi, S.; Ishizaki, T. Effects of emergency preservation measures following excavation of mural paintings in Takamatsuzuka Tumulus. J. Build. Phys. 2012, 36, 117–139. [Google Scholar] [CrossRef]
  25. Hale, M. Control of Biological Growths on Mayan Archaeological Ruins in Guatemala and Honduras; National Geographic Research Reports: Washington, DC, USA, 1980. [Google Scholar]
  26. Huang, G.; Ye, L.; Lan, X.; Chen, H.; Li, J.; Liu, C. The inhibitory effect of Kathon on the mildew on the surface of Bailiandong Site in Liuzhou. J. Guangxi Univ. Sci. Technol. 2019, 30, 97–106. [Google Scholar] [CrossRef]
  27. Xia, Y.; Zhang, M.; Zhang, S.; Fu, Q.; Huang, J.; Yan, S.; Sun, Z.; Xu, J.; Zhou, T. Progress in the prevention and treatment of soluble salt and fungus damage on soil site in the museum. Sci. Conserv. Archaeol. 2013, 25, 114–119. [Google Scholar] [CrossRef]
  28. Helmi, F.M.; Ali, N.M.; Ismael, S.M. Nanomaterials for the inhibition of microbial growth on ancient Egyptian funeral masks. Mediterr. Archaeol. Archaeom. 2015, 15, 87–95. [Google Scholar] [CrossRef]
  29. Li, Y.; Wang, L. Research progress of Nano material applied to the conservation of cultural heritage. Mater. Rep. 2011, 25, 34–37. [Google Scholar] [CrossRef]
  30. Pandey, J.K.; Raghunatha Reddy, K.; Pratheep Kumar, A.; Singh, R.P. An overview on the degradability of polymer nanocomposites. Polym. Degrad. Stab. 2005, 88, 234–250. [Google Scholar] [CrossRef]
  31. Matsumoto, M. Simultaneous Heat and Moisture Transfer and Moisture Accumulation in Building Materials. Ph.D. Thesis, Kyoto University, Kyoto, Japan, 1978. [Google Scholar]
  32. Matsumoto, M.; Hokoi, S.; Hatano, M. Model for simulation of freezing and thawing processes in building materials. Build. Environ. 2001, 36, 733–742. [Google Scholar] [CrossRef]
  33. Arya, L.M.; Leij, F.J.; Shouse, P.J.; van Genuchten, M.T. Relationship between the Hydraulic Conductivity Function and the Particle-Size Distribution. Soil Sci. Soc. Am. J. 1999, 63, 1063–1070. [Google Scholar] [CrossRef]
  34. Dou, N. Research on Environental Control of Protection and Display Facilities for Brick Archeological Site—Taking the Sun Wu Tomb in Nanjing Shangfang as an Example. Master’s Thesis, Southeast University, Nanjing, China, 2018. [Google Scholar]
  35. Johansson, S.; Wadsö, L.; Sandin, K. Estimation of mould growth levels on rendered façades based on surface relative humidity and surface temperature measurements. Build. Environ. 2010, 45, 1153–1160. [Google Scholar] [CrossRef] [Green Version]
  36. Li, Y.; Ogura, D.; Hokoi, S.; Wang, J.; Ishizaki, T. Predicting hygrothermal behavior of an underground stone chamber with 3-D modeling to restrain water-related damage to mural paintings. J. Asian Archit. Build. Eng. 2014, 13, 499–506. [Google Scholar] [CrossRef] [Green Version]
Figure 1. The Eastern Wu tomb in the protective shed.
Energies 13 01652 g001
Figure 2. Plan of the Eastern Wu tomb.
Energies 13 01652 g002
Figure 3. (a) Distribution of biodeterioration in Section 1-1 (Figure 2); (b) Biodeterioration detail.
Energies 13 01652 g003
Figure 4. Monitoring scheme.
Energies 13 01652 g004
Figure 5. Calculation region and the boundary conditions.
Energies 13 01652 g005
Figure 6. (a) Air temperature in the tomb chamber and the outside; (b) Relative humidity in the tomb chamber and the outside.
Energies 13 01652 g006
Figure 7. Schematic diagram of the proposed method.
Energies 13 01652 g007
Figure 8. Outline of functional space: (a) Plan; (b) Section 1-1.
Energies 13 01652 g008
Figure 9. Four simulation points.
Energies 13 01652 g009
Figure 10. Point 1—temperature change.
Energies 13 01652 g010
Figure 11. Point 2—temperature change.
Energies 13 01652 g011
Figure 12. Point 3—temperature change.
Energies 13 01652 g012
Figure 13. Point 4—temperature change.
Energies 13 01652 g013
Figure 14. Point 1—water content change.
Energies 13 01652 g014
Figure 15. Point 2—water content change.
Energies 13 01652 g015
Figure 16. Point 3—water content change.
Energies 13 01652 g016
Figure 17. Point 4—water content change.
Energies 13 01652 g017
Figure 18. Comparison of air temperatures in the tomb chamber.
Energies 13 01652 g018
Figure 19. Comparison of relative humidity.
Energies 13 01652 g019
Figure 20. Comparison of Absolute humidity.
Energies 13 01652 g020
Figure 21. Position of simulation segments.
Energies 13 01652 g021
Figure 22. Condensation days on each segment.
Energies 13 01652 g022
Figure 23. Condensation fraction in each month—comparison between original and functional space added cases.
Energies 13 01652 g023
Table 1. Air exchange rates.
PositionAir Exchange Rate (Times/Hour)
Between the tomb chamber and the protective shed3
Between the protective shed and the outside3.2
Table 2. Air exchange rates between the functional space and the tomb chamber.
ConditionsAir Exchange Rate (Times/Hour)
March-October2
January-February or November-December and Tf > Tr2
January-February or November-December and TfTr0
Tf: air temperature in the functional space; Tr: air temperature in the tomb.
Table 3. Statistics of the air temperature in the tomb chamber.
StatisticsOriginal Case (°C)Functional Space Added (°C)Difference (°C)
maximum30.734.63.9
minimum0.70.80.1
average17.018.21.2
standard deviation7.48.10.7
Table 4. Statistics of relative humidity in the tomb chamber.
StatisticsOriginal CaseFunctional Space AddedDifference
maximum100%100%0.0%
minimum69.8%58.9%−10.9%
average90.6%85.6%−5.0%
standard deviation5.3%8.0%2.7%
Table 5. Statistics of absolute humidity in the tomb chamber.
StatisticsOriginal Case
(kg/m³)
Functional Space Added
(kg/m³)
Difference
(kg/m³)
maximum0.0320.0350.003
minimum0.0040.0040
average0.0150.0150
standard deviation0.0070.0080.001
Table 6. Condensation days on average at each simulation point on segments E to G.
Segment(s)Original CaseFunctional Space AddedDifference
E5423−31
F10952−57
G5822−36
E-G9444−50
Table 7. Monthly rate of condensation.
StatisticsOriginal CaseFunctional Space AddedDifference
January1.3%1.3%−0.0%
February6.5%4.6%−1.9%
March8.1%6.6%−1.5%
April19.3%6.2%−13.1%
May11.9%5.7%−6.2%
June26.4%12.2%−14.2%
July43.7%28.2%−15.5%
August25.0%2.0%−23.0%
September9.4%1.6%−7.8%
October4.4%1.4%−3.0%
November5.5%5.3%−0.2%
December00−0.0%
Average (whole year)13.5%6.3%−7.2%