Article

High Reynold’s Number Turbulent Model for Micro-Channel Cold Plate Using Reverse Engineering Approach for Water-Cooled Battery in Electric Vehicles

1
Mechanical and Mechatronic Engineering Department, University of Waterloo, 200 University Avenue West, Waterloo, ON N2L 3G1, Canada
2
Detroit Engineering Products, 850 East Long Lake Road, Troy, MI 48085, USA
3
Chemical Engineering Department, University of Waterloo, 200 University Avenue West, Waterloo, ON N2L 3G1, Canada
*
Author to whom correspondence should be addressed.
Energies 2020, 13(7), 1638; https://doi.org/10.3390/en13071638
Submission received: 4 March 2020 / Revised: 22 March 2020 / Accepted: 30 March 2020 / Published: 2 April 2020
(This article belongs to the Special Issue Energy Storage Systems for Electric Vehicles)

Abstract

:
The investigation and improvement of the cooling process of lithium-ion batteries (LIBs) used in battery electric vehicles (BEVs) and hybrid electric vehicles (HEVs) are required in order to achieve better performance and longer lifespan. In this manuscript, the temperature and velocity profiles of cooling plates used to cool down the large prismatic Graphite/LiFePO4 battery are presented using both laboratory testing and modeling techniques. Computed tomography (CT) scanning was utilized for the cooling plate, Detroit Engineering Products (DEP) MeshWorks 8.0 was used for meshing of the cooling plate, and STAR CCM+ was used for simulation. The numerical investigation was conducted for higher C-rates of 3C and 4C with different ambient temperatures. For the experimental work, three heat flux sensors were attached to the battery surface. Water was used as a coolant inside the cooling plate to cool down the battery. The mass flow rate at each channel was 0.000277677 kg/s. The k-ε model was then utilized to simulate the turbulent behaviour of the fluid in the cooling plate, and the thermal behaviour under constant current (CC) discharge was studied and validated with the experimental data. This study provides insight into thermal and flow characteristics of the coolant inside a cooing plate, which can be used for designing more efficient cooling plates.

Graphical Abstract

1. Introduction

The collective effects of global warming, environmental degradation, and energy crisis have prompted attention towards clean and sustainable energy [1]. However, there is inconsistency of renewable energy harvesting, since it depends on the effects of climate, which could result in complications in providing sufficient electricity in contrast with traditional nonrenewable energy sources. This has led to an interest in developing large-scale energy storage systems (ESS), for which batteries show promise [2]. Among the available secondary batteries, lithium-ion and lead-acid are broadly considered as effective candidates for energy storage systems. In the automotive industry, plug-in hybrid electric vehicles (PHEVs), hybrid electric vehicles (HEVs), and battery electric vehicles (BEVs) commonly utilize lithium-ion batteries (LIBs) [3]. The widespread use of LIBs is the result of 1) high specific power and energy densities [4]; 2) high nominal voltage and low self-discharge rate [5]; and 3) long cycle-life and no memory influence [6,7]. All these characteristics are required for electric vehicles (EVs) to achieve desirable driving range and vehicle speed [8]. In addition to the driving range and vehicle speed, the life cycle of the LIBs is also a critical factor in EVs. Some important factors in determining the allowable discharging and charging currents (also known as C-rates) and the batteries’ life cycle are battery materials, working temperature, and assembling process. Current research on enhancing the life cycle of a battery has mainly been focused on the improvement in the materials and assembling technology, with a specific goal to obtain desired energy density. In addition, little attention has been directed toward the advancement and change of battery cooling systems (BCS) [9].
Pouch-type LIBs are being commonly utilized in new EVs. However, many problems in their safety and life span remain. First, when using the pouch-type lithium-ion battery, particularly in cases of high discharge rate, high heat generation may occur [10]. This type of battery expands due to overheating when the heat is not removed promptly. In some cases, the LIB may even burst and explode. In addition, these pouch-type batteries are connected either in parallel or in series within the LIB packs or modules, which also generate high amount of heat during both discharging and charging. Therefore, a good battery thermal management system (BTMS) is necessary [11]. The heat of LIBs increases when EVs accelerate and experience fast charging. If this generated heat is not adjusted or if it is overtaken by the rate of heat production, the battery pack temperature drastically increases. A high operating temperature of lithium-ion batteries can lead to capacity fade of the battery [12]. The impact of high working temperatures on the execution of a LIB, particularly for cylindrical battery cells (Sony 18650), was researched by Ramadass et al. [13] and the prismatic LIB cell (A123 20 Ah) was explored by Panchal et al. [14]. The authors found that the capacity fading is not the main negative impact related to high working temperatures of the battery; it also may lead to the explosion of the electrolyte. In addition, thermal runaway of a LIB cell can cause the whole LIB pack to fail [15]. In addition, there is a major effect on the electrochemical behaviors in terms of the degradation of electrolyte, electrodes, separator, and the life cycle cost [14,16]. Hence, a robust BTMS is required, to achieve better LIB pack performance in low-temperature conditions and a better lifespan in high-temperature conditions [12,17,18]. A typical operating range is between 20 °C and 40 °C [19], and an extended range is between −10 °C and +50 °C for certain applications [20].
Based on the coolant utilized in the BTMS, the BTMS can be divided into (1) air-, (2) fluid- or liquid-, and (3) phase change material (PCM)-based. For the air-based BTMS, cooling of the batteries is done by airflow passing between the batteries in a module or pack. The stream of air can come from the motion of the vehicle, and these types of systems are called natural air-cooled BTMS. If the airflow is generated by power-operated equipment, then these systems are called forced-air BTMS. The air streaming direction for air-based BCSs is usually 90 degrees to the axes for cylindrical batteries. Fluid-based BTMS utilizes coolants in the liquid phase, and such systems typically use power-operated equipment to move the coolant flow. In the PCM cooling method, the cooling is provided by the latent heat of the PCM, while in air- and liquid-cooling methods, the cooling is provided by sensible cooling. The advantages and disadvantages of air, fluid and PCM cooling are: (1) the air-cooling method is simple and lightweight [21]; (2) the water-cooling method is more efficient since it absorbs more heat, and takes less volume, yet more complexities are involved, including high weight and cost [22]; (3) in comparison with the air-cooling strategy, the liquid-cooling strategy provides better cooling performance owing to the high thermal conductivity of water compared to air [23]; and (4) because of the low thermal conductivity of air [24], a high speed of air is required in order to provide adequate cooling for LIBs [25,26]. The advantage of PCM over fluid and air-based strategies is better temperature consistency throughout the battery pack. Most recent examples of EVs and HEVs that utilize air-based cooling systems are the Toyota Prius, the Nissan Leaf, and the Honda Insight [27]. A very noted use of fluid-cooling systems for thermal management of LIBs is in Tesla vehicles, including the Roadster. These cooling techniques utilize a 50/50 mixture of water and glycol to keep the battery pack temperature within the appropriate limits [28]. Both the Chevrolet Bolt and BMW i3 utilize a bottom-cooling plate in their battery packs, with the cooling medium being a water-glycol solution for the Chevrolet and a refrigerant for the BMW [29]. The objective of this study is to conduct a reverse engineering study to experimentally investigate the design and heat generation of the 20 Ah lithium-ion battery with the cold plate. Subsequently, heat flux data and developed CAD modeling will be used to numerically characterize the thermal and flow behaviors of coolant in the cold plate at different inlet coolant temperatures and higher C-rates. The study provides insight into thermal and flow characteristics of the coolant inside a cooing plate which can be used for future improvements of the cooling plate.

2. State of the Art

According to the research by several scholars from all over the world, there are numerous papers available on BTMS with air, water, and PCM cooling, and battery modeling in the open literature [28,29,30,31,32,33].
Al-Hallaj et al. [34] were the first to utilize a PCM experiencing a solid to fluid change, and the authors used the PCM to cool down the 18,650 cylindrical-shaped lithium-ion batteries. In the BCS, they utilized a paraffin blend of pentacosane and hexacosane as the PCM. Moreover, for a passive cooling strategy, PCM-based BTMS is less expensive, requires smaller volume, and accomplishes preferred temperature consistency over air and fluid-based BTMS. The authors additionally utilized a commercial finite-element (FE) software, PDEase2D™, to simulate the thermal behavior of EV battery modules with a PCM BTMS. The authors claimed that the research was important for EV performance under cold conditions, or in space applications where the battery working temperature drops greatly when an orbiting satellite moves from the light to the dark side of the earth.
Zhang et al. [35] worked on the simulation of pouch-type LIB with thermal management using a cooling plate approach. The authors used a 22 Ah battery and developed a computational fluid dynamics (CFD) model using ANSYS Fluent. The authors studied the effect of inlet mass flow rate, difference in temperature, and pressure drop at 4C discharge rate, with the end goal of improving the efficiency and economy of the cooling plate. Their results demonstrated that the increase in mass flow rate of coolant reduced the maximum temperature and temperature difference of cells, but when mass flow rate exceeded 0.003 kg/s, then the economy of the cooling plate worsened.
Omkar et al. [36] developed a PCM/cooling-plate-coupled BTMS using CFD. The authors used LiFePO4/C as a battery and determined the heat generation in simulation. They varied several factors in simulating battery and cold plate, such as the inlet mass flow rate, PCM, thermal conductivity, direction of flow, water cooling, to know the impact on the cooling execution of module. The authors concluded that as the space between adjoining batteries increased, the most extreme temperature had little change, yet the temperature field was uniform.
Chen et al. [37] worked on the comparison of four diverse cooling strategies, including air cooling, indirect fluid cooling, direct fluid cooling, and fin cooling for LIB cells. The authors evaluated the effectiveness on the basis of coolant parasitic power utilization, temperature difference in a cell, the most extreme temperature rise, and extra weight utilized for the cooling strategy. The authors found that (1) to keep the same average temperature, an air cooling strategy needed two to three times more energy than other techniques; (2) an indirect liquid cooling strategy had the lowest maximum temperature rise; (3) a fin cooling system includes an approximately 40% higher weight of cell, and (4) indirect fluid cooling is more efficient than direct fluid cooling.
Lu et al. [38] worked on BTMS of thickly pressed EV batteries with forced-air cooling systems to investigate the air cooling capacity on the temperature consistency and hotspots alleviation of a smaller battery pack subject to different airflow rates as well as airflow paths. The authors used 252 cylindrical lithium-ion batteries (32650). Their numerical outcomes demonstrated that the effective improvement in heat transfer exchange zones between air-coolant and battery surfaces could bring down the highest temperature and improve the most extreme temperature variation in the thickly pressed battery box.
In another study, Qian et al. [39] worked on thermal performance of a thermal management system (TMS) of LIBs by using a minichannel cooling method. The authors utilized a fluid cooling technique based on mini-channel cold plate and later a 3D numerical model was developed. They investigated the effects of the direction of flow, the mass flow rate at the inlet, the impact of number of channels, and the channel width on the thermal performance of the pack. Their outcomes demonstrated that at 5C discharge, the TMS based on minichannel cooling plates was effective in cooling productivity and controlling the battery temperature. They also found that a five-channel cold-plate was sufficient to control the temperature by increasing the mass flow rate at the inlet.
Jarrett et al. [40] developed a CFD model of a battery cooling plate while considering the impact of working conditions on the ideal design of electric vehicle battery cooling plates. The authors considered three important performance measurements: (1) average temperature, (2) temperature consistency, and (3) drop in pressure. They identified that out of these three, temperature consistency was the most sensitive to the working conditions, particularly the circulation of the heat flux input and the flow rate of the coolant.
Zou et al. [41] worked on an experimental study on multiwalled carbon nanotube (MWCNT)-based, graphene-based and MWCNT/graphene-based PCM to enhance the thermal performance of lithium-ion BTMS. Their results demonstrated that a composite PCM mass ratio of 3:7 of the MWCNT/graphene could display the best synergistic improvement for the heat transfer effect, for which the thermal conductivity was increased by 31.8%, 55.4% and 124% compared to graphene-based composite PCM, MWCNT-based composite PCM and pure PCM respectively.
Greco et al. [42] developed a heat-pipe-based BTMS arranged in a sandwiched pattern to improve the cooling for EVs. The authors also built a 1D model utilizing the thermal circuit technique. The proposed model was contrasted to an analytical solution in view of variable partition and CFD simulations in 3D. They found that the higher surface contact of the heat pipes allowed a better cooling management compared to forced convection cooling.
Liang et al. [43] researched the thermal execution of a BTMS under various ambient temperatures using heat pipes. The authors examined impacts of environment temperature, coolant flow rate, coolant temperature, and start-up time on the thermal execution of BTMS. They also claimed that the power utilization can be minimized by diminishing run time of HP-BTMS.
Lastly, Wang et al. [44] experimentally examined a high capacity LiFePO4 battery pack at high temperatures and quick discharge using a novel fluid cooling method. They designed and developed thermal silica plate-based BTMS. Their test results demonstrated that adding the thermal silica plates significantly improved the cooling limit. This can enable the most extreme temperature distinction to be controlled at 6.1 °C and decrease the highest temperature by 11.3 °C in the battery module.
In the above paragraphs, various methods of lithium-ion BTMS have been studied, and the cooling plates cooling method demonstrates various practical application prospects. The main research contents of the existing literature on the cooling plate cooling methods include the impact of flow direction and mass flow rate. However, as a key part of the cooling system, the effect of external temperature (or boundary conditions) within mini channels was seldom studied. Therefore, in this paper, a cooling plate design and development was done in such a way that it gives maximum cooling close to the anode and the cathode, as the greatest heat production is close to electrodes of LIBs during high acceleration of EVs. A comprehensive examination and modeling was conducted on the cooling plate in the LIB system. From this, the investigation under the rates of 3C and 4C (constant current discharge), and operating conditions of 5 °C, 15 °C, 25 °C, and 35 °C was assessed in detail. In our previous CFD studies (Panchal et al. [45,46]), we designed and developed a cooling plate with only one channel composed of a single inlet and outlet, and put one on both the top and bottom of the battery to cool it down during the discharging rates of 1C, 2C, 3C, and 4C, and diverse cooling temperatures. In this paper, STAR CCM+ was used for CFD simulation and then the simulated results were validated with experimental data of various temperature and velocity profiles. The results of this research can assist in the design, development and optimization of a cooling-plate cooling system. The data generated is also helpful in battery thermal modeling and EVs development.
The rest of the manuscript is organized as follows. Section 3 introduces the experimental studies including laser scanning, heat flux locations on the surface of the battery, experimental plan and procedure. Section 4 explains the cooling plate physical model in detail, provides geometry and boundary conditions as well as meshing. Section 5 analyzes the results of the numerical calculation, specifically, the effect of inlet mass flow rate on the temperature and velocity profiles of the cooling plate mini channels. Section 6 presents a summary of the conclusions.

3. Experimental Studies

Here, the lab testing details are given through the laser scanning, test set-up, heat flux distributions, and testing plan and procedure.

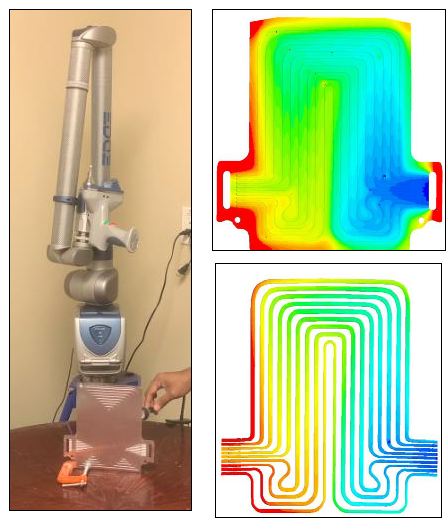
3.1. Reverse Engineering

For reverse engineering, we used a 25S2P battery pack in an EV. The battery pack and reverse engineering are shown in Figure 1.

3.2. Laser Scanning

The 3D laser-scanning machine used for this work is shown in Figure 2. It consists of probe, Light Emitting Diode (LED) indicators, wide stable joints, dampener, stable base, etc. The laser probe has an accuracy of ±25 µm (±0.001 in); field depth: 115 mm (4.5 in); width of effective scan: near field 3.1 in (80 mm), far field 5.9 in (150 mm); minimum point spacing: 40 µm (±0.0015 in); scan rate: 280 fps (frames/second), 280 fps × 2000, point/line = 560,000 points/sec; and laser class: 2 M. Arm specifications were measuring range: 1.8 m (6 ft); volumetric accuracy: ±0.034 mm (±0.0013 in); single point repeatability: 0.024 mm (0.0009 in); and seven-axis movement. After scanning the microchannel cooling plate, the image was transferred into CAD using DEP MeshWorks 8.0 software.

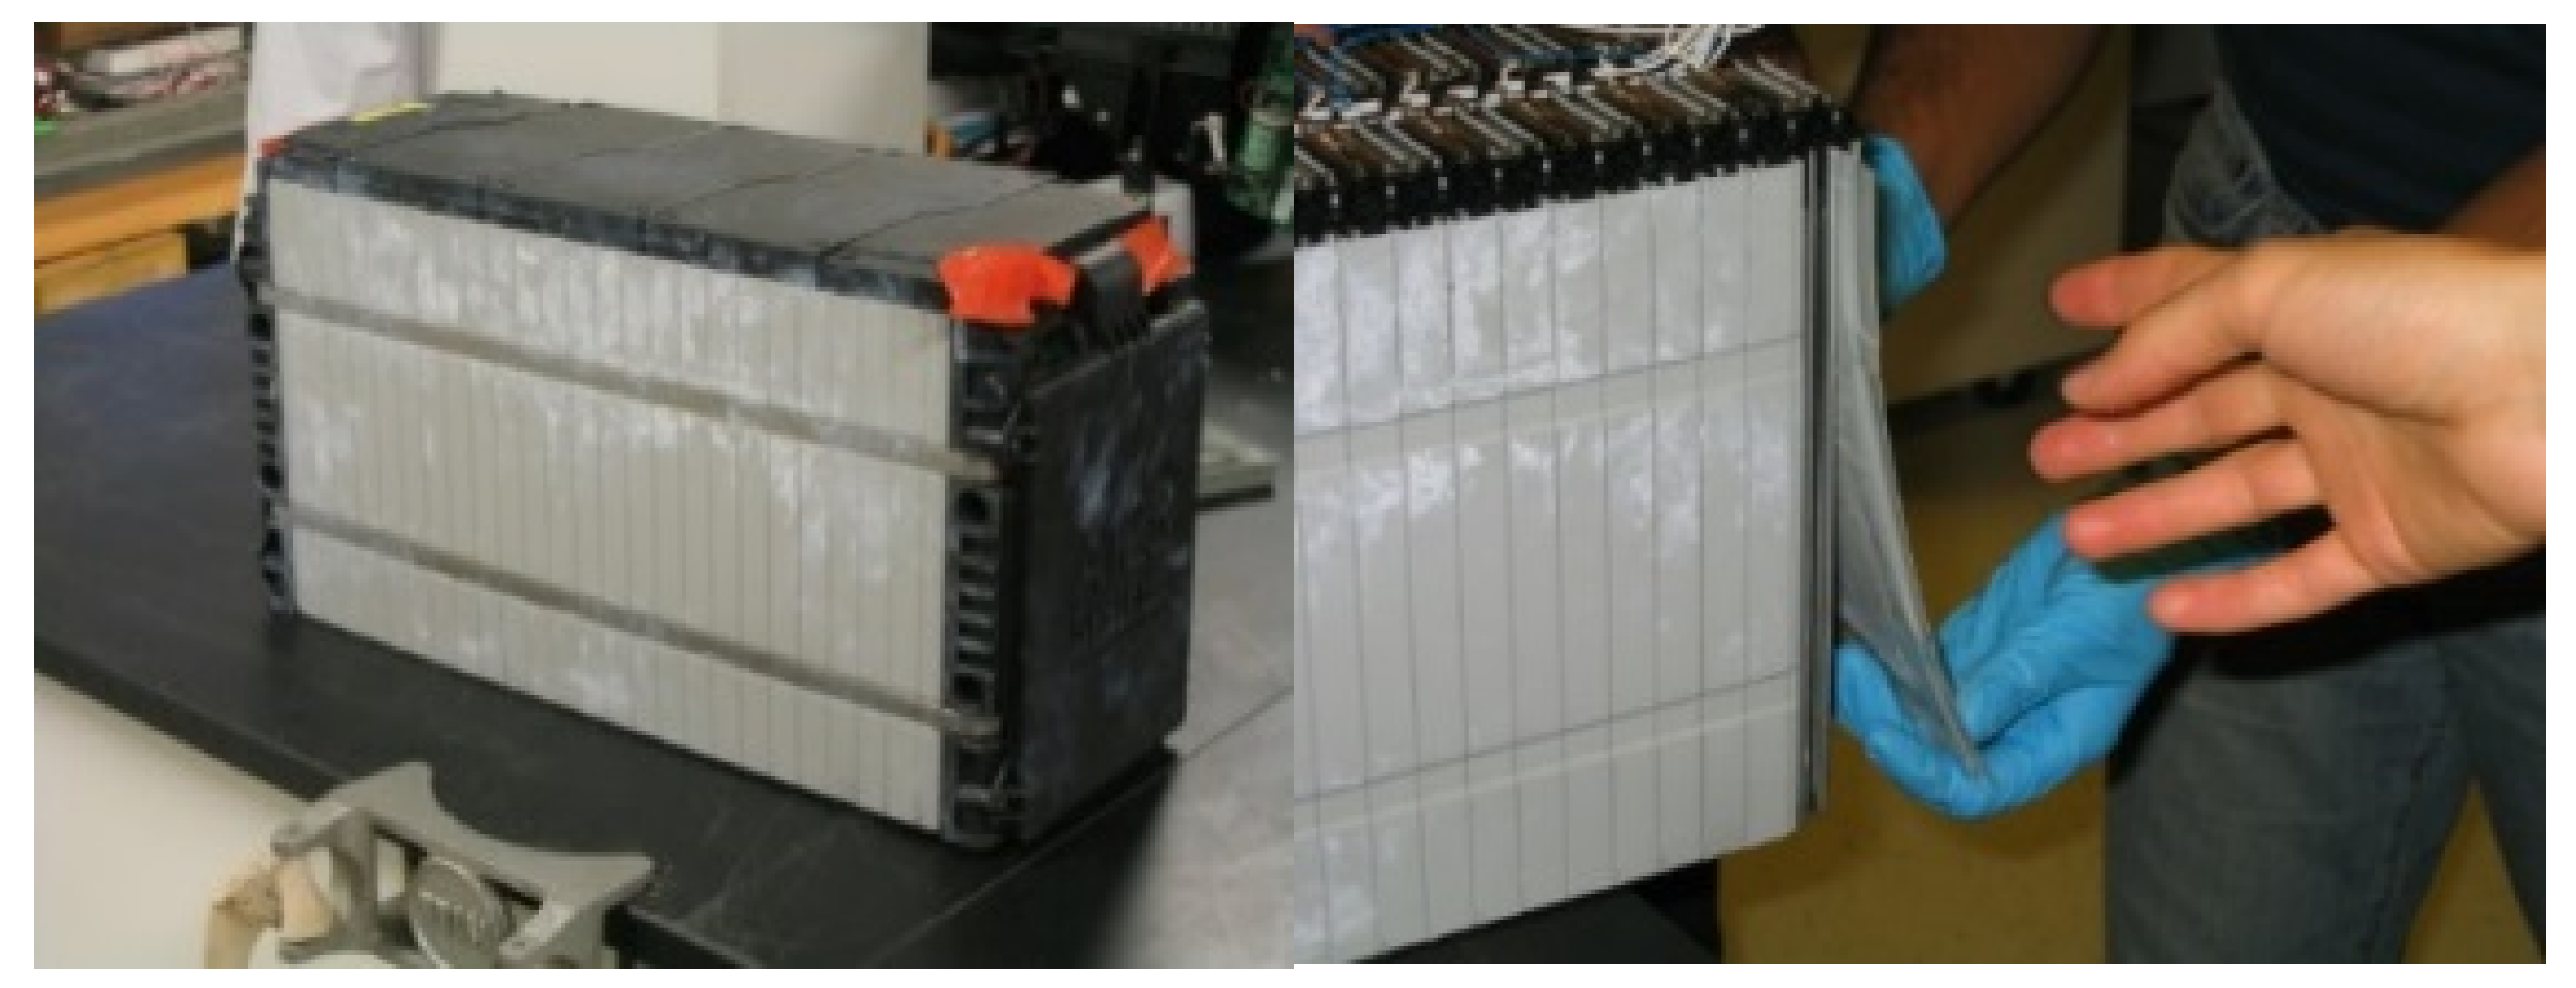
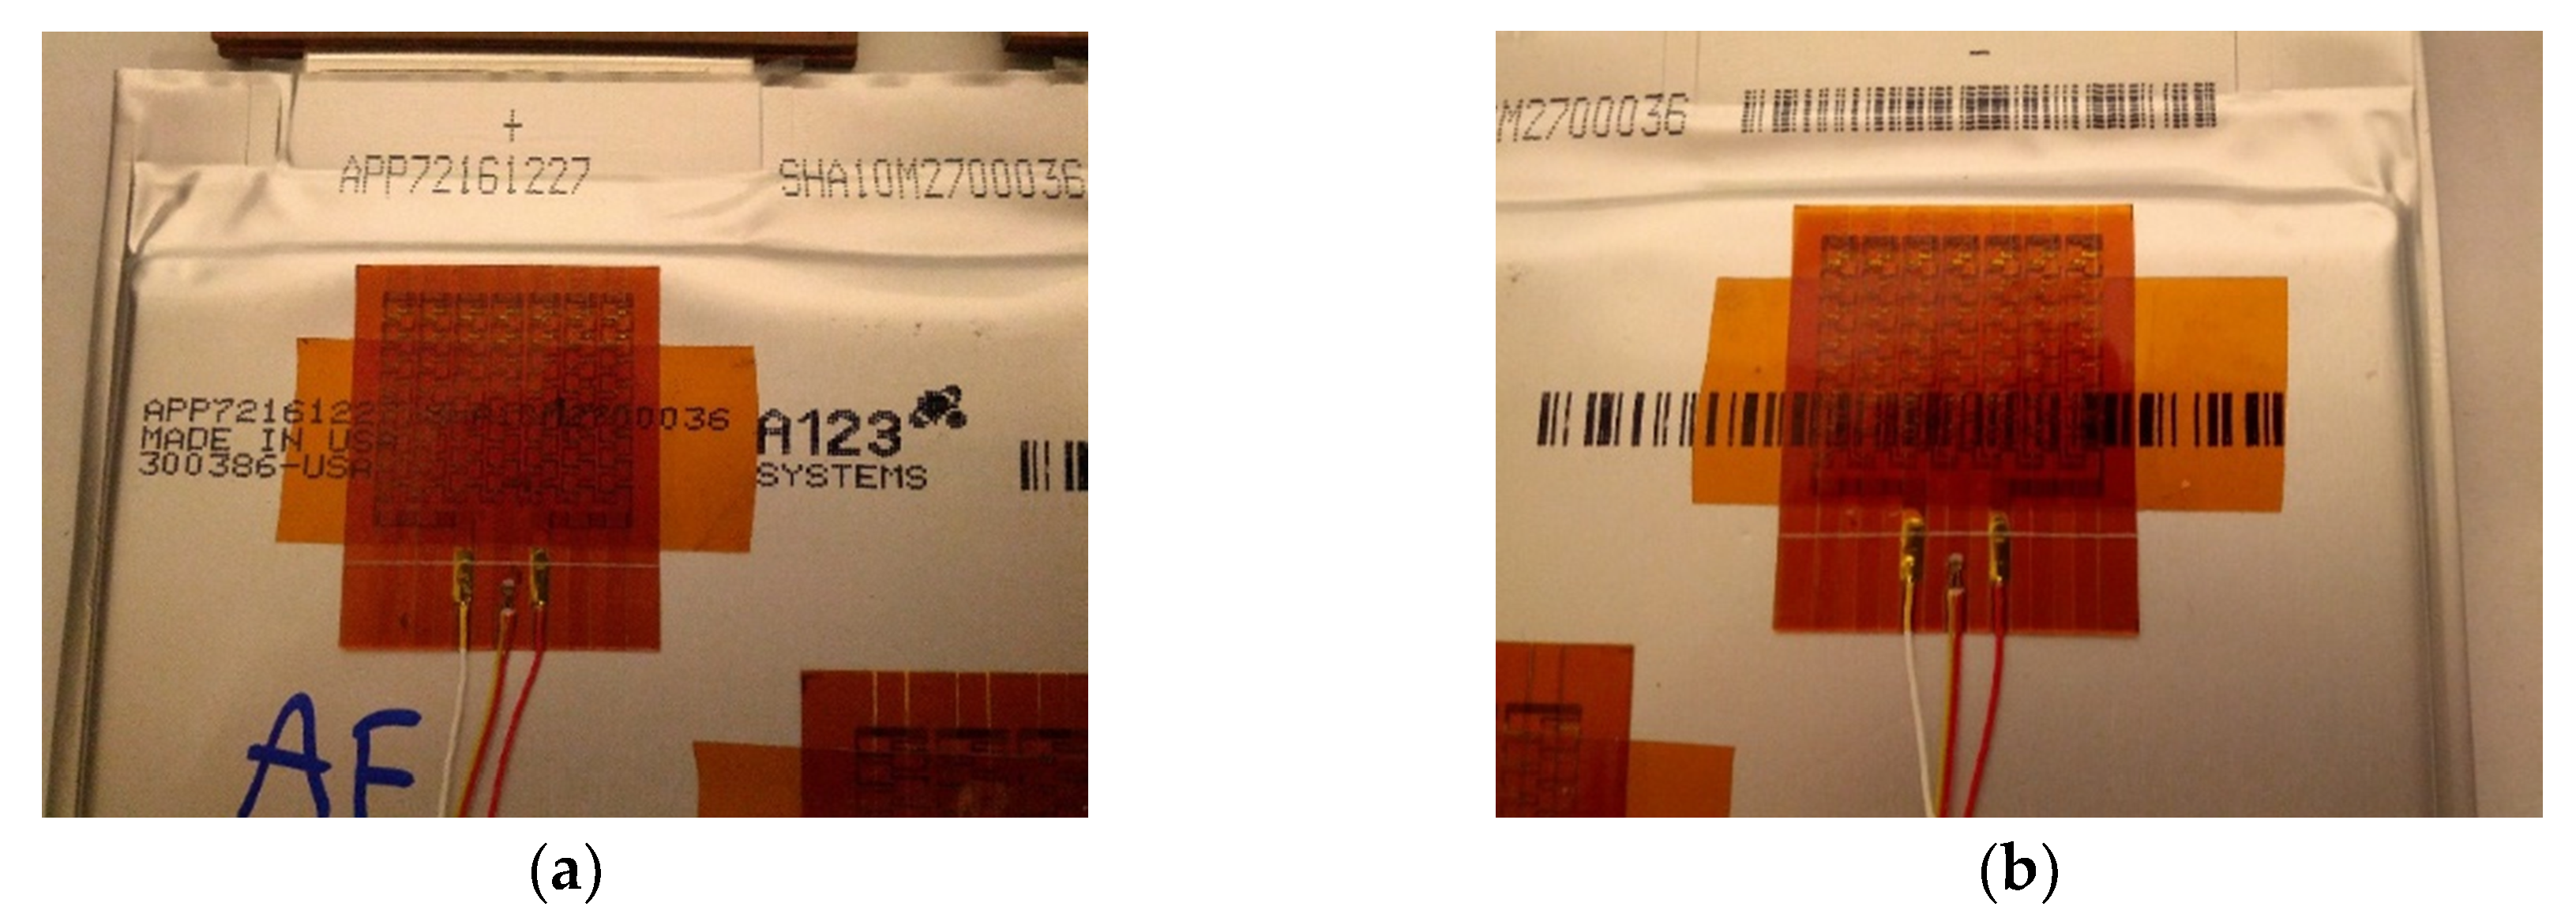
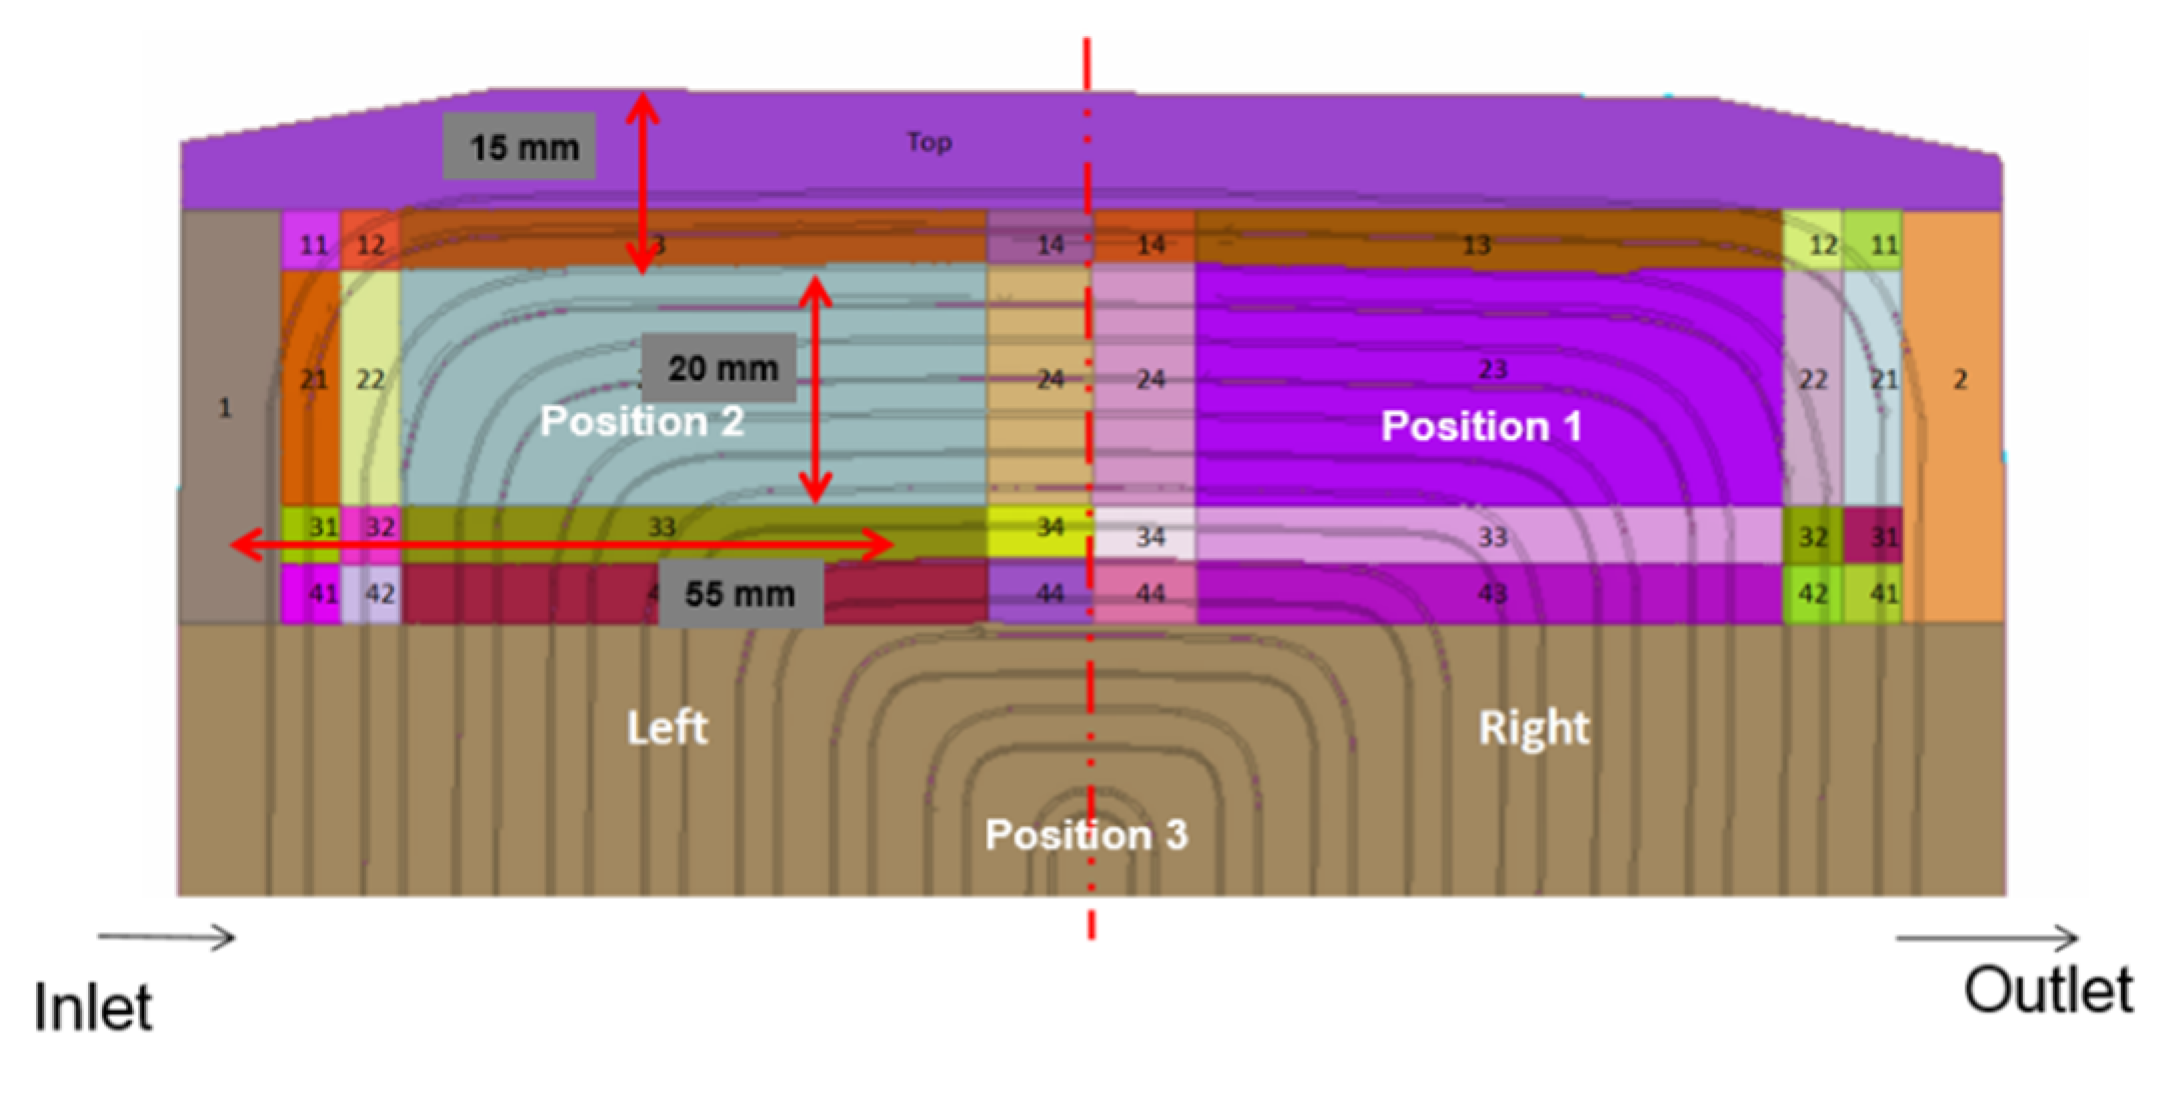
3.3. Battery Description, Experimental Set-up and Heat Flux Locations

The test set-up utilized for this work is explained in detail in our previously published paper [47]. In this work, a different cooling plate configuration was used. Three heat flux sensors were attached on the principle surface of the battery (one near the anode, one near the cathode, and one near the mid body) and the sensor measurements were used for simulation. The heat flux sensor location is shown Figure 3. A pouch-type 20-Ah-capacity LIB cell was utilized for the testing and model validation. Table 1 organizes the LIB cell technical details. The battery cell was placed between two cooling plates to form a sandwich structure.

3.4. Test Plan

In the experiment, four different fluid inlet temperatures were chosen for the water-cooling strategy: 5 °C, 15 °C, 25 °C, and 35 °C. Two distinctive discharge currents were selected: 60 A and 80 A (3C and 4C). The charge current is 20 A (1C). The testing sequence is presented in Table 2. The test layout and experimental uncertainty are available in our previously published paper [47].

4. Cold Plate Cooling System Modeling

4.1. Governing Equations

The fluid stream in this test was considered turbulent because the Reynold’s number was 8700. As such, the stream was modeled by Reynolds-averaged Navier–Stokes Equations (RANS). STAR CCM+ software was used for the CFD simulation. In this investigation, the realizable k-ɛ turbulence model was utilized because of the strengths of the model, which include reasonable precision for an extensive variety of flows and its demonstrated capacity in heat transfer and stream examination. The equations used in STAR CCM+ for turbulent kinetic energy and eddy viscosity were:
t ( ρ k ) + x i ( ρ k u i ) = x j [ ( μ + μ t σ k ) k x j ] + G k + G b ρ ε Y M + S k
t ( ρ ε ) + x i ( ρ ε u i ) = x j   [ ( μ + μ t σ ε ) ε x j ] + C 1 ε ε k ( G k + C 3 ε G b ) C 2 ε ρ ε 2 k + S ε
In the above equations, S k and S ε are user-defined source terms. Y M is the contribution of the fluctuating dilatation in compressible turbulence to the overall dissipation rate. G k is the production of turbulence kinetic energy due to the average speed gradients. G b is the generation of turbulence kinetic energy due to buoyancy. C 1 ε , C 2 ε , and C 3 ε represents the model constants, σ k and σ ε are the turbulent Prandtl numbers for k and ε , respectively. The turbulent (or eddy) viscosity was computed by combining k and ε as follows:
μ t = ρ C μ k 2 ε
where C μ is a constant. The model constants C 1 ε , C 2 ε , C μ , σ k and σ ε have default values of: C 1 ε = 1.44 , C 2 ε = 1.92 , C μ = 0.09 , σ k = 1.0 and σ ε = 1.3 .

4.2. CFD Modeling Details Using STAR CCM+

In a CFD simulation, the boundary condition “wall” is considered at locations where the stream cannot penetrate and includes walls, the ceiling, and the floor. The accompanying parameters were chosen for the model development: (1) the stream is incompressible, turbulent, and steady state; (2) water is selected as the working medium with 997.56 kg/m3 density; (3) The mass flow rate at each channel is 0.000277677 kg/s, while the aggregate mass flow rate at all nine channels is 0.002499003 kg/s; (4) the area at each channel is 5.272 × 10⁻⁷ m2; (5) the dynamic viscosity of 0.00088871 Pa s; (6) the specific heat is 4181.72 J/kg K; (7) the thermal conductivity is 0.62 W/m K; and (8) the turbulent Prandtl number is 0.9. In addition to this, the thermal conductivity of the outlet aluminum cover is 237 W/m K, the density of cover is 2702 kg/m3, and specific heat is 903 J/kg K. The selected parameters for model set-up were (1) flow: turbulent; (2) fluid: incompressible; (3) time: steady state; (4) realizable K-epsilon (RANS); (5) two-layer wall: y+ wall treatment (y+ ≈ 5); (6) solver: segregated; (7) convection: second order; (8) turbulence intensity: 0.01 (default); and (9) turbulent viscosity ratio: 10.0 (default).

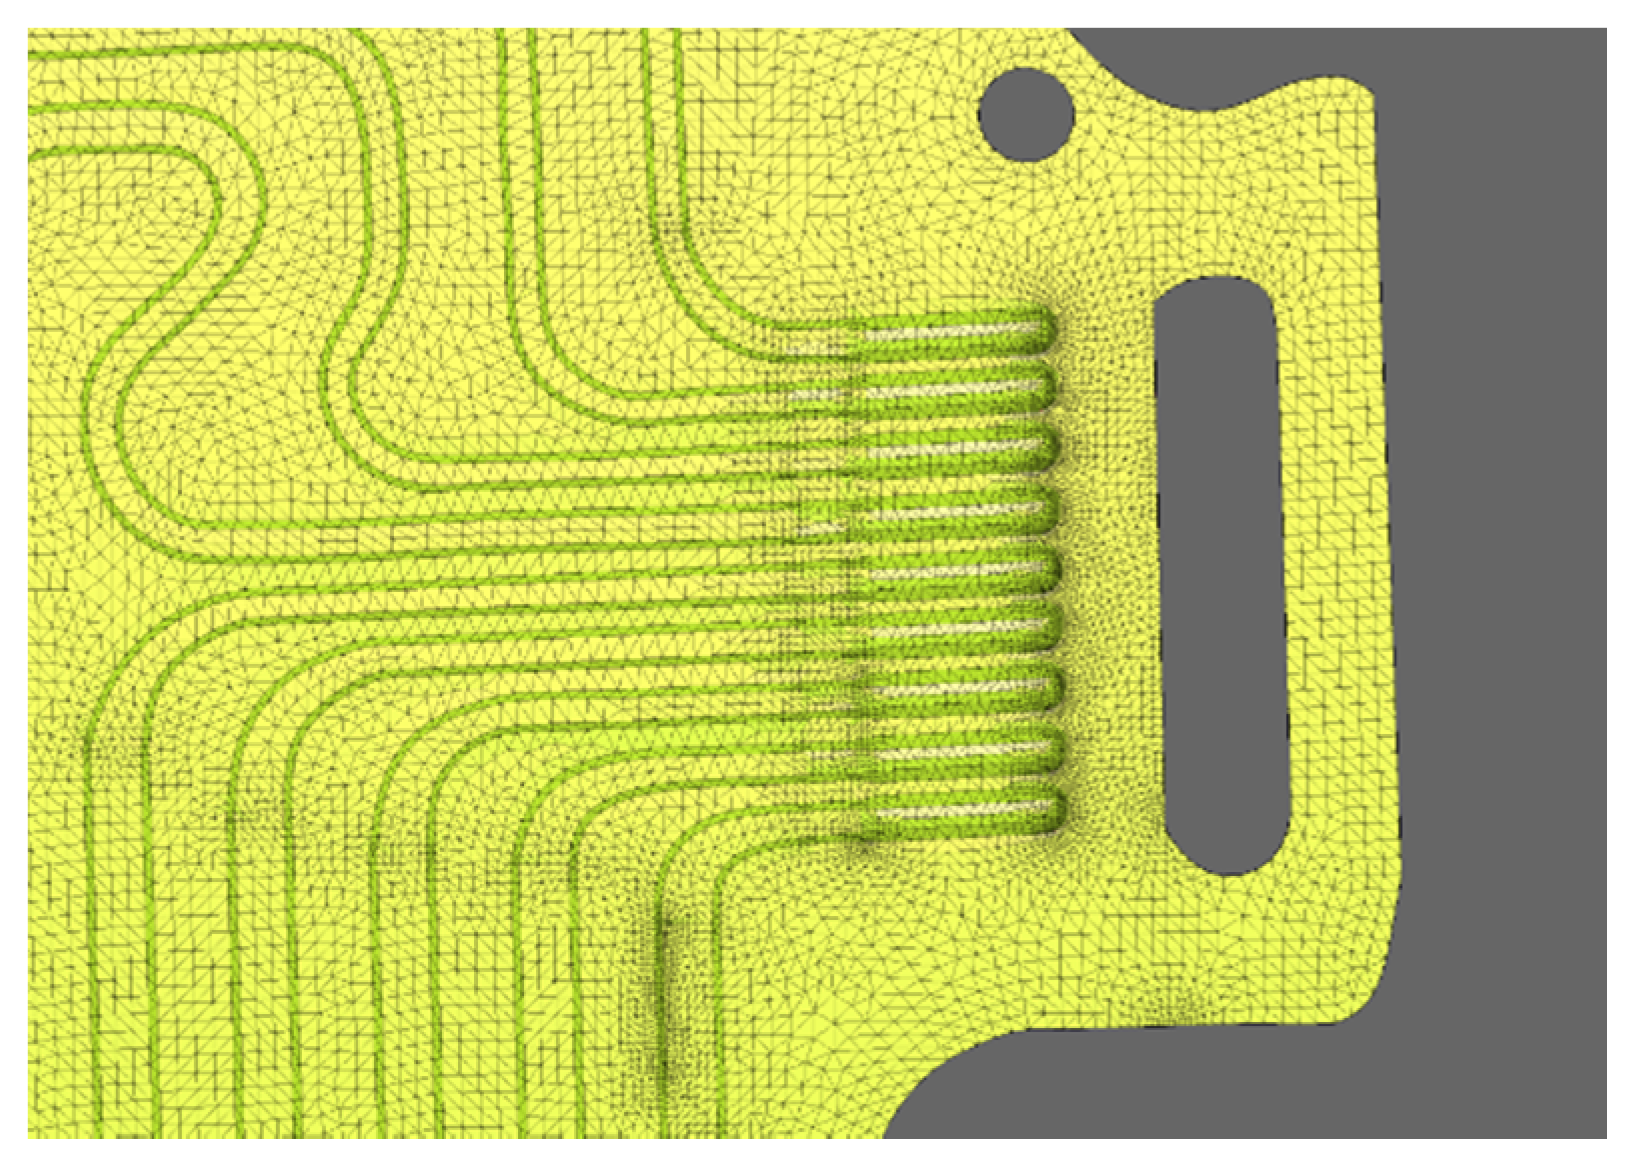
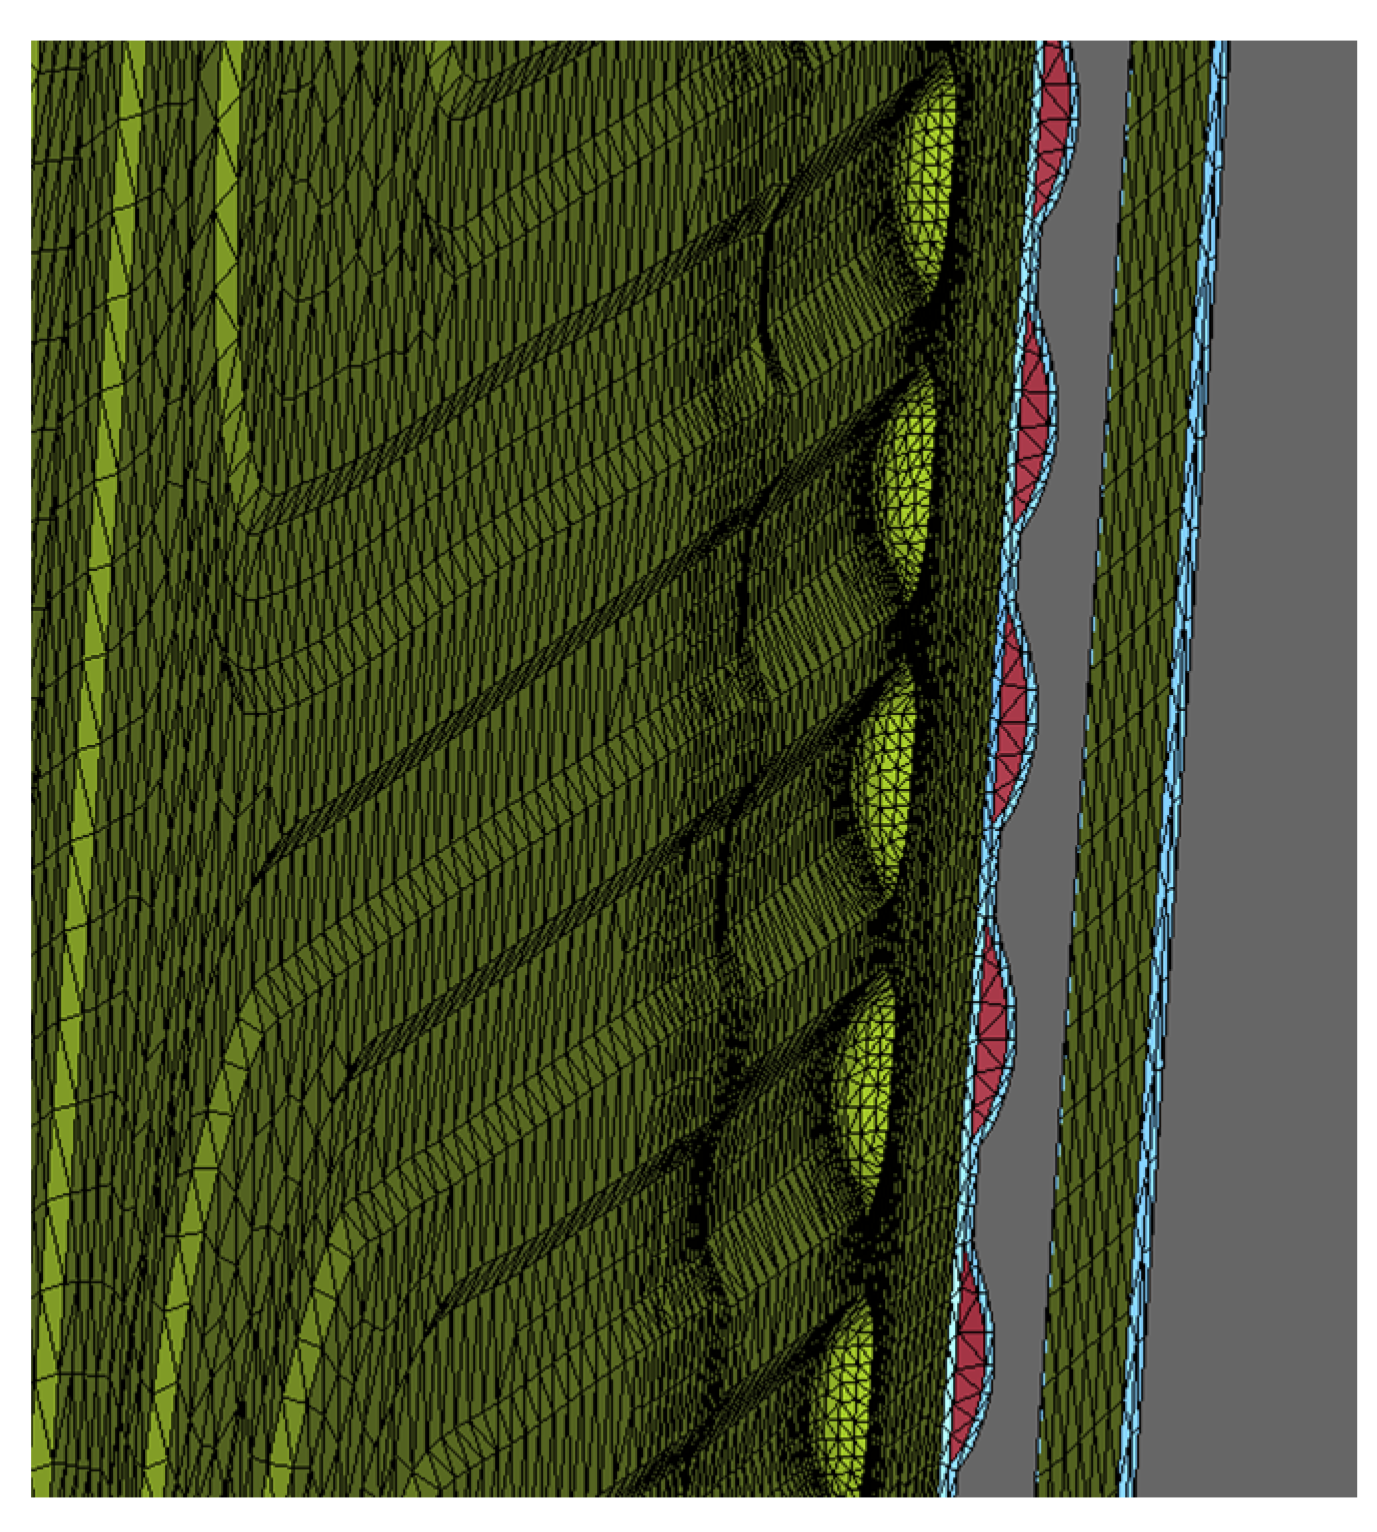
4.3. Meshing in DEP MeshWorks 8.0

The meshing of the area was a crucial step because different lattice parameters, such as quality criteria, mesh size, the shape of the elements, and the number of nodes have a significant impact on the result accuracy and the numerical solution. Here, the meshing was done using DEP MeshWorks 8.0 software. The screenshot of DEP MeshWorks during meshing of cooling plate is shown in Figure 4. Meshing in all nine-inlet channels of the cooling plate and meshing in the top portion of the cooling plate, which is specifically designed for this prismatic battery cooling, is shown in Figure 5. This design provides maximum cooling in this region because the heat production is the highest near the electrodes. In order to accurately represent the heat and flow transfer characteristics, the mesh was refined at regions of high geometrical deviations. Furthermore, P1, P2, and P3 areas for all cases for the heat flux sensor (HFS) is shown in Figure 6.

5. Results and Discussion

This section presents on the results obtained from investigations for a specific prismatic LIB at various higher discharge currents of 60 A (3C) and 80 A (4C) for water cooling at working conditions of 5 °C, 15 °C, 25 °C, and 35 °C.

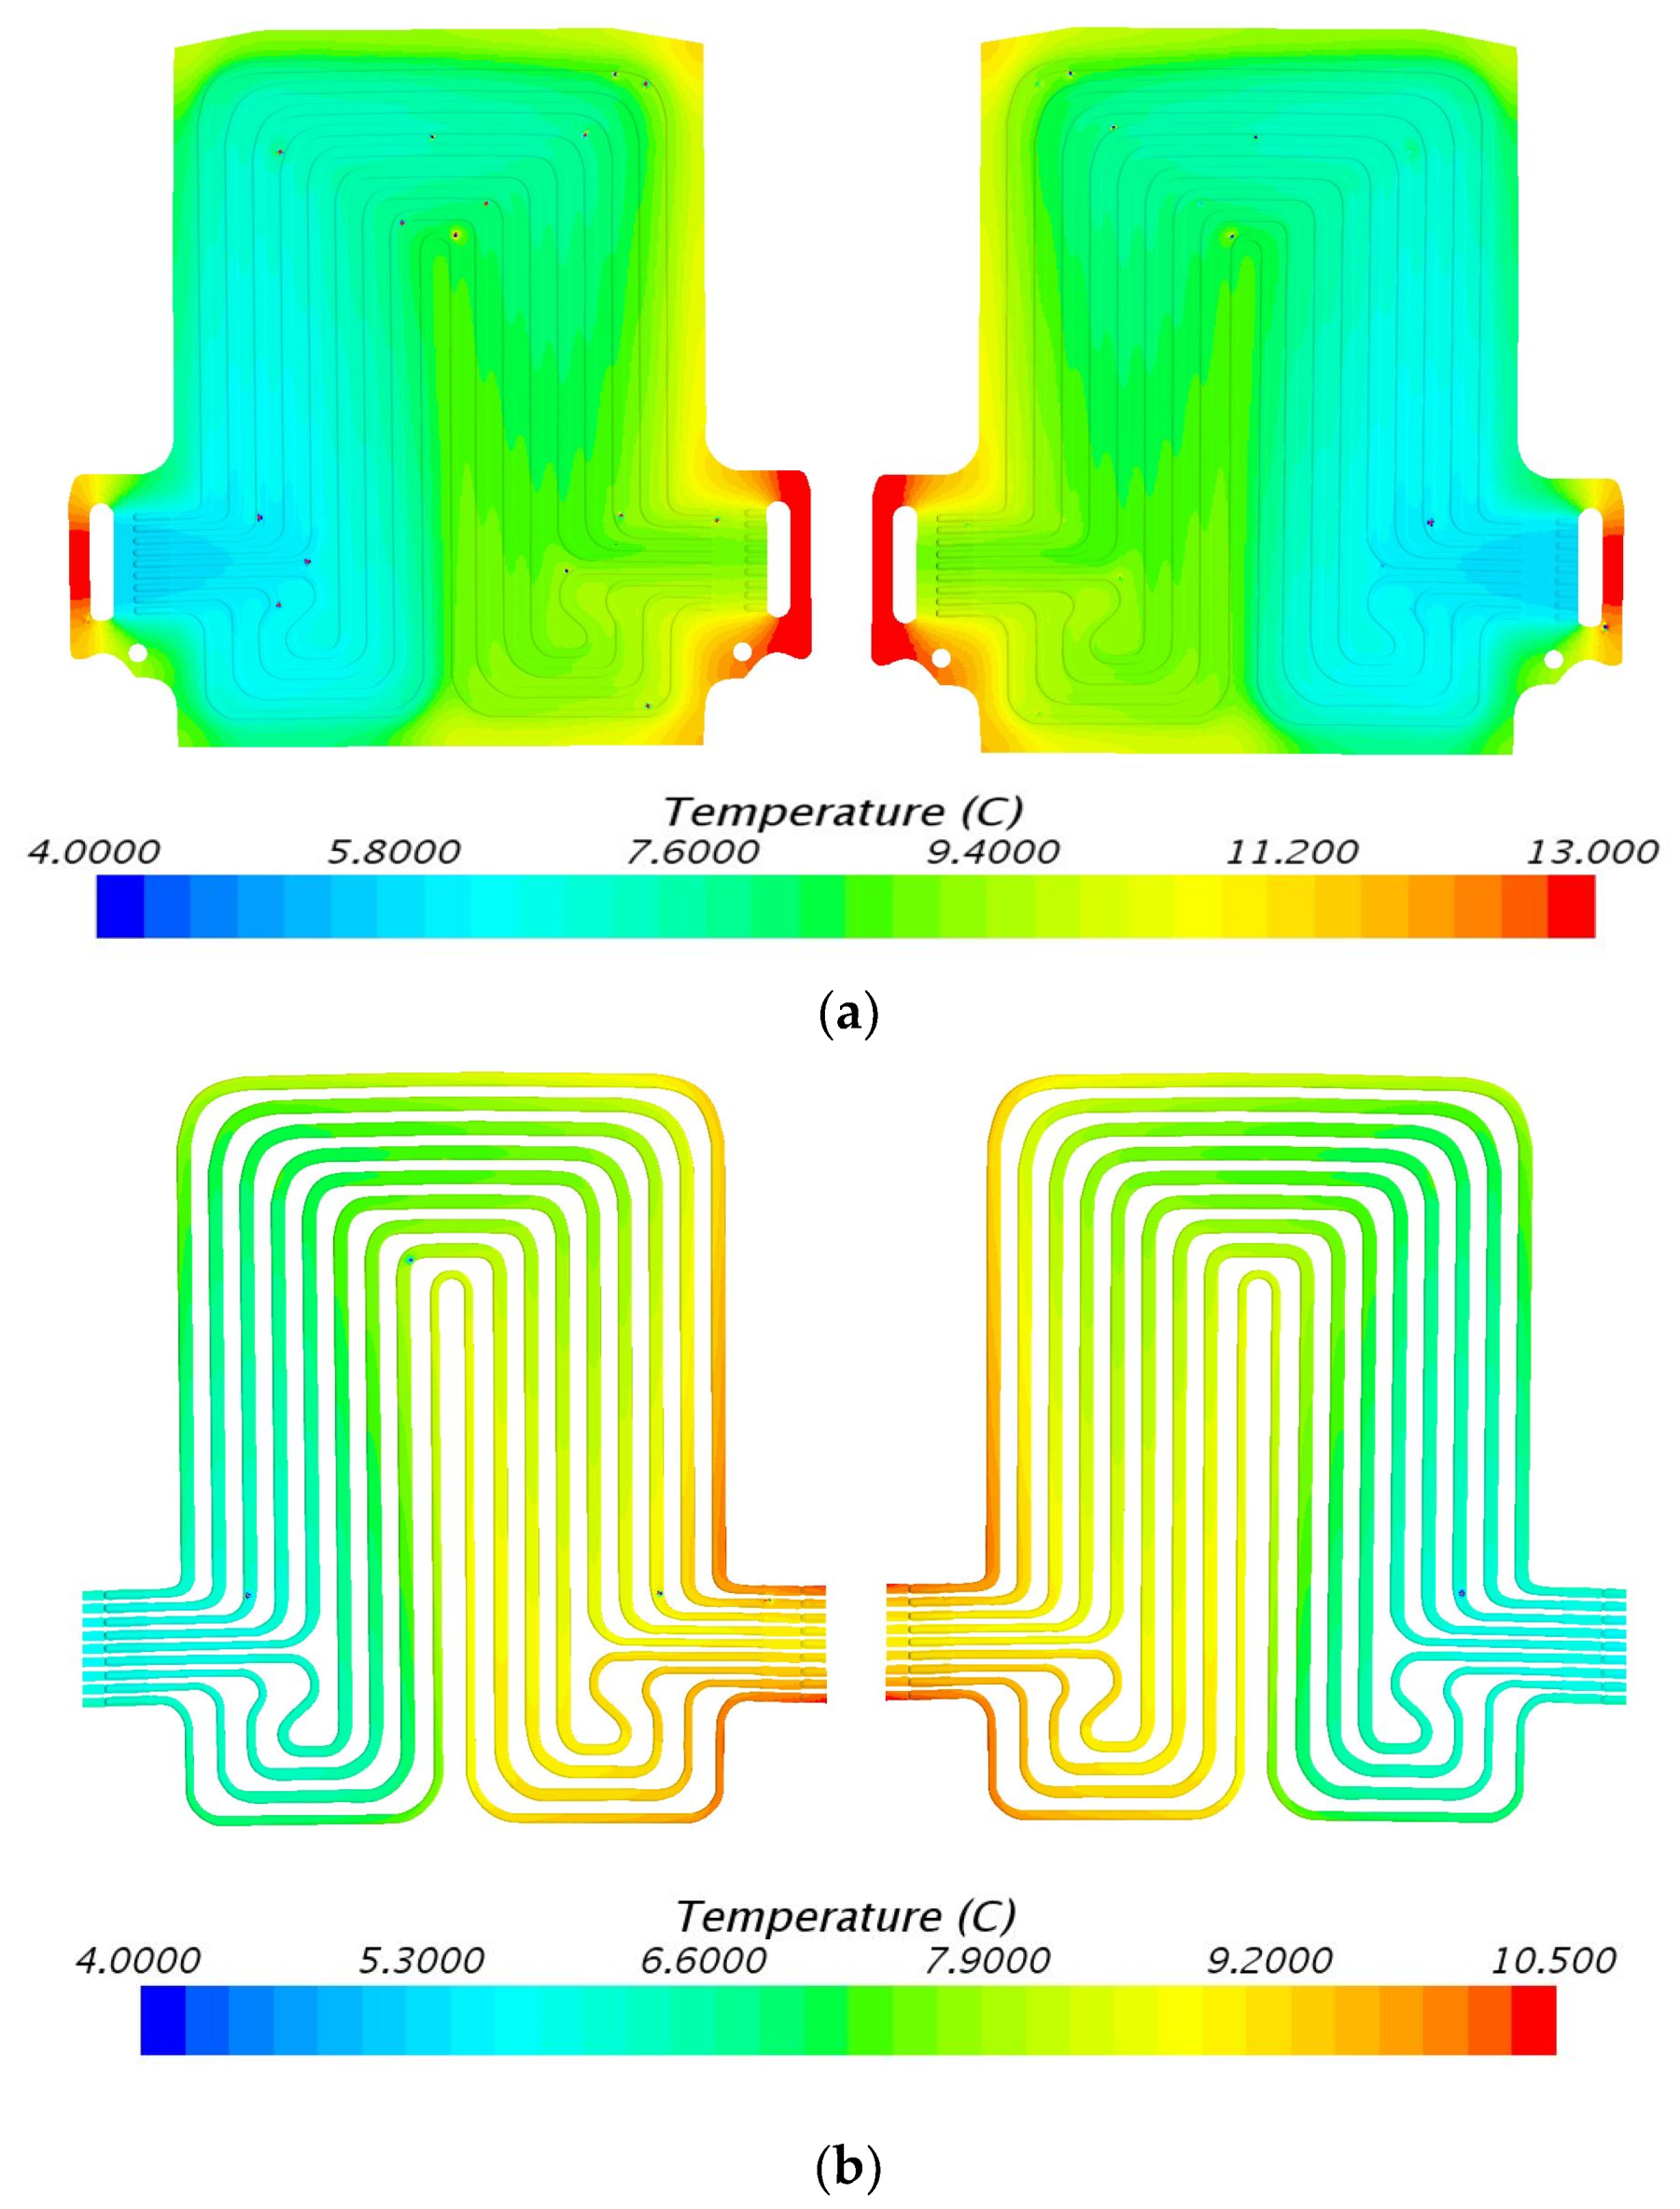
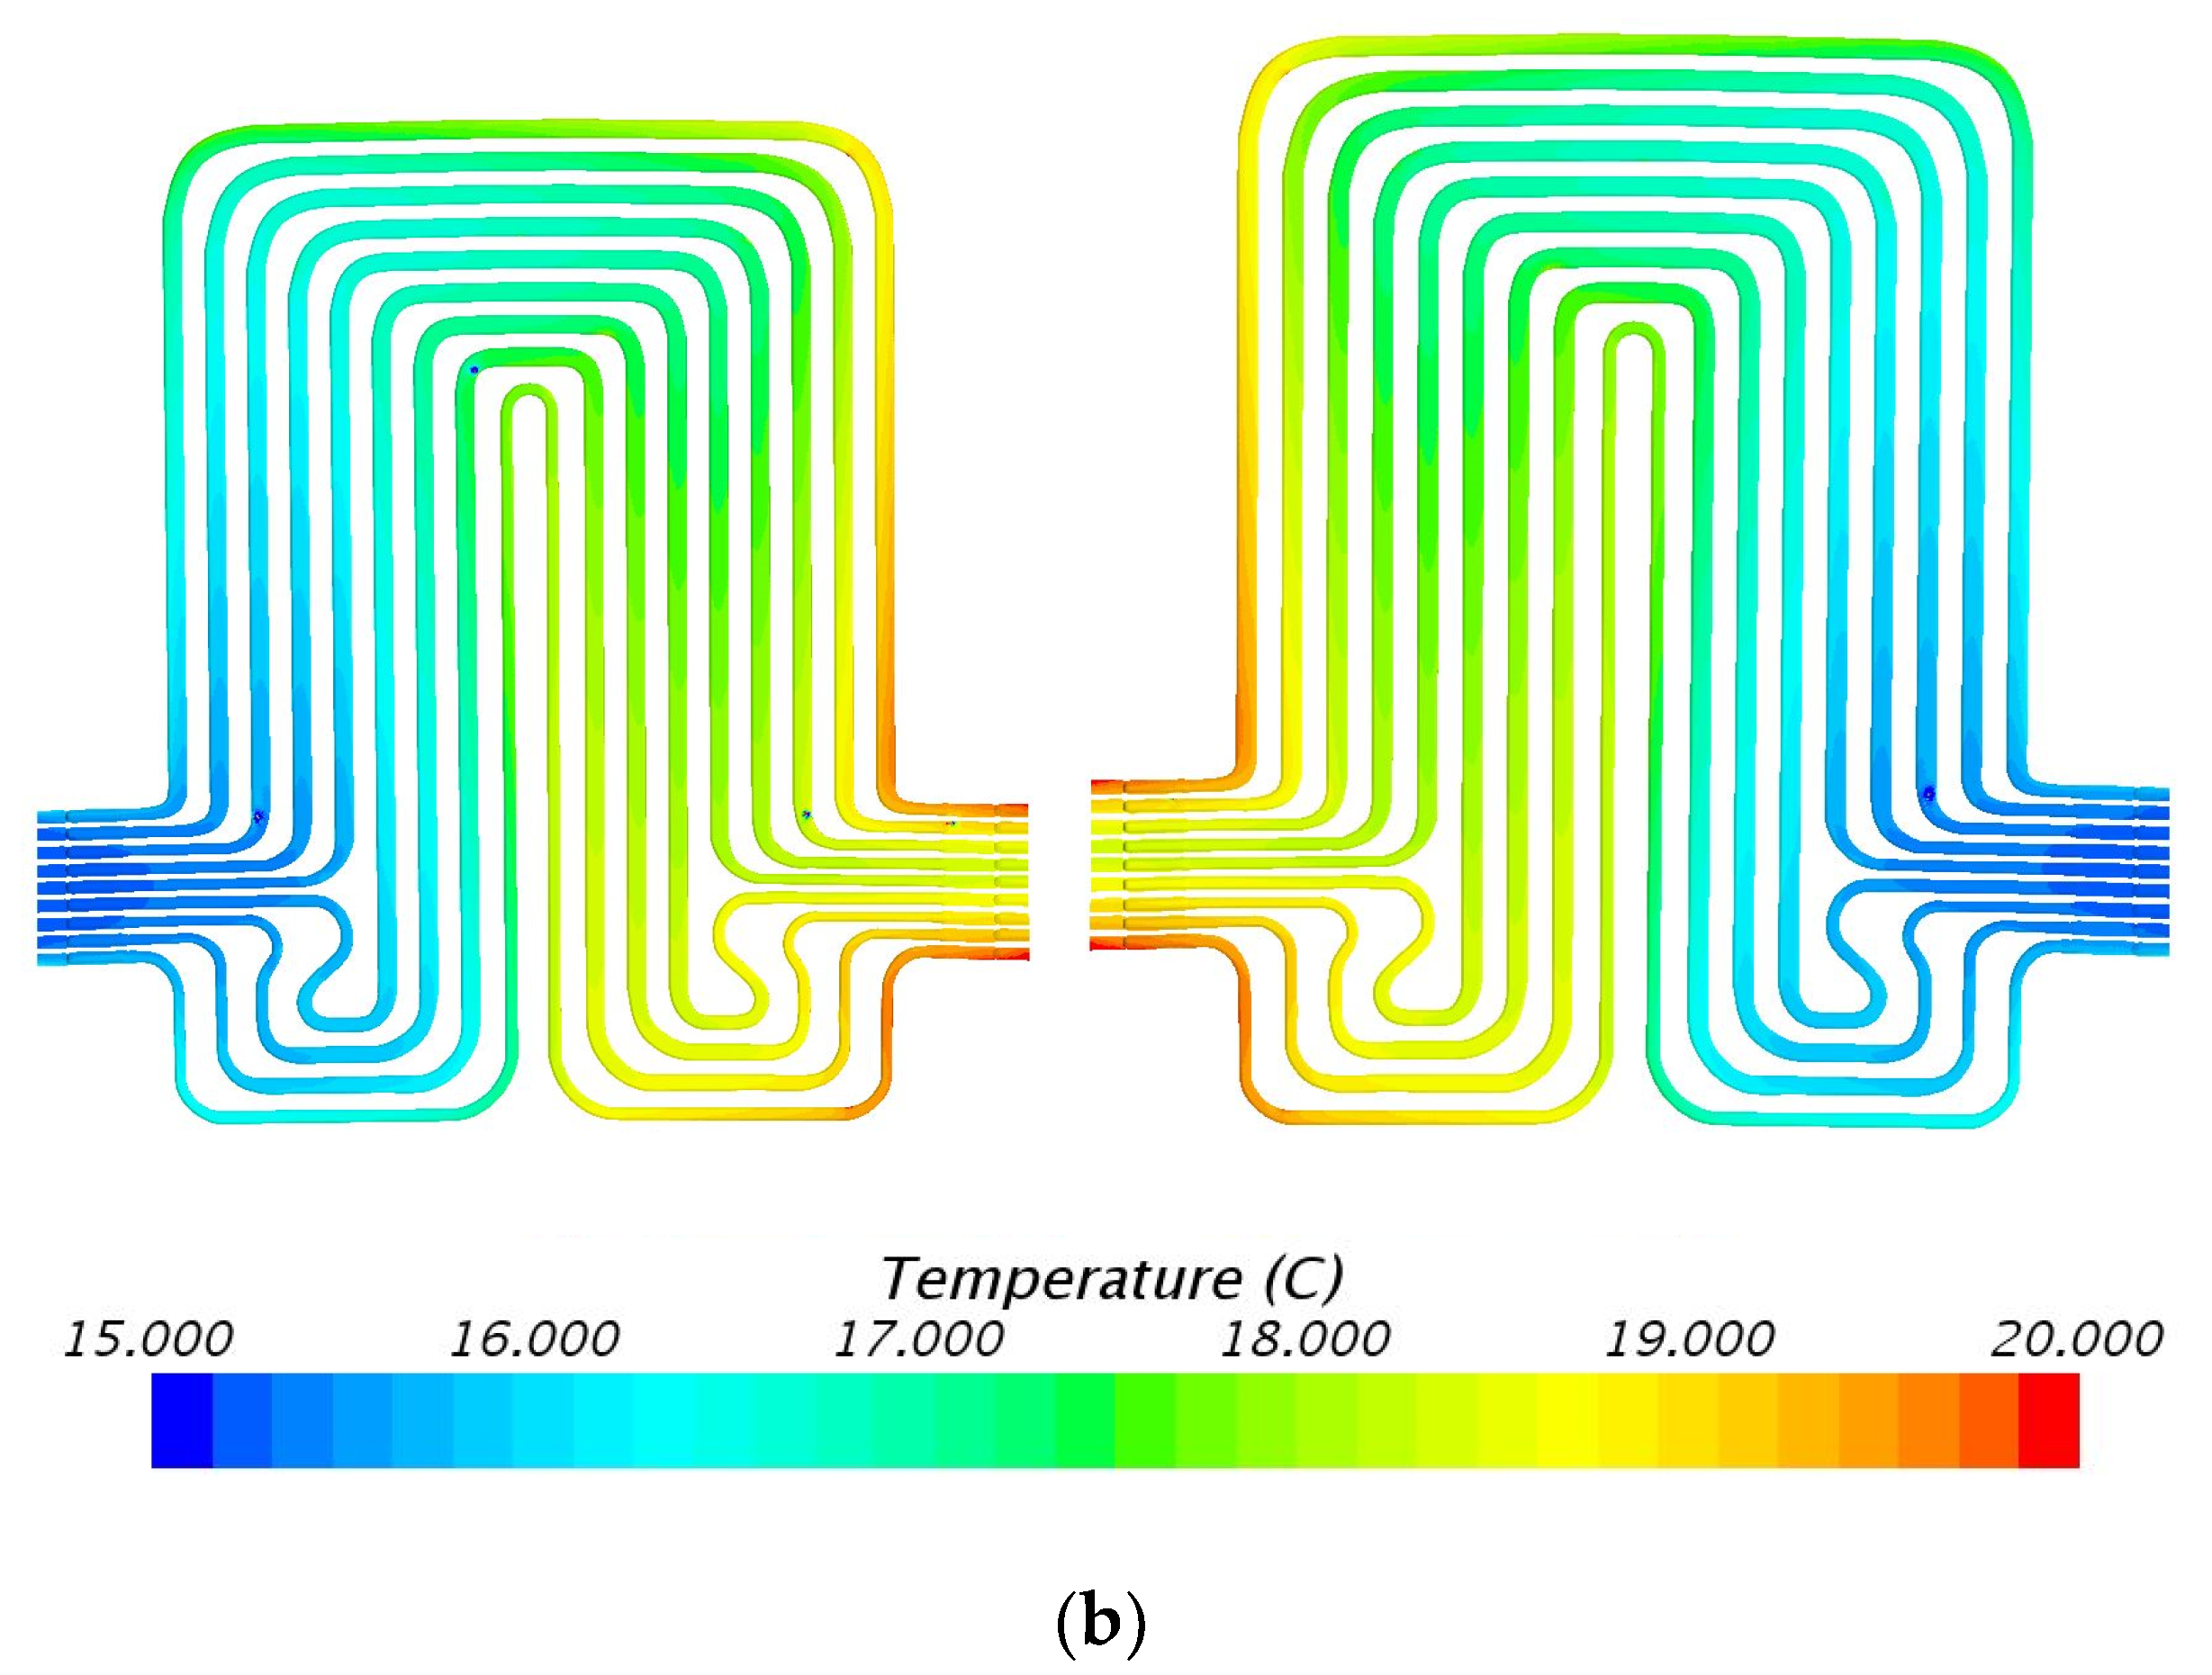
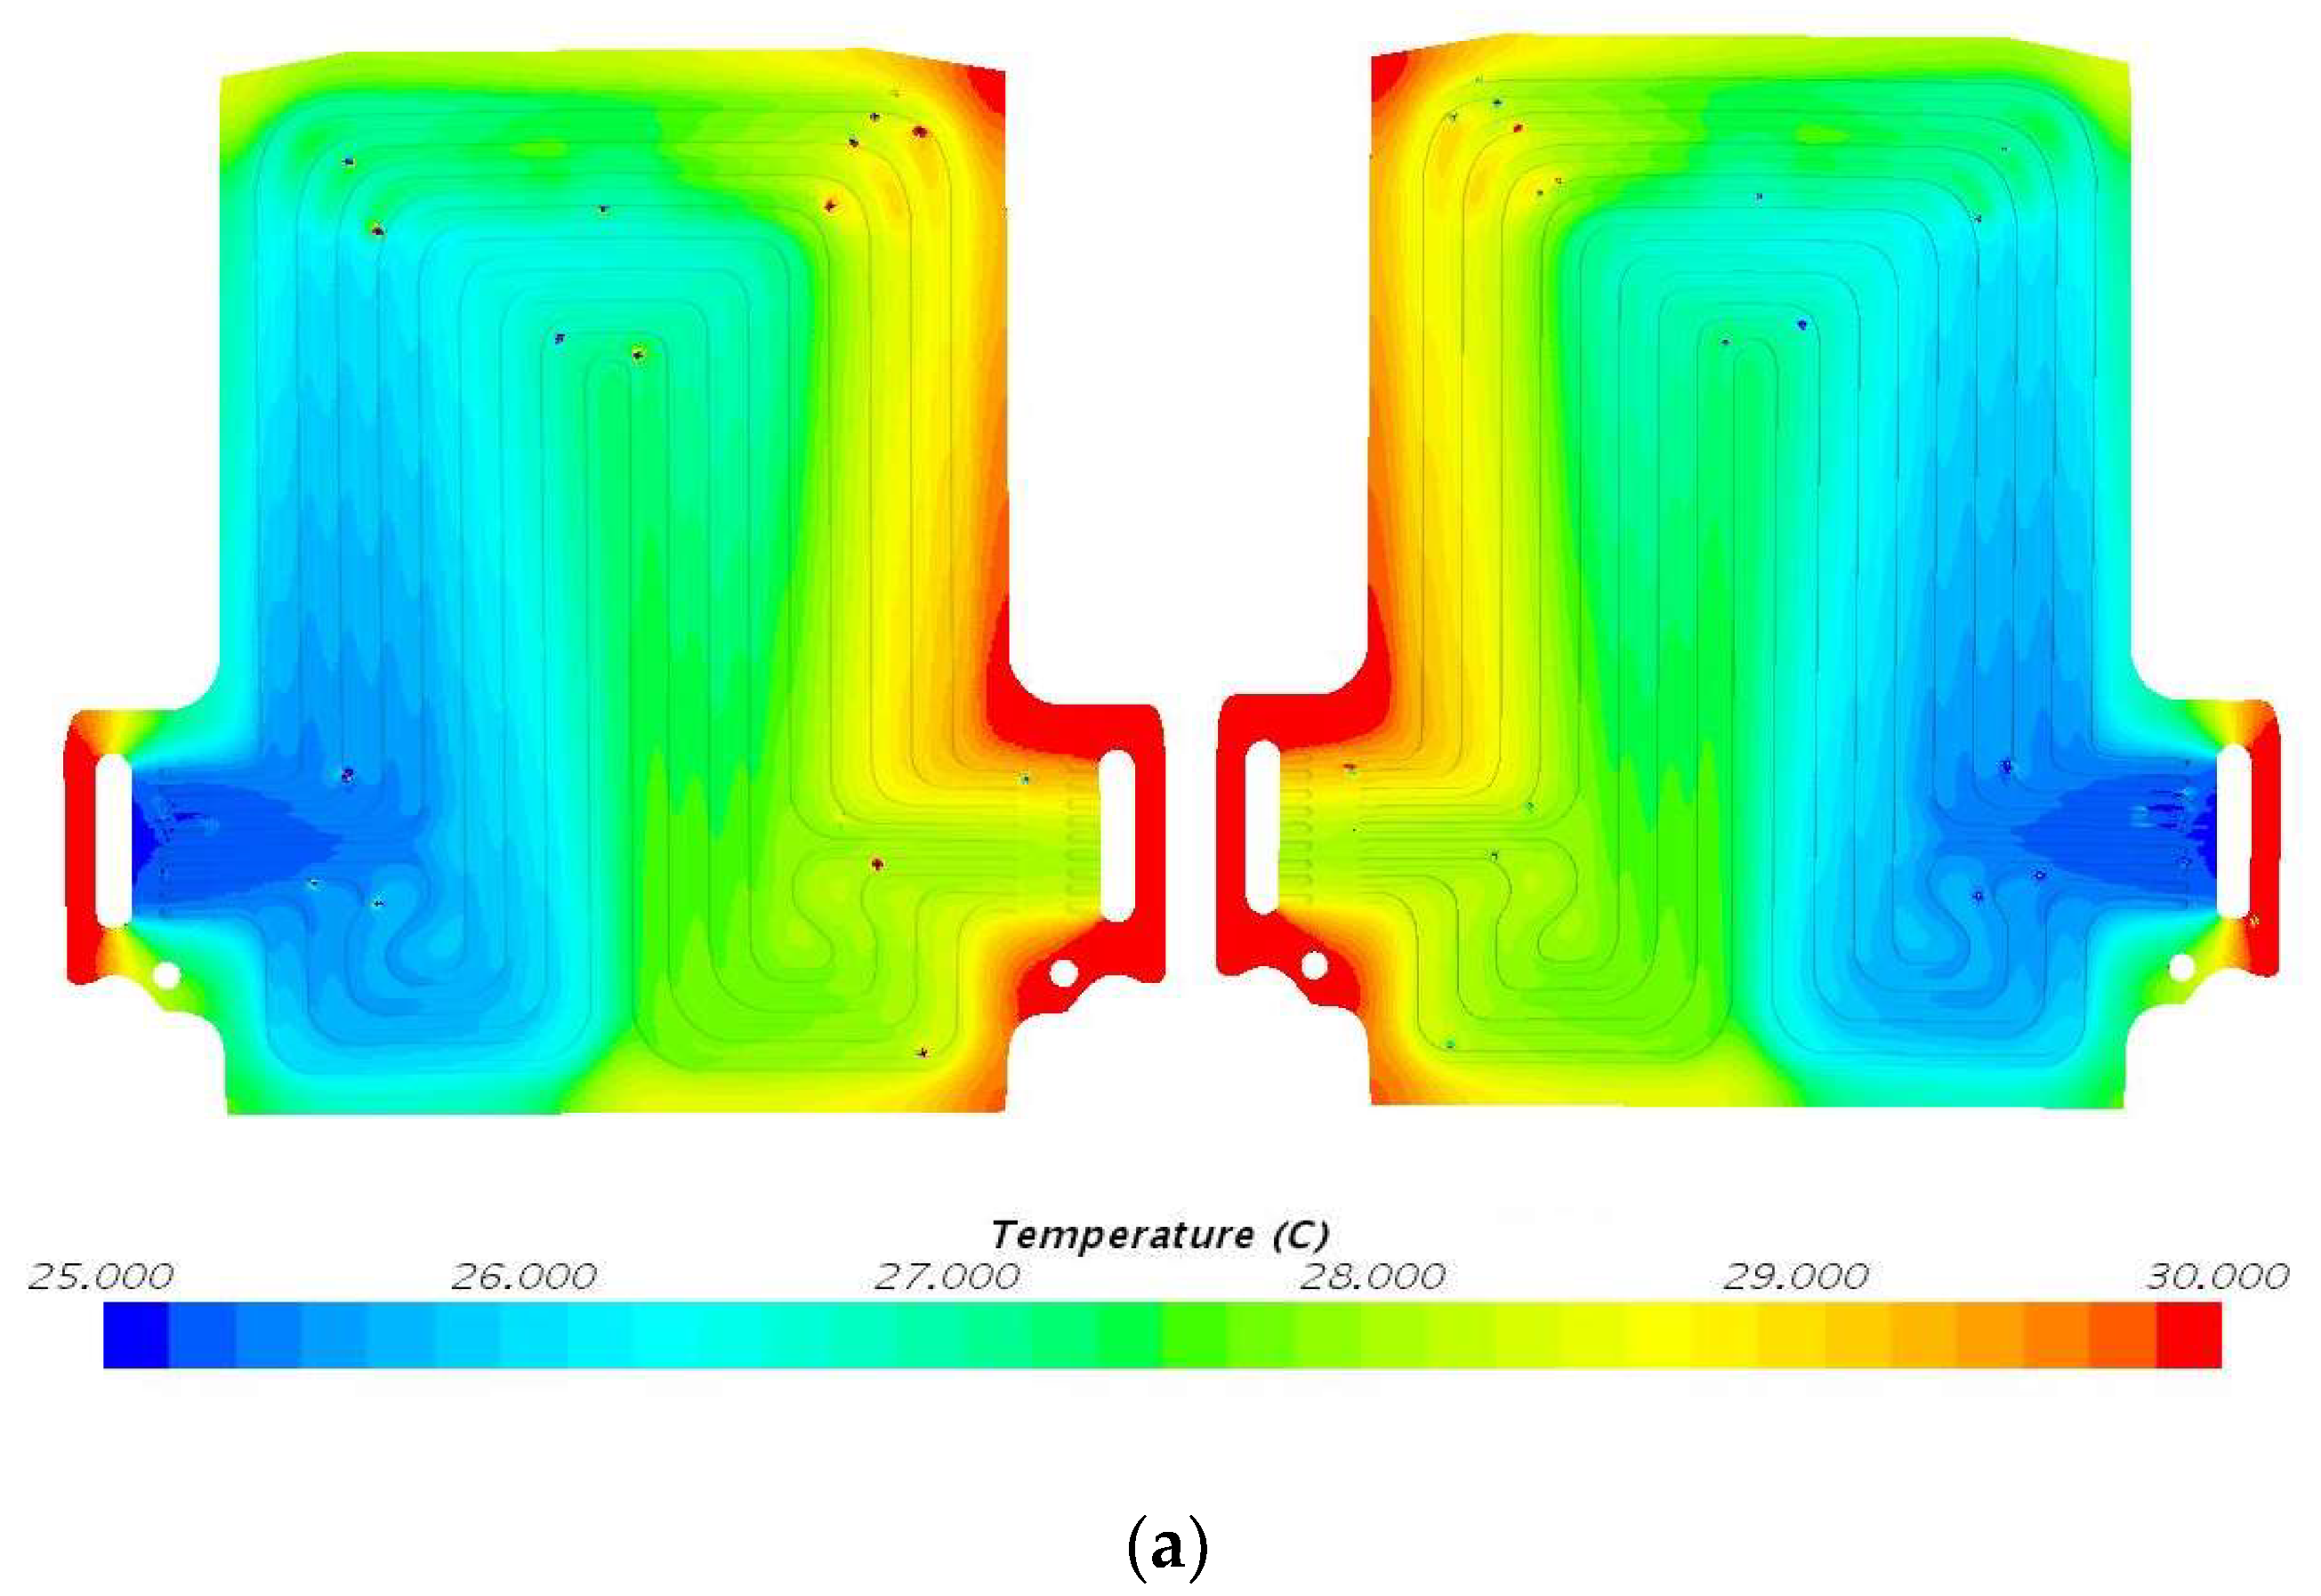
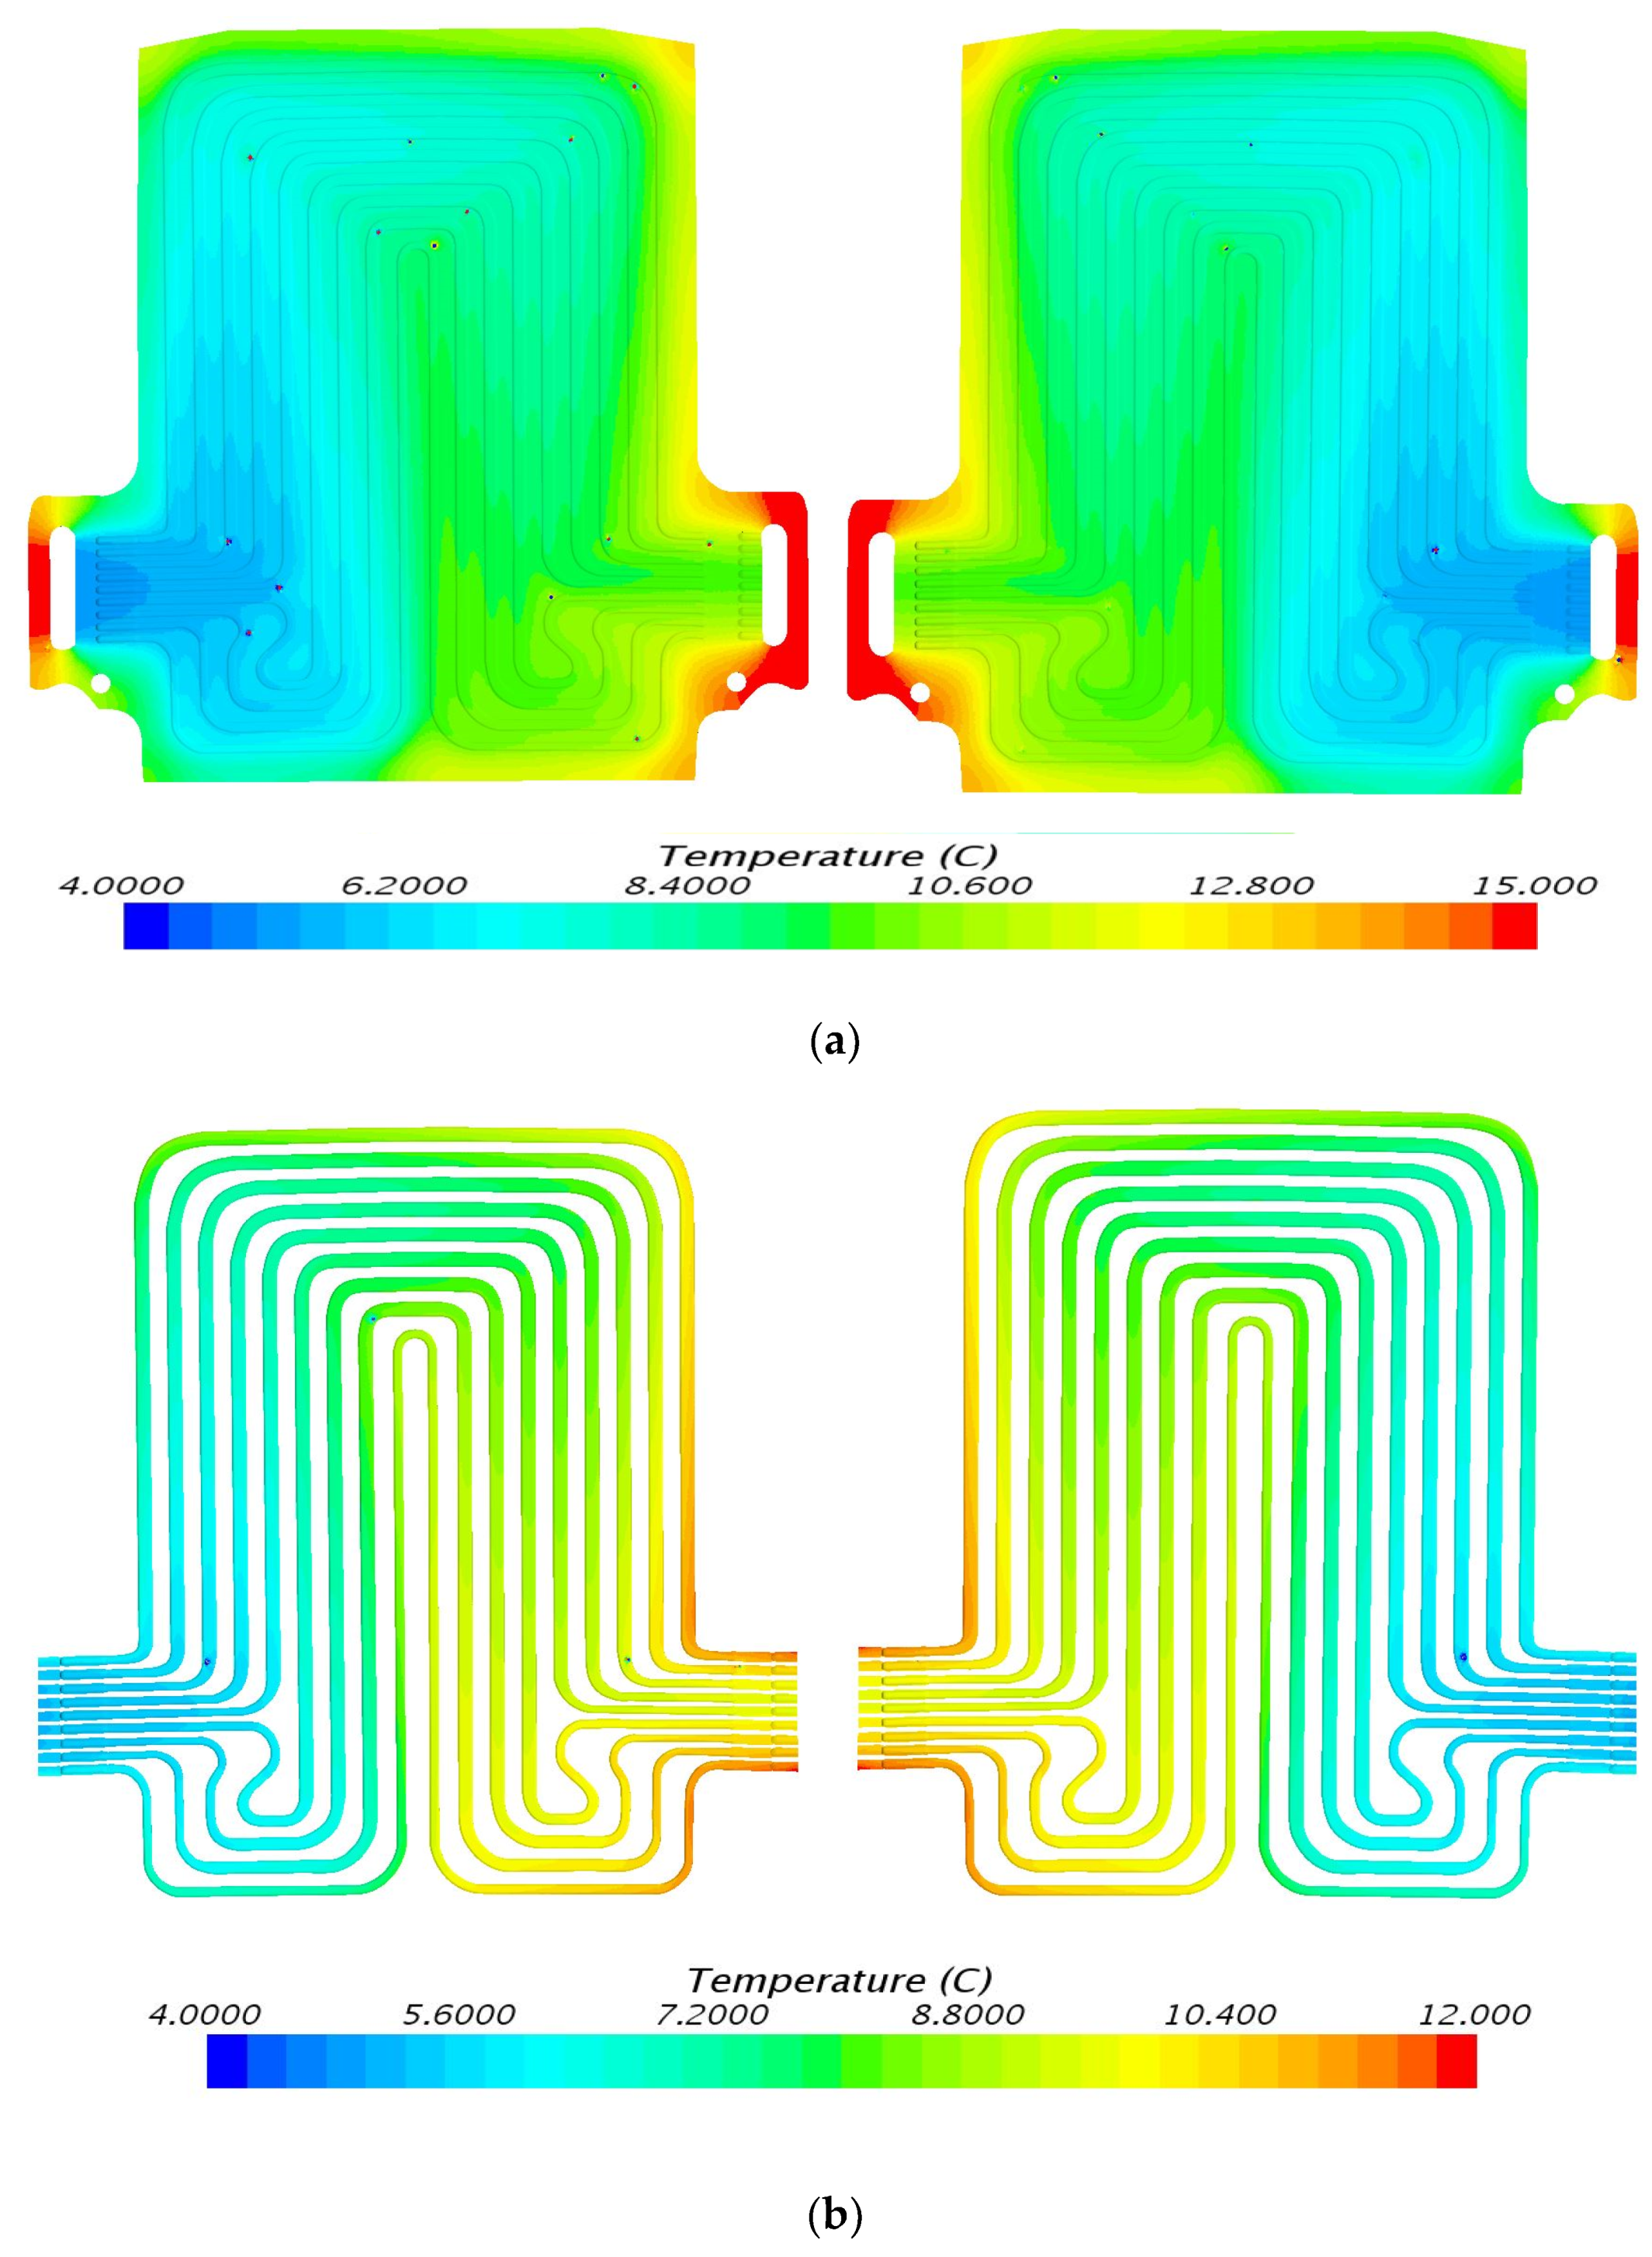
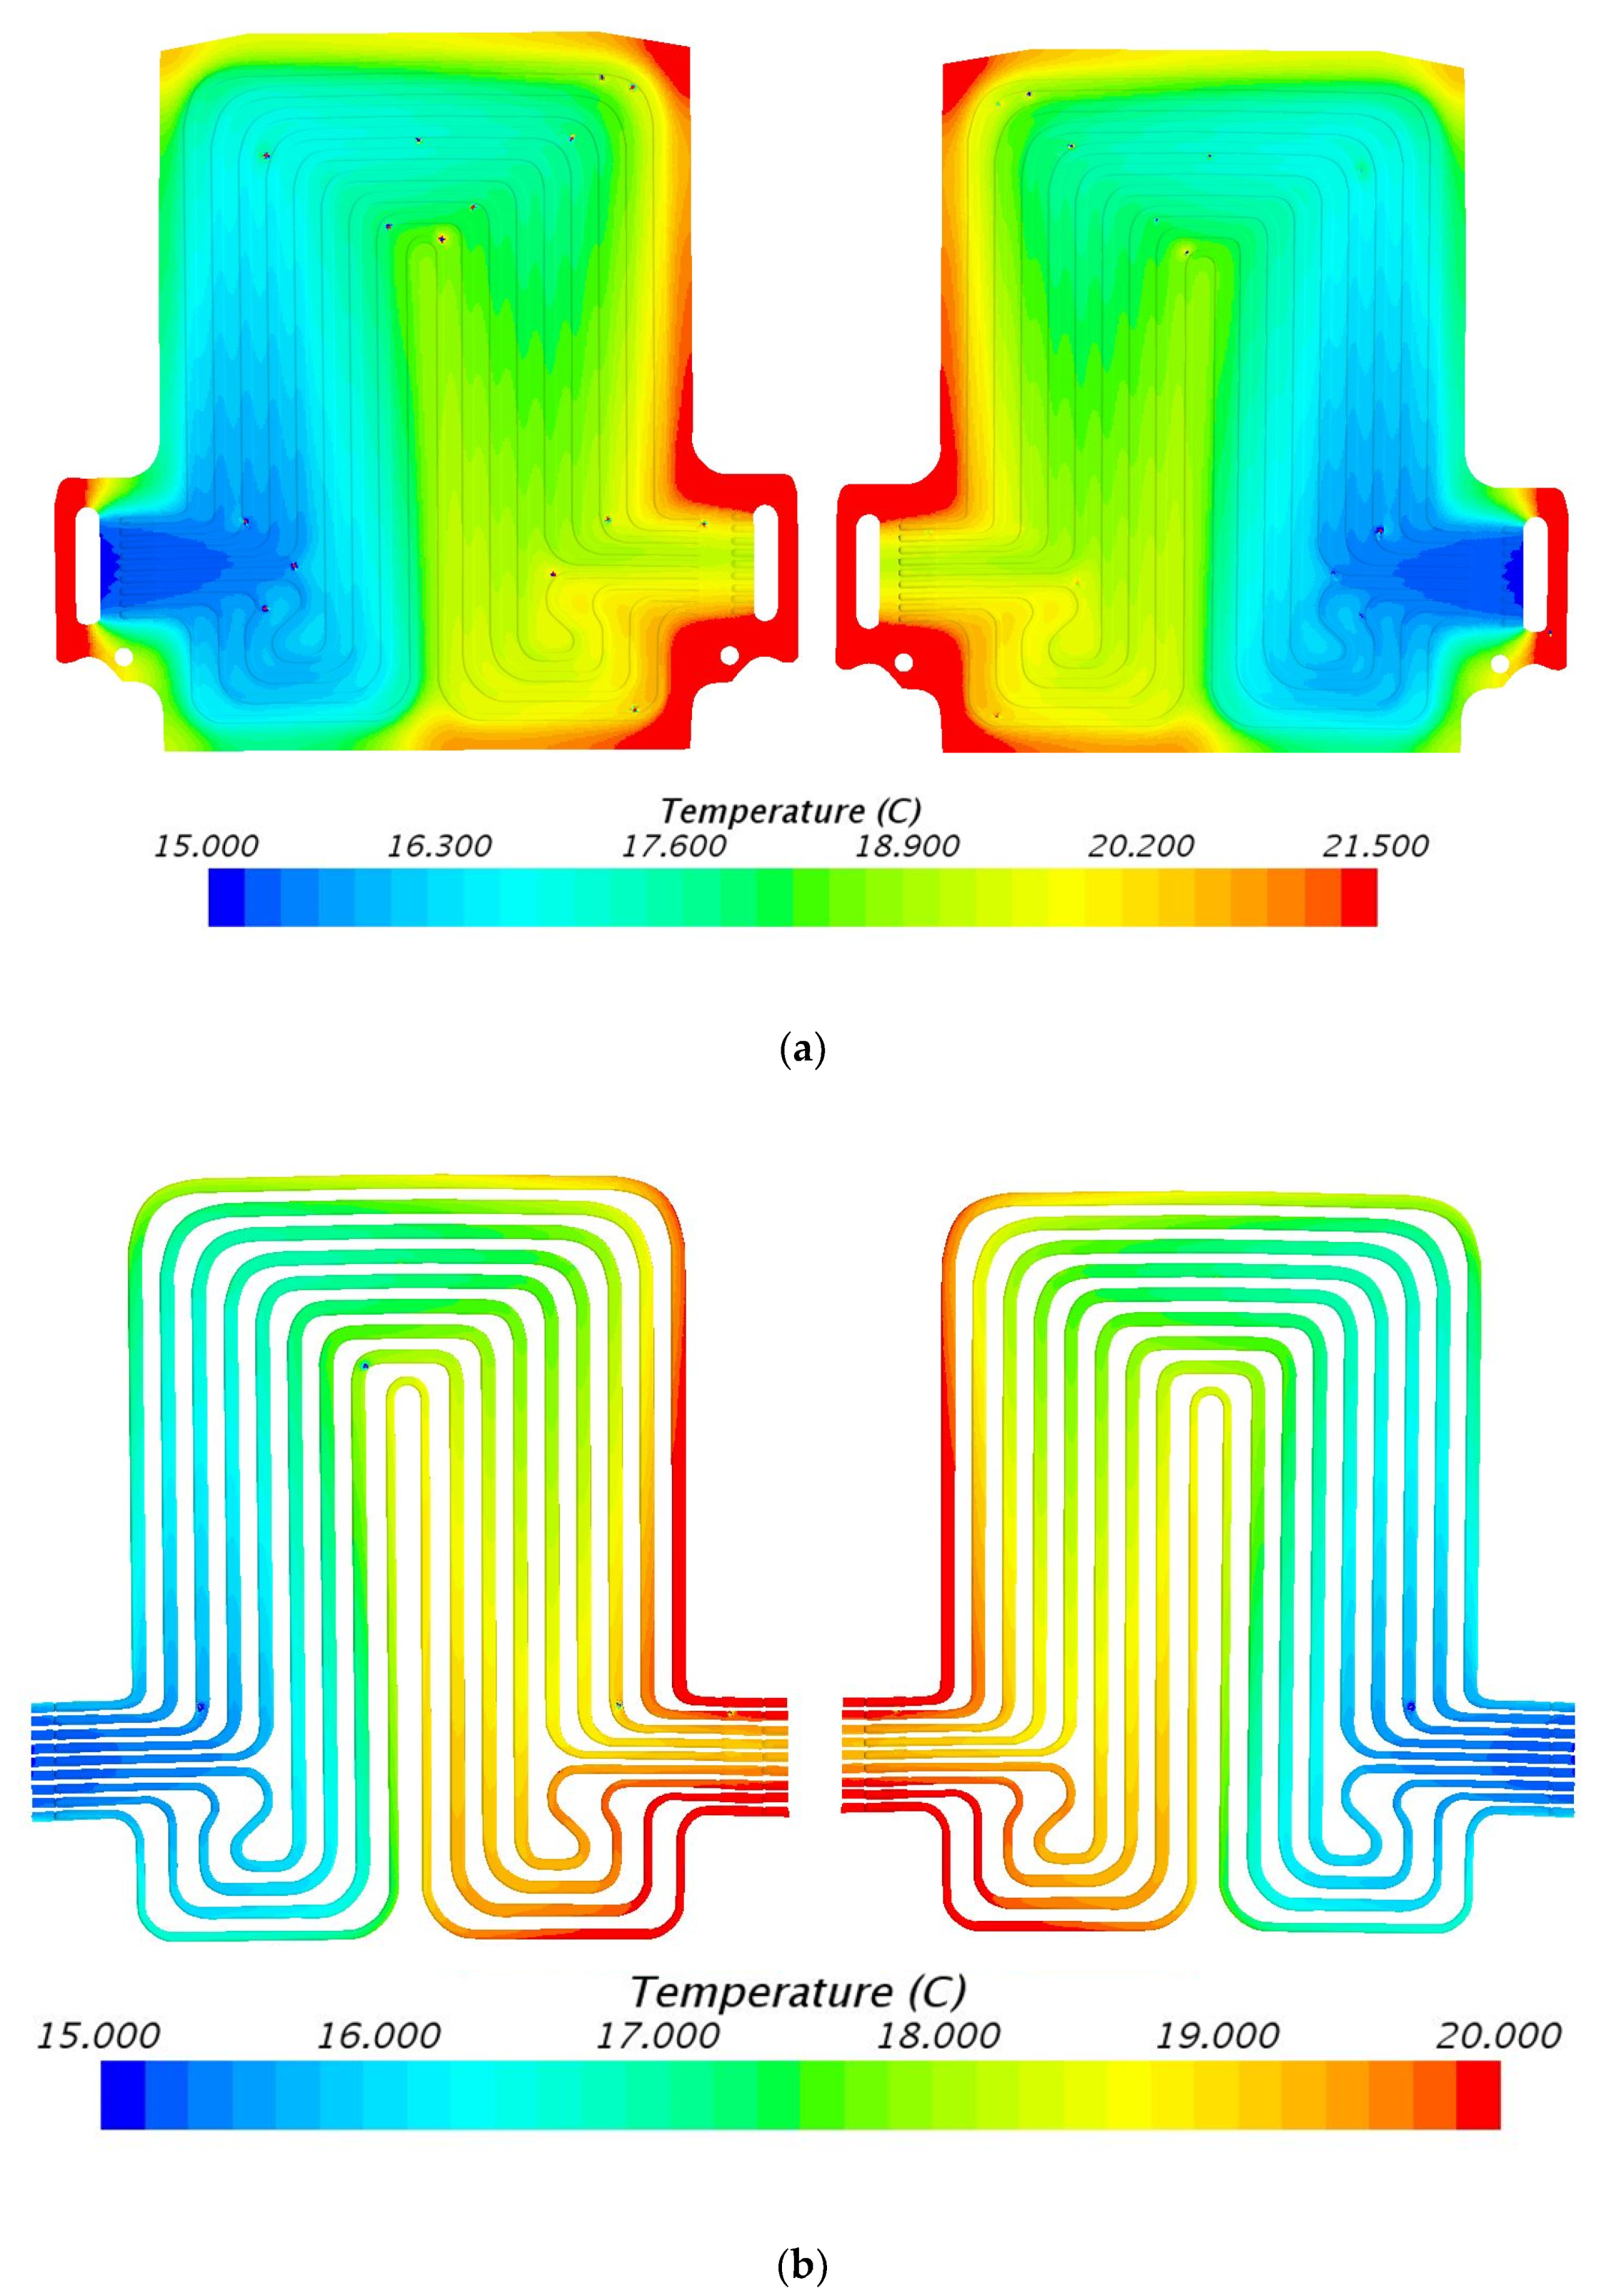
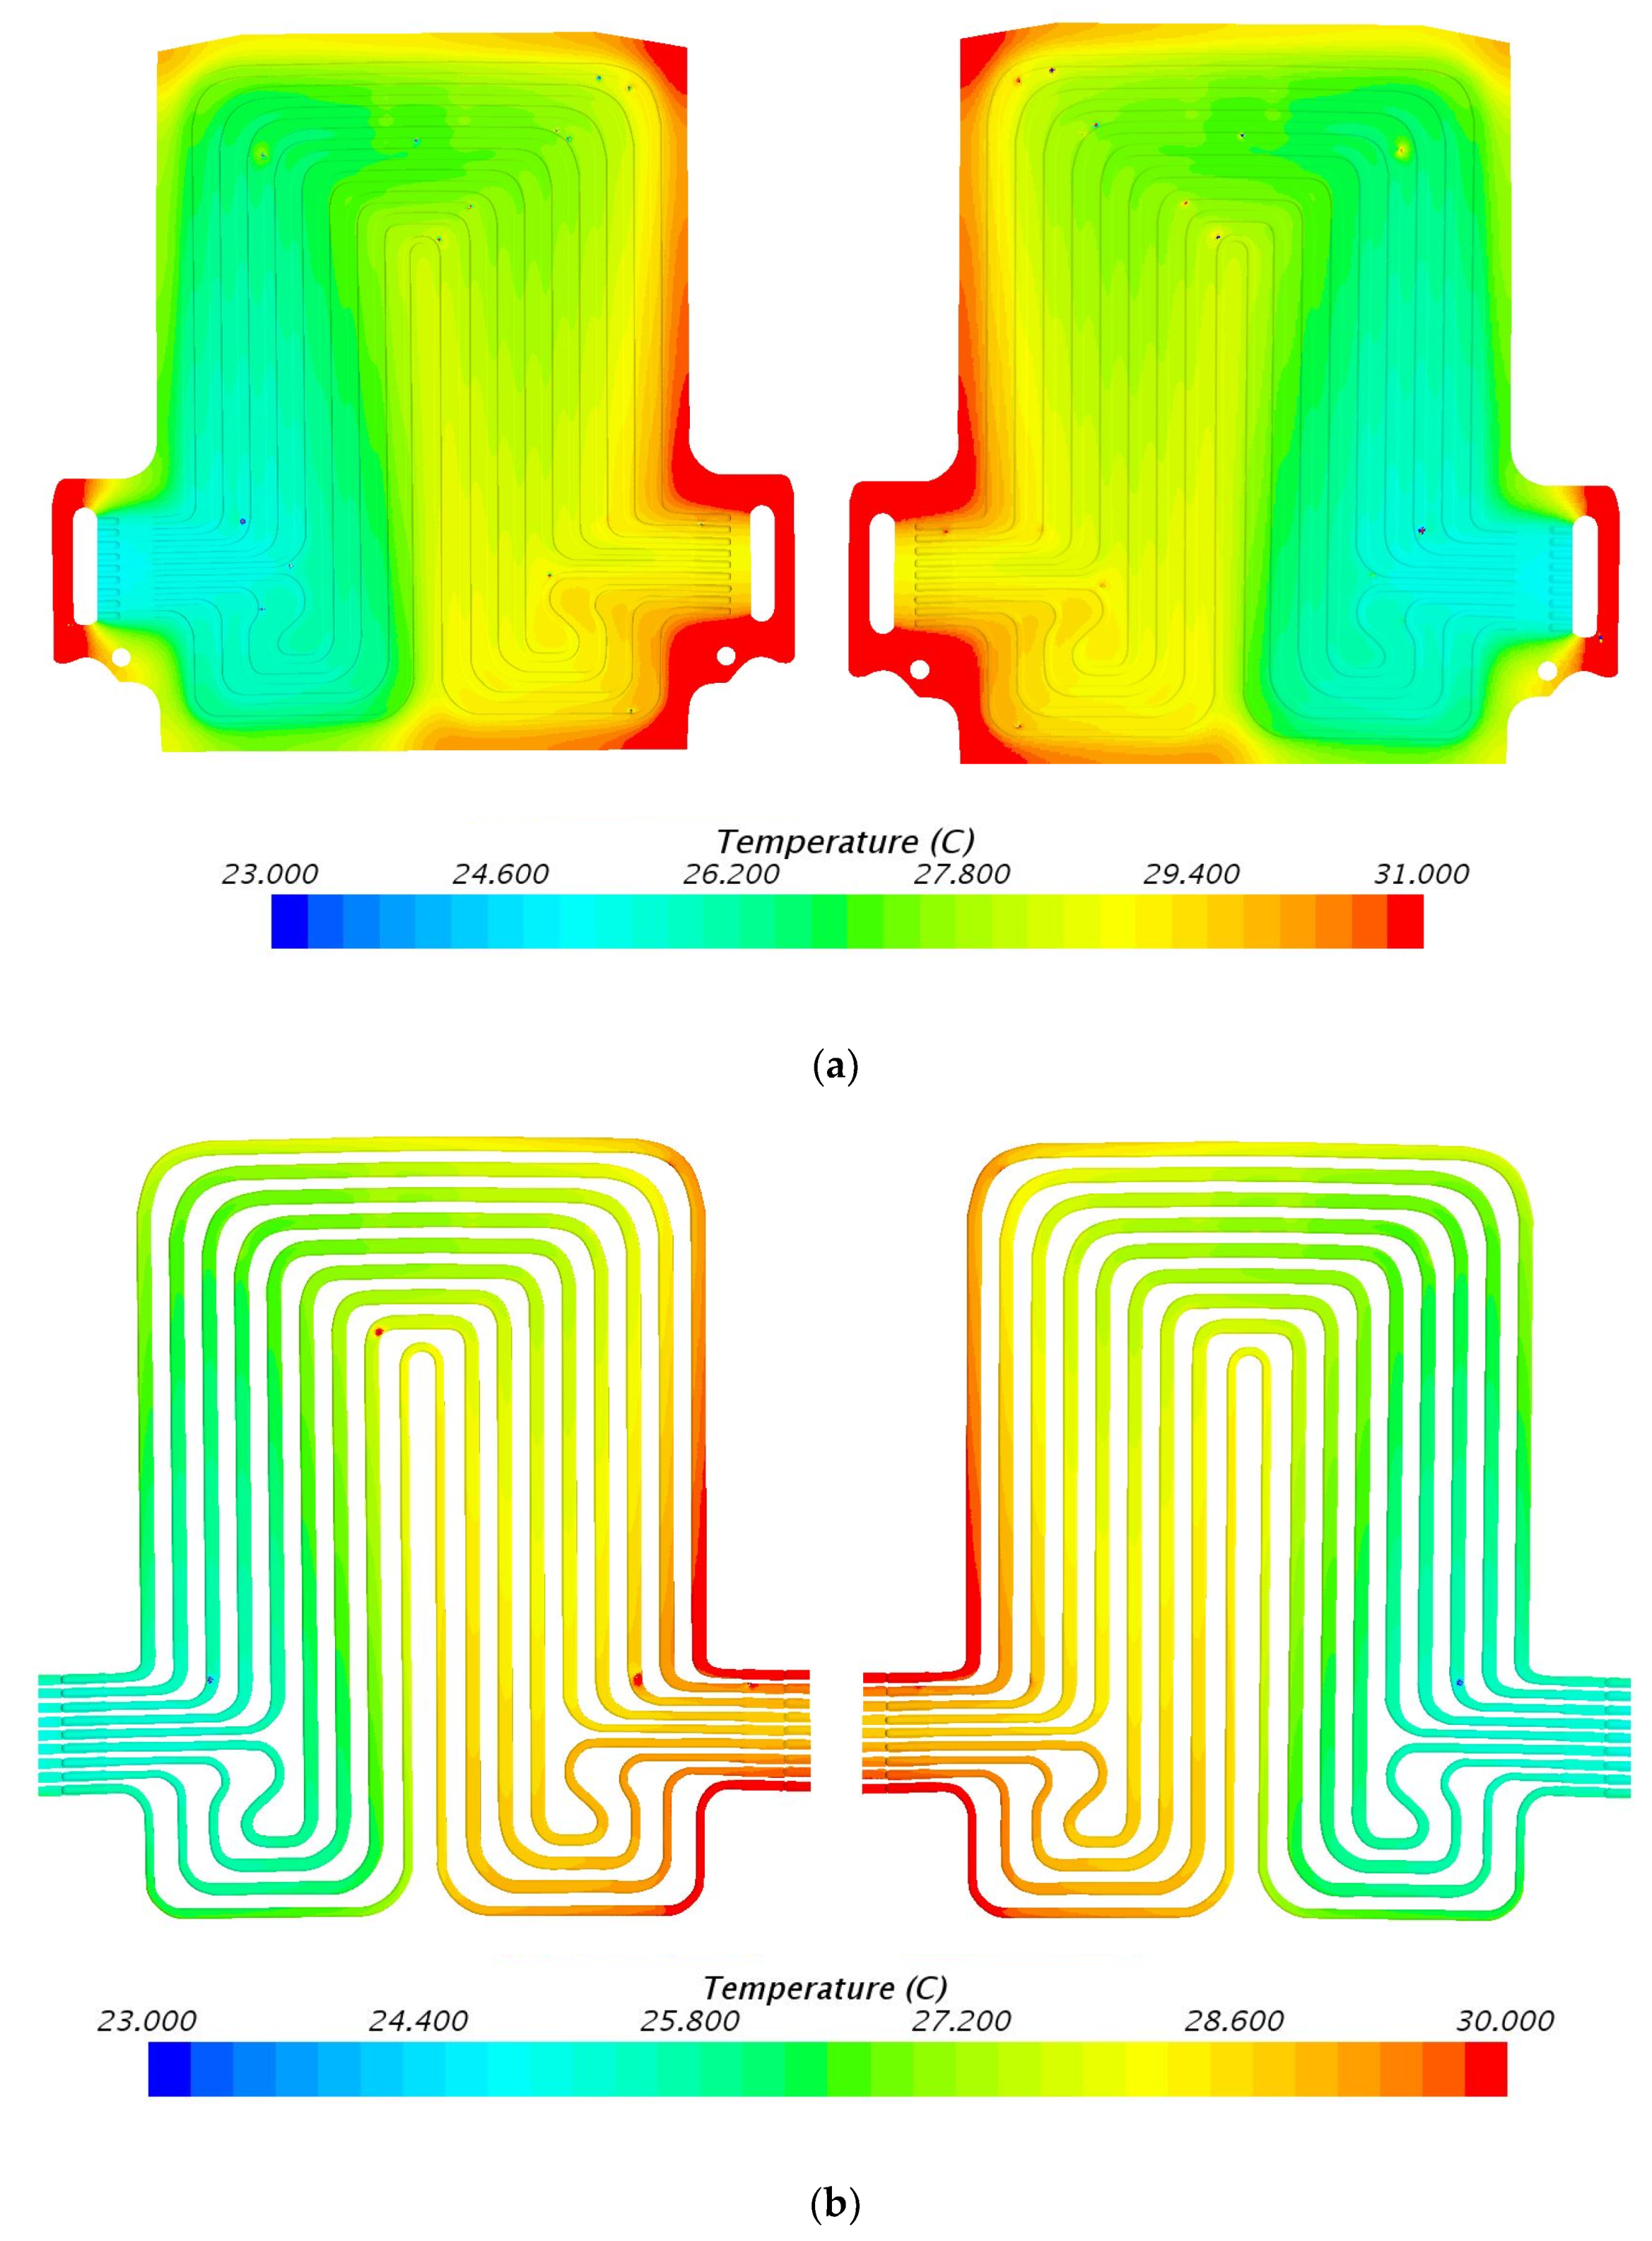
5.1. Temperature Contours at 3C (60 A) Discharge

The temperature contours determined from STAR CCM+ CFD at 60 A discharge current and 5 °C, 15 °C, 25 °C, and 35 °C working temperatures are shown in Figure 7, Figure 8, Figure 9 and Figure 10. As previously mentioned, three heat flux sensors were put on the main surface of the battery: one was situated close to the positive terminal or cathode, the second was situated close to the negative terminal or anode, and the third was situated at the center of the cell. Figure 7 demonstrates the simulation results at 60 A discharge current and 5 °C coolant inlet temperature with heat flux near cathode = 2347.7 W/m2, anode = 2259.5 W/m2, and mid surface = 539.3 W/m2. Similarly, Figure 8 shows temperature contours at 60 A discharge current and 15 °C coolant inlet temperature with heat flux values near cathode = 1711.8 W/m2, anode= 2351.6 W/m2, and mid surface = 548.4 W/m2. It is observed that the temperature contours and trends are similar with the inlet being cold and outlet being hot. During the battery operation at high C-rates, the generated heat from the battery is conducted to the cooling plate. As the coolant flows inside from the inlet, the heat is absorbed continuously with increments in coolant temperature along the flow path. The maximum temperature of coolant is observed at the outlet surface, as expected. Figure 9 shows temperature contours at 60 A discharge current and 25 °C coolant inlet temperature with heat flux values near cathode = 1597.3 W/m2, anode = 1851.6 W/m2, and mid surface = 413.0 W/m2. Figure 10 demonstrates temperature contours at 3C discharge rate and 35 °C coolant inlet temperature with heat flux values near cathode = 1468.4 W/m2, anode = 1579.9 W/m2, and mid surface = 340.6 W/m2.
The result for temperature from simulation for 4C discharge rate and ambient temperature of 35 °C showed 38.12 °C, which is 2.85% higher or lower than experimental values for similar boundary conditions. The result for temperature from simulation for 3C discharge rate and ambient temperature of 5 °C showed 7.93 °C, which is 2.19% higher or lower than experimental values for similar boundary conditions. It is also noted that working temperature had a great impact on battery discharge capacity. As the working temperature rose from 5 °C to 35 °C, the temperature contour values also increased for a particular C-rate. The general cooling patterns are identical, demonstrating more noteworthy contrasts at the inlet of the cooling plate where the water is coldest. The temperatures differ with the inlet working condition temperature, yet the overall pattern remains generally consistent. Table 3 gives the summary of inlet and outlet water temperatures at 60 A discharge current and working temperature conditions of 5 °C, 15 °C, 25 °C, and 35 °C. Table 3 also provides the difference in experimental and simulated values obtained from STAR CCM+ software. It is additionally seen that the simulated values are higher than experimental values because of the assumption of ideal wall conditions of adiabatic wall at non-heat-transferring boundaries. In the actual experiment, a small amount of heat transfer could be observed at some places where insulation was provided.

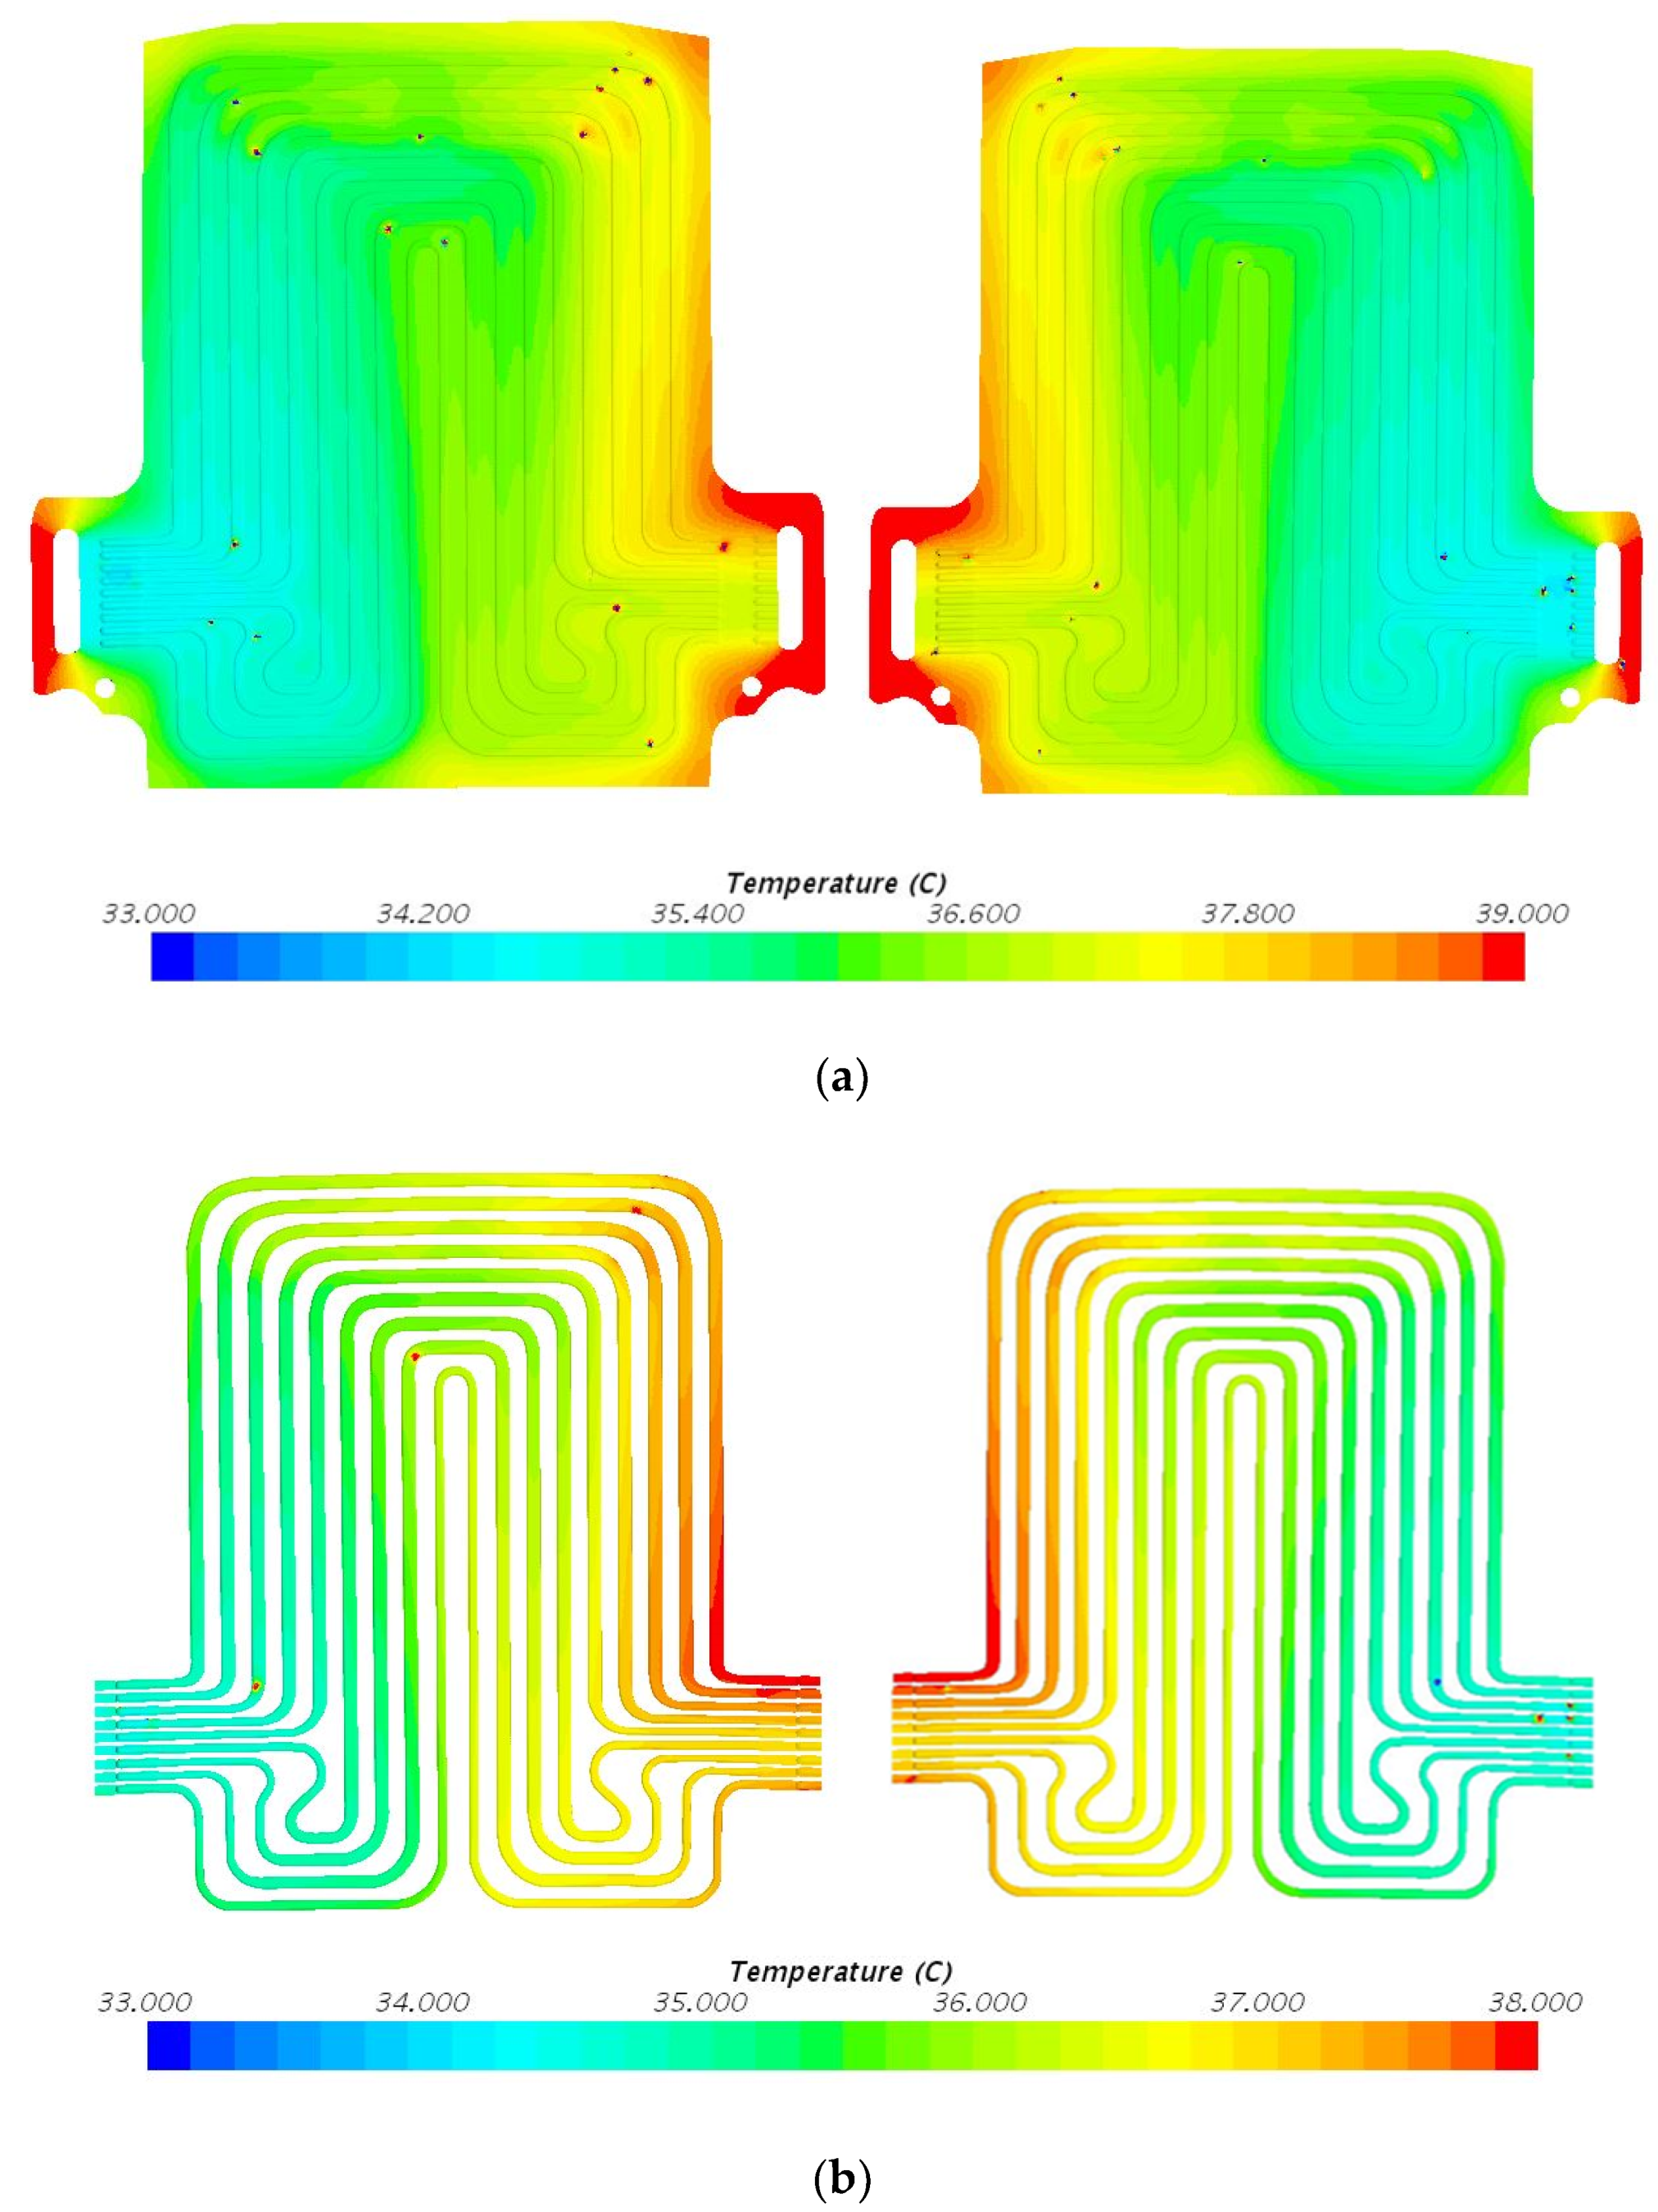
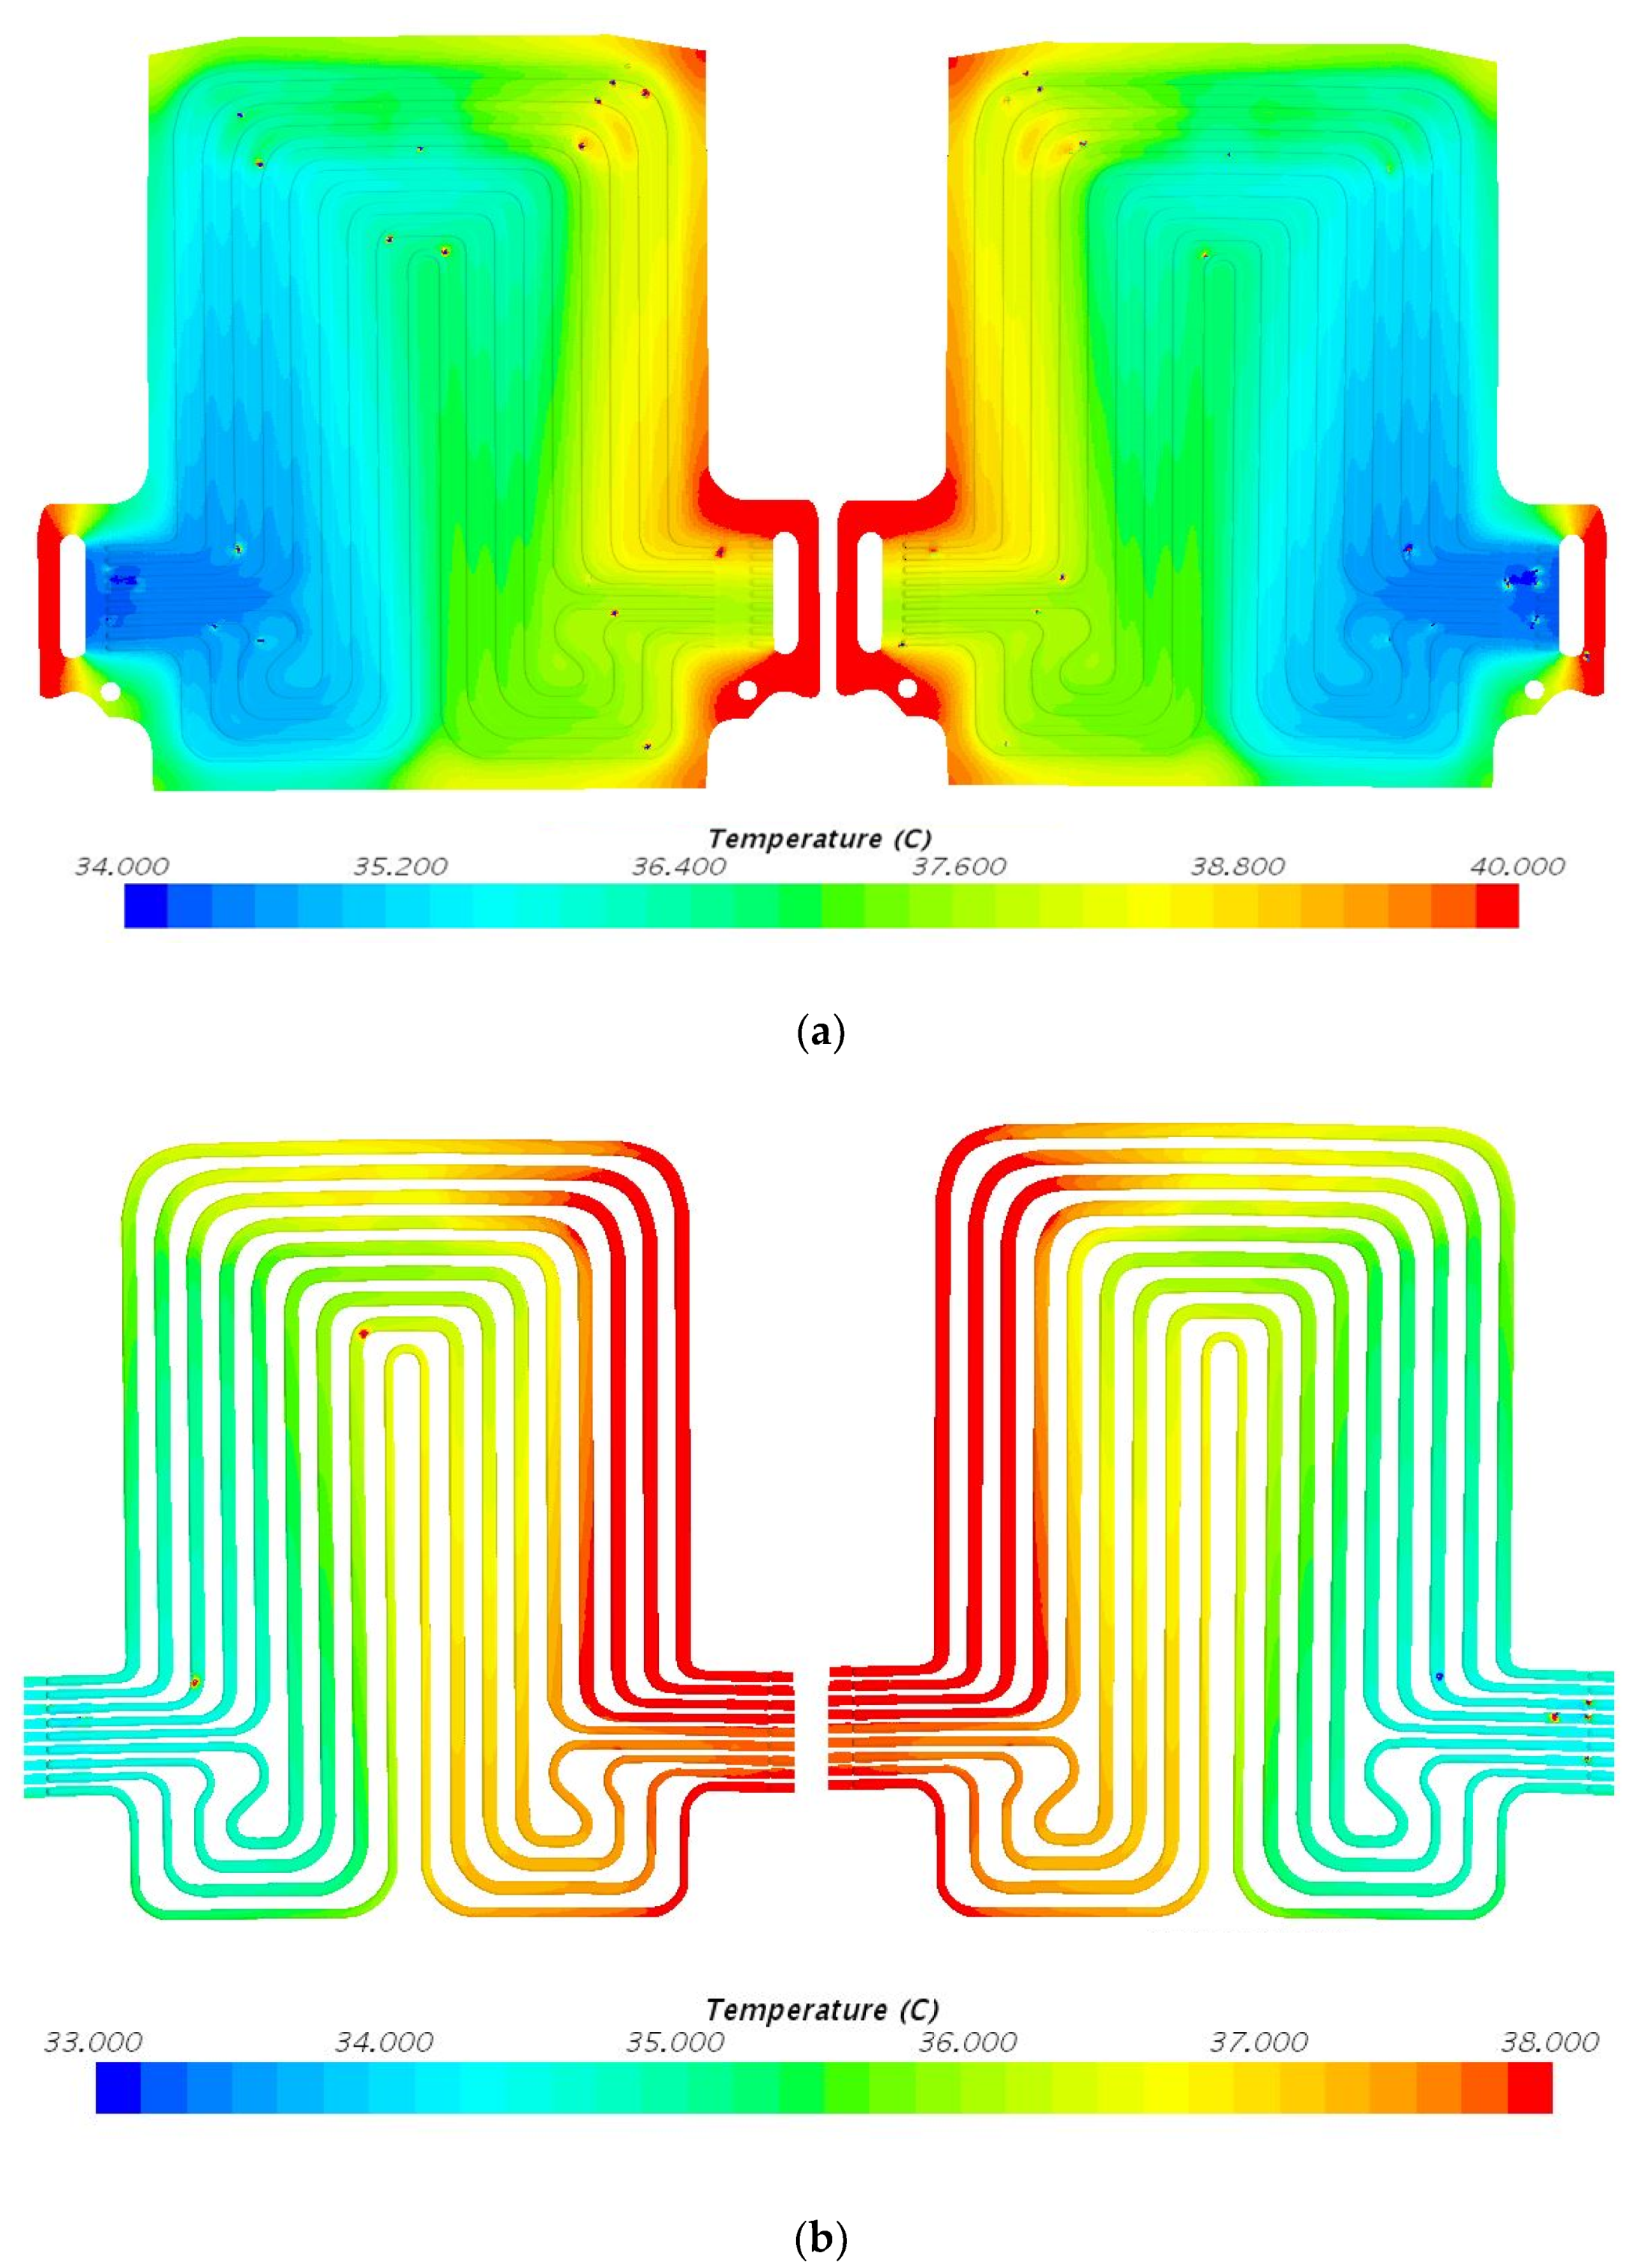
5.2. Temperature Contours at 4C (80 A) Discharge

Figure 11 shows temperature contours at 80 A discharge current and 5 °C water inlet temperature with heat flux values near cathode = 3112.2 W/m2, anode = 3072.8 W/m2, and mid surface = 764.1 W/m2. Figure 12 shows temperature contours at 80 A discharge current and 15 °C water inlet temperature with heat flux values near cathode = 2419.0 W/m2, anode = 2887.1 W/m2, and mid surface = 697.3 W/m2. Figure 13 demonstrates temperature contours at 80 A discharge current and 25 °C water inlet temperature with heat flux values near cathode = 2309.3 W/m2, anode = 2648.2 W/m2, and mid surface = 611.1 W/m2. Figure 14 shows temperature contours at 80 A discharge current and 35 °C water inlet temperature with heat flux values near cathode = 2160.2 W/m2, anode = 2101.5 W/m2, and mid surface = 471.8 W/m2. It is noted that, as the battery discharged, the flowing water inside the cooling plate got heated because the heat was first conducted to the cooling plate and subsequently transferred to the coolant by convection. The joule heating is the dominant factor for heat generation. As the discharge current changed from 60 A to 80 A, there was an increase in temperature values as well. The pattern observed was that increased discharge currents and increased ambient temperatures resulted in higher temperatures in the cooling plate. Table 3 gives the outline of inlet and outlet water temperatures at 80 A discharge current and different working temperature conditions of 5 °C, 15 °C, 25 °C, and 35 °C. Table 3 also provides the difference in experimental and simulated values obtained from STAR CCM+ software. It was also found that the simulated values were higher than experimental values. In addition, the general cooling patterns were identical, similar to the results discussed in Section 5.1. There were noteworthy temperature differences at the inlet of the cooling plate where the water was coldest.

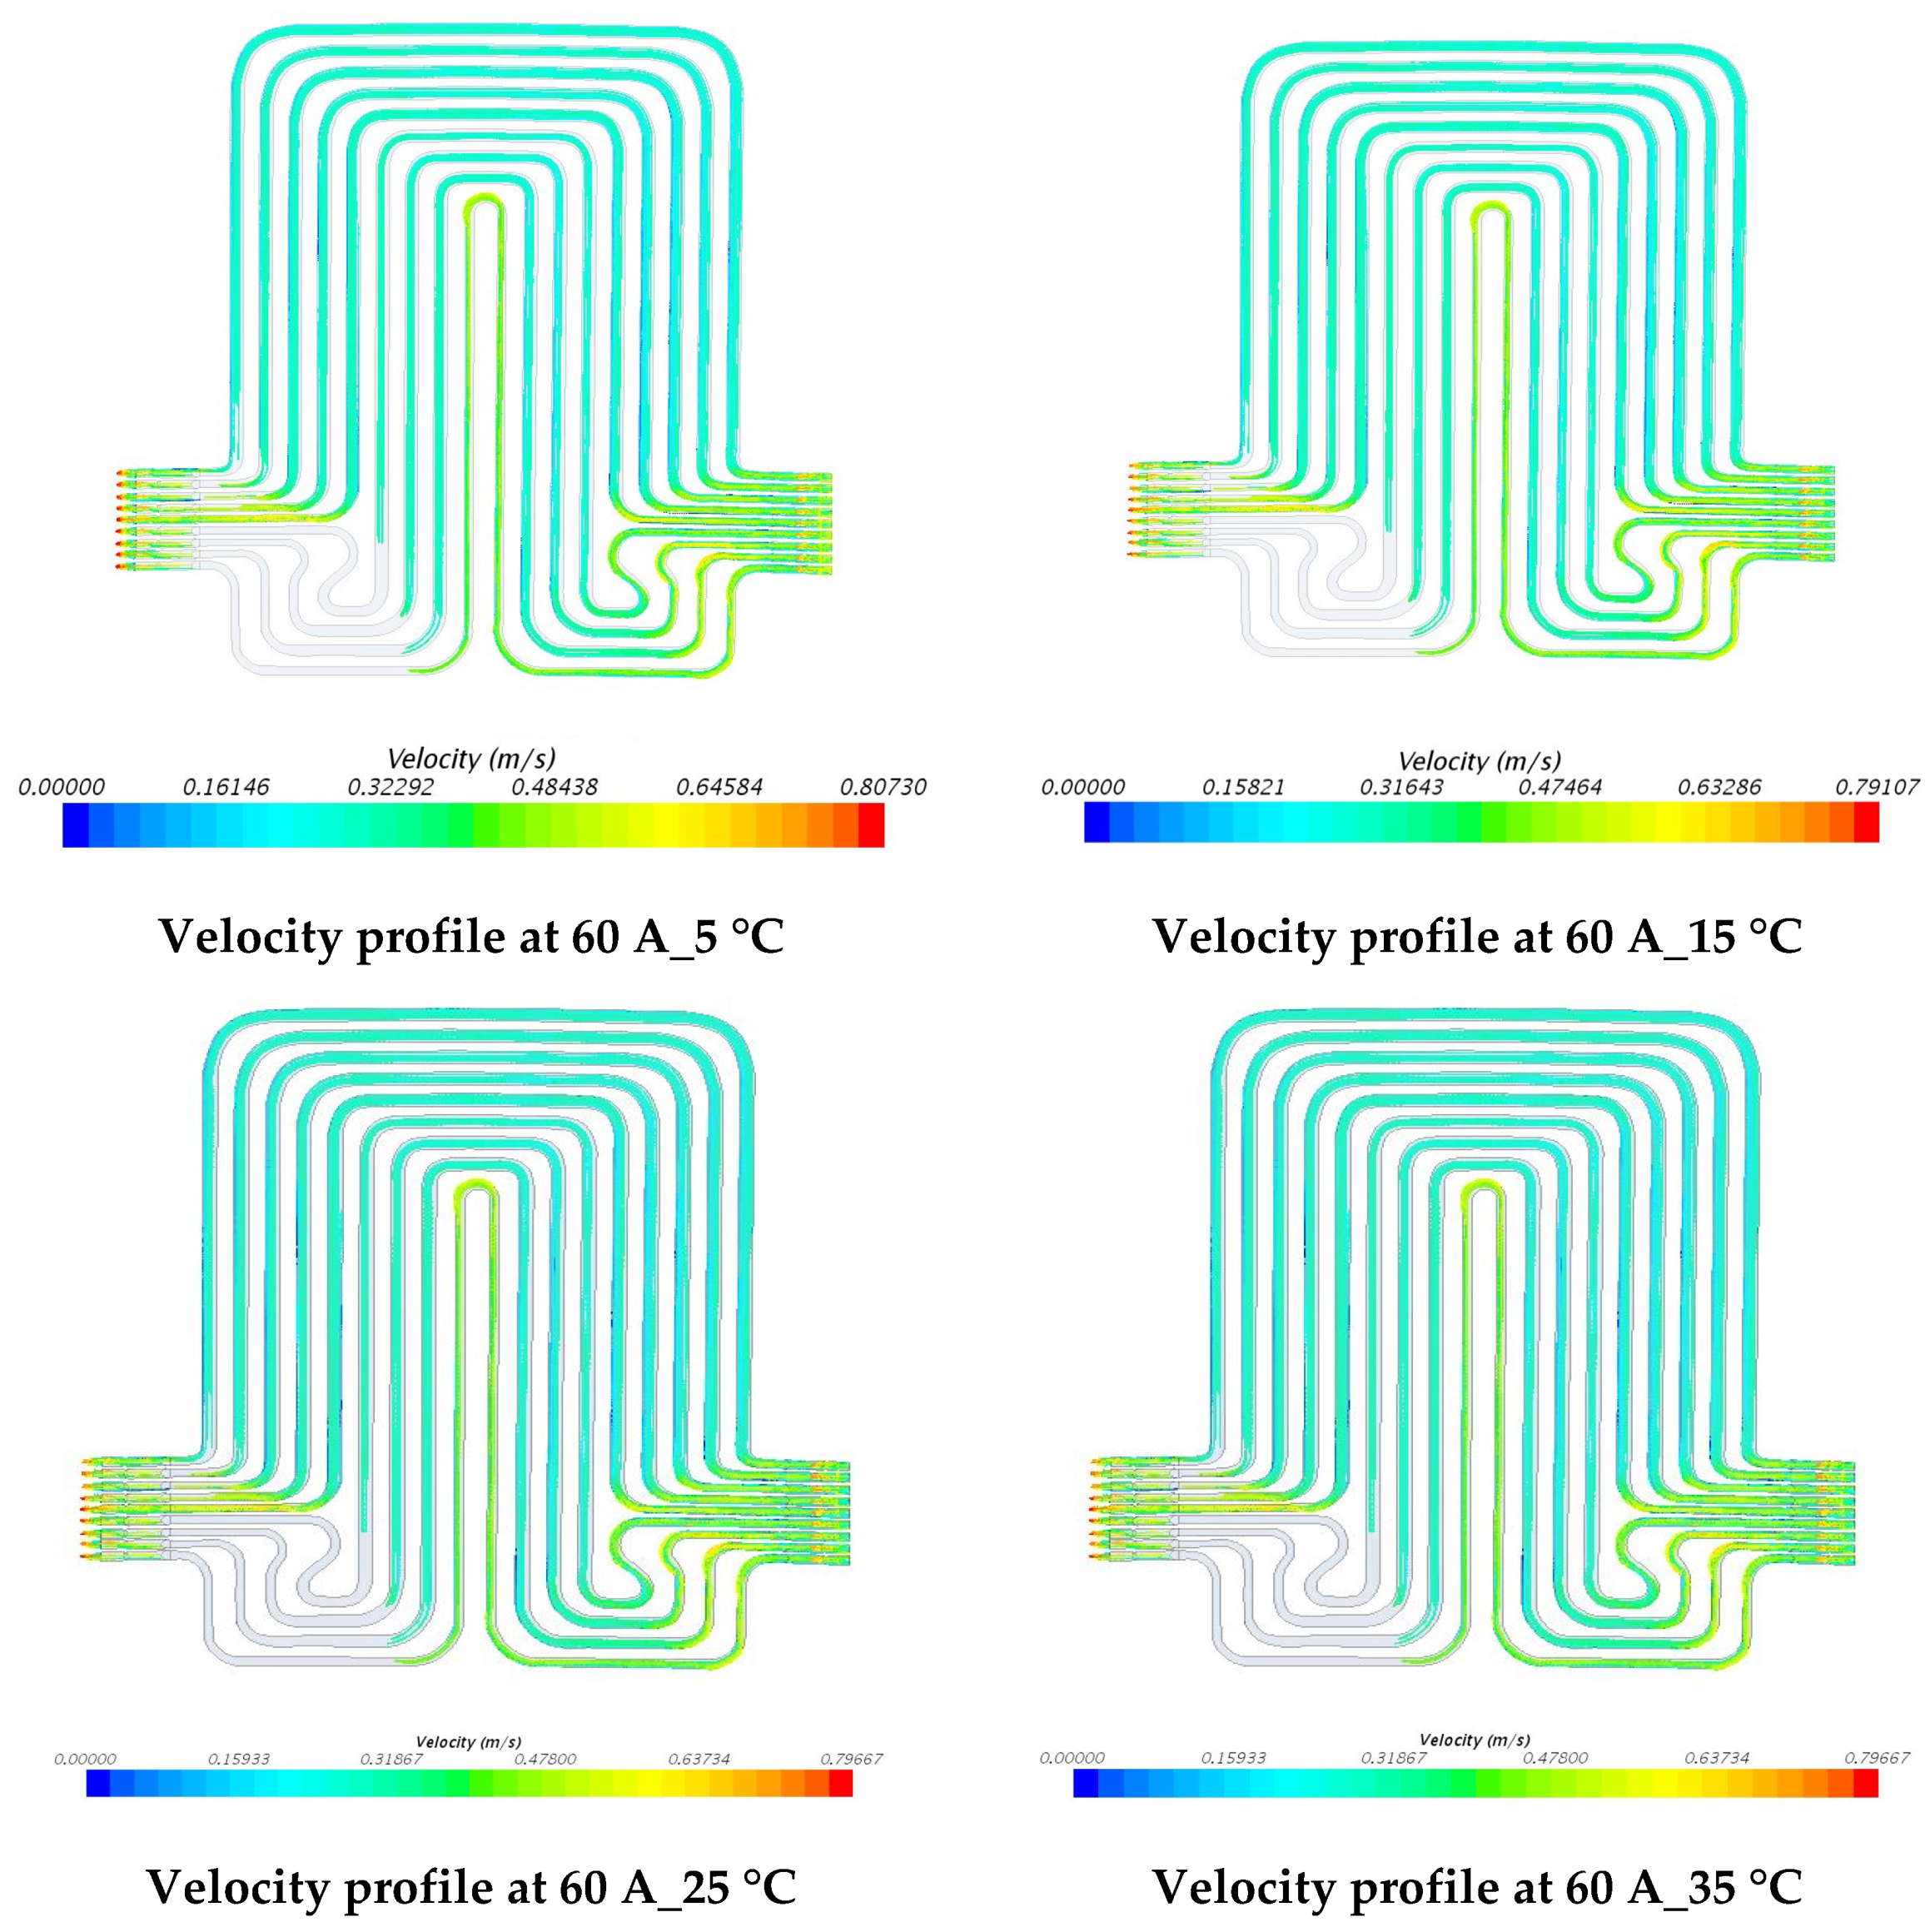
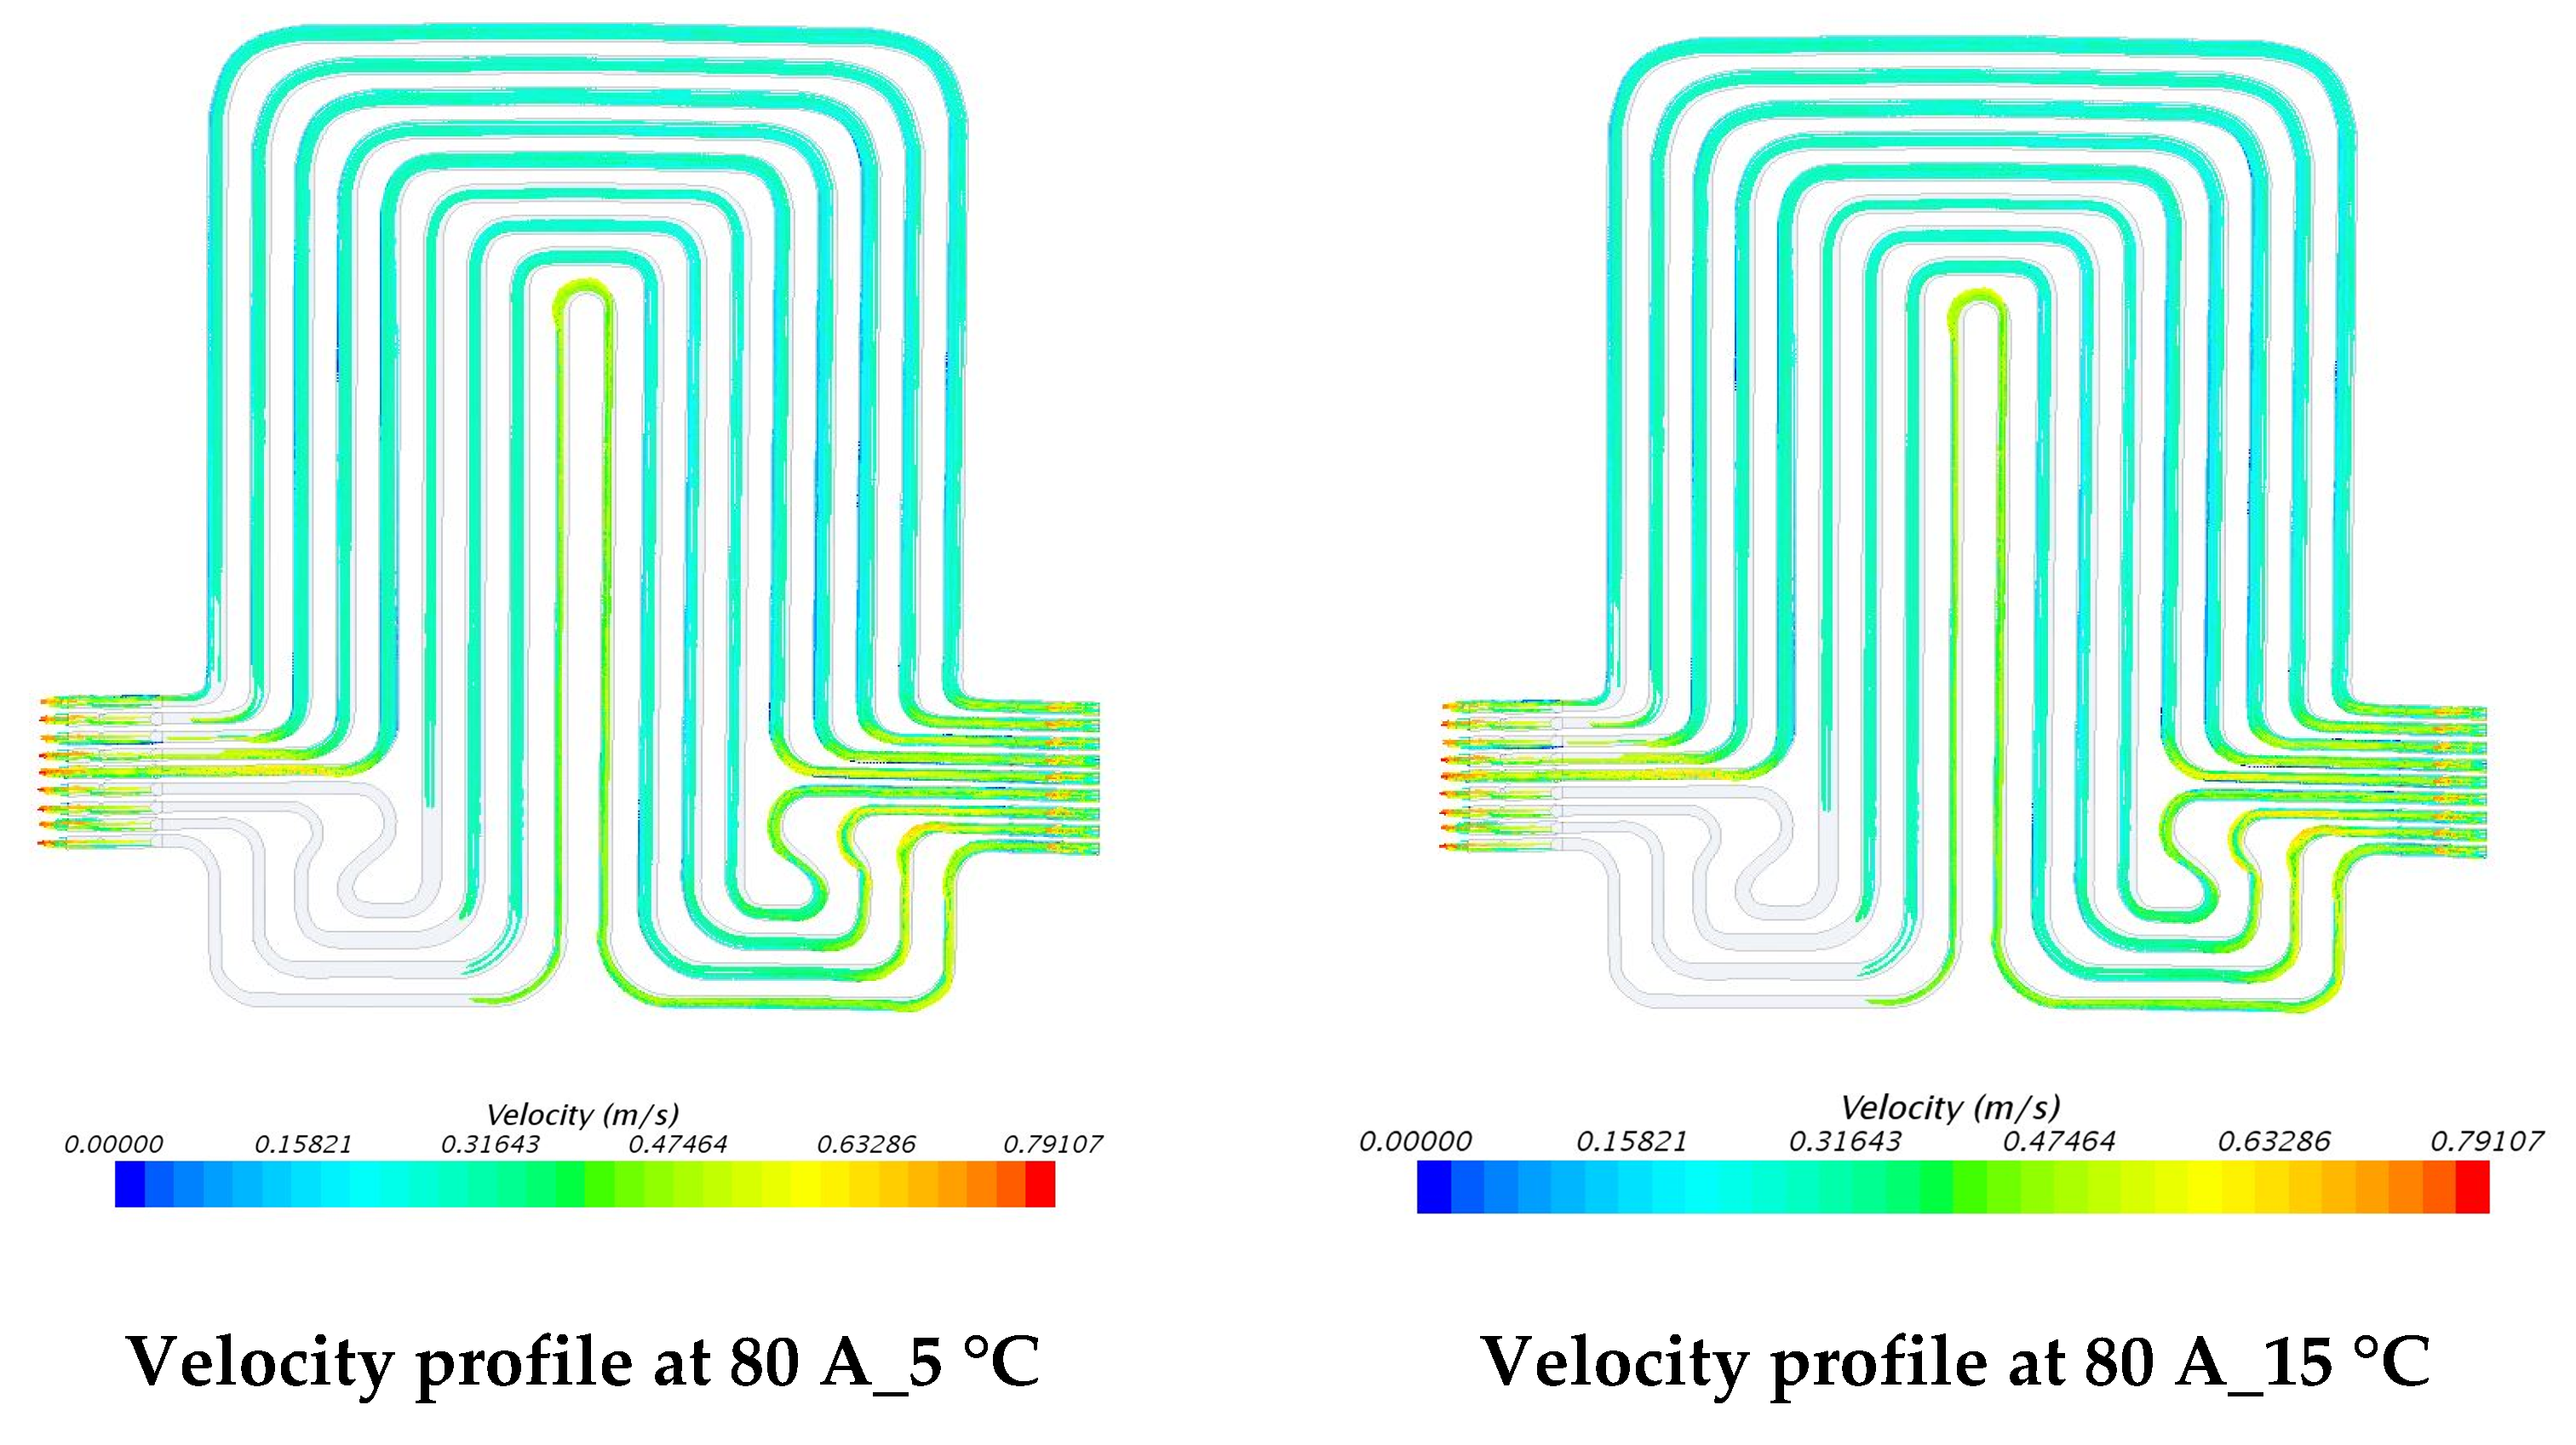
5.3. Velocity Contours at 3C (60 A) and 4C (80 A) Discharge

The investigations of velocity contours can provide insights into future design considerations by comparing contour results of velocity and comparing with respective contour results of temperatures. The velocity contours at 60 A and 80 A discharge currents and 5 °C, 15 °C, 25 °C, and 35 °C working temperatures appear in Figure 15 and Figure 16. The velocity contours were identical in all the cases, in accordance with general trends, given the low temperatures associated in the modeling that would have had a minimal impact on the water density. These results might be influenced by the lower y+ value, wall functions and turbulence model utilized. It was also observed that the velocity distribution at the inlet to the cooling plate and the outlet from the cooling plate was curved with relatively higher velocity gradients.

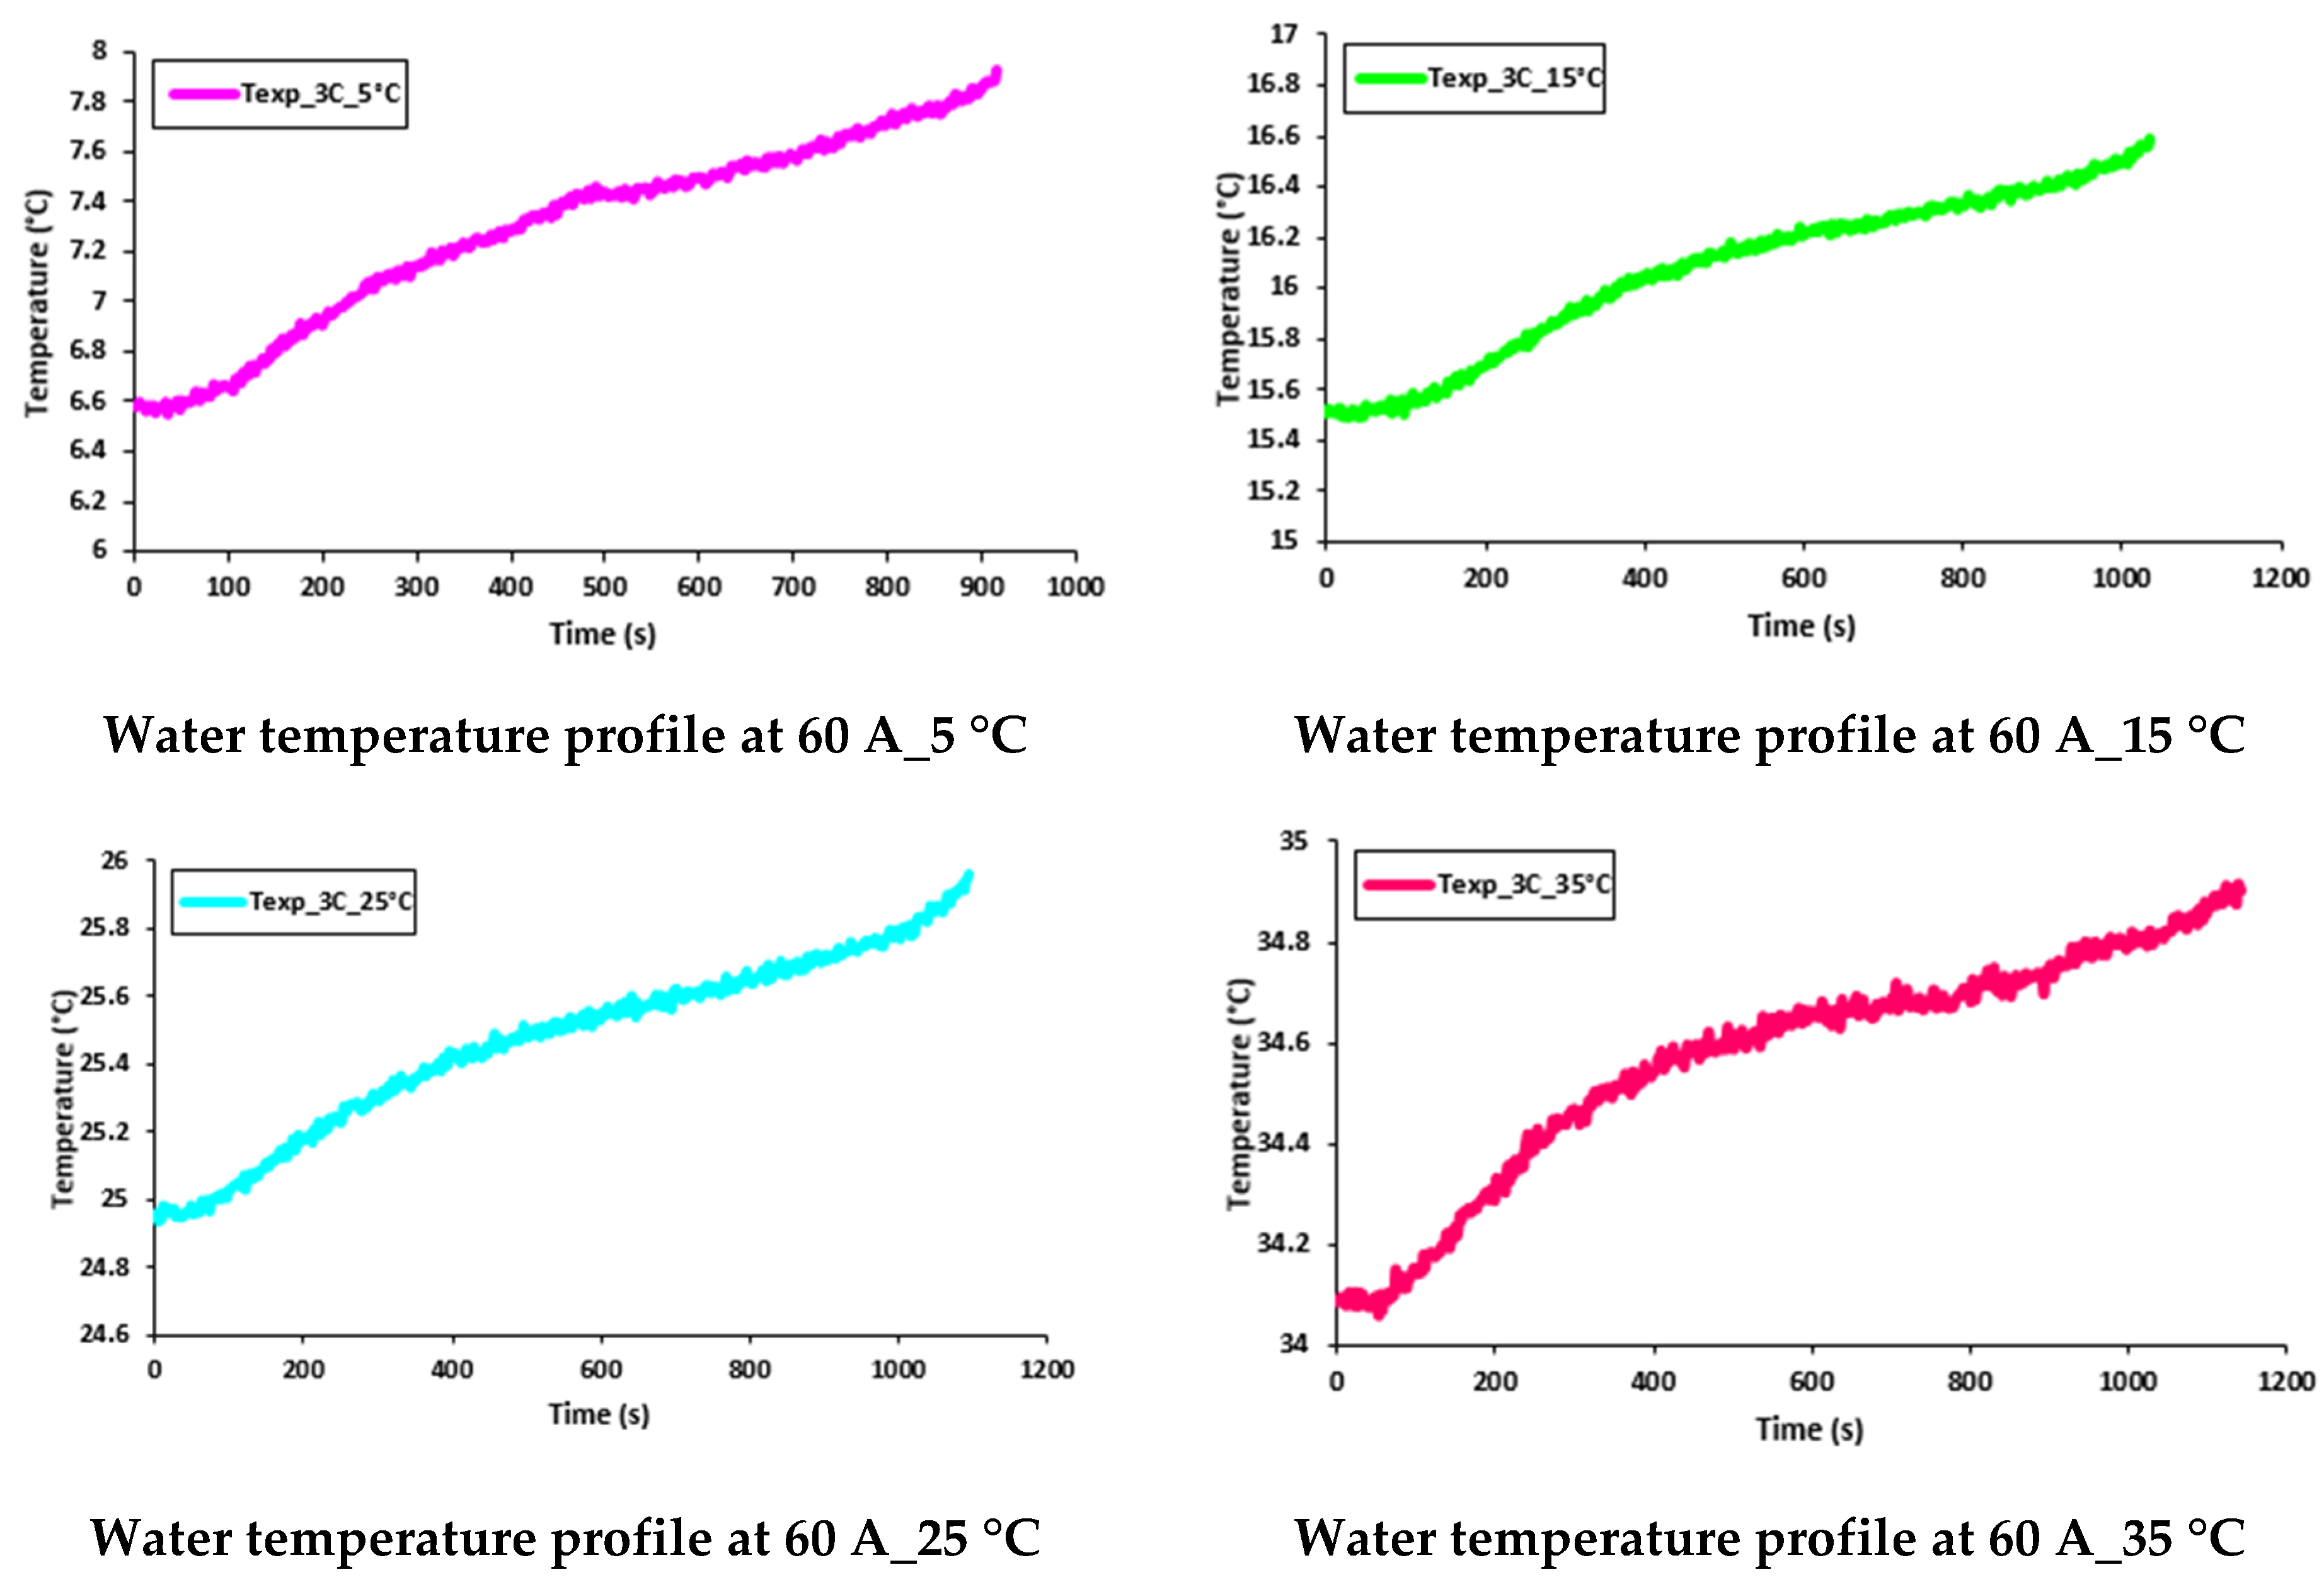
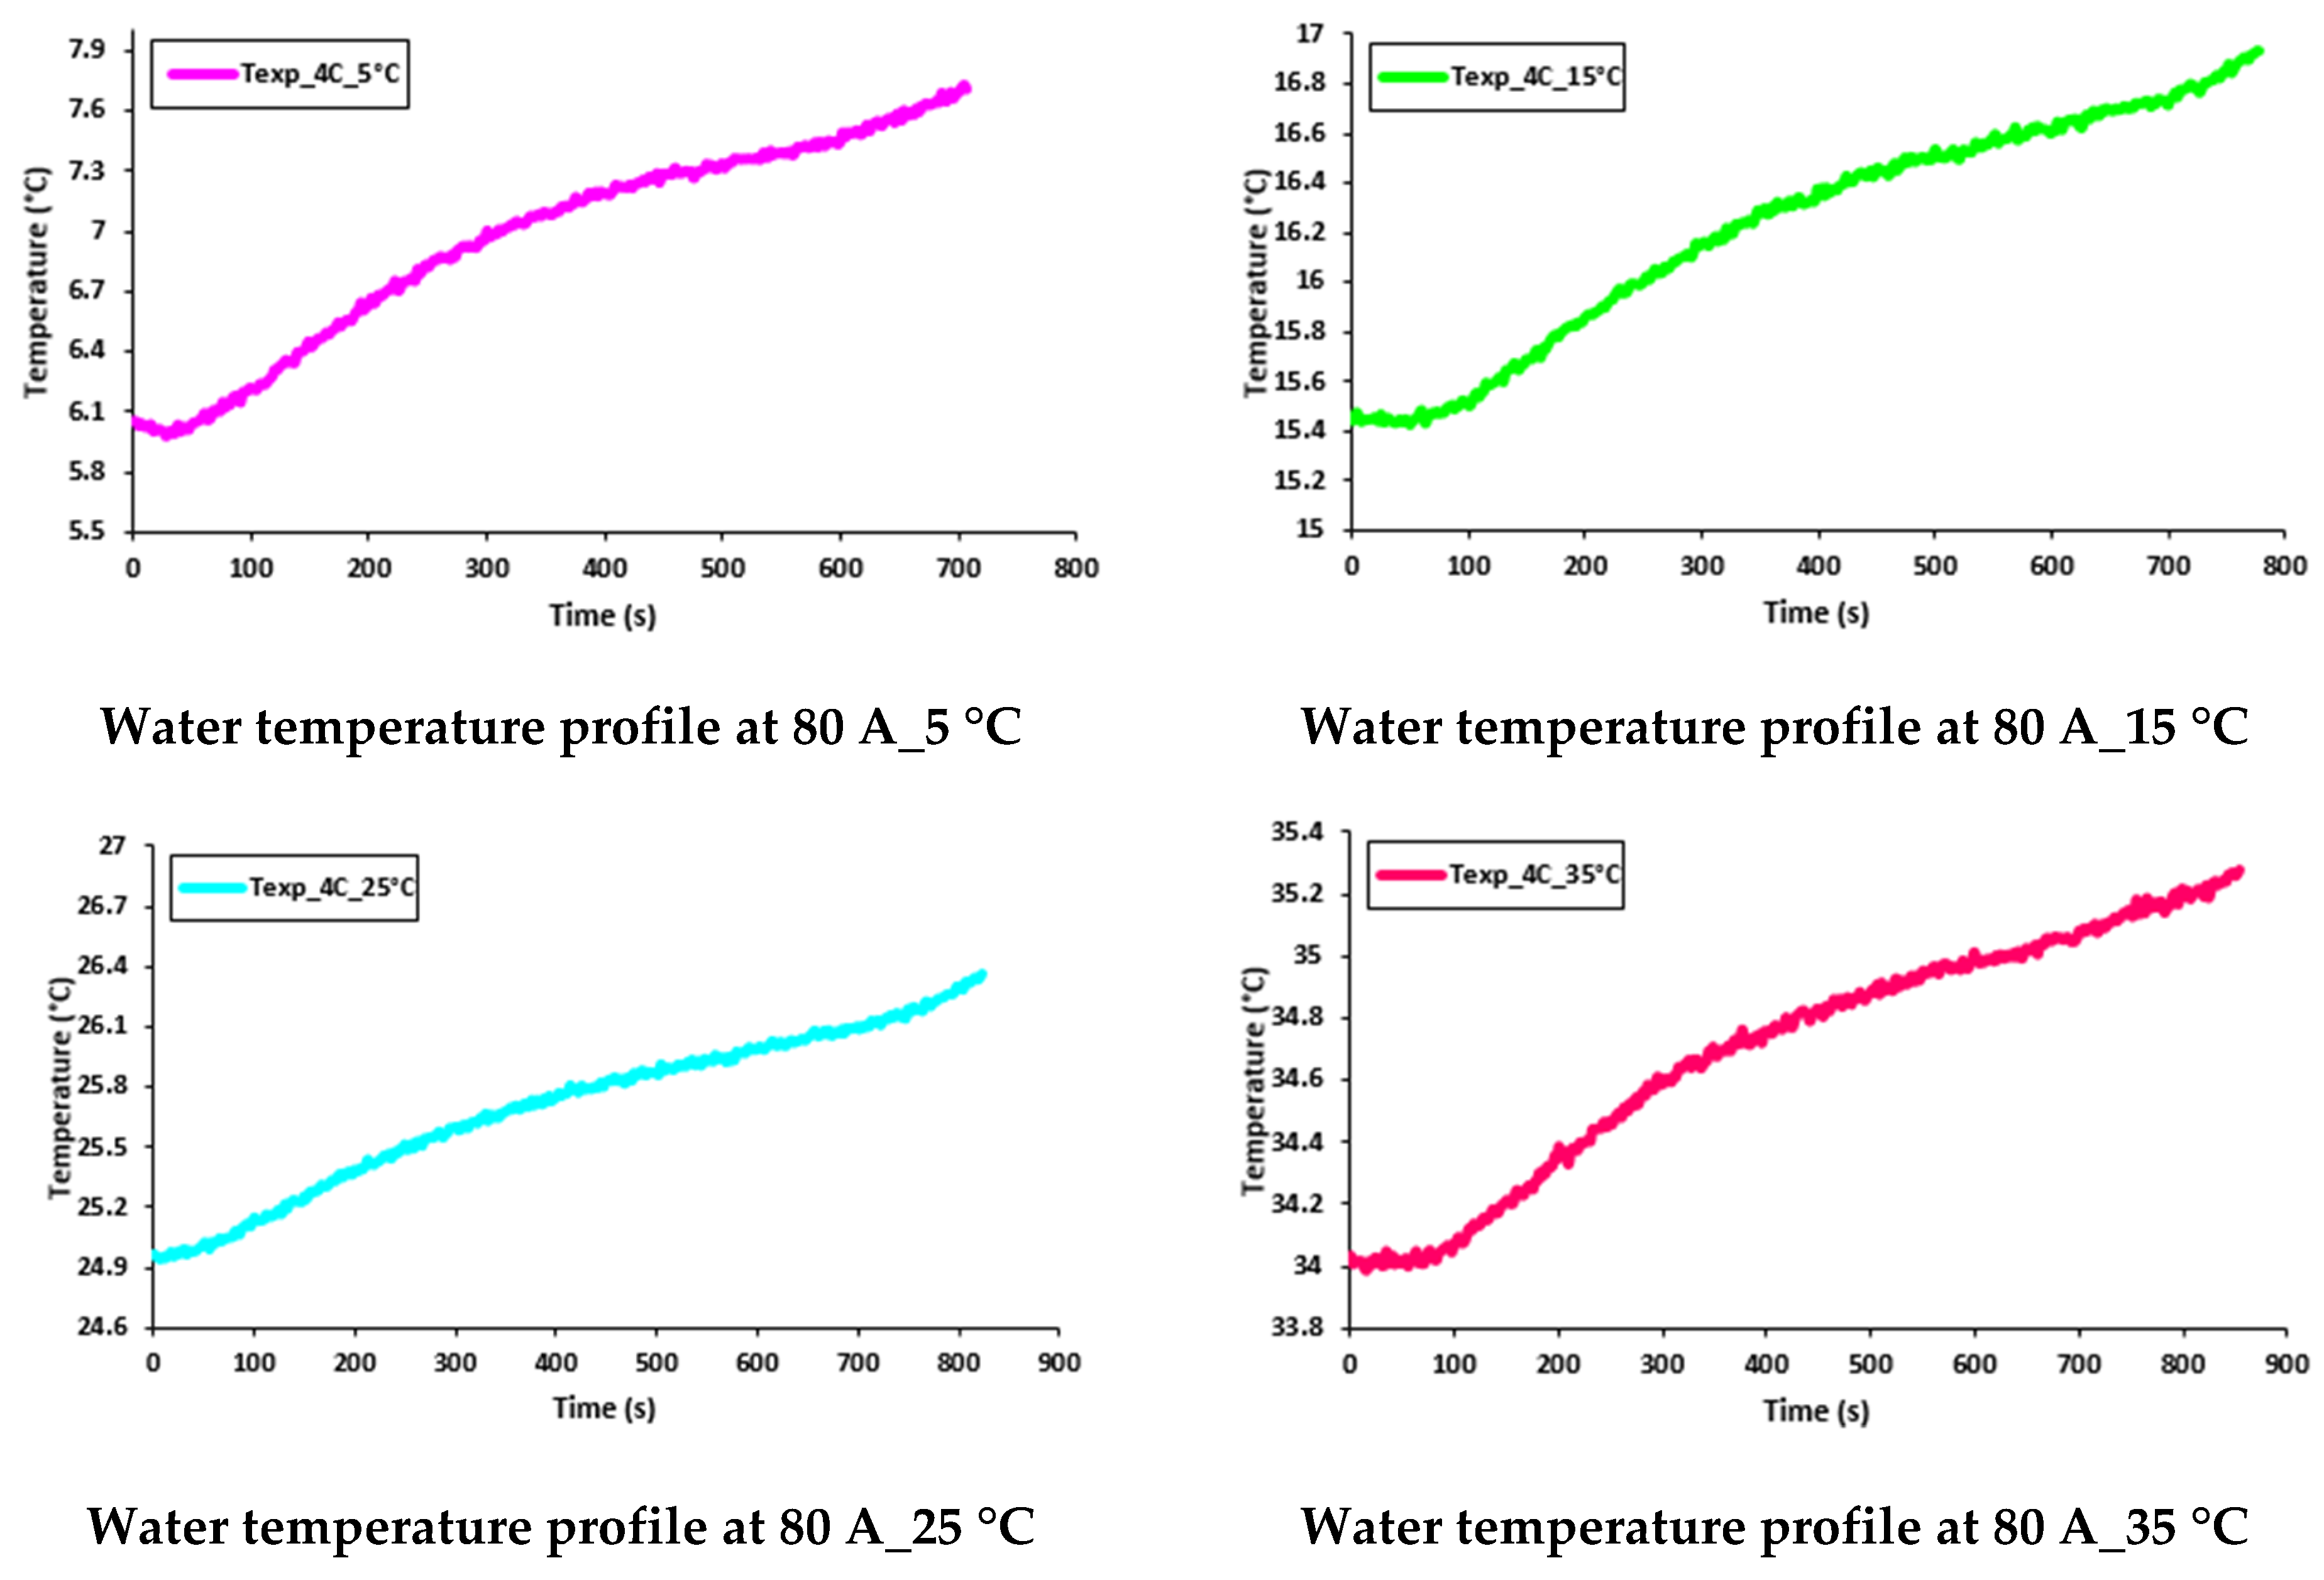
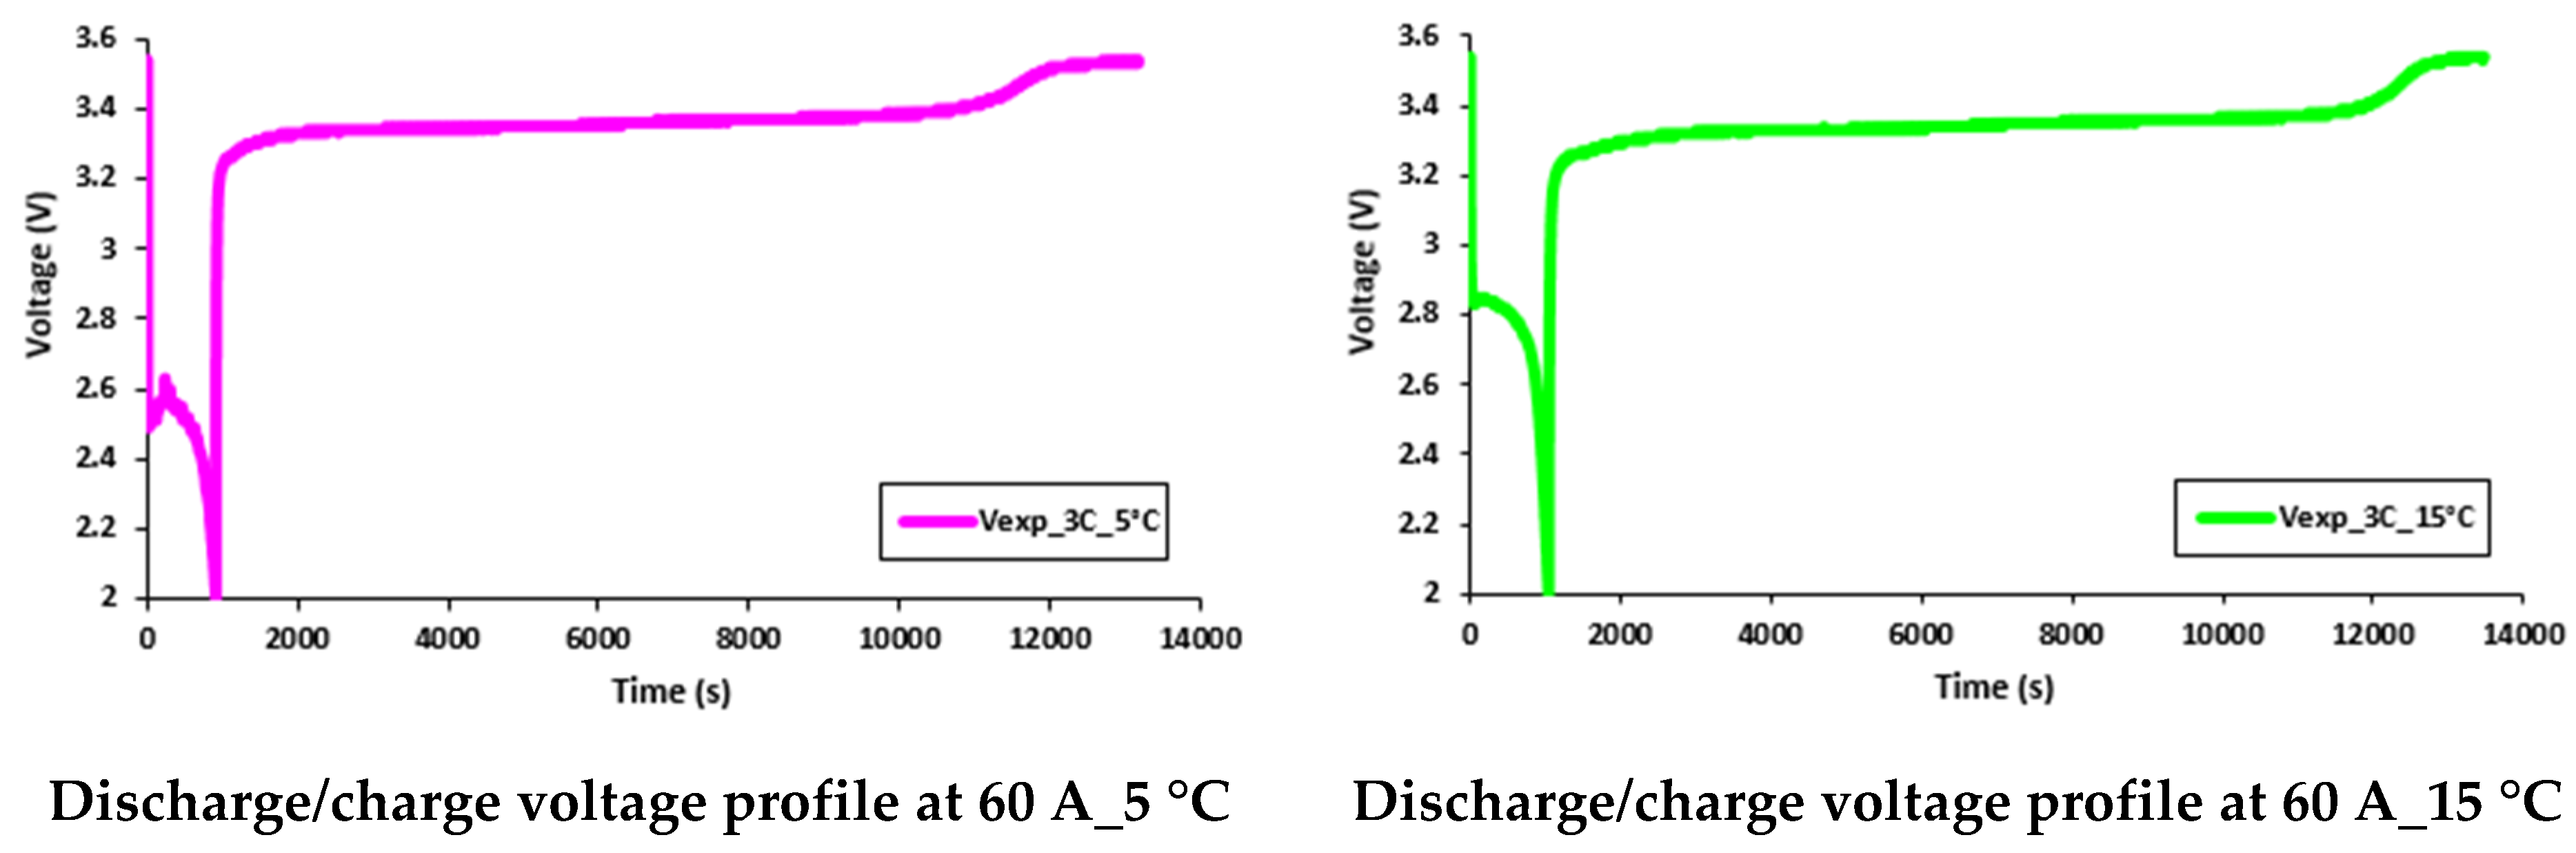
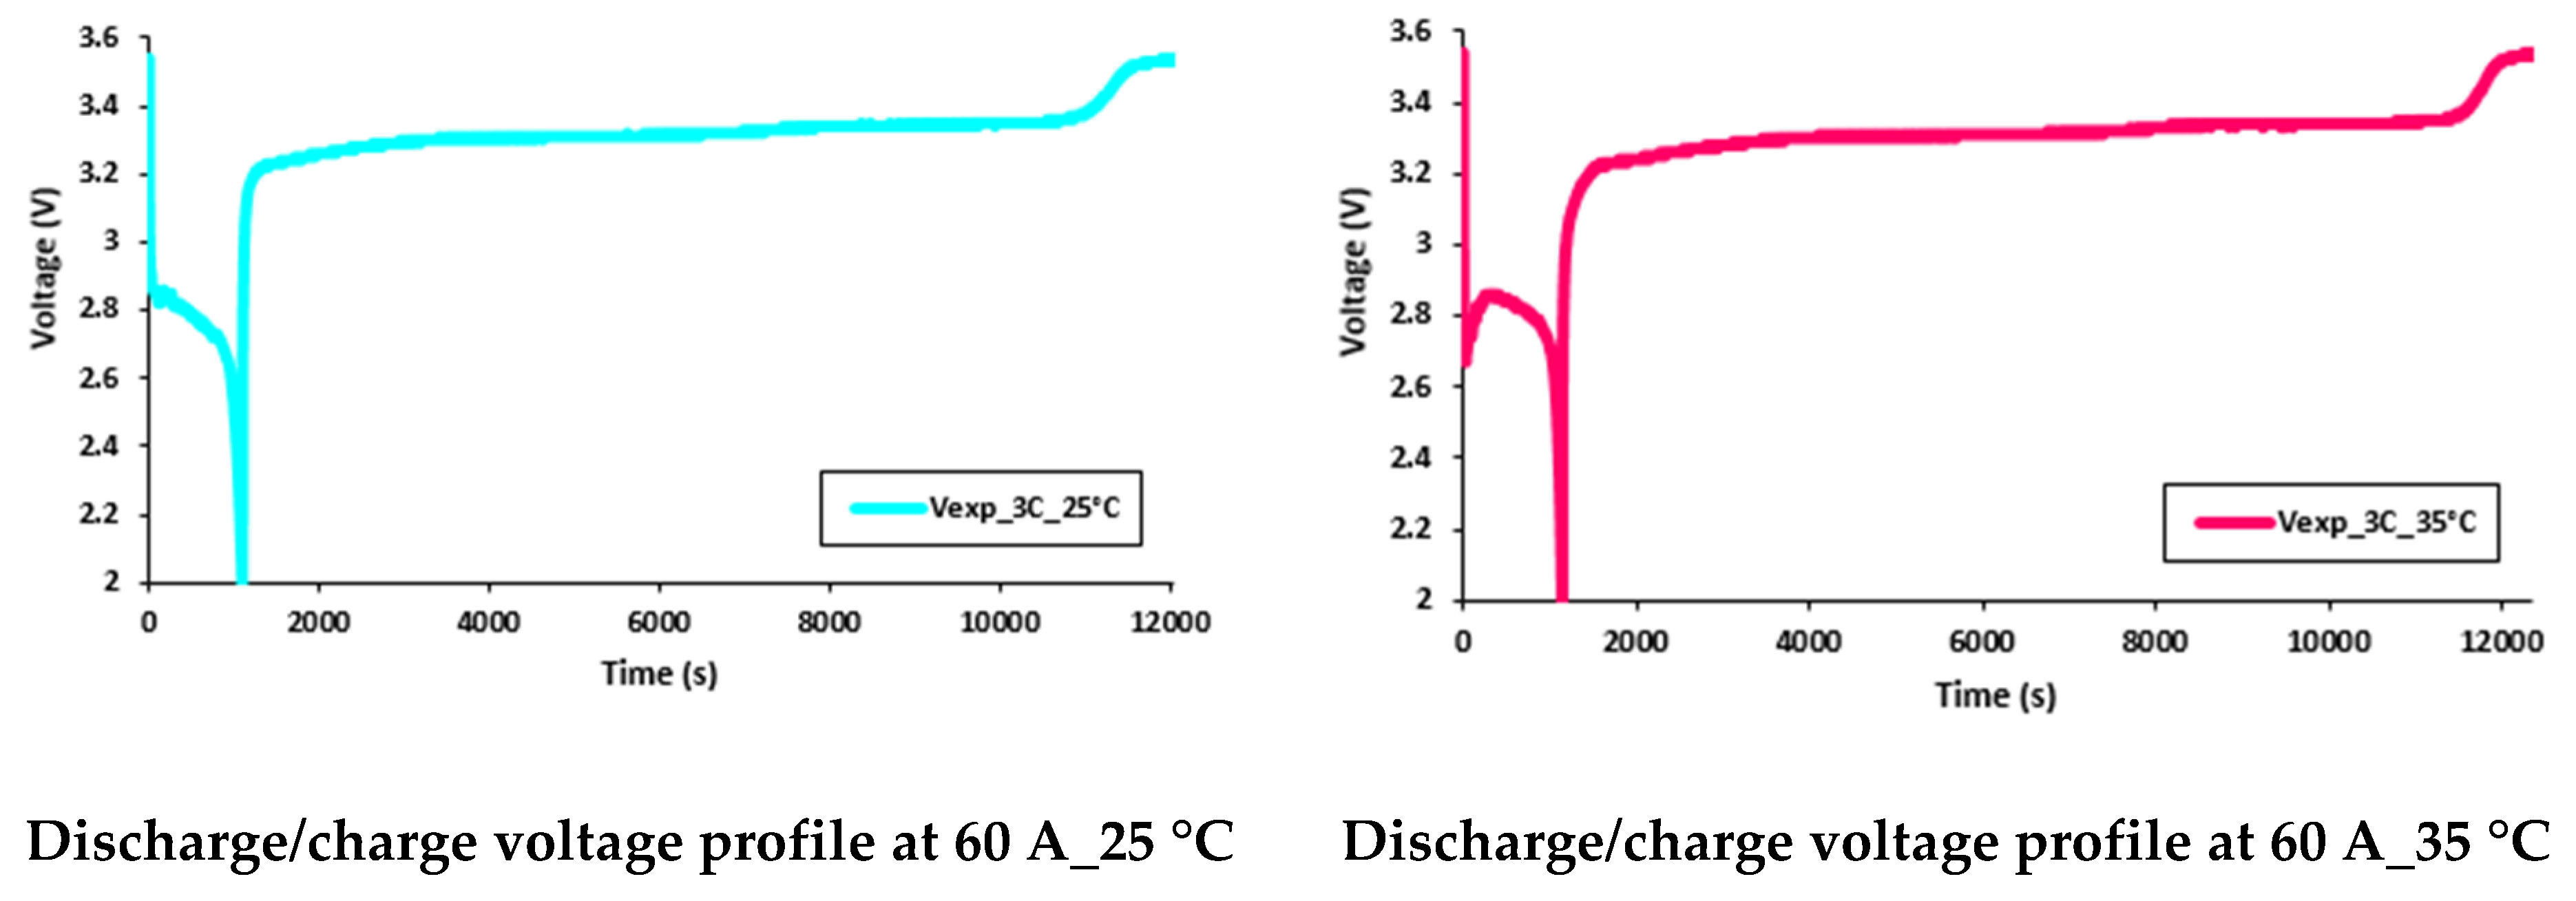
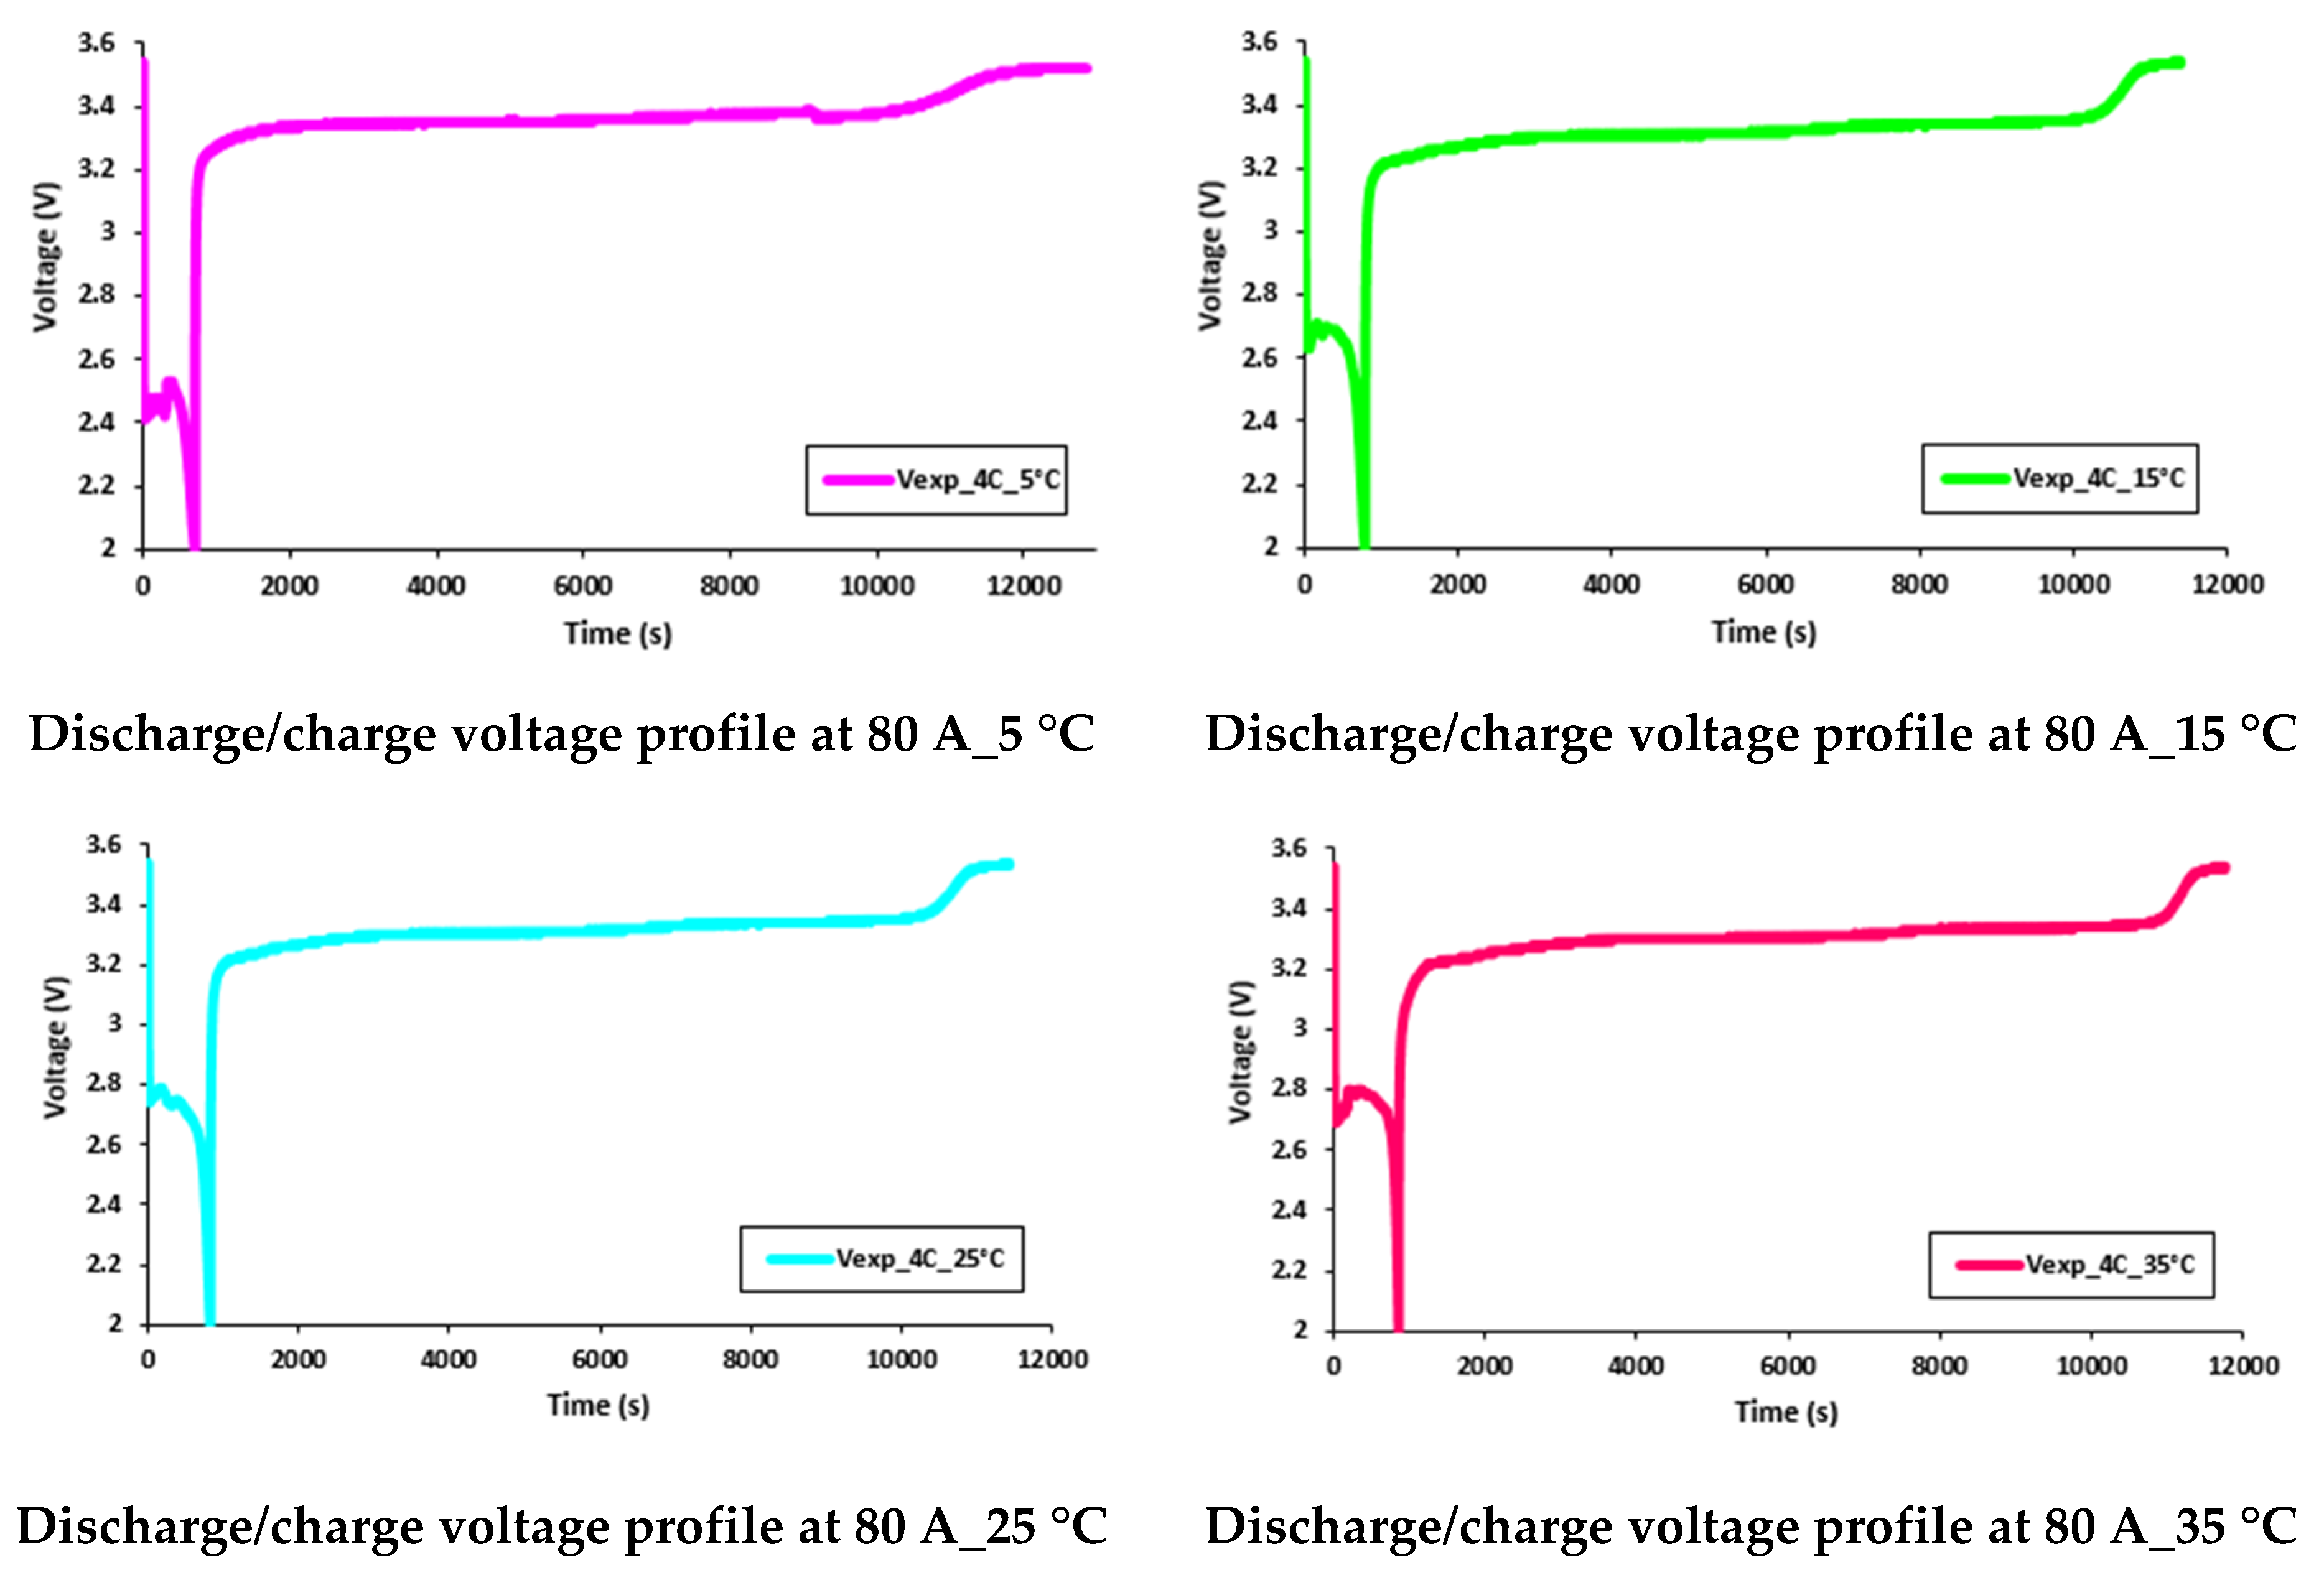
5.4. Transient Temperature Profiles of Water Flow and Voltage Distributions

Figure 17 and Figure 18 show the transient behavior of water flowing inside the cooling plates at 60 A and 80 A constant current discharges with various working temperatures of 5 °C, 15 °C, 25 °C, and 35 °C. As discussed earlier, the increase in temperature was due to the joule heating I2R from the LIB during discharge.
It was discovered that the working temperature had a great impact on the battery performance. At lower discharge currents, the battery capacity was close to the manufacturer’s supplied data sheet, but as discharge current increased, there was a decrease in the discharge capacity. Further, when the working temperature changed from 35 °C to 5 °C, there was a more prominent decrease in the discharge capacity. Consequently, it is clear that as the working temperature decreased, the battery discharge capacity also decreased. These effects (reduction in battery discharge capacity) can be seen in Figure 19 and Figure 20, which present the discharge/charge profiles at 60 A and 80 A constant current discharges (and charge current being 20 A) with various working temperatures of 5 °C, 15 °C, 25 °C, and 35 °C.

6. Conclusions

This paper presented a numerical model using STAR CCM+ for CFD simulations at high C-rates and diverse working temperatures of the liquid (water) with 5 °C, 15 °C, 25 °C, and 35 °C. We discovered that the temperature distributions within cooling plate channels increased with C-rates (3C to 4C). As C-rate increased, the heat flux values measured near the anode, the cathode, and the middle surface also increased. The cooling patterns obtained from simulation were similar to the experimental values with slightly higher values. The velocity plots were identical for all cases. There results provide valuable information on the design considerations that must be made for battery cooling systems in EVs.

Author Contributions

Conceptualization, S.P., Formal analysis, M.-K.T.; Supervision, R.F. and M.F.; Validation, K.G.; Writing—original draft, S.P.; Writing—review and editing, M.-K.T. and S.P. All authors have read and agreed to the published version of the manuscript.

Funding

This research received no external funding.

Acknowledgments

This research work (reverse engineering, CT scanning, MeshWorks and STAR CMM+ software) was done at Detroit Engineering Products (DEP), Michigan, USA, during year 2018–2019. The experimental data was used from University of Waterloo for the model development and validation. This work was supported by equipment and manpower from the Department of Chemical Engineering at the University of Waterloo. Special thanks to Danielle Skeba for the contribution in editing the paper.

Conflicts of Interest

The authors declare no conflict of interest.

Nomenclature

C μ constant
C 1 , C 2 , C 3 constant for model
Ccell potential or cell voltage (V)
Icurrent (A)
G k turbulence kinetic energy generation due to the mean velocity gradients
G b turbulence kinetic energy generation due to buoyancy
k turbulent kinetic energy (J)
L characteristic dimension (m)
P pressure (Pa)
P r Prandtl number
P r t Turbulent Prandtl number
ReReynold’s number
S k   and   S ε user-defined source terms
ttime (s)
Ttemperature (°C or K)
Vspeed (m/s)
V ¯ average velocity (m/s)
v s mean fluid velocity (m/s)
y+enhanced wall treatment
ω turbulent eddy frequency (1/s)
Y M the contribution of the fluctuating dilatation in compressible turbulence to the overall dissipation rate
Greek Symbols
ν kinematic fluid viscosity (m2/s)
λ Reynold’s stress
ρ density (kg/m3)
μ dynamic fluid viscosity (Ns/m2)
gradient operator
σ k   and   ε k Turbulent Prandtl numbers for k and ε
Subscripts
simsimulated
actactual
Superscripts
°degree
+Related to wall treatment
Acronyms
BCSBattery cooling system
BEVBattery electric vehicle
BTMSBattery thermal management system
CCapacity
CCConstant-current
CVConstant-voltage
CTComputed tomography
CADComputer aided design
CFDComputational fluid dynamics
DEPDetroit Engineered Products, Inc.
EVElectric vehicle
ESSEnergy storage system
FEFinite element
HEVHybrid electric vehicle
HFSHeat flux sensor
HPBTMSHeat pipe battery thermal management system
LIBLithium-ion battery
LiFePO4Lithium iron phosphate
LEDLight emitting diode
MeshWorksPopular proprietary software package used for CAD and mesh generation
MWCNTmulti-walled carbon nanotubes
PCPersonal computer
PCMPhase change material
PHEVPlug-In hybrid electric vehicle
REReverse engineering
RANSReynolds-Averaged Navier-Stokes
STAR CCM+Simulation of Turbulent flow in Arbitrary Regions-Computational Continuum Mechanics + (C++ based)
TMSThermal management system
1DOne-dimensional
2D Two-dimensional
3DThree-dimensional
18650IFR 18650 cylindrical valence cells (“I” stands for Li-ion rechargeable, “F” stands for the element “Fe” which is Iron, “R” indicates that the cell shape is round, 18650 means 18 mm diameter and 650 means 65 mm height)
25S2P25 series 2 parallel

References

  1. Walter, M.; Kravchyk, K.V.; Böfer, C.; Widmer, R.; Kovalenko, M.V. Polypyrenes as High-Performance Cathode Materials for Aluminum Batteries. Adv. Mater. 2018, 30, 1705644. [Google Scholar] [CrossRef] [PubMed] [Green Version]
  2. Angell, M.; Pan, C.-J.; Rong, Y.; Yuan, C.; Lin, M.-C.; Hwang, B.-J.; Dai, H. High Coulombic efficiency aluminum-ion battery using an AlCl3-urea ionic liquid analog electrolyte. Proc. Natl. Acad. Sci. USA 2017, 114, 834–839. [Google Scholar] [CrossRef] [PubMed] [Green Version]
  3. Crawford, A.J.; Huang, Q.; Kintner-Meyer, M.C.; Zhang, J.-G.; Reed, D.M.; Sprenkle, V.L.; Viswanathan, V.V.; Choi, D. Lifecycle comparison of selected Li-ion battery chemistries under grid and electric vehicle duty cycle combinations. J. Power Sources 2018, 380, 185–193. [Google Scholar] [CrossRef]
  4. Panchal, S.; Mathewson, S.; Fraser, R.; Culham, R.; Fowler, M. Measurement of Temperature Gradient (dT/dy) and Temperature Response (dT/dt) of a Prismatic Lithium-Ion Pouch Cell with LiFePO4 Cathode Material. SAE Tech. Pap. Ser. 2017, 1. [Google Scholar]
  5. Panchal, S.; Rashid, M.; Long, F.; Mathew, M.; Fraser, R.; Fowler, M. Degradation Testing and Modeling of 200 Ah LiFePO4 Battery. SAE Tech. Pap. Ser. 2018. [Google Scholar]
  6. Panchal, S. Impact of Vehicle Charge and Discharge Cycles on the Thermal Characteristics of Lithium-ion Batteries; University of Waterloo: Waterloo, ON, Canada, 2014. [Google Scholar]
  7. Panchal, S. Experimental Investigation and Modeling of Lithium-ion Battery Cells and Packs for Electric Vehicles; University of Ontario Institute of Technology: Oshawa, ON, Canada, 2016. [Google Scholar]
  8. Al-Zareer, M.; Dincer, I.; Rosen, M.A. Heat and mass transfer modeling and assessment of a new battery cooling system. Int. J. Heat Mass Transf. 2018, 126, 765–778. [Google Scholar] [CrossRef]
  9. Waldmann, T.; Wilka, M.; Kasper, M.; Fleischhammer, M.; Wohlfahrt-Mehrens, M. Temperature dependent ageing mechanisms in Lithium-ion batteries—A Post-Mortem study. J. Power Sources 2014, 262, 129–135. [Google Scholar] [CrossRef]
  10. Tran, M.-K.; Fowler, M. A Review of Lithium-Ion Battery Fault Diagnostic Algorithms: Current Progress and Future Challenges. Algorithms 2020, 13, 62. [Google Scholar] [CrossRef] [Green Version]
  11. Panchal, S.; Mathewson, S.; Fraser, R.; Culham, R.; Fowler, M. Experimental Measurements of Thermal Characteristics of LiFePO4 Battery. SAE Tech. Pap. Ser. 2015. [Google Scholar]
  12. Panchal, S.; Mathewson, S.; Fraser, R.; Culham, R.; Fowler, M. Thermal Management of Lithium-Ion Pouch Cell with Indirect Liquid Cooling using Dual Cold Plates Approach. SAE Int. J. Altern. Powertrains 2015, 4, 293–307. [Google Scholar] [CrossRef]
  13. Ramadass, P.; Haran, B.; White, R.; Popov, B. Capacity fade of Sony 18650 cells cycled at elevated temperatures: Part II. Capacity fade analysis. J. Power Sources 2002, 112, 614–620. [Google Scholar] [CrossRef] [Green Version]
  14. Panchal, S.; Dincer, I.; Agelin-Chaab, M.; Fowler, M.; Fraser, R. Uneven temperature and voltage distributions due to rapid discharge rates and different boundary conditions for series-connected LiFePO 4 batteries. Int. Commun. Heat Mass Transf. 2017, 81, 210–217. [Google Scholar] [CrossRef]
  15. Uddin, A.I.; Ku, J. Design and Simulation of Lithium-Ion Battery Thermal Management System for Mild Hybrid Vehicle Application. SAE Tech. Pap. Ser. 2015. [Google Scholar]
  16. Wang, C.H.; Lin, T.; Huang, J.T.; Rao, Z.H. Temperature response of a high power lithium-ion battery subjected to high current discharge. Mater. Res. Innov. 2015, 19, S2–S156. [Google Scholar] [CrossRef]
  17. Panchal, S.; Dincer, I.; Agelin-Chaab, M.; Fraser, R.; Fowler, M. Experimental and theoretical investigation of temperature distributions in a prismatic lithium-ion battery. Int. J. Therm. Sci. 2016, 99, 204–212. [Google Scholar] [CrossRef]
  18. Panchal, S.; Dincer, I.; Agelin-Chaab, M.; Fraser, R.; Fowler, M. Thermal modeling and validation of temperature distributions in a prismatic lithium-ion battery at different discharge rates and varying boundary conditions. Appl. Therm. Eng. 2016, 96, 190–199. [Google Scholar] [CrossRef]
  19. Patil, M.S.; Panchal, S.; Kim, N.; Lee, M.-Y. Cooling Performance Characteristics of 20 Ah Lithium-Ion Pouch Cell with Cold Plates along Both Surfaces. Energies 2018, 11, 2550. [Google Scholar] [CrossRef] [Green Version]
  20. He, F.; Ma, L. Thermal Management in Hybrid Power Systems Using Cylindrical and Prismatic Battery Cells. Heat Transf. Eng. 2015, 37, 581–590. [Google Scholar] [CrossRef]
  21. Giuliano, M.R.; Prasad, A.K.; Advani, S. Experimental study of an air-cooled thermal management system for high capacity lithium–titanate batteries. J. Power Sources 2012, 216, 345–352. [Google Scholar] [CrossRef]
  22. Jin, L.W.; Lee, P.; Kong, X.; Fan, Y.; Chou, S. Ultra-thin minichannel LCP for EV battery thermal management. Appl. Energy 2014, 113, 1786–1794. [Google Scholar] [CrossRef]
  23. Rao, Z.; Wang, S. A review of power battery thermal energy management. Renew. Sustain. Energy Rev. 2011, 15, 4554–4571. [Google Scholar] [CrossRef]
  24. Lemmon, E.W.; Jacobsen, R.T. Viscosity and Thermal Conductivity Equations for Nitrogen, Oxygen, Argon, and Air. Int. J. Thermophys. 2004, 25, 21–69. [Google Scholar] [CrossRef]
  25. Park, H. A design of air flow configuration for cooling lithium ion battery in hybrid electric vehicles. J. Power Sources 2013, 239, 30–36. [Google Scholar] [CrossRef]
  26. Fan, L.-W.; Khodadadi, J.; Pesaran, A. A parametric study on thermal management of an air-cooled lithium-ion battery module for plug-in hybrid electric vehicles. J. Power Sources 2013, 238, 301–312. [Google Scholar] [CrossRef]
  27. Kelly, K.J.; Mihalic, M.; Zolot, M. Battery usage and thermal performance of the Toyota Prius and Honda Insight during chassis dynamometer testing. In Proceedings of the Seventeenth Annual Battery Conference on Applications and Advances (Cat. No.02TH8576), Long Beach, CA, USA, 18 January 2002; Institute of Electrical and Electronics Engineers (IEEE): Piscataway, NJ, USA, 2002; pp. 247–252. [Google Scholar]
  28. Berdichevsky, G.; Kelty, K.; Straubel, J.B.; Toomre, E. The Tesla Roadster Battery System. 2007. Available online: http://www.batterypoweronline.com (accessed on 21 July 2019).
  29. What Is the Best Electric Vehicle Battery Cooling System? 2017. Available online: https://avidtp.com/what-is-the-best-cooling-system-for-electric-vehicle-battery-packs/ (accessed on 29 June 2019).
  30. Samba, A.; Omar, N.; Gualous, H.; Firouz, Y.; Bossche, P.V.D.; Van Mierlo, J.; Boubekeur, T.I. Development of an Advanced Two-Dimensional Thermal Model for Large size Lithium-ion Pouch Cells. Electrochim. Acta 2014, 117, 246–254. [Google Scholar] [CrossRef]
  31. Li, G.; Li, S.-P. Physics-Based CFD Simulation of Lithium-Ion Battery under the FUDS Driving Cycle. ECS Trans. 2015, 64, 1–14. [Google Scholar] [CrossRef]
  32. Vyroubal, P.; Kazda, T.; Maxa, J.; Vondrák, J. Analysis of Temperature Field in Lithium Ion Battery by Discharging. ECS Trans. 2015, 70, 269–273. [Google Scholar] [CrossRef]
  33. Yeow, K.; Teng, H.; Thelliez, M.; Tan, E. Thermal Analysis of a Li-ion Battery System with Indirect Liquid Cooling Using Finite Element Analysis Approach. SAE Int. J. Altern. Powertrains 2012, 1, 65–78. [Google Scholar] [CrossRef]
  34. Al Hallaj, S.; Selman, J.; King, S.W.; Kern, R.S.; Benjamin, M.C.; Barnak, J.P.; Nemanich, R.J.; Davis, R.F. A Novel Thermal Management System for Electric Vehicle Batteries Using Phase-Change Material. J. Electrochem. Soc. 2000, 147, 3231. [Google Scholar] [CrossRef]
  35. Zhang, X.; Wang, T.; Jiang, S.B.; Xu, H.G.; Zhang, Y.N. Modelling and Simulation of Pouch Lithium-Ion Battery Thermal Management Using Cold Plate. Int. J. Simul. Model. 2018, 17, 498–511. [Google Scholar] [CrossRef]
  36. Omkar, D.; Vijaykumar, P. Development of Phase Change Material/Cooling Plate Coupled Battery Thermal Management System Using CFD. Int. J. Res. Eng. Appl. Manag. 2018, 4, 1–6. [Google Scholar]
  37. Chen, D.; Jiang, J.; Kim, G.-H.; Yang, C.; Pesaran, A. Comparison of different cooling methods for lithium ion battery cells. Appl. Therm. Eng. 2016, 94, 846–854. [Google Scholar] [CrossRef] [Green Version]
  38. Lu, Z.; Meng, X.; Wei, L.; Hu, W.; Zhang, L.; Jin, L.W. Thermal Management of Densely-packed EV Battery with Forced Air Cooling Strategies. Energy Procedia 2016, 88, 682–688. [Google Scholar] [CrossRef] [Green Version]
  39. Qian, Z.; Li, Y.; Rao, Z. Thermal performance of lithium-ion battery thermal management system by using mini-channel cooling. Energy Convers. Manag. 2016, 126, 622–631. [Google Scholar] [CrossRef]
  40. Jarrett, A.; Kim, I.Y. Influence of operating conditions on the optimum design of electric vehicle battery cooling plates. J. Power Sources 2014, 245, 644–655. [Google Scholar] [CrossRef]
  41. Zou, D.; Ma, X.; Liu, X.; Zheng, P.; Hu, Y. Thermal performance enhancement of composite phase change materials (PCM) using graphene and carbon nanotubes as additives for the potential application in lithium-ion power battery. Int. J. Heat Mass Transf. 2018, 120, 33–41. [Google Scholar] [CrossRef]
  42. Greco, A.; Cao, D.; Jiang, X.; Yang, H. A theoretical and computational study of lithium-ion battery thermal management for electric vehicles using heat pipes. J. Power Sources 2014, 257, 344–355. [Google Scholar] [CrossRef]
  43. Liang, J.; Gan, Y.; Li, Y. Investigation on the thermal performance of a battery thermal management system using heat pipe under different ambient temperatures. Energy Convers. Manag. 2018, 155, 1–9. [Google Scholar] [CrossRef]
  44. Wang, C.; Zhang, G.; Li, X.; Huang, J.; Wang, Z.; Lv, Y.; Meng, L.; Situ, W.; Rao, M. Experimental examination of large capacity liFePO4 battery pack at high temperature and rapid discharge using novel liquid cooling strategy. Int. J. Energy Res. 2017, 42, 1172–1182. [Google Scholar] [CrossRef]
  45. Panchal, S.; Khasow, R.; Dincer, I.; Agelin-Chaab, M.; Fraser, R.; Fowler, M. Numerical modeling and experimental investigation of a prismatic battery subjected to water cooling. Numer. Heat Transf. Part A Appl. 2017, 93, 1–12. [Google Scholar] [CrossRef]
  46. Panchal, S.; Khasow, R.; Dincer, I.; Agelin-Chaab, M.; Fraser, R.; Fowler, M. Thermal design and simulation of mini-channel cold plate for water cooled large sized prismatic lithium-ion battery. Appl. Therm. Eng. 2017, 122, 80–90. [Google Scholar] [CrossRef]
  47. Panchal, S.; Dincer, I.; Agelin-Chaab, M.; Fraser, R.; Fowler, M. Design and simulation of a lithium-ion battery at large C-rates and varying boundary conditions through heat flux distributions. Measurement 2018, 116, 382–390. [Google Scholar] [CrossRef] [Green Version]
Figure 1. Reverse engineering approach: taking out battery cell from pack.
Energies 13 01638 g001
Figure 2. Laser scanning set-up.
Energies 13 01638 g002
Figure 3. Heat flux sensors locations near (a) cathode and (b) anode.
Energies 13 01638 g003
Figure 4. MeshWorks 8.0 screenshot during meshing of cooling plate.
Energies 13 01638 g004
Figure 5. Meshing in inlet channels in DEP MeshWorks 8.0.
Energies 13 01638 g005
Figure 6. Heat flux sensor (HFS) positions for model development.
Energies 13 01638 g006
Figure 7. Temperature profile at 60 A and 5 °C with heat flux values near cathode = 2347.7 W/m2, anode = 2259.5 W/m2, and mid surface = 539.3 W/m2. (a) Top view and (b) bottom view.
Energies 13 01638 g007
Figure 8. Temperature profile at 60 A and 15 °C with heat flux values near cathode = 1711.8 W/m2, anode = 2351.6 W/m2, and mid surface = 548.4 W/m2. (a) Top view and (b) bottom view.
Energies 13 01638 g008aEnergies 13 01638 g008b
Figure 9. Temperature profile at 60 A and 25 °C with heat flux values near cathode = 1597.3 W/m2, anode = 1851.6 W/m2, and mid surface = 413.0 W/m2. (a) Top view and (b) bottom view.
Energies 13 01638 g009aEnergies 13 01638 g009b
Figure 10. Temperature profile at 60 A and 35 °C with heat flux values near cathode = 1468.4 W/m2, anode = 1579.9 W/m2, and mid surface = 340.6 W/m2. (a) Top view and (b) bottom view.
Energies 13 01638 g010
Figure 11. Temperature profile at 80 A and 5 °C with heat flux values near cathode = 3112.2 W/m2, anode = 3072.8 W/m2, and mid surface = 764.1 W/m2. (a) Top view and (b) bottom view.
Energies 13 01638 g011
Figure 12. Temperature profile at 80 A and 15 °C with heat flux values near cathode = 2419.0 W/m2, anode = 2887.1 W/m2, and mid surface = 697.3 W/m2. (a) Top view and (b) bottom view.
Energies 13 01638 g012
Figure 13. Temperature profile at 80 A and 25 °C with heat flux values near cathode = 2309.3 W/m2, anode = 2648.2 W/m2, and mid surface = 611.1 W/m2. (a) Top view and (b) bottom view.
Energies 13 01638 g013
Figure 14. Temperature profile at 80 A and 35 °C with heat flux values near cathode = 2160.2 W/m2, anode = 2101.5 W/m2, and mid surface = 471.8 W/m2. (a) Top view and (b) bottom view.
Energies 13 01638 g014
Figure 15. Velocity profile at 60 A with 5 °C, 15 °C, 25 °C, and 35 °C.
Energies 13 01638 g015
Figure 16. Velocity profile at 80 A with 5 °C, 15 °C, 25 °C, and 35 °C.
Energies 13 01638 g016aEnergies 13 01638 g016b
Figure 17. Transient temperature profile of water flow at 60 A with 5 °C, 15 °C, 25 °C, and 35 °C.
Energies 13 01638 g017
Figure 18. Transient temperature profile of water flow at 80 A with 5 °C, 15 °C, 25 °C, and 35 °C.
Energies 13 01638 g018
Figure 19. Discharge/charge voltage profile at 60 A with 5 °C, 15 °C, 25 °C, and 35 °C.
Energies 13 01638 g019aEnergies 13 01638 g019b
Figure 20. Discharge/charge voltage profile at 60 A with 5 °C, 15 °C, 25 °C, and 35 °C.
Energies 13 01638 g020
Table 1. Technical details of 20 Ah lithium-ion battery (LIB) cell.
SpecificationValueUnit
Material for electrolyteCarbonate based-
Material for anodeGraphite-
Material for cathodeLiFePO4-
Voltage (nominal)3.3V
Dimensions7.25 (t) × 160 (w) × 227 (h)mm
Capacity of the cell (nominal)20Ah
Discharge power1200W
Energy (nominal)65Wh
Specific energy131Wh/kg
Energy density247Wh/L
Operating temperature−30 to 55°C
Mass of the cell496g
Specific power2400W/kg
Maximum discharge300A
Internal resistance0.5mΩ
Volume0.263L
Storage temperature−40 to 60°C
Number of cyclesMin. 300, approx. 2000Cycles
Maximum charge300 A
Table 2. Testing sequence.
Working FluidOperating Temperature (°C)Charge CurrentDischarge Current
Water520 A60 A, 80 A
1520 A60 A, 80 A
2520 A60 A, 80 A
3520 A60 A, 80 A
Table 3. Water inlet and outlet temperature at 60 A and 80 A with different working temperature.
Working FluidWorking Temperature
(°C)
Difference between Experimental
and
Simulated Values
Water Inlet and Outlet Temperature (°C)
60 A80 A
InletOutletInletOutlet
Water5Experimental (°C)5.73917.93075.14357.7029
Simulated (°C)7.939.357.7010.25
Difference (%)38.1717.9049.7033.07
15Experimental (°C)15.137716.769615.090616.9376
Simulated (°C)16.7618.8416.9319.75
Difference (%)10.7212.3512.5516.60
25Experimental (°C)25.099225.961425.098426.3445
Simulated (°C)25.9628.4726.3429.3
Difference (%)3.439.664.9511.22
35Experimental (°C)34.491234.909234.255535.2637
Simulated (°C)34.9037.2935.2638.12
Difference (%)1.196.822.938.10

