Article

A Novel Exergy Indicator for Maximizing Energy Utilization in Low-Temperature ORC

by
Marcin Jankowski
1,* and
Aleksandra Borsukiewicz
1,2
1
ORC Power Plants Research and Development Centre, West Pomeranian University of Technology in Szczecin, al. Piastów 17, 70-310 Szczecin, Poland
2
School of Mechanical & Mining Engineering, The University of Queensland, Queensland 4072, Australia
*
Author to whom correspondence should be addressed.
Energies 2020, 13(7), 1598; https://doi.org/10.3390/en13071598
Submission received: 27 February 2020 / Revised: 19 March 2020 / Accepted: 19 March 2020 / Published: 1 April 2020

Abstract

:
In the last decade, particular attention has been paid to the organic Rankine cycle (ORC) power plant, a technology that implements a classical steam Rankine cycle using low-boiling fluid of organic origin. Depending on the specific application and the choice of the designer, the ORC can be optimized using one or several criteria. The selected objectives reflect various system performance aspects, such as: thermodynamic, economic, environmental or other. In this study, a novel criterion called exergy utilization index (XUI) is defined and used to maximize the utilization of an energy source in the ORC system. The maximization of the proposed indicator is equivalent to bring the heat carrier outlet temperature to the ambient temperature as close as possible. In the studied case, the XUI is applied along with the total heat transfer area of the system, and the multi-objective optimization is performed in order to determine the optimal operating conditions of the ORC. Moreover, to reveal a relationship between the XUI and important ORC performance indicators, a parametric study is conducted. Based on the results, it has been found that high values of the XUI (~80%) correspond to optimal values of exergy-based indicators such as: exergy efficiency, waste exergy ratio, environmental effect factor or exergetic sustainability index. Furthermore, the values of the XUI = 60%–80% are associated with beneficial economic characteristics reflected in a low payback period (<11.3 years). When considering the ecological aspect, the maximization of XUI has resulted in minimization of exergy waste to the environment. In general, the simple formulation and straightforward meaning make the XUI a particularly useful indicator for the preliminary evaluation and design of the ORC. Furthermore, the comparative analysis with respect to other well-known performance indicators has shown that it has a potential to be successfully applied as the objective function in the optimization of ORC power plants.

1. Introduction

The global increase in the demand for electricity necessitates the search for alternative energy sources and the development of technologies that can efficiently convert this type of energy into electricity. The organic Rankine cycle (ORC) seems to be the optimal choice for that purpose, since it allows for the utilization of low and medium-temperature heat carriers, such as: geothermal water, exhaust gases, thermal oils etc. One way to characterize an energy source for the ORC is to classify it as one of the two types: closed (sealed) or open [1]. The first type is characterized by a constant temperature of the heat carrier exiting the vapor generator of the ORC. This occurs in applications in which the heat carrier is circulating in a closed loop and it must have a predefined temperature at the outlet of the heat exchanger. In the case of the second type, the heat carrier leaving the vapor generator is directed to the environment and its outlet temperature does not have a pre-determined value. Such systems are distinguished by the fact that they can be optimized by minimizing the heat carrier outlet temperature as far as possible [2]. This is equivalent to maximize the heat source potential which has been shown to improve the ORC performance by reducing the exergy waste to the environment [3].
The aspect of an efficient utilization of the energy source is not addressed directly in most studies. Moreover, in the case of closed type energy sources, the maximization of their potential is not even possible, since the outlet temperature of the heat carrier is fixed, and the heat transferred in the vapor generator cannot be increased. For the open type energy source, an investigation which aims to evaluate the heat carrier utilization degree is conducted by several authors. Garg and Orosz [4] applied the effectiveness ε, an energy-based indicator, in order to recover the maximum available waste heat in the ORC. The ε is a ratio of the actual heat transferred by a heat carrier to the maximum available heat which would be released by cooling the heat carrier to the ambient temperature. The authors combined the ε with the economic criterion to construct a novel objective function that maximizes the waste energy potential and minimizes the cost of the system. The effectiveness index ε was also used by Li et al. [5] in parametric optimization of single and dual-pressure evaporation ORCs. In their study, the indicator was applied to compare the energy utilization results for two heat carriers—hot water and hot air.
The exergy analysis provides mathematically defined indicators which are used to assess the sustainable performance of the ORC [6]. In other words, the exergy-based indices are developed in a way that evaluates the system from the perspectives of its economic viability and environmental impact. The first objective may be achieved by applying indicators that maximize the power output of the ORC. To attain the second goal, the exergy losses of the system should be reduced as much as possible [7]. By decreasing the exergy waste to the environment, the heat carrier utilization can be maximized. For that reason, the exergy analysis seems to be an appropriate tool for optimizing the energy source utilization.
The definitions of exergy indicators which hold for a basic ORC (see Figure 1) are presented in Equations (1)–(5). The exergy efficiency ηex [8] is one of the most often utilized exergy-related indicator in performance evaluation of the ORCs. As shown in Equation (1), it is calculated based on the net power output Pout and the inlet exergy flow rate of the heat carrier hs1. This means that, for a given energy source and environmental conditions, the ηex is only a function of parameters that affect Pout. For this reason, the ηex can be effectively applied in optimizing the ORC for maximum power production [9]. The interpretation of the ηex is straightforward and intuitive since it compares the generated output (Pout) to the utilized resource (hs1). However, in the case of open type energy sources, an essential part of the analysis is to examine and evaluate the utilization degree of an energy source and the ηex does not provide that information.
The remaining exergy-based indicators were applied much less often in the previous studies. Xiao et al. [10] conducted a multi-objective optimization to find the optimal evaporation and condensation temperatures for the ORC utilizing waste flue gas as a heat carrier. The authors applied sustainability index SI (Equation (2)) as one of the objective functions to minimize the exergy destruction rate δḂtot and maximize the exergy drop of the heat carrier Δhs. The latter is equivalent to maximize the potential of the heat source. The study results have shown that SI is in conflict with a second criterion which was defined as the total investment cost to net power output. For this reason, SI may be used for reducing the ORC exergy destruction, but it is not effective in optimizing the system from the economic perspective. Abam et al. [11] examined different low-temperature ORC configurations and applied waste exergy ratio WER (Equation (3)) as one of the indicators to evaluate the sustainable performance of the systems. It is worthwhile to note that WER includes both types of exergy waste: exergy destruction δḂtot within the system components (turbine, condenser, pump, vapor generator) and exergy loss δḂloss to the environment. The latter is mainly caused by the high temperature of the heat carrier discharged to the surroundings. This type of exergy waste is expressed as the outlet exergy flow of the heat source hs2. It means that by minimizing WER, hs2 is also minimized leading to maximization of the heat source potential. As noted by Aydin [12], WER is a useful index in improving the sustainable and environmentally friendly work of the energy systems. Furthermore, a physical meaning of WER is also easy to understand since it compares the overall exergy waste in the system to the input exergy of the heat source. Environmental effect factor EEF (Equation (4)) was considered in the study by Abam et al. [13]. The researchers examined three working fluids (R1234ze, R1234yf, R245fa) and used the EEF to assess the sustainability and environmental impact of several ORC architectures. In the same study, the exergetic sustainability index ESI (Equation (5)) was applied for the same purpose and the authors found that R245fa provides the most sustainable work. An application of EEF and ESI was also reported in the article by Midilli and Dincer [14]. The authors used the indicators to examine the recirculating aquaculture system and noted that with an increase of exergy waste ratio WER both the exergy efficiency ηex and ESI decreased, while the EEF increased. Such a relationship is clear since both indices (EEF and ESI) are defined based on the WER and exergy efficiency ηex (see Equations (1)–(5)). Despite the fact that EEF and ESI can also be applied for enhancing the sustainable operation of the ORC, their formulations are more complex and do not have a straightforward interpretation as the exergy efficiency ηex or waste exergy ratio WER.
Certainly, the aforementioned exergy-related indicators, which were investigated by multiple authors, are efficient in maximizing the utilization of the energy source to some extent. However, to the best of the authors knowledge, there is no index, that would combine the simple form of the effectiveness indicator ε and simultaneously, would be based on the exergy balance equation. The role of the latter is particularly important within the context of the utilization of waste energy streams. Therefore, a novel exergy-based indicator is proposed in the current study and the performance analysis of the ORC is conducted in order to compare it with the commonly known ORC parameters and indices. Furthermore, the potential of the proposed index to be a significant performance indicator is revealed, using it as one of the objective functions in multi-objective optimization of the system.
The selected exergy-related indicators are formulated for basic ORC in Equations (1)–(5).
Exergy efficiency
η e x = P o u t B ˙ h s 1 · 100 %
Sustainibility index
S I = δ B ˙ t o t Δ B ˙ h s
Waste exergy ratio
W E R = δ B ˙ t o t + δ B ˙ l o s s B ˙ h s 1 · 100 %
Environmental effect factor
E E F = W E R η e x
Exergetic sustainiblity index
E S I = 1 E E F

2. System Description

The system examined in the study is modelled as basic subcritical ORC power plant. The turbine, condenser, pump and vapor generator are considered as component parts of the system. The working fluid of the ORC is of an organic origin and it is characterized by lower saturation temperatures (less than 100 °C at suitable pressure levels) than in the classical power plant using water (up to 540 °C). For the studied case, R1234ze is selected as one of the most perspective fluids, which is reflected in the low level of its environmental indicators: GWP = 6 and ODP = 0 [15]. The low evaporation temperature teva of the fluid allows for the application of a low-temperature energy source. In this study, geothermal water is used as a heat carrier (Figure 1).
The working fluid of the ORC undergoes the thermodynamic processes in each component of the system. In vapor generator, preheating to saturated liquid state (7–8), evaporation to saturated vapor state (8–9) and superheating (9–1) of the fluid take place. Then, the process of expansion (1–5) in the turbine allows to produce the useful work on the shaft. After cooling (5–5”) and condensing (5”–6) in the condenser, the fluid goes to the pump, in which it is compressed (6–7) from low to high-pressure and the cycle is repeated.
The heat exchangers of the ORC, i.e., the vapor generator and condenser, are modelled as plate heat exchangers. The high heat transfer efficiency, compactness and flexibility make them an optimal choice for the considered system. The ORC expansion device is modelled as single-stage radial-inflow turbine (RIT) which proved to work efficiently for small-scale electricity production [16]. The RIT components that are included in the analysis of the study are presented in Figure 1. During the flow through the volute and nozzle, the working fluid is accelerated, and then, flowing through the rotor blades, its kinetic energy is converted into useful work.
The assumed values of the ORC parameters are tabulated in Table 1. The energy source parameters, i.e., the inlet temperature of the hot water ths1 and volume flow rate V ˙ h s , are held constant. The value of the ths1 is typical for low-temperature geothermal energy resources [17]. The temperature difference ΔTeva between the heat carrier and working fluid at the saturated liquid point (point 8 in Figure 1) and the temperature difference ΔTcon between the working fluid and cold water at the saturated vapor point (point 5” in Figure 1) are assumed as in [18]. As suggested in [19], slight superheating degree, expressed as: ΔTsup, is recommended for the ORC. The evaporation teva and condensation tcon temperatures of the working fluid along with the specific speed ns of the turbine are selected as the decision variables. The latter quantity is defined by the following equation:
n s = ω V ˙ 05 0.50 Δ H i s 0.75
where ω denotes rotation speed of the rotor [rad s−1], ΔHis refers to the isentropic enthalpy drop of the working fluid [kJ kg−1]. The turbine efficiency ηT is an initial guess, since the exact value is calculated after RIT design which is briefly discussed in Section 4.

3. Definition of XUI

The exergy balance equation for the analyzed ORC system can be written in the following form:
B ˙ h s 1 = P o u t + δ B ˙ t o t + B ˙ c 2 + B ˙ h s 2
where B ˙ h s 1 and B ˙ h s 2 are the exergy flow rates of the heat carrier at the inlet and outlet of the vapor generator, B ˙ c 2 is the exergy flow rate of the cold water at the outlet of the condenser, and δ B ˙ t o t is the total internal exergy destruction rate in the system. The latter is the sum of exergy destruction rates in all considered ORC components. The exergy flow rate of the cold water at the inlet of the condenser B ˙ c 1 is equal to zero since at this state the cold water is at the reference conditions. The general equation for the exergy flow rate of the fluid at state x is the following:
B ˙ x = m ˙ [ h x h r T r ( s x s r ) ]
where subscript r denotes that the enthalpy h and entropy s are determined at the reference state.
Let’s write the Equation (7) in the alternate form:
Δ B ˙ h s = P o u t + δ B ˙ t o t + B ˙ c 2
In order to maximize the energy utilization of the heat carrier (geothermal water), the exergy drop Δ B ˙ h s should be maximized or, equivalently, the exergy flow rate B ˙ h s 2 should be minimized. Theoretically, the maximum allowable exergy potential of the energy source would be utilized if B ˙ h s 2 = 0 , which also means: Δ B ˙ h s = B ˙ h s 1 . The proposed indicator, called exergy utilization index, is defined as follows:
X U I = Δ B ˙ h s B ˙ h s 1 · 100 %
or in the alternate form:
X U I = ( 1 B ˙ h s 2 B ˙ h s 1 ) · 100 %
As seen in Equation (10), the XUI compares the exergy drop Δ B ˙ h s of the heat carrier with the exergy flow rate B ˙ h s 1 . Based on the definition of XUI and aforementioned statements, the following relationships can be written:
Δ B ˙ h s B ˙ h s 1 X U I 100 %
Δ B ˙ h s 0 X U I 0 %
The implications given in Equations (12)–(13) reflect the simple structure and straightforward meaning of the proposed indicator. Specifically, the maximization of the energy source utilization expressed in Equation (12) leads to maximization of the XUI. For the opposite case, Equation (13), a poor utilization of the energy source corresponds to the value of XUI that goes to 0%.

4. Calculation Model

The model of the ORC power plant was developed using MATLAB [20] environment and the original code was written in order to perform the analysis of the exergy utilization index XUI and conduct multi-objective optimization by applying the proposed indicator.

4.1. Assumptions

The basic assumption in the modelling of the ORC is to consider each component as the control volume. Then, mass, energy, and exergy balance equations can be applied to determine dependent parameters of the ORC. Furthermore, the following simplifications are introduced in the model:
  • the system operates at steady state conditions,
  • the changes in the kinetic and potential energy of the fluids are neglected, except for the turbine, in which the kinetic energy of the working fluid is included in the analysis,
  • the pressure drops in the connecting pipes and heat exchangers are neglected,
  • the heat losses to the environment are ignored,
  • the efficiency of the pump ηP is a constant value.

4.2. Algorithm and Research Tools

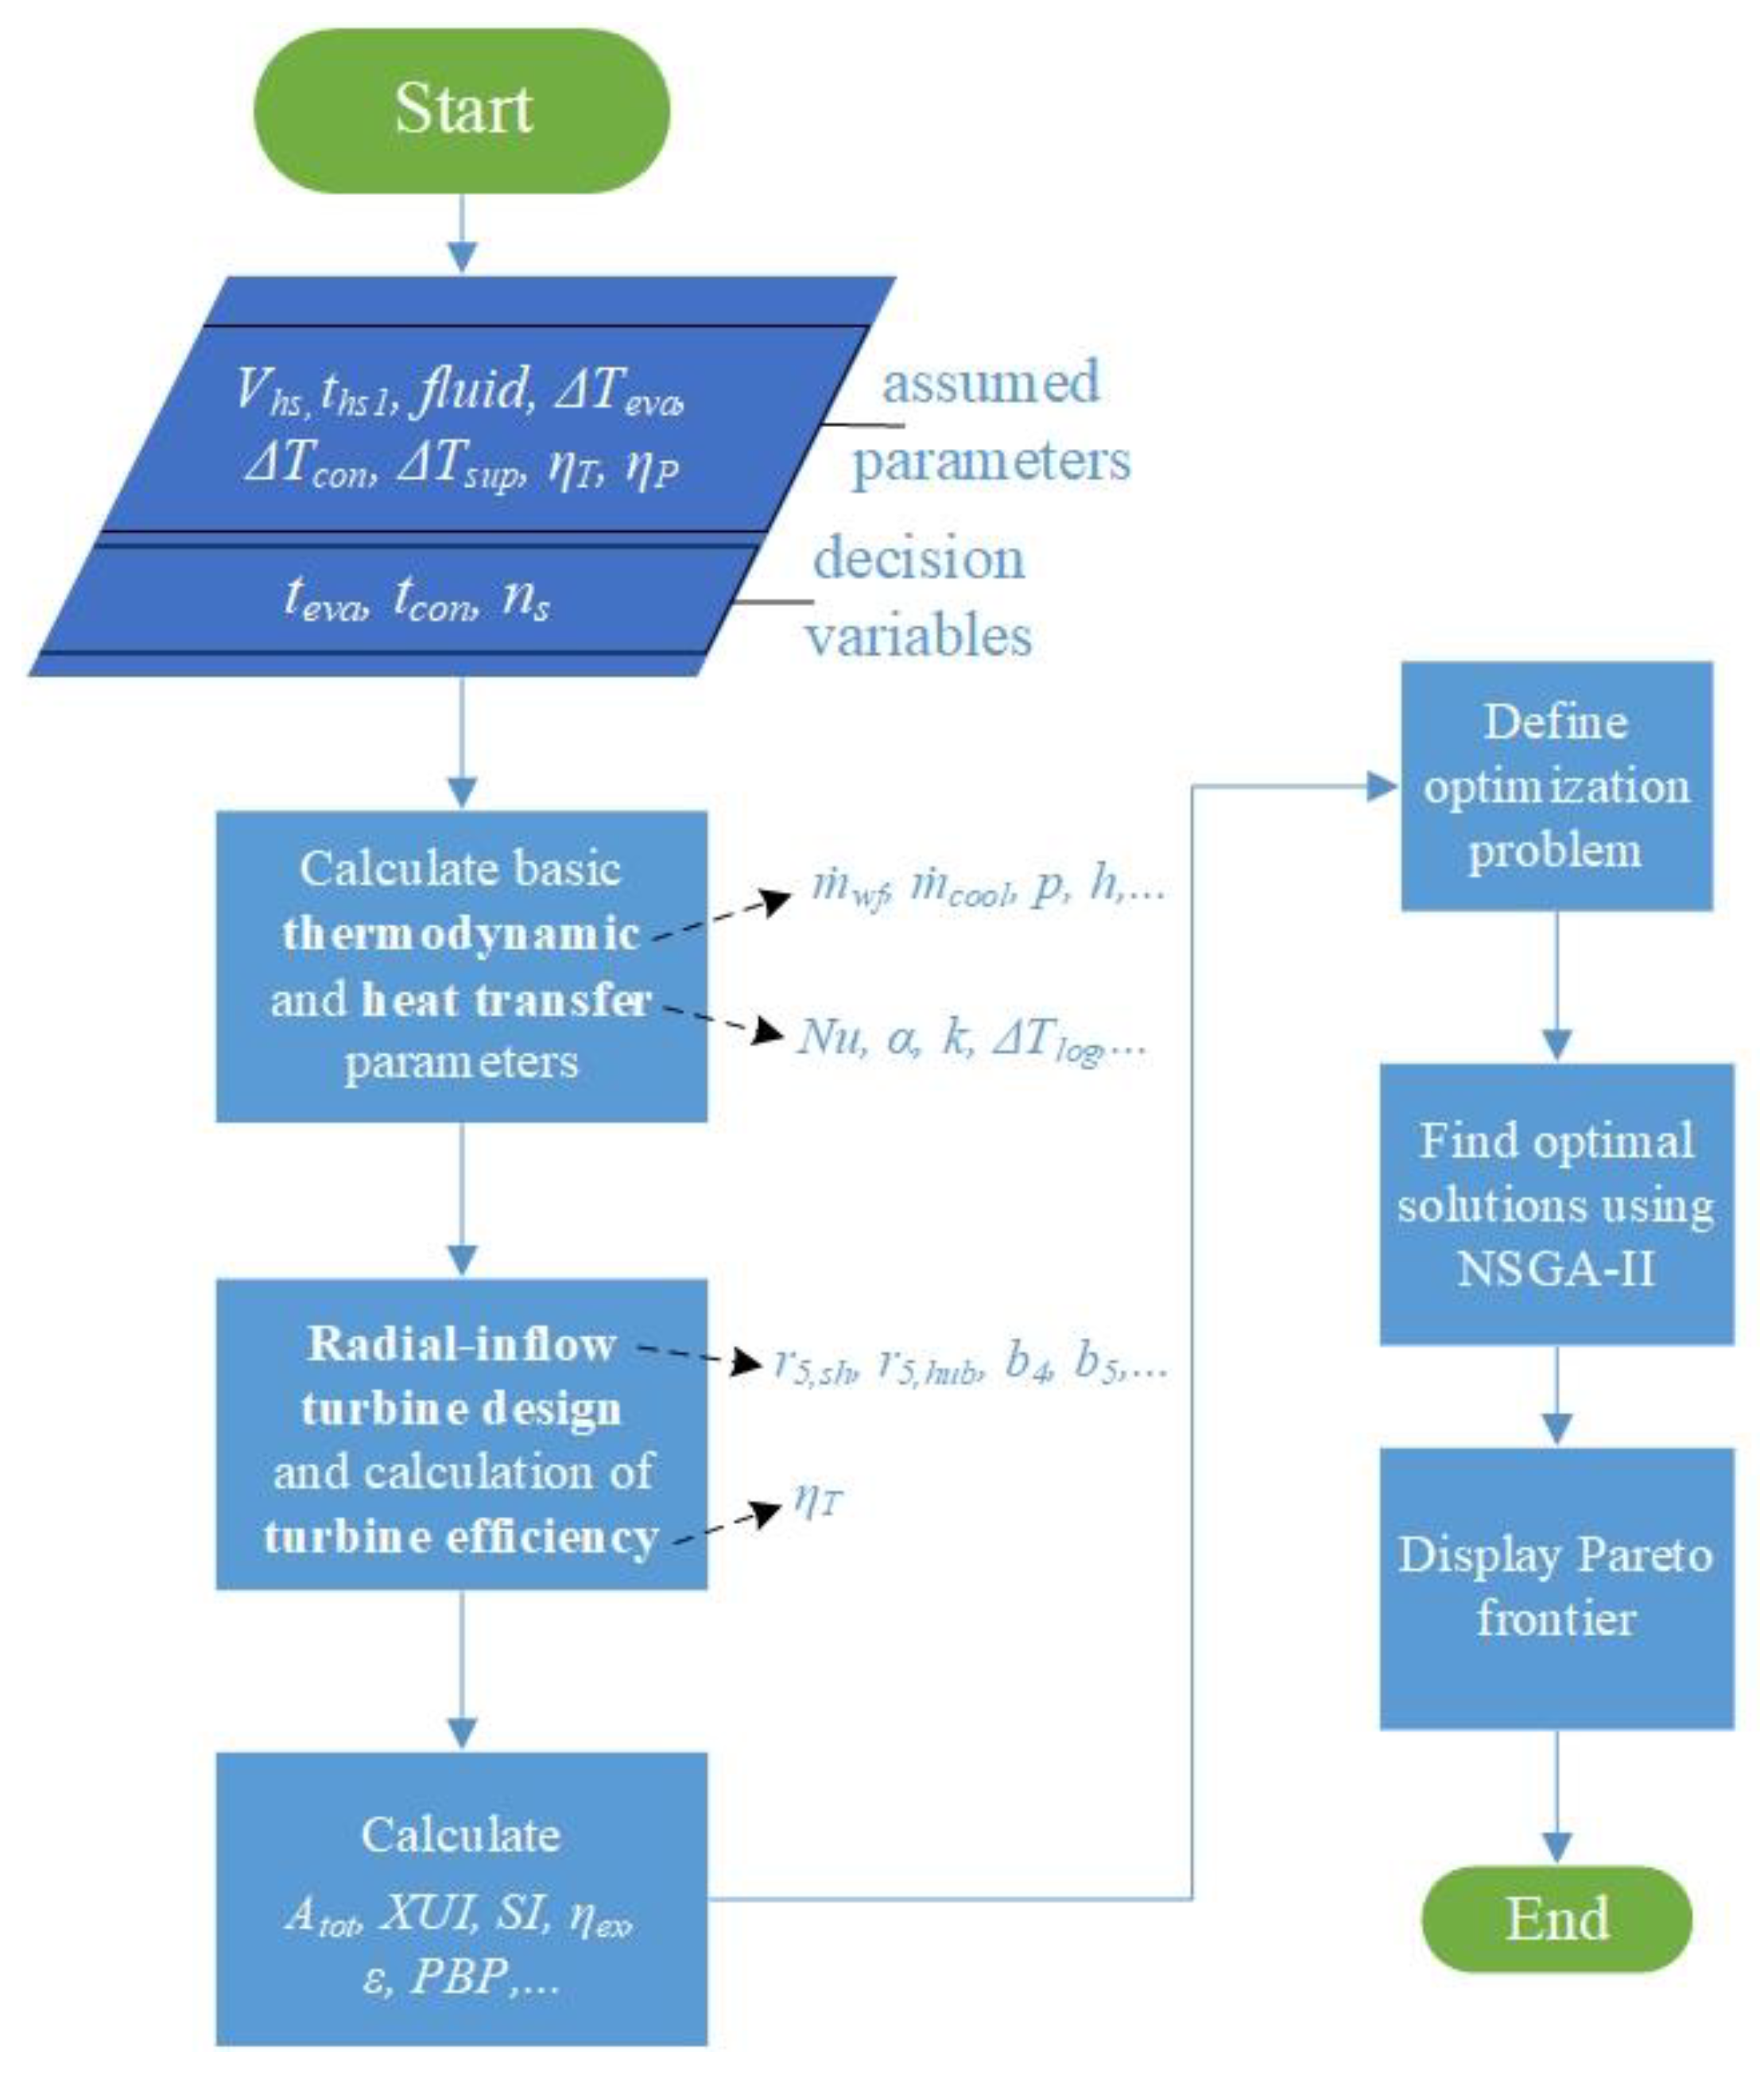
The algorithm presented in Figure 2 starts from assigning the values to the constant ORC parameters (assumed parameters) and setting the bounds for the decision variables. Then, applying the assumptions described in Section 4.1, basic thermodynamic and heat transfer parameters are calculated (Equations (14)–(16) and (19)). The properties of the fluids (specific enthalpies, specific entropies etc.) are evaluated using the REFPROP database [21]. In the next step, design of the radial-inflow turbine (RIT) is implemented using one-dimensional model [16] which is perceived to be an optimal approach in the preliminary analysis. Moreover, the total-to-static efficiency of the turbine is calculated (Equation (17)) applying the enthalpy loss correlations. The calculation of the selected ORC operating parameters and performance indicators (Equations (23)–(25)) is made in the next step. After that, the multi-objective optimization problem is defined and solved, using non-dominated sorting genetic algorithm-II (NSGA-II) [22], the optimization tool that is embedded in MATLAB. When the optimal solutions are determined, the results are displayed in the form of a Pareto frontier and the calculation procedure is ended.

4.2.1. Thermodynamic Analysis

Due to the great amount of equations used in the model of the ORC, it was decided to present the relationships only for the selected parameters and performance indicators. The energy balance equations that were used to calculate the mass flow rates of the working fluid wf and cold water cool have the following forms:
ρ h s V ˙ h s c h s [ t h s 1 ( t e v a + Δ T e v a ) ] = m ˙ w f ( h 1 h 8 )
m ˙ w f ( h 5 h 6 ) = m ˙ c o o l c c o o l [ ( t c o n Δ T c o n ) t c 1 ]
The temperature of the geothermal water ths2 at the outlet of the vapor generator is calculated using equation:
t h s 2 = t h s 1 m ˙ w f ( h 1 h 7 ) ρ h s V ˙ h s c h s

4.2.2. Radial-Inflow Turbine Design

The turbine total-to-static efficiency ηT is calculated iteratively based on the results of the radial-inflow turbine design and enthalpy loss Δhloss correlations. For a detailed description of the procedures similar to the model applied in this study, see [16,23] or some recent papers [24,25]. The general equation used to calculate ηT is the following:
η T = 1 Δ h l o s s h 01 h 5 s
The total enthalpy h01 at the volute inlet is the enthalpy of the fluid at state 1 (see Figure 1) increased by a kinetic energy at the inlet of the volute:
h 01 = h 1 + c 1 2 2

4.2.3. Heat Transfer Analysis

The most significant outcome of the heat transfer analysis is the total heat transfer area Atot which is the sum of the heat transfer areas of the vapor generator and condenser. In general, the logarithmic mean temperature difference ΔTlog method was applied in order to calculate the individual heat transfer areas and the following equation was used:
A = Q ˙ k Δ T l o g
The above-mentioned method is applied for the individual sections of the heat exchangers. The vapor generator is divided into preheating, evaporating and superheating sections, while in the condenser, the sections of cooling and condensing of the working fluid are distinguished. The heat fluxes Q ˙ for each section are determined based on the energy balance equations similar to these presented in Equations (14)–(15)).
The formula for determining the overall heat transfer coefficient k is the following:
k = ( 1 α h o t + δ λ p + 1 α c o l d ) 1
The quantities characterizing heat exchanger plates, i.e., their width δ and thermal conductivity λp are assumed to be equal to 0.60 mm and 18.0 W m−1 K−1. The heat transfer coefficients α are determined for the hot and cold side of a plate. The hot site relates to the fluid which releases heat while the cold site corresponds to the medium which absorbs the energy. The coefficients α are calculated based on the value of Nusselt number Nu and the following equation is applied:
α = N u λ l d h
The λl denotes thermal conductivity of a medium, while dh is a hydraulic diameter calculated as double distance h0 between heat exchanger plates. The h0 is assumed to be equal 1.50 mm. To calculate the Nu, empirical correlations developed for plate heat exchangers and specific processes (condensation, evaporation etc.) are applied and the full list of utilized equations was presented in the previous study [26].
The logarithmic mean temperature difference ΔTlog is calculated as:
Δ T l o g = T h o t , i n T c o l d , o u t ( T h o t , o u t T c o l d , i n ) l n ( T h o t , i n T c o l d , o u t T h o t , o u t T c o l d , i n )
The subscripts hot,in and hot,out indicate that the temperatures are determined for the hot side at the inlet and outlet of a specific heat exchanger section. The same meaning relates to subscripts cold,in and cold,out.

4.2.4. ORC Performance Indicators

The net power output Pout is calculated using the following formula:
P o u t = m ˙ w f [ η T ( h 01 h 5 s ) h 7 s h 6 η P ]
The effectiveness ε indicator is defined as follows:
ε = t h s 1 t h s 2 t h s 1 t r · 100 %
The assumed value of the reference (environmental) temperature is equal to: tr = 15.0 °C.
The economic aspect is of great importance in the optimization of the ORC systems, since it allows to exclude the operating parameters that would lead to high cost of the installation. In the current study, payback period PBP is applied and calculated using the following formula [27]:
P B P = l n ( P o u t C e l t o p C O M c C t o t P o u t C e l t o p C O M c C t o t i r C t o t ) l n ( 1 + i r )
The following values of the electricity price, operating time, cost of operation and maintenance coefficient and interest rate are assumed: Cel = 0.15 $ kWh−1, top = 8000 h, COMc = 1.50% and ir = 5.00%. Their values are similar to those adopted in [27].
The capital cost Ctot is determined by adding the costs of individual ORC components:
C t o t = ( C V G + C C + C T + C P ) C E P C I 2018 C E P C I 1996
The cost of a single component C is determined using equation:
C = C P E C F B M
The purchased equipment cost CPEC is estimated from:
l o g C P E C = K 1 + K 2 l o g ( Z ) + K 3 [ l o g ( Z ) ] 2
Since the purchased equipment costs CPEC for various technical facilities were estimated in 1996, the CEPCI (chemical engineering plant cost index) coefficients are adopted in Equation (26) to include an inflation and an increase of material prices. The remaining constant factors which depend on the component type are selected based on recommendations given in [28]. The assumed values of coefficients K1, K2, and K3 are listed in Table 2. The Z coefficient is a design parameter for a certain type of component. In the case of a turbine and pump, these are the generated and consumed power, while for the heat exchangers, their heat transfer areas.
The bare module coefficient FBM is calculated using equation:
F B M = B 1 + B 2 F m F p
For a turbine, the value of FBM is assumed to be equal to 3.5 as suggested by Li et al. [29]. The coefficients B1 and B2 depend on the component type, while the Fm is a material factor which takes into account an influence of construction material on the component cost. The assumed values of B1, B2 and Fm are tabulated in Table 2. The pressure factor Fp as calculated using the following equation:
l o g F p = C 1 + C 2 l o g ( p ) + C 3 [ l o g ( p ) ] 2
The coefficients C1, C2, and C3 depend on the component type and their values are listed in Table 2.

4.2.5. Multi-Objective Optimization

The multi-objective optimization problem is defined as follows:
m i n i m i z e :   f 1 ( X ) = X U I ,       f 2 ( X ) = A t o t
S u b j e c t   t o :
t h s 2 60.0 ° C
r 5 , s h r 4 0.78
r 5 , h u b r 5 , s h 0.40
40.0 ° i n c 0.00 °
M a 4 1.50
M a 5 1.00
Z R 1.50 · b 4
0.45 R 0.65
The constraint expressed by Equation (32) is imposed in order to avoid silica oversaturation of the geothermal water [30]. The limitations given in Equations (33)–(39) should provide a rational design of the radial-inflow turbine [23]. The X represents the vector of decision variables. Their bounds are presented in Table 1.

4.3. Validation of Model

The calculation model has been verified using the results of the study by Da Lio et al. [31]. The outcomes of the basic radial-inflow turbine (RIT) design parameters and turbine efficiency have been compared. The comparative analysis of the findings (Table 3) allows to state that the considered model of the ORC gives reliable results, since the percentage errors are relatively small.

5. Exergy-Related Indicators

It is worthwhile to share a few insights concerning exergy-related indicators presented in Equations (1)–(5). It should be noted that there are simple relations between the exergy efficiency ηex and indices given in Equations (3)–(5). Recalling the definition of the ηex (Equation (1)) and exergy balance equation (Equation (7)) for the considered ORC, one can write:
η e x = B ˙ h s 1 δ B ˙ t o t B ˙ h s 2 B ˙ c 2 B ˙ h s 1
Let’s write the outlet exergy flow rates of the heat source hs2 and cold water c2 as the exergy loss δḂloss to the environment:
δ B ˙ l o s s = B ˙ h s 2 + B ˙ c 2
After applying Equation (41) in Equation (40) and making simple rearrangements, the exergy efficiency ηex can be written in the following form:
η e x = 1 δ B ˙ t o t + δ B ˙ l o s s B ˙ h s 1
Using the definition of waste exergy ratio WER (Equation (3)), it can be identified that:
W E R = 1 η e x
Moreover, since the environmental effect factor EEF and exergetic sustainability index ESI are both based on the η e x and WER, the following relations are derived:
E E F = 1 η e x η e x
E S I = η e x 1 η e x
Based on the equations given above, it can be concluded that the indicators written in Equations (3)–(5) are simple combinations of the exergy efficiency ηex.

6. Results and Analysis

The results of the analysis are presented in Figure 3, Figure 4, Figure 5, Figure 6, Figure 7, Figure 8, Figure 9, Figure 10 and Figure 11. The graphs in Section 6.1 and Section 6.2 are constructed in a similar way, i.e., the XUI and selected ORC parameter/indicator are drawn with respect to the evaporation temperature teva of the working fluid, the parameter that is one of the key variables in performance optimization of the ORC. In Section 6.3, the outcomes of the multi-objective optimization are shown and discussed.

6.1. Relation Between XUI and Selected ORC Parameters

The maximization of the energy utilization in the ORC is inseparably connected with minimizing the outlet temperature ths2 of the heat carrier. Recalling the definition of the XUI given in Section 3, the relation between the proposed index and the temperature ths2 should be equivalent. Indeed, the results presented in Figure 3, seem to verify this statement. Specifically, the higher values of the XUI correspond to lower outlet temperatures ths2 of the geothermal water. The increase of the ths2 with respect to the teva can be easily explained using Equation (14) and Equation (16). The increase of the teva corresponds to decrease of the mass flowrate wf of the working fluid which in turn leads to increase of the ths2. The fact that XUI decreases with an increase of the teva is mainly due to increase of the ths2. The higher values of the ths2 correspond to higher specific enthalpies hhs2, which reduces the outlet exergy flow rate hs2 of the heat carrier and therefore also the value of XUI (Equation (11)). It is worthwhile to mention that, due to the constraint imposed on the ths2 ( t h s 2 60 ° C ), the values of XUI higher than ~76% cannot be achieved for the considered case.
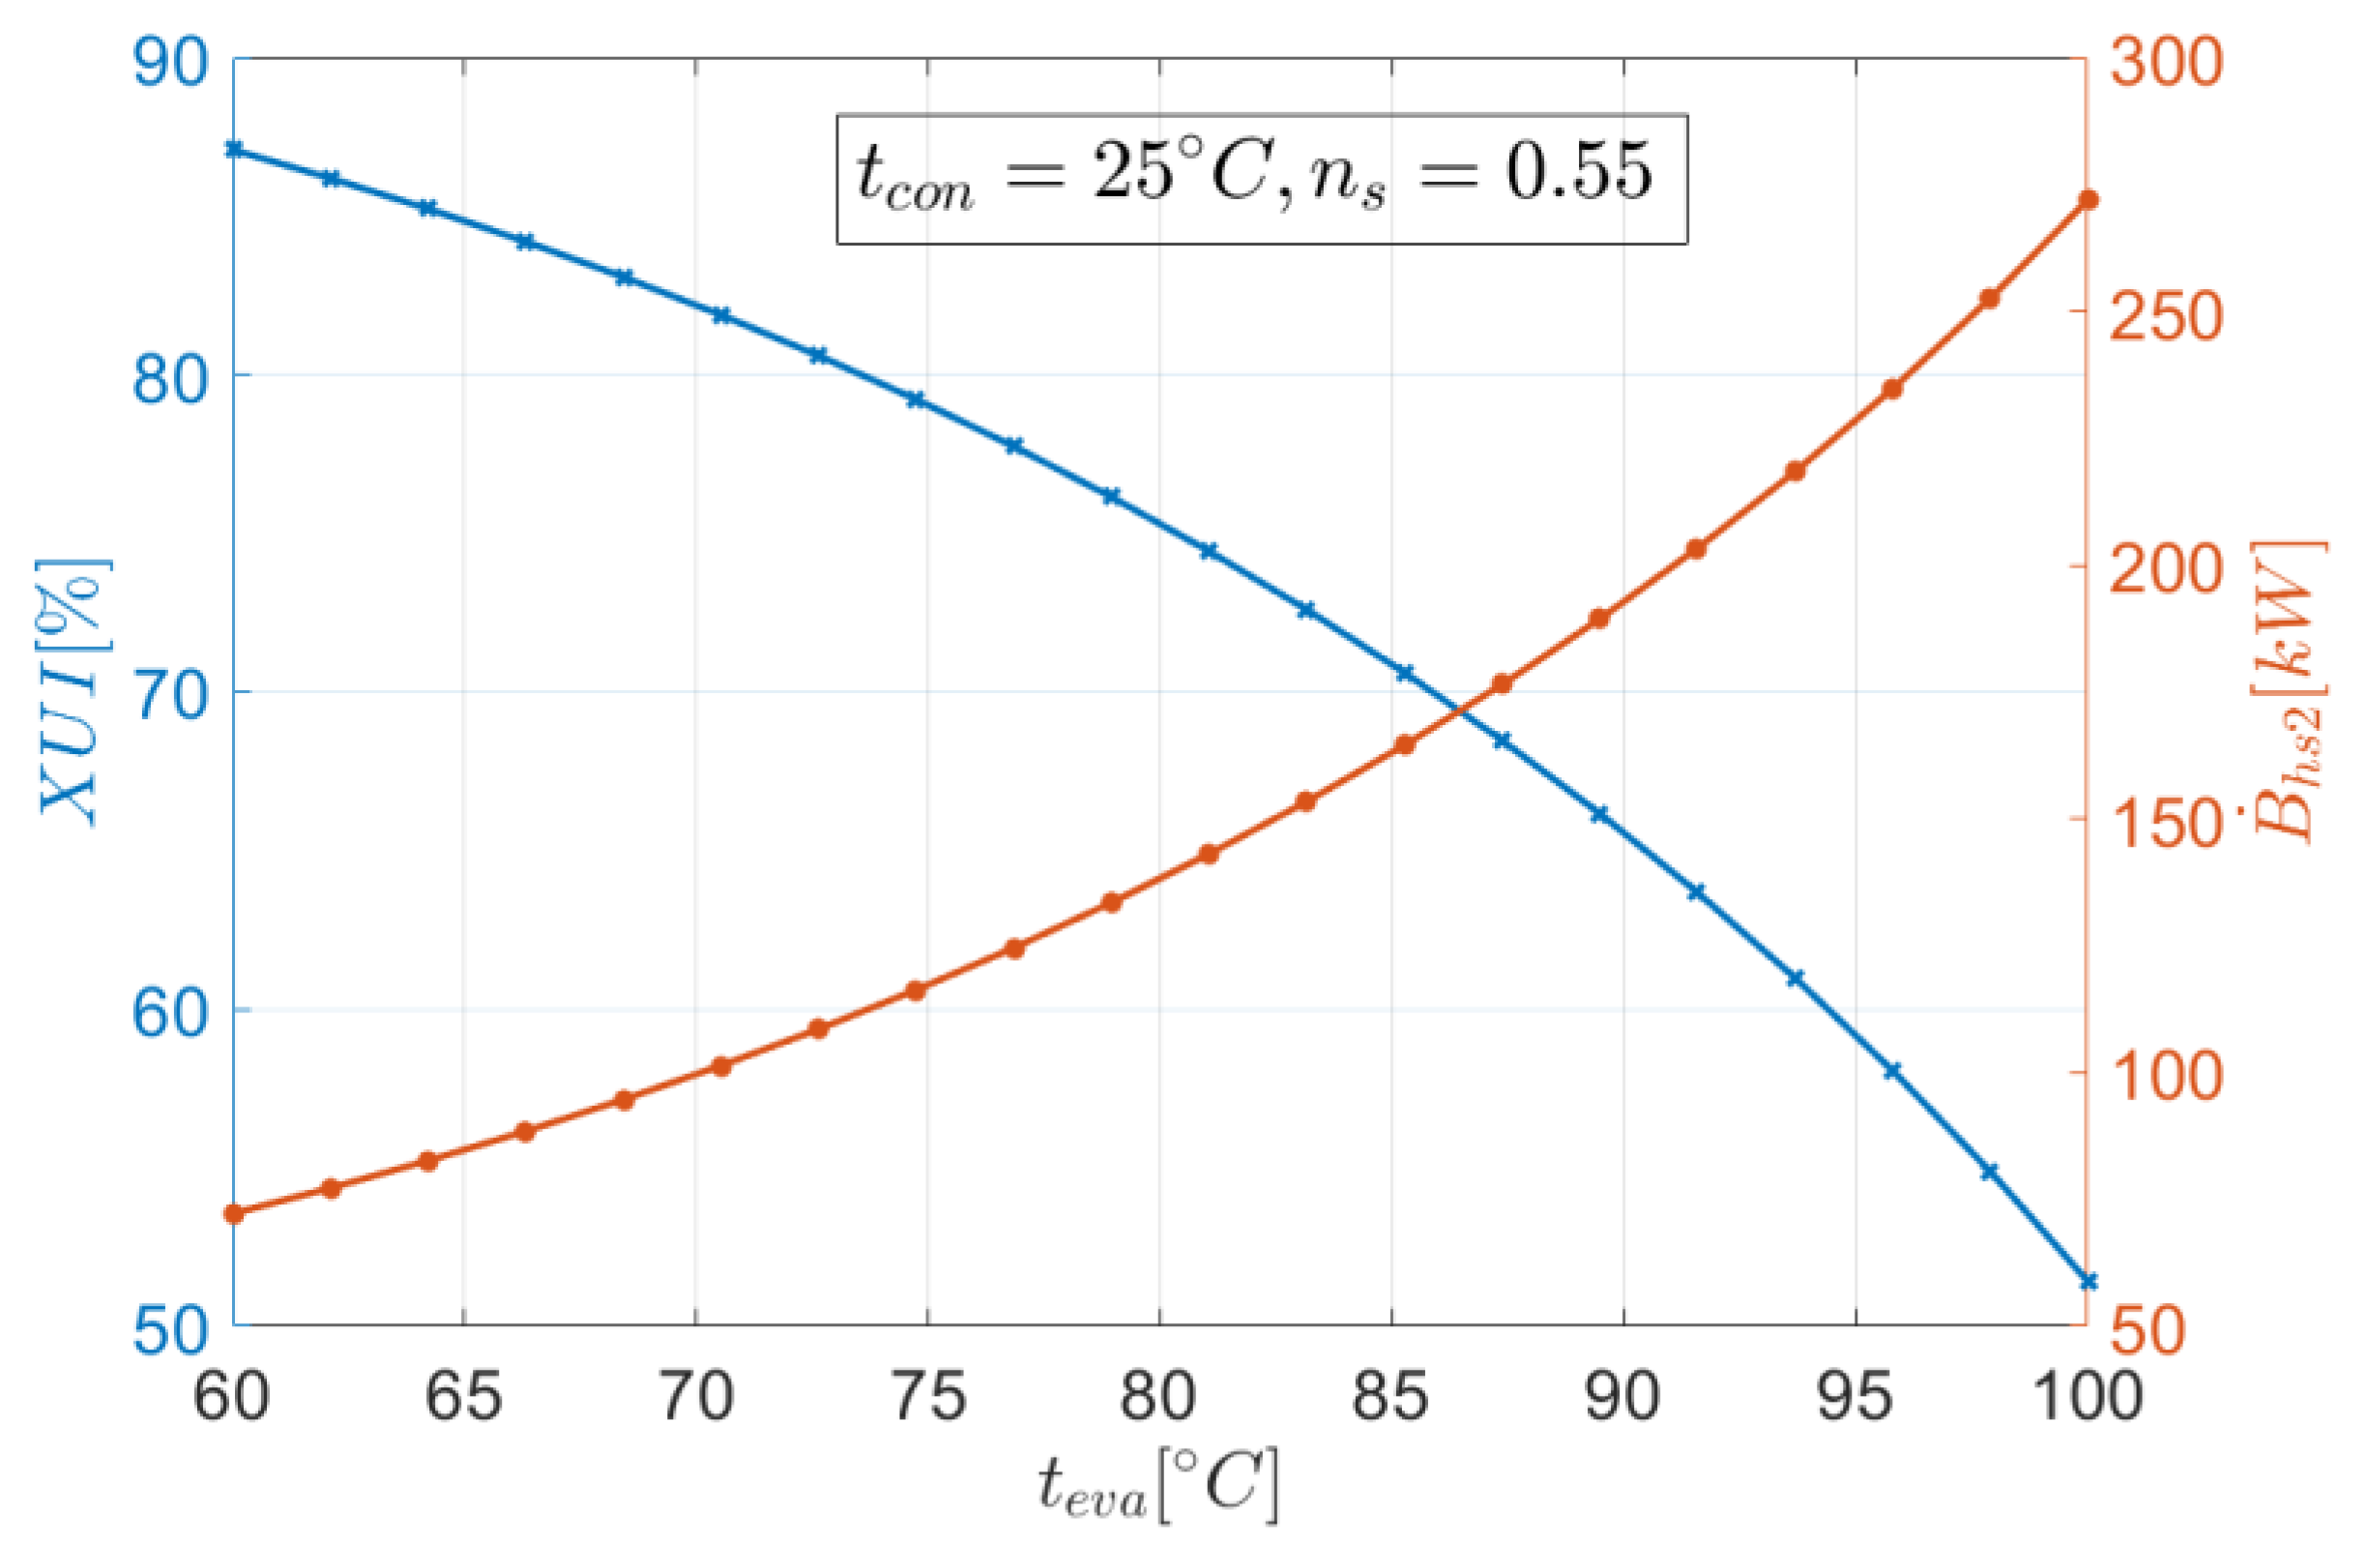
The statements given above are verified in Figure 4 which shows that the exergy flow rate hs2 increases with an increase of the teva. Moreover, the opposite relationship between the XUI and hs2 is confirmed, i.e., the minimization of the latter leads to maximization of the first one.
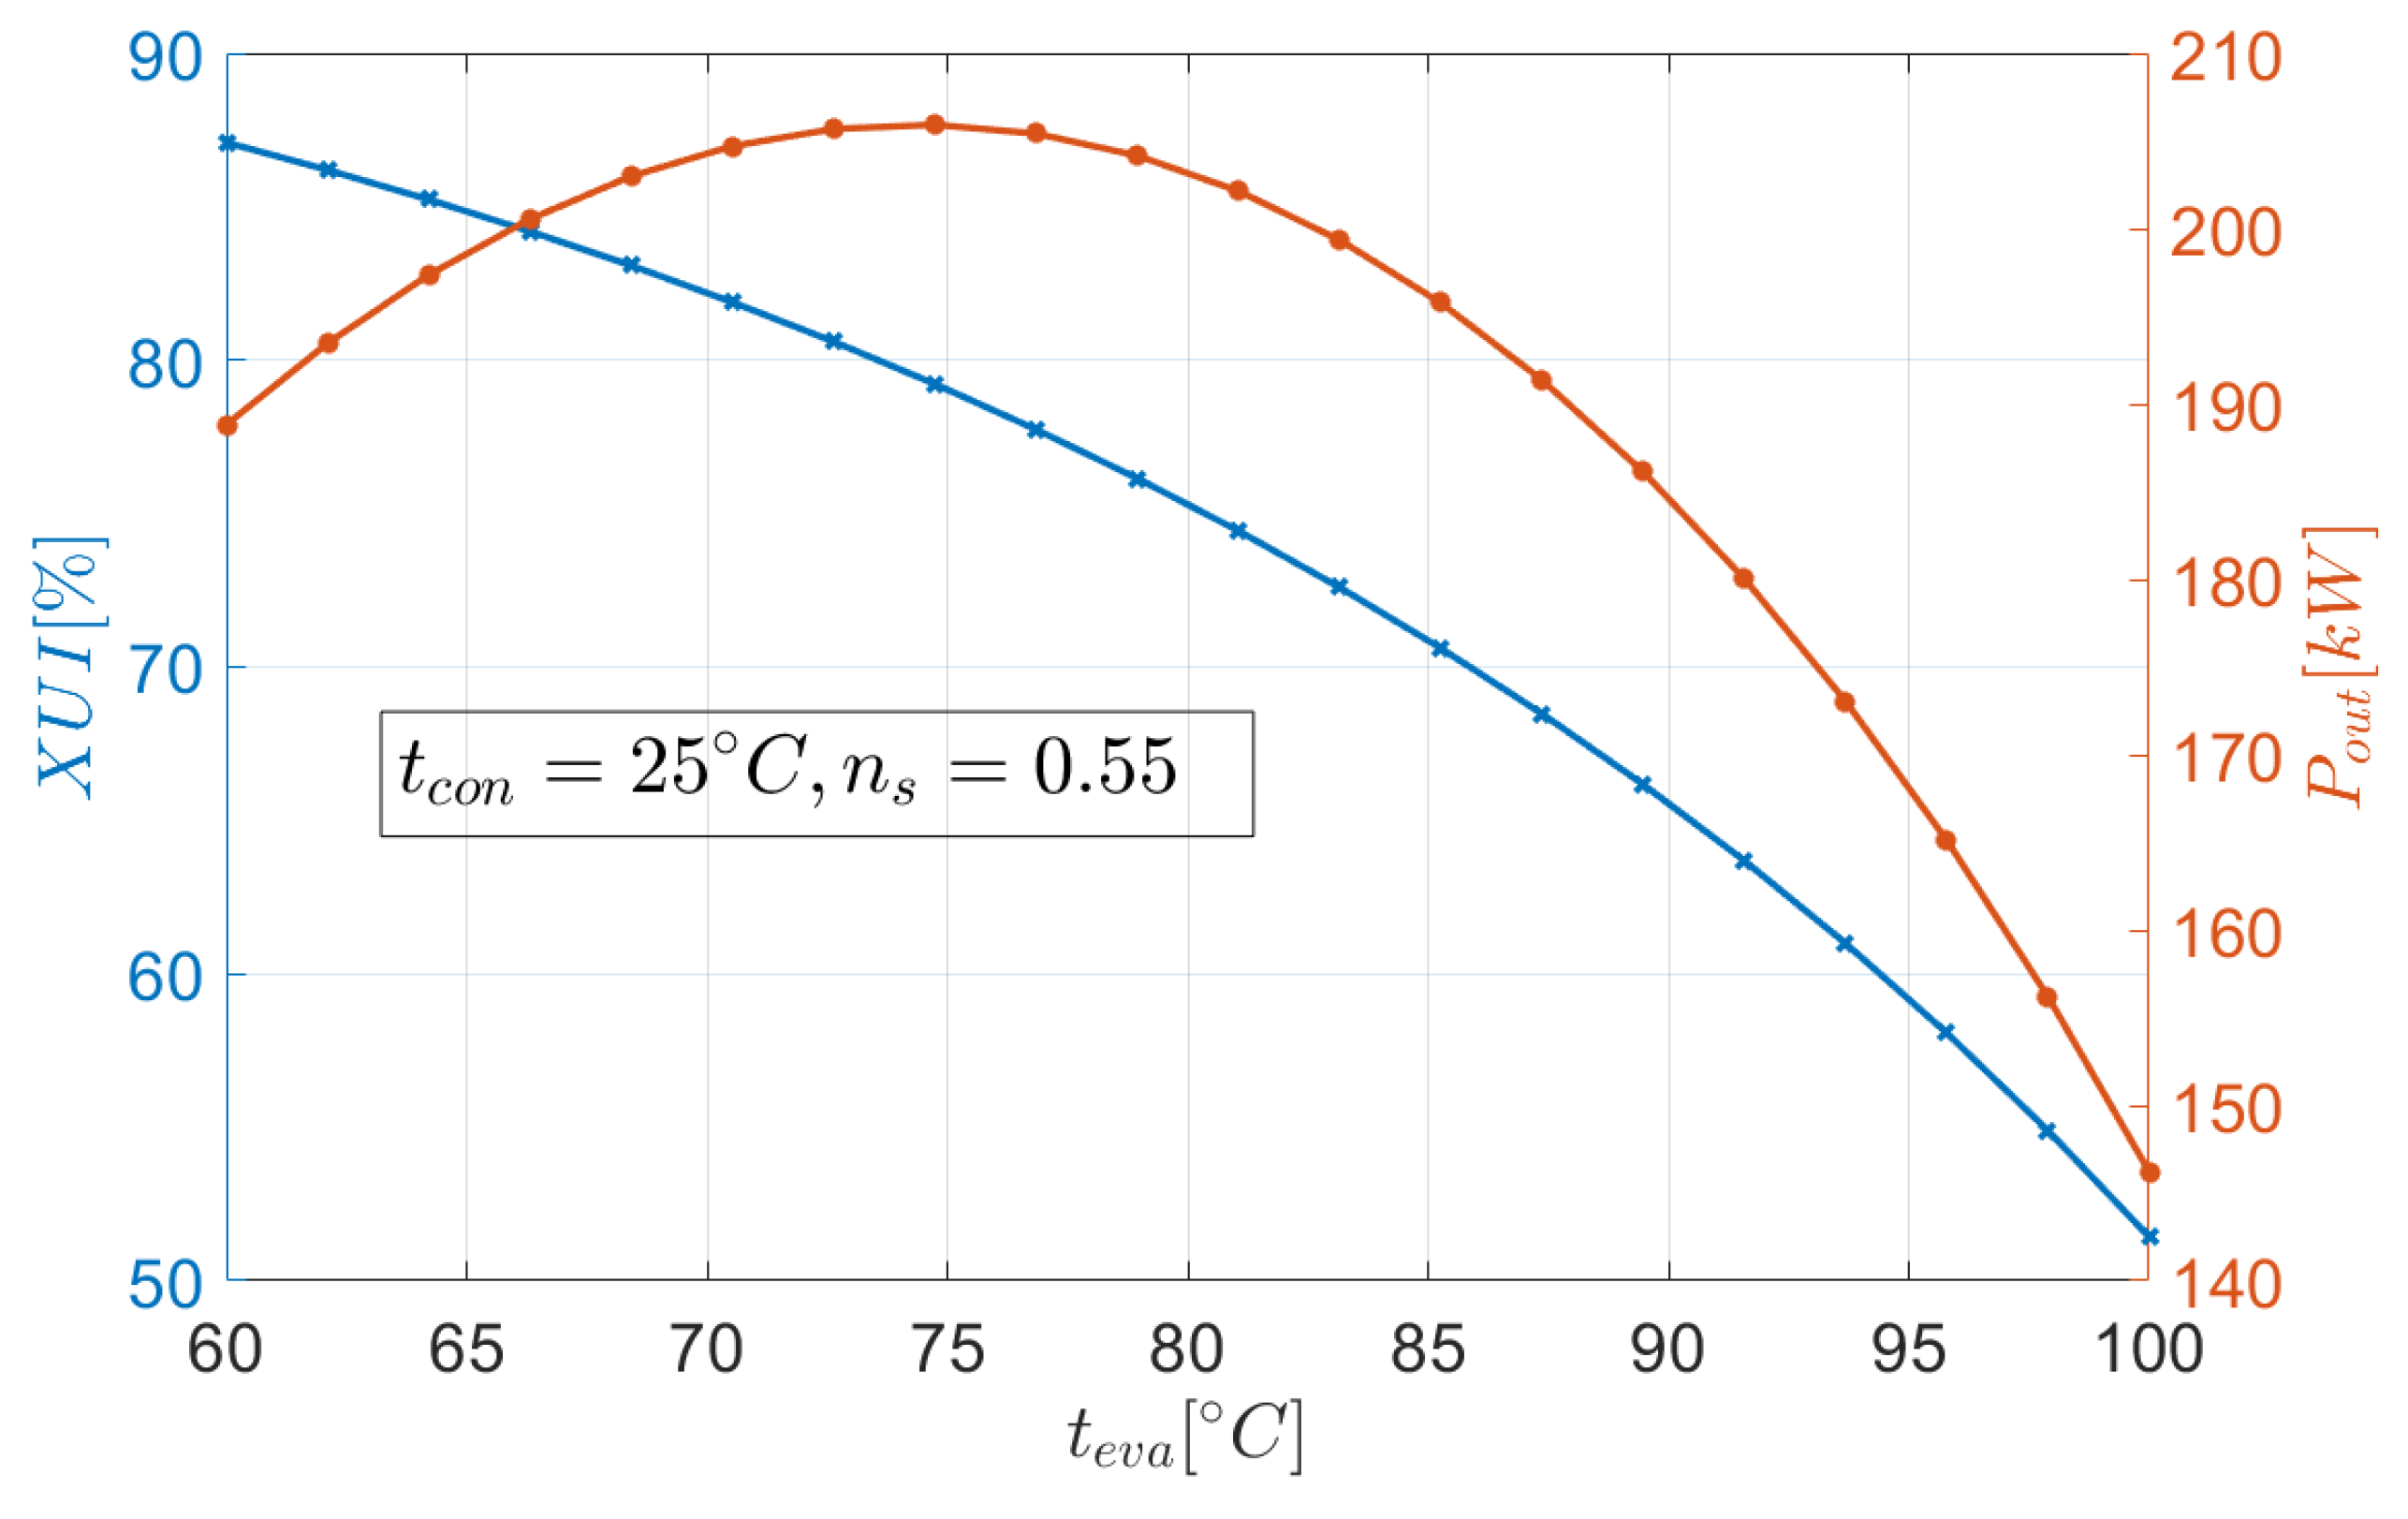
The crucial ORC parameter to be analyzed is the net power output Pout and its relationship with the XUI is presented in Figure 5. It can be seen that the global maximum of the Pout is obtained for the teva = ~75 °C. The point of the maximum Pout corresponds to the high value of the XUI which reaches nearly 80%. The higher values of the teva lead to a decrease of both XUI and Pout. Considering the fact that values of XUI exceeding 80% cannot be obtained for the reasons mentioned above, the maximization of the XUI shall ensure the maximization of the Pout. The existence of the extremum of the Pout is due to the conflicting influence of the teva on the mass flow rate wf and thermal efficiency ηORC of the ORC.

6.2. Comparative Analysis of XUI and Selected ORC Serformance Indicators

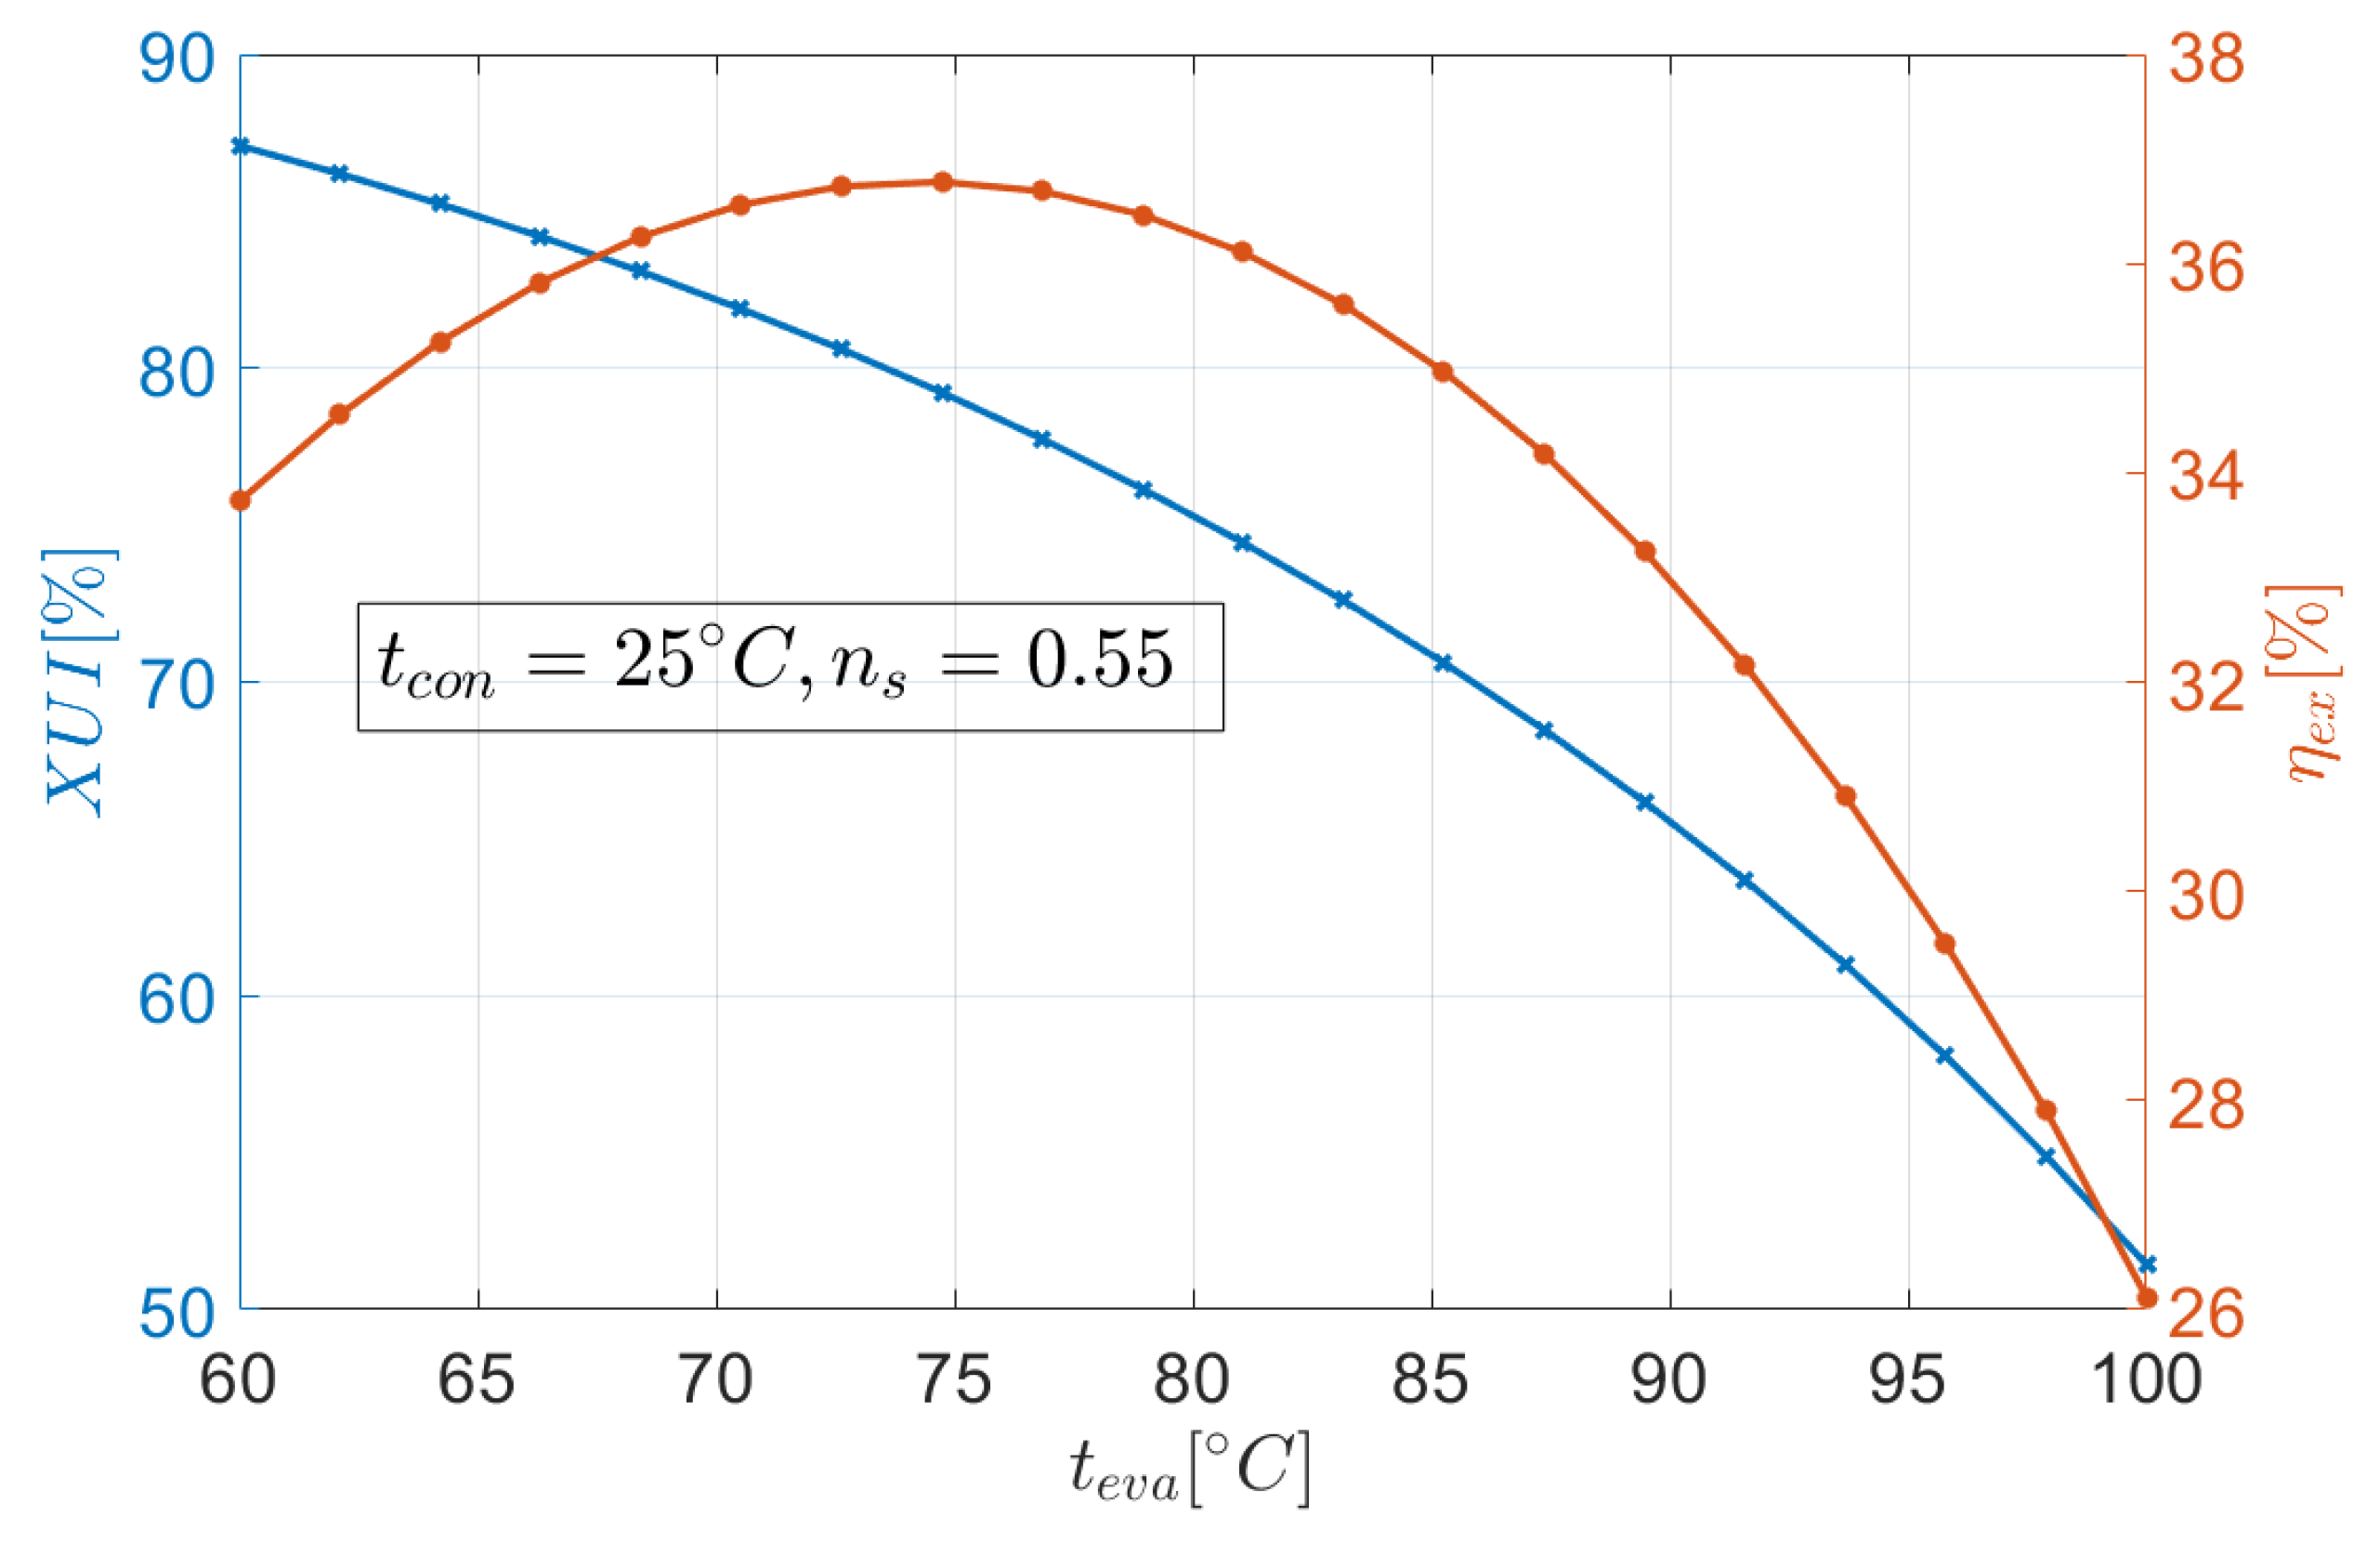
In order to reveal the similarities and differences between the XUI and common ORC performance indicators, the results for the proposed index are compared with the outcomes obtained for: five exergy-related, one energy-based and one economic indicator. The exergy efficiency ηex is mostly affected by the net power output Pout (see Equation (1)). Therefore, the relationship with respect to the evaporation temperature teva is the same (see Figure 6) as for the Pout (see Figure 5). Moreover, the maximization of the XUI leads to the higher values of the ηex for the studied case.
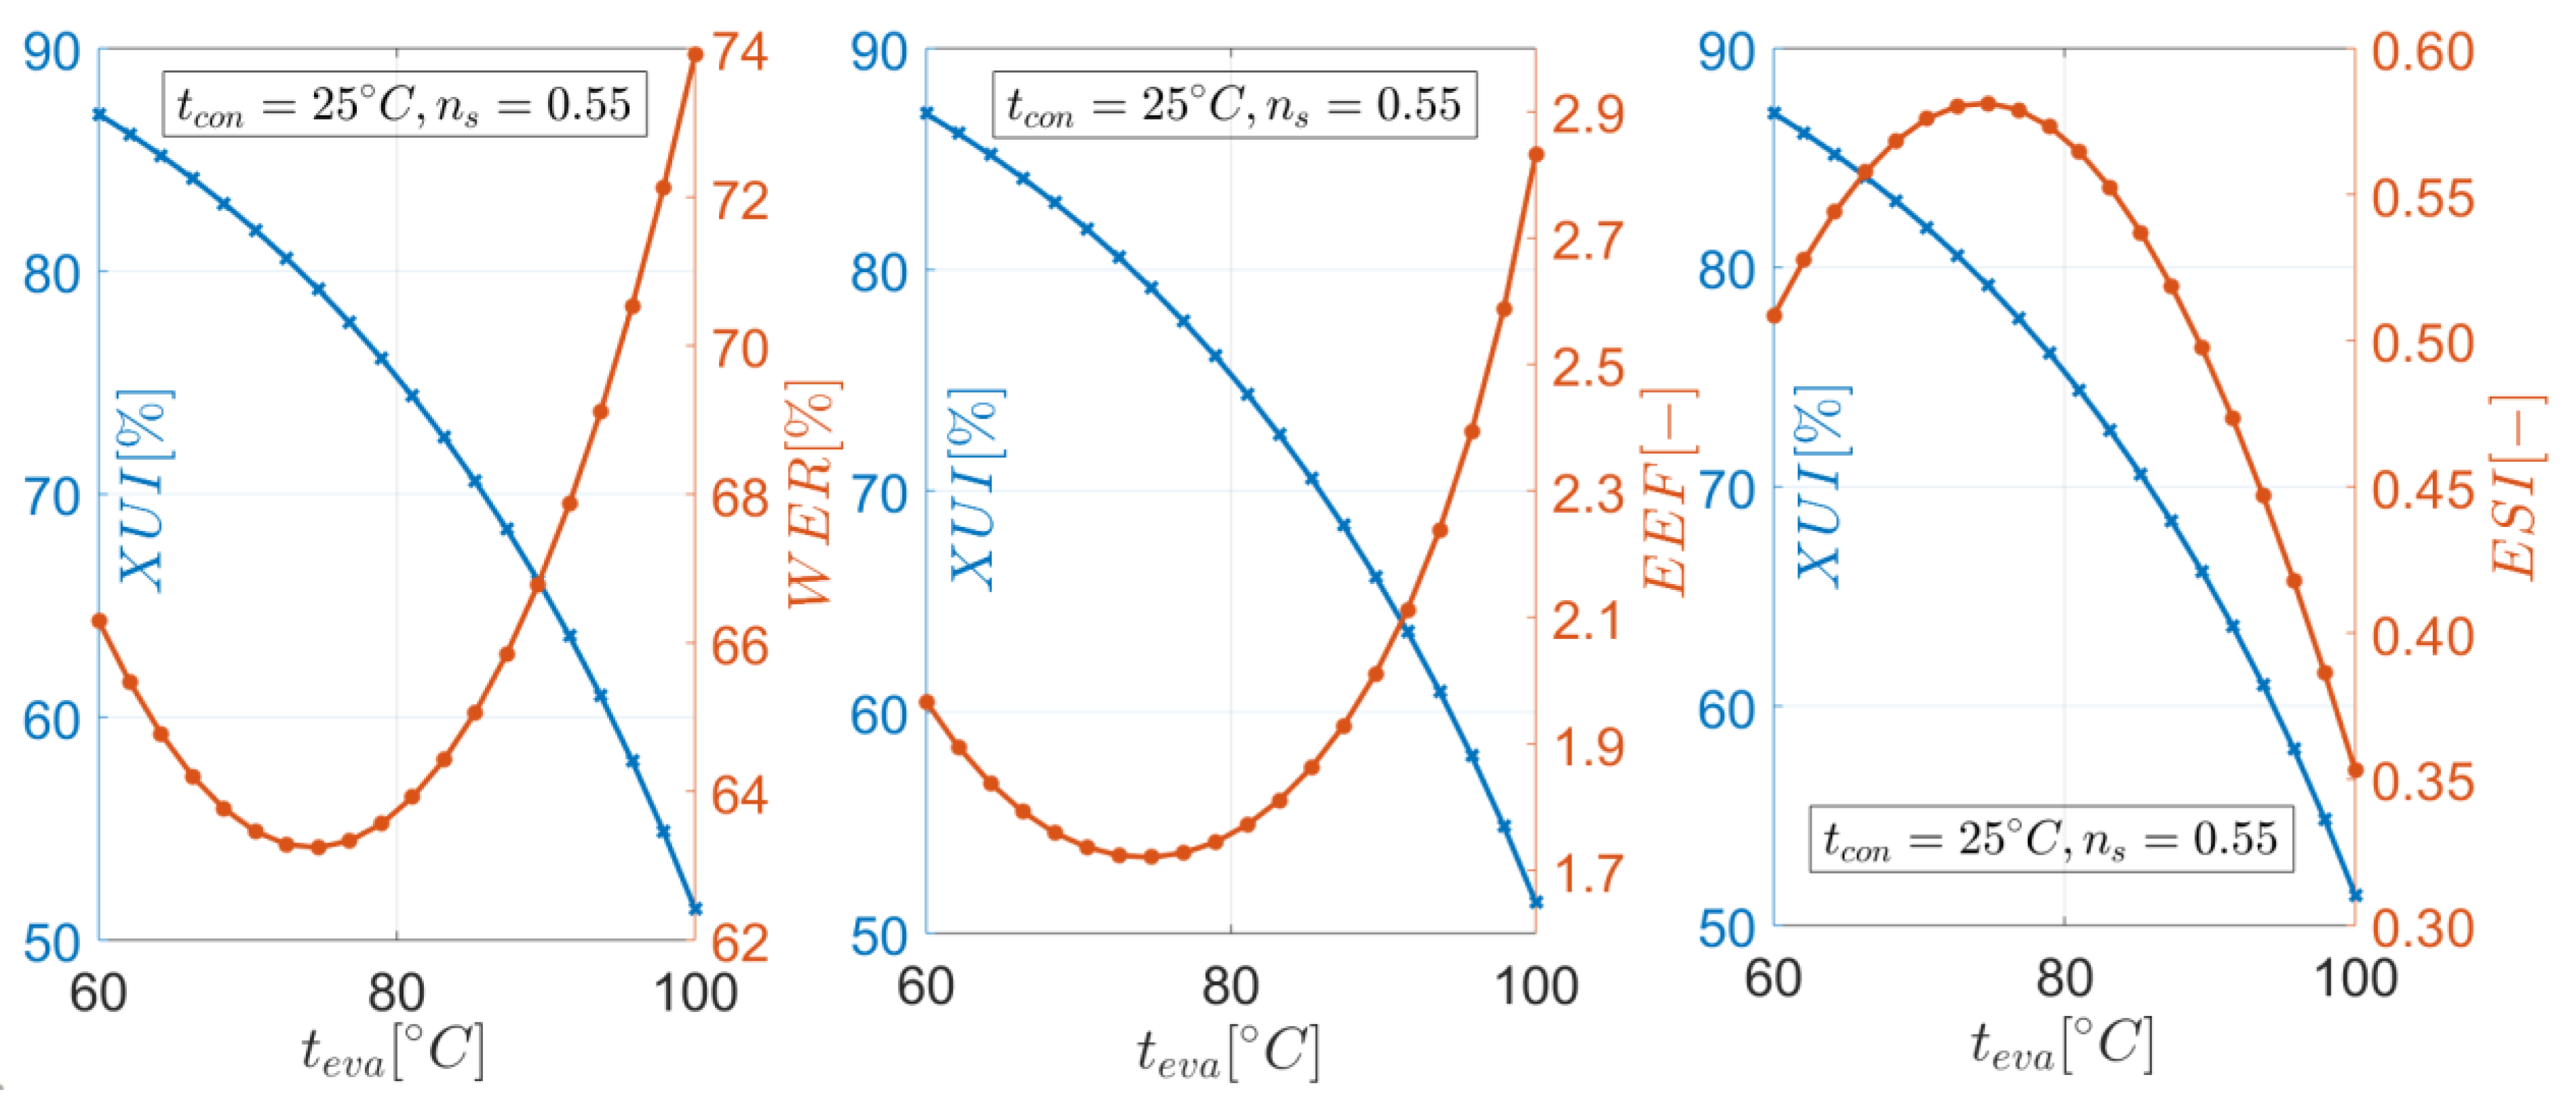
In the previous sections, it was discussed that the exergy-related indicators, such as waste exergy ratio WER, environmental effect factor EEF and exergetic sustainability index ESI, are basic combinations of the exergy efficiency ηex. This observation is reflected in the results presented in Figure 7. By comparing the outcomes for the exergy efficiency ηex (Figure 6) with the results obtained for the WER, it is clear that they are consistent with respect to relation given in Equation (43). The global minimum of WER is obtained for the same evaporation temperature (teva = ~75 °C) as in case of the global maximum of the ηex. As expected, almost the same trend as in case of WER is observed for the EEF. For both indicators WER and EEF, minimum values are desirable. Following the results obtained for the exergetic sustainable index ESI, it is apparent that the shape of the curve is very similar to the ηex and the global optimum point is the same. When it comes to compare the results with respect to the exergy utilization index XUI, the observations are similar as for the net power output Pout and exergy efficiency ηex. The high values of the proposed indicator (XUI = ~80%) correspond to global optima of all three exergy-based indices. This means that for the high utilization degree of the heat source, more sustainable work of the system can be provided.
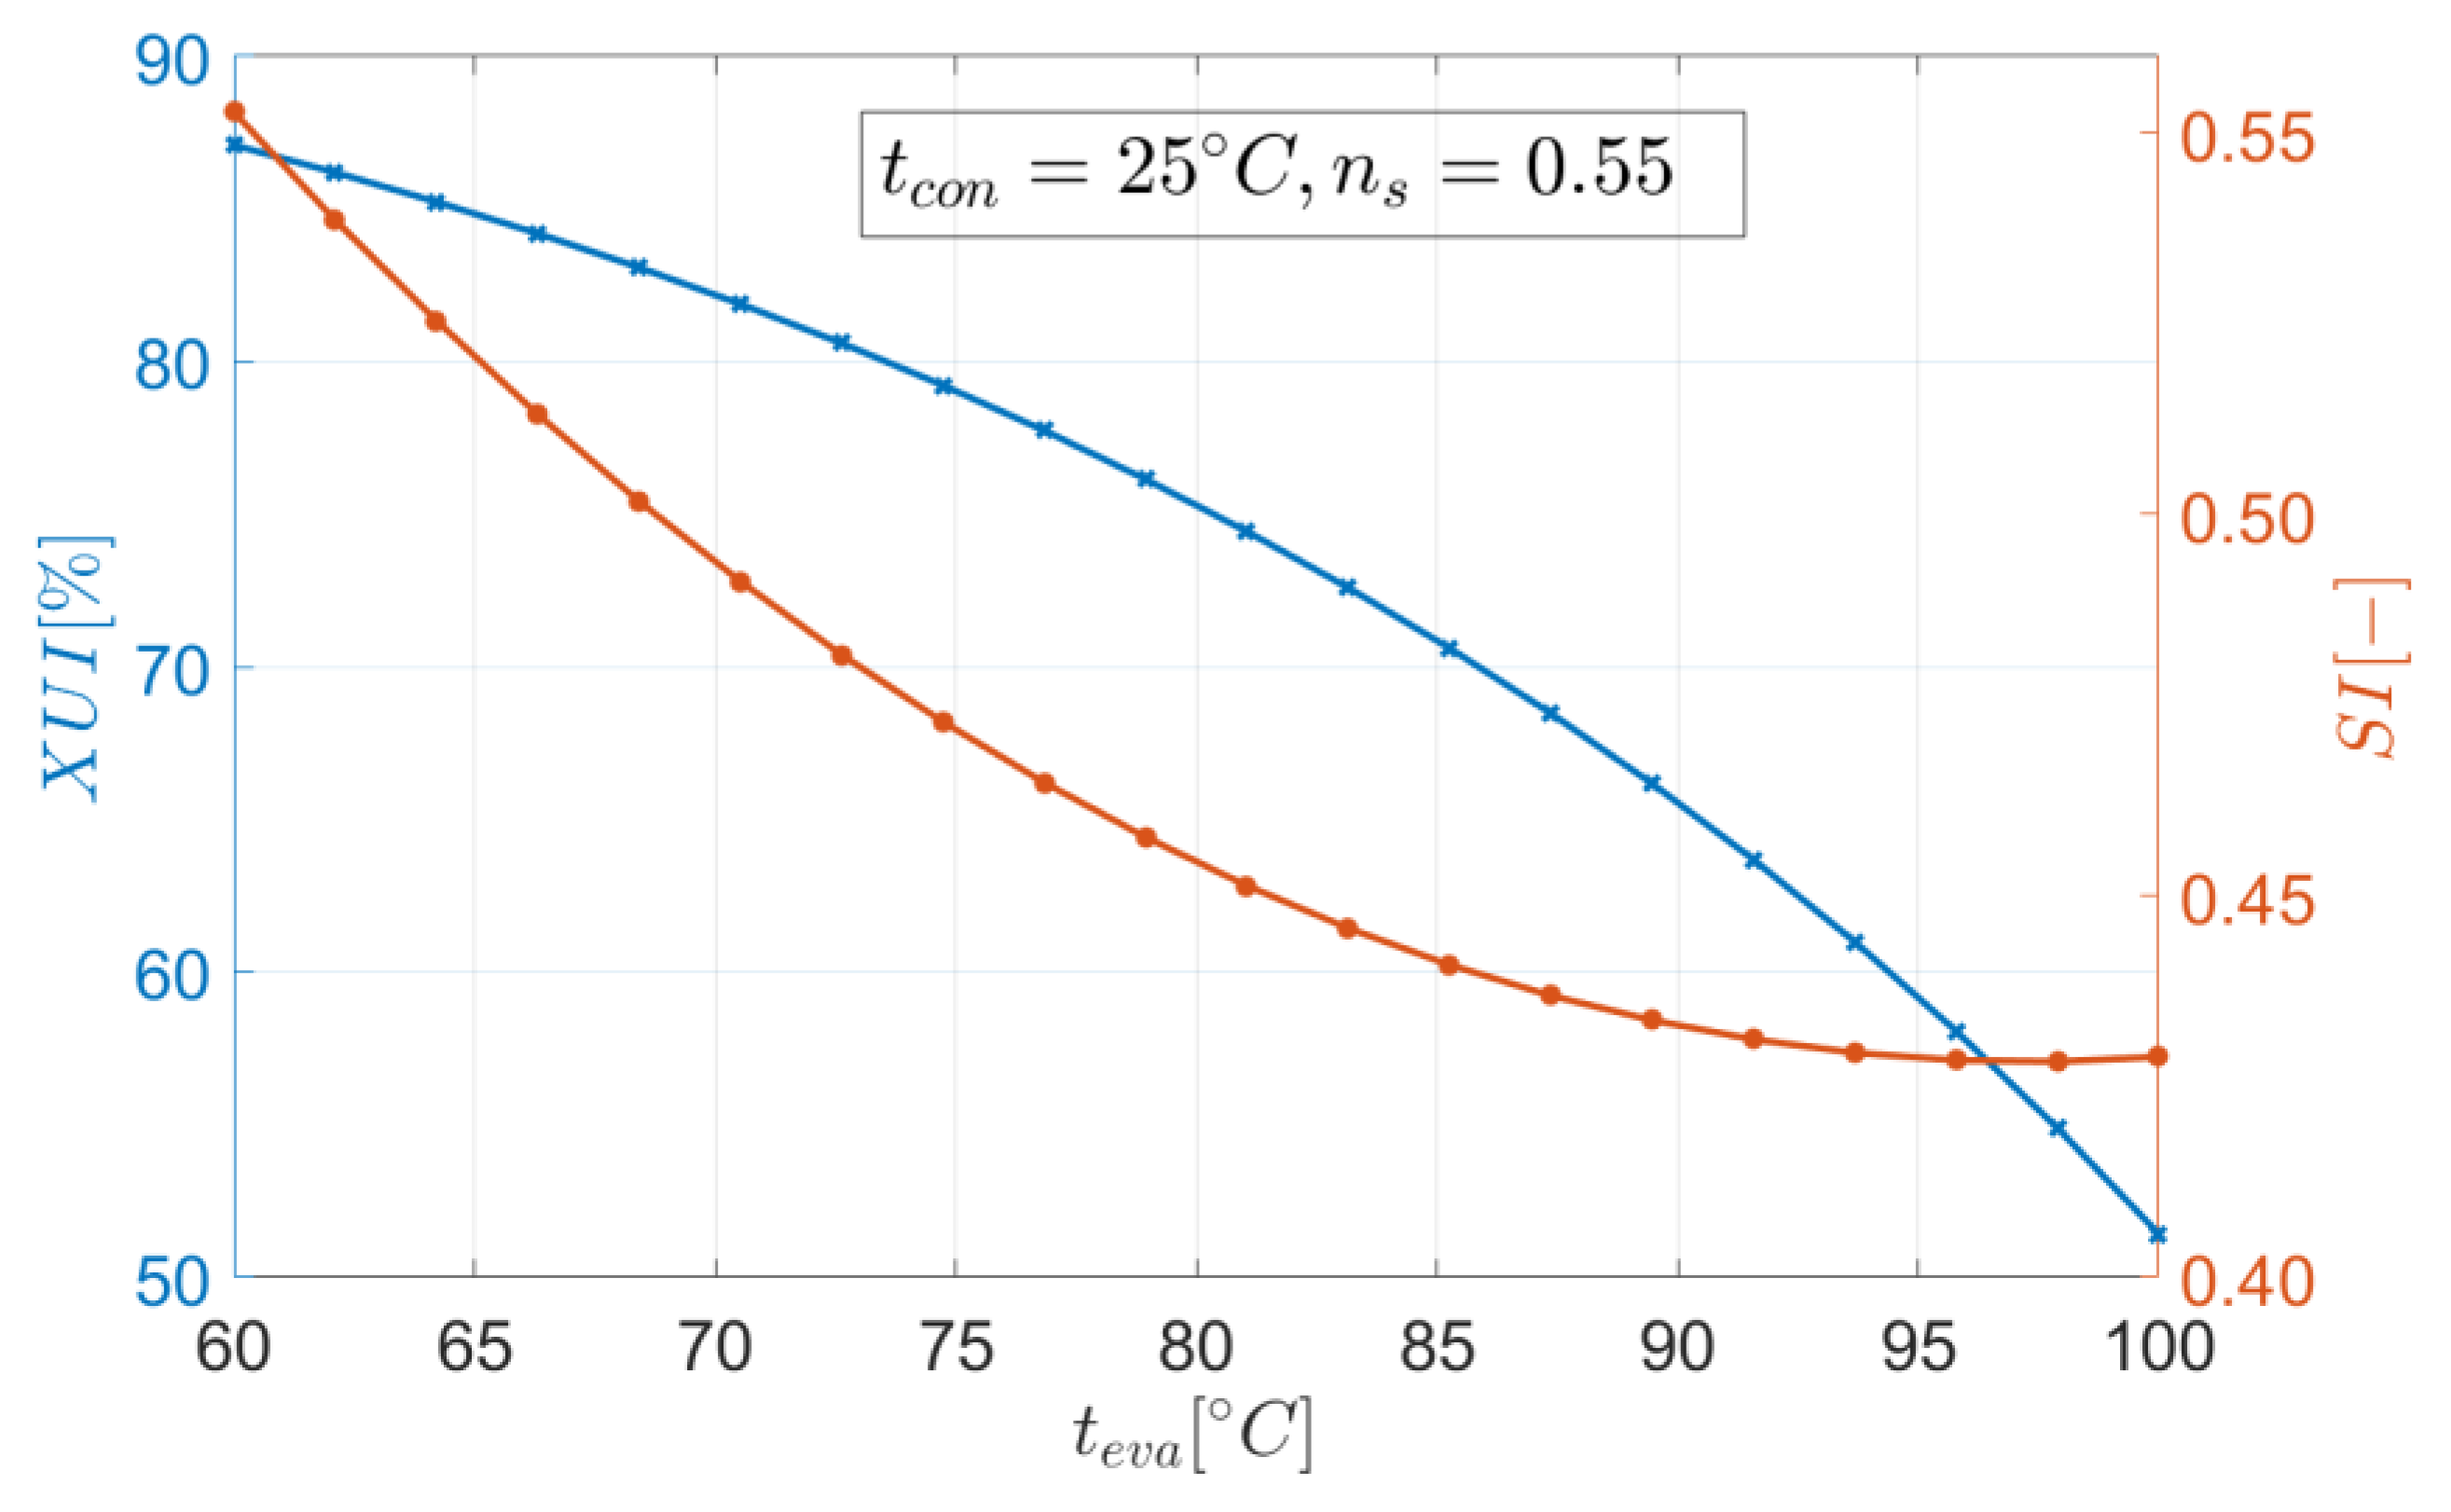
The sustainability index SI defined by Equation (2) compares the total exergy destruction rate δḂtot with the exergy drop of the heat carrier Δhs. Thus, SI should be minimized, reducing δḂtot and maximizing Δhs. The increase of the latter is equivalent to minimize hs2, making it similar to the XUI. Even though both objectives favor the minimization of the hs2, the results presented in Figure 8 show that the XUI and SI are in conflict. The reason for that is the fact that the greater values of the teva correspond to lower exergy destruction rate δḂtot. The δḂtot seems to be a dominant factor in case of SI. In general, the results show that SI is an effective indicator for minimizing internal exergy destructions in the ORC system. However, the minimization of that index simultaneously leads to lower utilization degree of the energy source which is reflected in lower values of the XUI. It is worth reminding that the exergy flow rate hs2 is also regarded as the component of external exergy loss in the ORC [1]. Therefore, XUI can be effectively applied for minimizing this type of exergy losses and it seems to be a better choice than SI in that aspect. Furthermore, for cases in which the heat carrier leaving the vapor generator is directed to the environment, the minimization of the hs2 is very beneficial from an ecological perspective, since the negative impact of the medium is reduced. This makes XUI a promising indicator in terms of the environmental aspect as well.
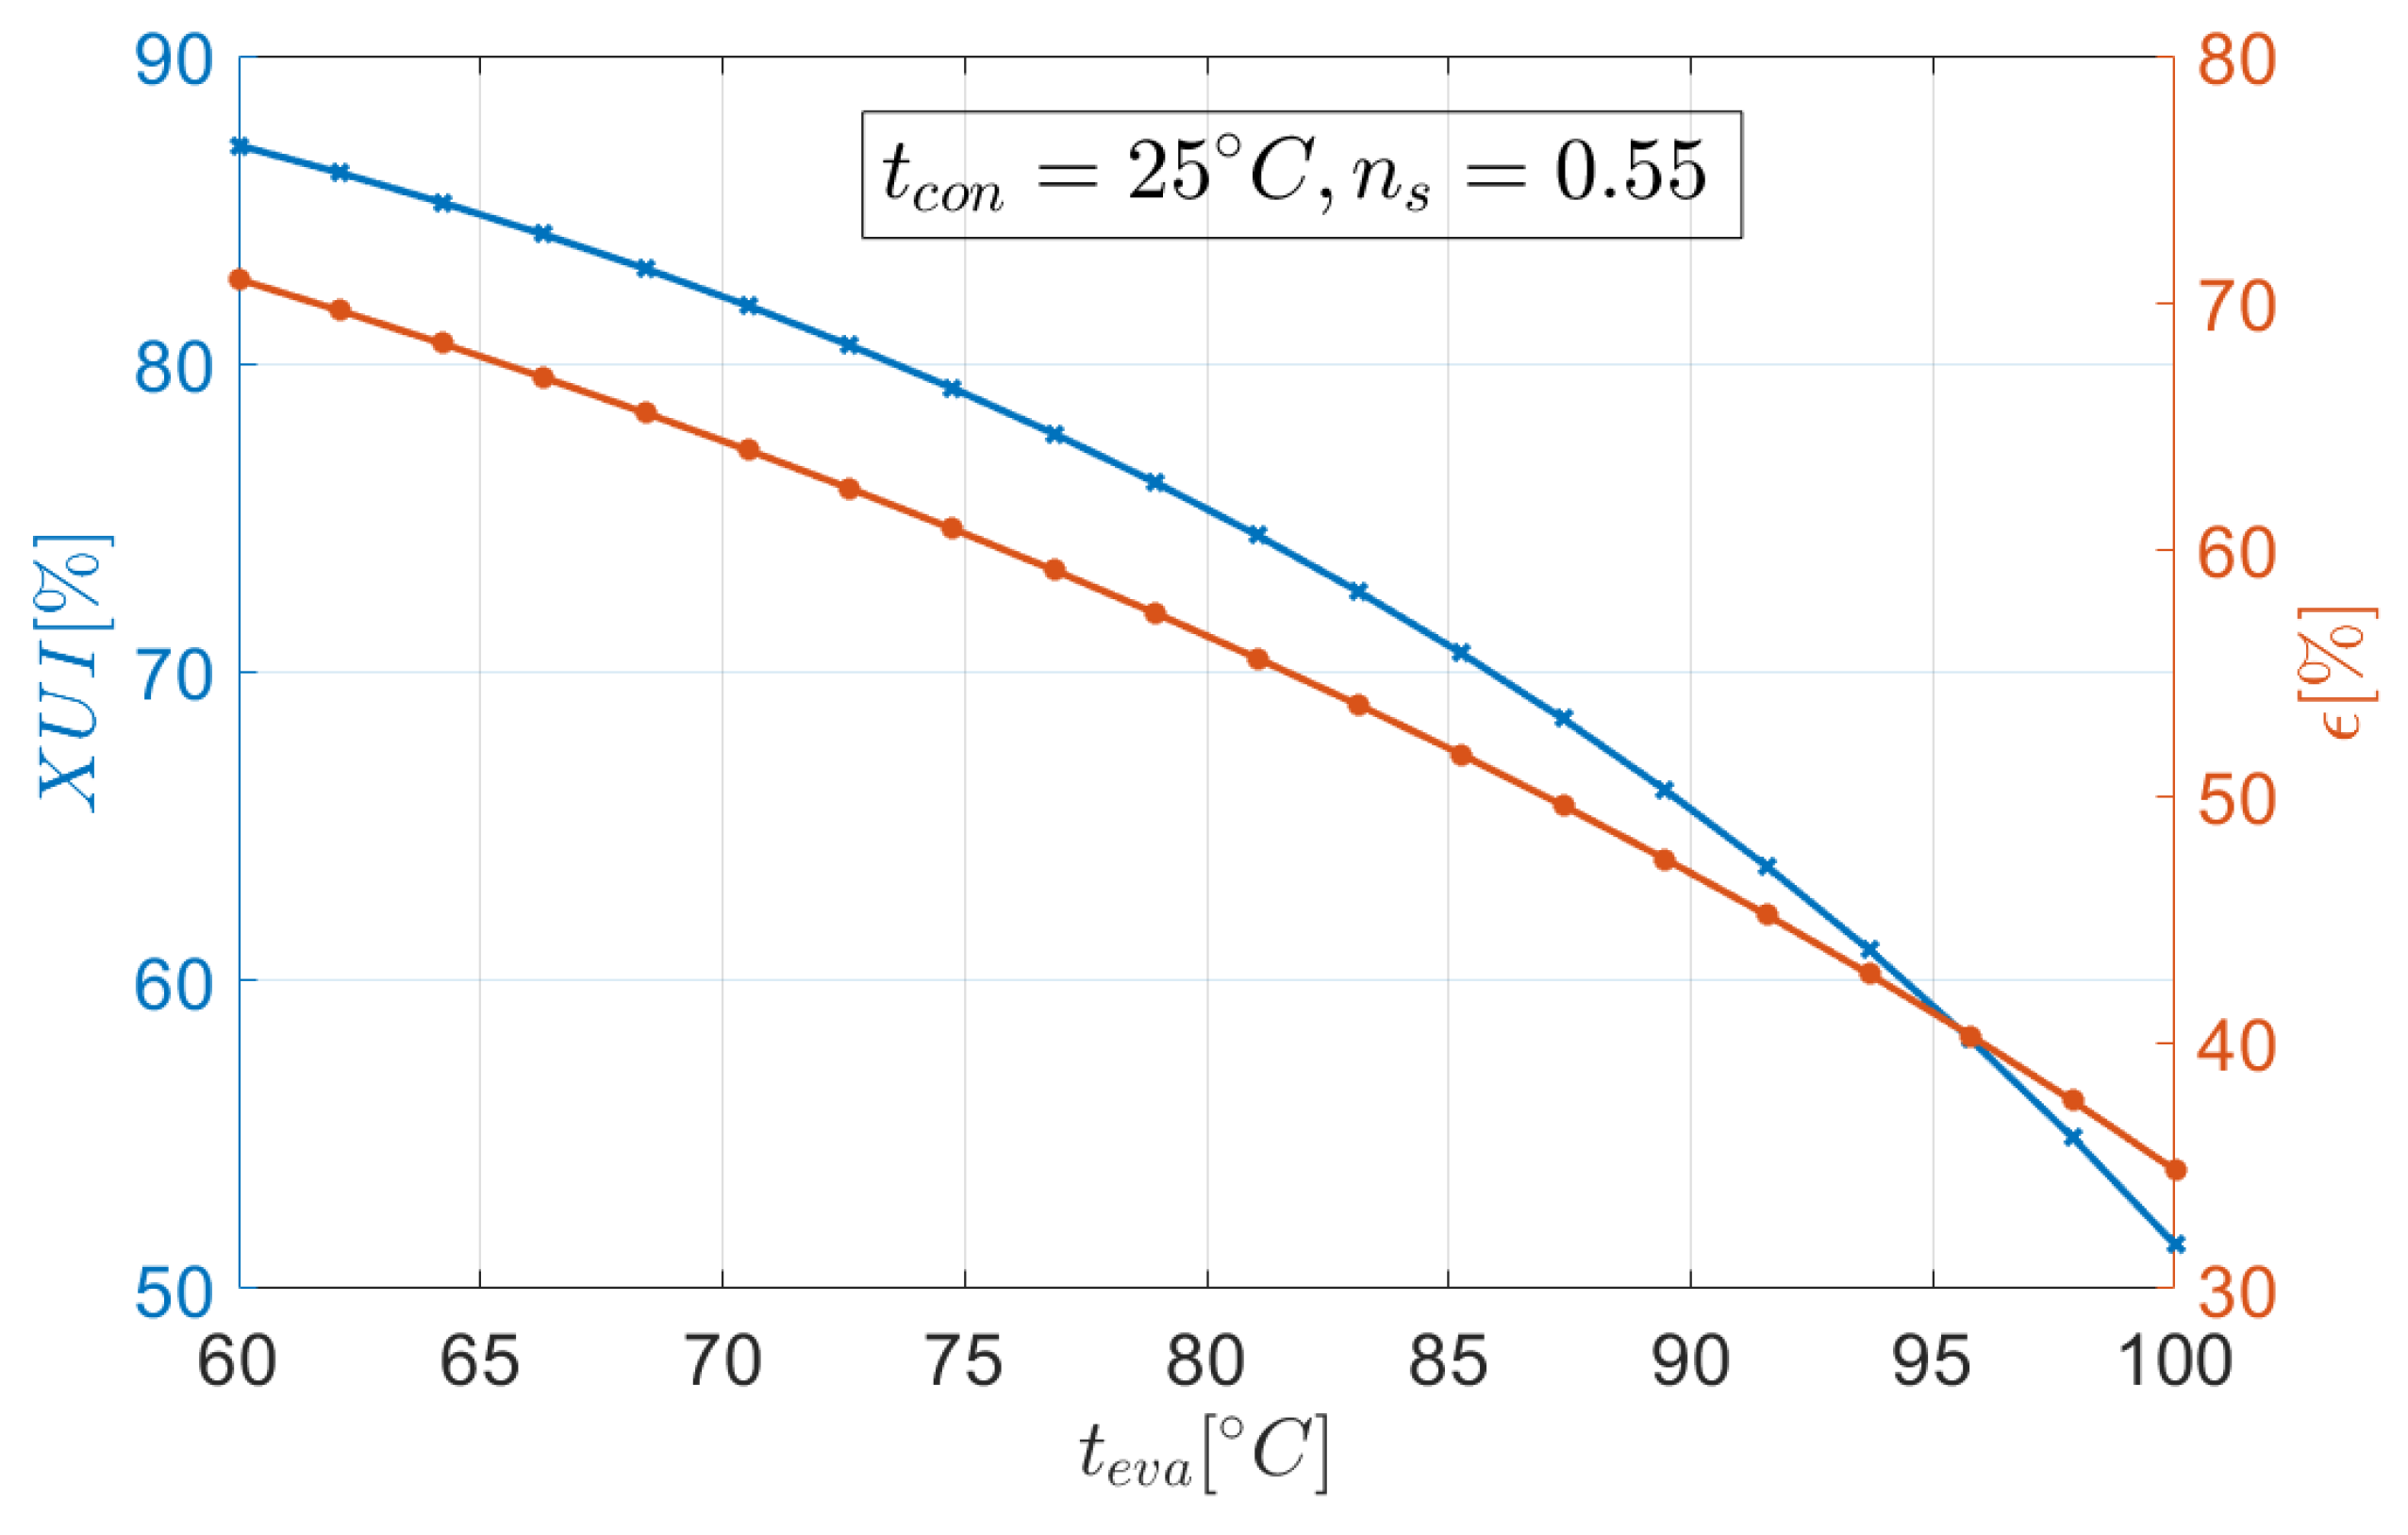
The effectiveness ε of the heat carrier (Equation (24)) is defined in a way which should maximize the utilization of the energy source in the system. For this reason, the relationships for both XUI and ε with respect to the teva are very similar (Figure 9). The fact that XUI includes the entropy generation rate (see Equation (8)) of the heat carrier makes it more comprehensive than ε which is based solely on the energy balance equation.
The economic aspect of the ORC may be examined using different indicators which directly or indirectly evaluate the cost of the installation. In the current study, the payback period PBP of the installation is used and results of the calculations are presented in Figure 10. The global minimum of PBP is achieved for the evaporation temperature teva = ~76 °C and the payback period is equal to: PBP = ~9.5 years. The location of the extremum is very close to that obtained for the Pout which was shown in Figure 5. It suggests that the PBP is strongly affected by the net power output Pout. The minimum value of the payback period PBP corresponds to the high value of the exergy utilization index, i.e.,: XUI = ~80%. The significant lower values of the XUI (~50%) lead to the noticeable increase of the PBP (~12.5 years). The XUI values that substantially exceed 80% lead to slight increase in PBP (~10.5 years). However, as described in Section 6.1, values of XUI greater than 80% cannot be achieved due to the constraint imposed on the outlet temperature ths2 of the heat carrier. Therefore, it can be concluded that maximization of the XUI is beneficial with respect to the economic criterion.

6.3. Pareto frontier

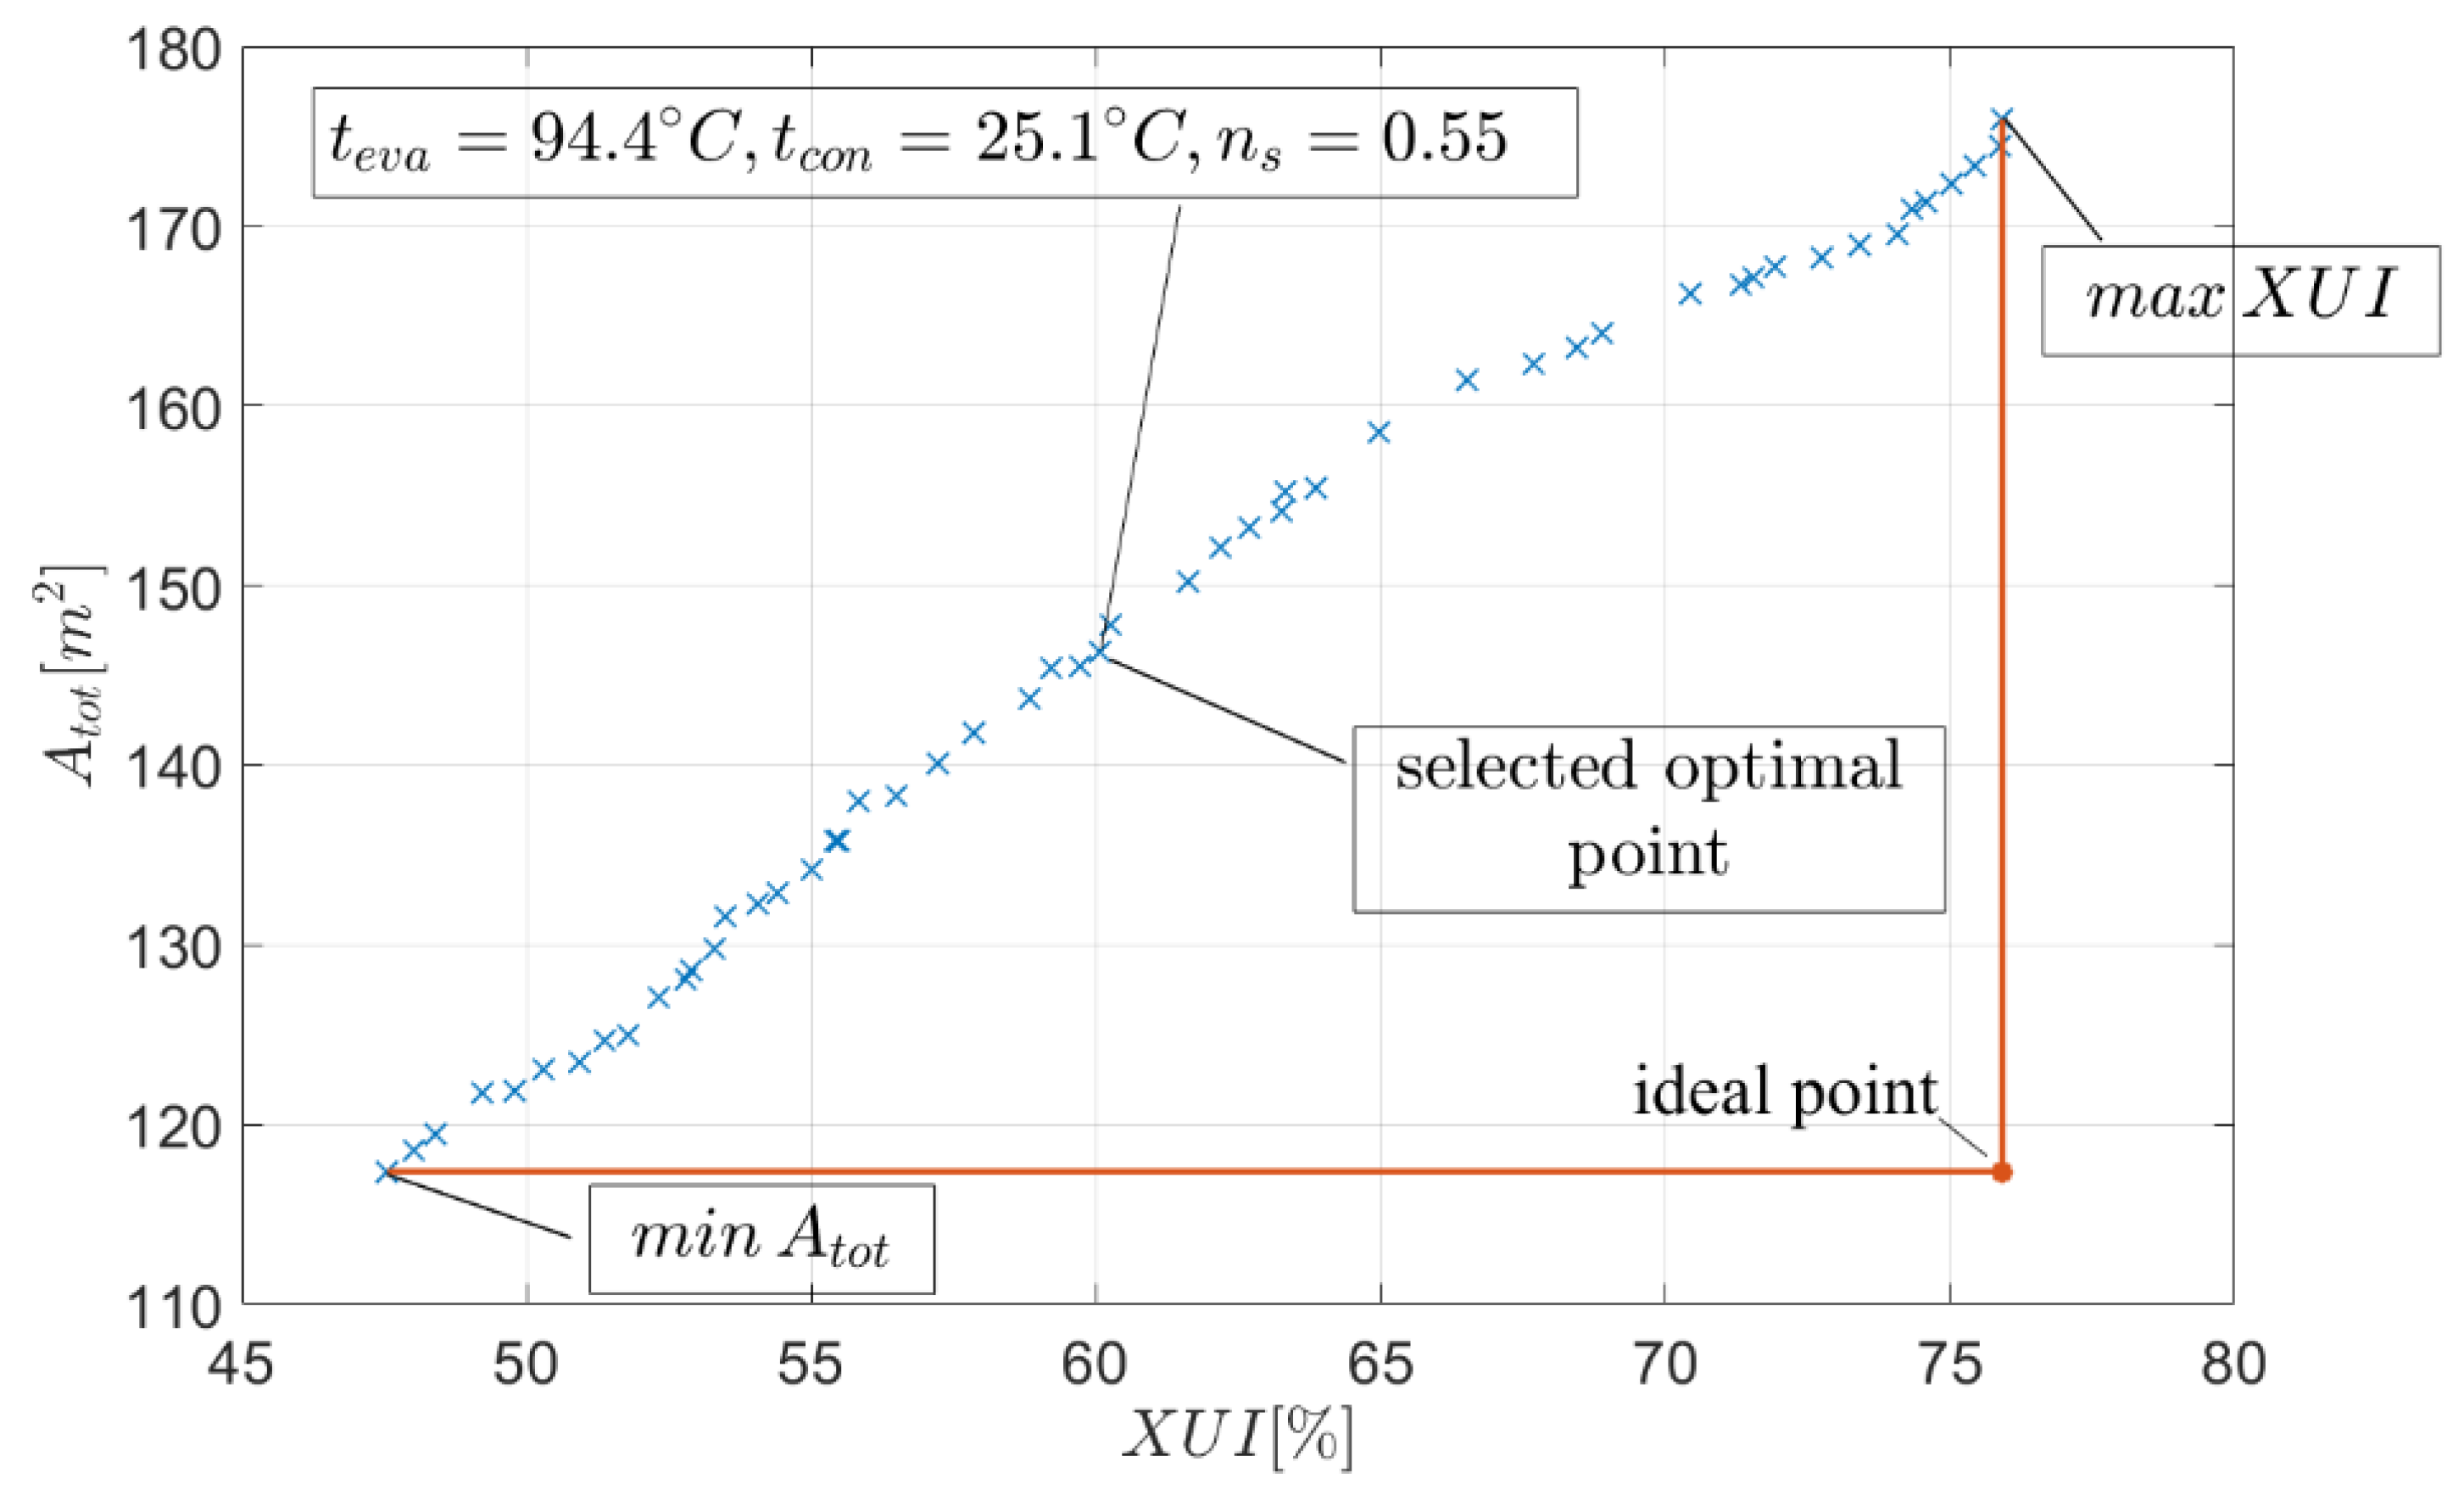
The results of the multi-objective optimization using NSGA-II are displayed in the form of a Pareto frontier graph. The Pareto frontier consists of the so-called optimal non-dominated solutions, which means that the improvement of one objective function cannot be made without sacrificing the other one. In order to choose the final optimal solution, a decision-making method should be selected and applied. For the studied case, the ideal point method [32] was used and the result of the decision-making process is presented in Figure 11. The values of the exergy utilization index and total heat transfer area that correspond to the selected optimal point are the following: XUI = 60.1% and Atot = 146 m2.
Recalling the outcomes presented in the previous subsections, the selected optimal value of the XUI shall ensure favorable values of the economic (payback period PBP) and environmental (hs2) indices, exergy efficiency ηex or net power output Pout. Simultaneously, the choice of the total heat transfer area Atot as the second objective function allows for maintaining the compactness of the system. The fact that XUI is in conflict with the Atot allows to conclude that the proposed indicator is not effective in minimizing the size of the system. This is mainly because the XUI is strongly affected by the mass flow rate of working fluid wf and the increase of the latter leads to the continuous increase of the first one. That is also the main reason for the greater internal exergy destruction rate δḂtot associated with a larger value of the XUI which was shown using SI parameter (see Figure 8). Therefore, the XUI can be regarded as the criterion which maximization may lead to the beneficial economic and environmental characteristics. However, the simultaneous significant increase of the system dimensions should be balanced using objective functions, such as: Atot, δḂtot, or SI. In Table 4, the detailed results of the multi-objective optimization are presented. They include the points marked in Figure 11 which correspond to: minimum total heat transfer area (min Atot), selected optimal point, and maximum exergy utilization index (max XUI).

7. Conclusions

The aim of the study was to introduce a novel exergy indicator for maximizing energy utilization in ORC power plant. The exergy utilization index XUI was analysed by comparing its relationships with selected ORC parameters and performance indicators. Moreover, an illustrative multi-objective optimization using NSGA-II tool was performed in order to reveal the potential for applying XUI as objective function in the performance optimization of ORC power plants. The analysis of the results allowed to draw the following conclusions:
  • by maximizing XUI to the value of 75.9%, the outlet temperature of a geothermal water ths2 is reduced to the environmental temperature (tr = 15.0 °C) as close as possible, i.e., to the lowest value (ths2 = 60.0 °C) of the constraint imposed on the ths2. In other words, the potential of the heat source is maximized by maximizing XUI,
  • the value of XUI = ~80% corresponds to the global optima of exergy-based indices which means that high values of XUI may be associated with more sustainable work of the ORC,
  • the values of the XUI = ~60%–80% lead to good economic characteristics reflected in low values of the payback period PBP (<11.3 years),
  • the maximization of the XUI is beneficial from ecological perspective, since it minimizes the negative impact of the heat carrier on the environment, by reducing the value of outlet exergy flow rate hs2,
  • the proposed indicator is not effective in minimizing the size of the system and its maximization leads to the total heat transfer area Atot which is 50.4% greater than the value obtained while minimizing Atot.
In general, the XUI seems to be a promising indicator in the optimization of the ORC power plant, particularly in multi-objective analysis, in which its drawbacks can be balanced using the opposite criterion.

Author Contributions

Conceptualization, M.J. and A.B.; Data curation, M.J. and A.B.; Methodology, M.J.; Software, M.J.; Validation, M.J.; Writing—original draft preparation, M.J.; Writing—review and editing, M.J. and A.B.; Visualization, M.J.; Supervision, A.B. All authors have read and agreed to the published version of the manuscript.

Funding

The work has been partially financed by Polish National Agency for Academic Exchange for implementation the project entitled “R&D in the field of increasing the efficiency of low temperature geothermal power plants” under the agreement PPN/BEK/2018/1/00408/DEC/1.

Acknowledgments

The authors are pleased to acknowledge the West Pomeranian University of Technology in Szczecin for the support.

Conflicts of Interest

The authors declare no conflict of interest.

Nomenclature

Aheat transfer area, m2
exergy flow rate, kW
bblade width, m
Celelectricity price, $ kWh−1
Ctotcapital cost, $
COMccost of operation and maintenance coefficient, %
cspecific heat capacity, kJ kg−1 K−1
dhhydraulic diameter, mm
EEFenvironmental effect factor, -
ESIexergetic sustainability index, -
hspecific enthalpy, kJ kg−1
incincidence angle, °
irinterest rate, %
koverall heat transfer coefficient, W m−2 K−1
MaMach number, -
m ˙ mass flow rate, kg s−1
NuNusselt number, -
nsspecific speed, -
Poutnet power output, kW
PBPpayback period, years
ppressure, kPa
qpitch, m
Rreaction degree, -
rradius, m
SIsustainability index, -
sspecific entropy, kJ kg−1 K−1
Ttemperature, K
ttemperature, °C
topoperating time, h
V ˙ volume flow rate, m3 h−1
WERwaste exergy ratio, %
XUIexergy utilization index, %
ZRaxial length of rotor, m
Greek Letters
αheat transfer coefficient, W m−2 K−1
Δexergy difference, kW
ΔHisisentropic enthalpy drop, kJ kg−1
Δhlossenthalpy loss, kJ kg−1
ΔTtemperature difference, K
δwidth of plate, mm
δexergy destruction rate, kW
ηefficiency, %
λthermal conductivity W m−1 K−1
ρdensity, kg m−3
εeffectiveness, %
ωangular velocity, rad s−1
Subscript
BMbare module
Ccondenser
concondensation
coolcold water
evaevaporation
exexergy
hsheat source
hubhub
lliquid
loglogarithmic
mmaterial
Ppump
PECpurchased equipment cost
pplate or pressure
rreference state
shshroud
supsuperheating
Tturbine
tottotal
VGvapor generator
wfworking fluid
Abbreviations
CEPCIchemical engineering plant cost index
GWPglobal warming potential
ODPozone depletion potential
ORCorganic Rankine cycle

References

  1. Borsukiewicz-Gozdur, A. Exergy analysis for maximizing power of organic Rankine cycle power plant driven by open type energy source. Energy 2013, 62, 73–81. [Google Scholar] [CrossRef]
  2. Li, J.; Ge, Z.; Duan, Y.; Yang, Z. Design and performance analyses for a novel organic Rankine cycle with supercritical-subcritical heat absorption process coupling. Appl. Energy 2019, 235, 1400–1414. [Google Scholar] [CrossRef]
  3. Gong, M.; Wall, G. On exergy and sustainable development–Part 2: Indicators and methods. Exergy Int. J. 2001, 1, 217–233. [Google Scholar] [CrossRef]
  4. Garg, P.; Orosz, M.S. Economic optimization of Organic Rankine cycle with pure fluids and mixtures for waste heat and solar applications using particle swarm optimization method. Energy Convers. Manag. 2018, 165, 649–668. [Google Scholar] [CrossRef]
  5. Li, J.; Ge, Z.; Duan, Y.; Yang, Z.; Liu, Q. Parametric optimization and thermodynamic performance comparison of single-pressure and dual-pressure evaporation organic Rankine cycles. Appl. Energy 2018, 217, 409–421. [Google Scholar] [CrossRef]
  6. Romero, J.C.; Linares, P. Exergy as a global energy sustainability indicator. A revew of the state of the art. Renew. Sustain. Energy Rev. 2014, 33, 427–442. [Google Scholar] [CrossRef]
  7. Lecompte, S.; Huisseune, H.; van den Broek, M.; Vanslambrouck, B.; De Paepe, M. Review of organic Rankine cycle (ORC) architectures for waste heat recovery. Renew. Sustain. Energy Rev. 2015, 47, 448–461. [Google Scholar] [CrossRef]
  8. Sun, W.; Yue, X.; Wang, Y. Exergy efficiency analysis of ORC (Organic Rankine Cycle) and ORC-based combined cycles driven by low-temperature waste heat. Energy Convers. Manag. 2017, 135, 63–73. [Google Scholar] [CrossRef]
  9. Lecompte, S.; Ameel, B.; Ziviani, D.; van den Broek, M.; De Paepe, M. Exergy analysis of zeotropic mixtures as working fluids in Organic Rankine Cycles. Energy Convers. Manag. 2014, 85, 727–739. [Google Scholar] [CrossRef]
  10. Xiao, L.; Wu, S.Y.; Yi, T.T.; Liu, C.; Li, Y.R. Multi-objective optimization of evaporation and condensation temperatures for subcritical organic Rankine cycle. Energy 2015, 83, 723–733. [Google Scholar] [CrossRef]
  11. Abam, F.I.; Ekwe, E.B.; Effiom, S.O.; Ndukwu, M.C.; Briggs, T.A.; Kadurumba, C.H. Optimum exergetic performance parameters and thermo-sustainability indicators of low-temperature modified organic Rankine cycles (ORCs). Sustain. Energy Technol. 2018, 30, 91–104. [Google Scholar] [CrossRef]
  12. Aydin, H. Exergetic sustainability analysis of LM6000 gas turbine power plant with steam cycle. Energy 2013, 57, 766–774. [Google Scholar] [CrossRef]
  13. Abam, F.I.; Ekwe, E.B.; Effiom, S.O.; Ndukwu, M.C. A comparative performance analysis and thermo-economic sustainability indicators of modified low-heat organic Rankine cycles (ORCs): An exergy-based procedure. Energy Rep. 2018, 4, 110–118. [Google Scholar] [CrossRef]
  14. Midilli, A.; Kucuk, H.; Dincer, I. Environmental and sustainability aspects of a recirculating aquaculture system. Environ. Prog. Sustain. 2011, 31. [Google Scholar] [CrossRef]
  15. Vivian, J.; Manete, G.; Lazzaretto, A. A general framework to select working fluid and configuration of ORCs for low-to-medium temperature heat sources. Appl. Energy 2015, 156, 727–746. [Google Scholar] [CrossRef]
  16. Aungier, R.H. Turbine Aerodynamics; ASME Press: New York, NY, USA, 2006. [Google Scholar]
  17. World Energy Council. World Energy Resources; World Energy Council: London, UK, 2013; Available online: https://www.worldenergy.org/assets/images/imported/2013/09/Complete_WER_2013_Survey.pdf (accessed on 1 March 2020).
  18. Shengjun, Z.; Huaixin, W.; Tao, G. Performance comparison and parametric optimization of subcritical Organic Rankine Cycle (ORC) and transcritical power cycle system for low-temperature geothermal power generation. Appl. Energy 2011, 88, 2740–2754. [Google Scholar] [CrossRef]
  19. Quoilin, S.; Declaye, S.; Tchanche, B.F.; Lemort, V. Thermo-economic optimization of waste heat recovery Organic Rankine Cycles. Appl. Therm. Eng. 2011, 31, 2885–2893. [Google Scholar] [CrossRef] [Green Version]
  20. The MathWorks Inc. MATLAB version R2019a; The MathWorks Inc.: Natick, MA, USA, 2019. [Google Scholar]
  21. Lemmon, E.W.; Huber, M.L.; McLinden, M.O. NIST Standard Reference Database 23: Reference Fluid Thermodynamic and Transport Properties-REFPROP, Version 9.1; National Institute of Standards and Technology: Gaithersburg, MD, USA, 2013. [Google Scholar]
  22. Deb, K.; Pratap, A.; Agarwal, S.; Meyarivan, T. A Fast and Elitist Multiobjective Genetic Algorithm: NSGA-II. IEEE Trans. Evol. Comput. 2002, 6, 182–197. [Google Scholar] [CrossRef] [Green Version]
  23. Whitfield, A.; Baines, N.C. Design of Radial Turbomachines; Longman Scientific & Technical: New York, NY, USA, 1990. [Google Scholar]
  24. Bekiloğlu, H.E.; Bedir, H.; Anlaş, G. Multi-objective optimization of ORC parameters and selection of working fluid using preliminary radial inflow turbine design. Energy Convers. Manag. 2019, 183, 833–847. [Google Scholar] [CrossRef]
  25. Bahadormanesh, N.; Rahat, S.; Yarali, M. Constrained multi-objective optimization of radial expanders in organic Rankine cycles by firefly algorithm. Energy Convers. Manag. 2017, 148, 1179–1193. [Google Scholar] [CrossRef]
  26. Jankowski, M.; Borsukiewicz, A. Multi-objective approach for determination of optimal operating parameters in low-temperature ORC power plant. Energy Convers. Manag. 2019, 200, 112075. [Google Scholar] [CrossRef]
  27. Zhang, C.; Liu, C.; Wang, S.; Xu, X.; Li, Q. Thermo-economic comparison of subcritical organic Rankine cycle based on different heat exchanger configurations. Energy 2017, 123, 728–741. [Google Scholar] [CrossRef]
  28. Turton, R.; Bailie, R.C.; Whiting, W.B.; Shaeiwitz, J.A. Analysis, Synthesis and Design of Chemical Processes; Pearson Education: London, UK, 2009; ISBN 0–13-512966-4. [Google Scholar]
  29. Li, T.; Meng, N.; Liu, J.; Zhu, J.; Kong, X. Thermodynamic and economic evaluation of the organic Rankine cycle (ORC) and two-stage series organic Rankine cycle (TSORC) for flue gas heat recovery. Energy Convers. Manag. 2019, 183, 816–829. [Google Scholar] [CrossRef]
  30. Liu, C.; Gao, T. Off-design performance analysis of basic ORC, ORC using zeotropic mixtures and composition-adjustable ORC under optimal control strategy. Energy 2019, 171, 96–108. [Google Scholar] [CrossRef]
  31. Da Lio, L.; Manete, G.; Lazzaretto, A. A Mean-line model to predict the design efficiency of radial inflow turbines in organic Rankine cycle (ORC) systems. Appl. Energy 2017, 205, 187–209. [Google Scholar] [CrossRef]
  32. Cui, Y.; Geng, Z.; Zhu, Q.; Han, Y. Review: Multi-objective optimization methods and application in energy saving. Energy 2017, 125, 681–704. [Google Scholar] [CrossRef]
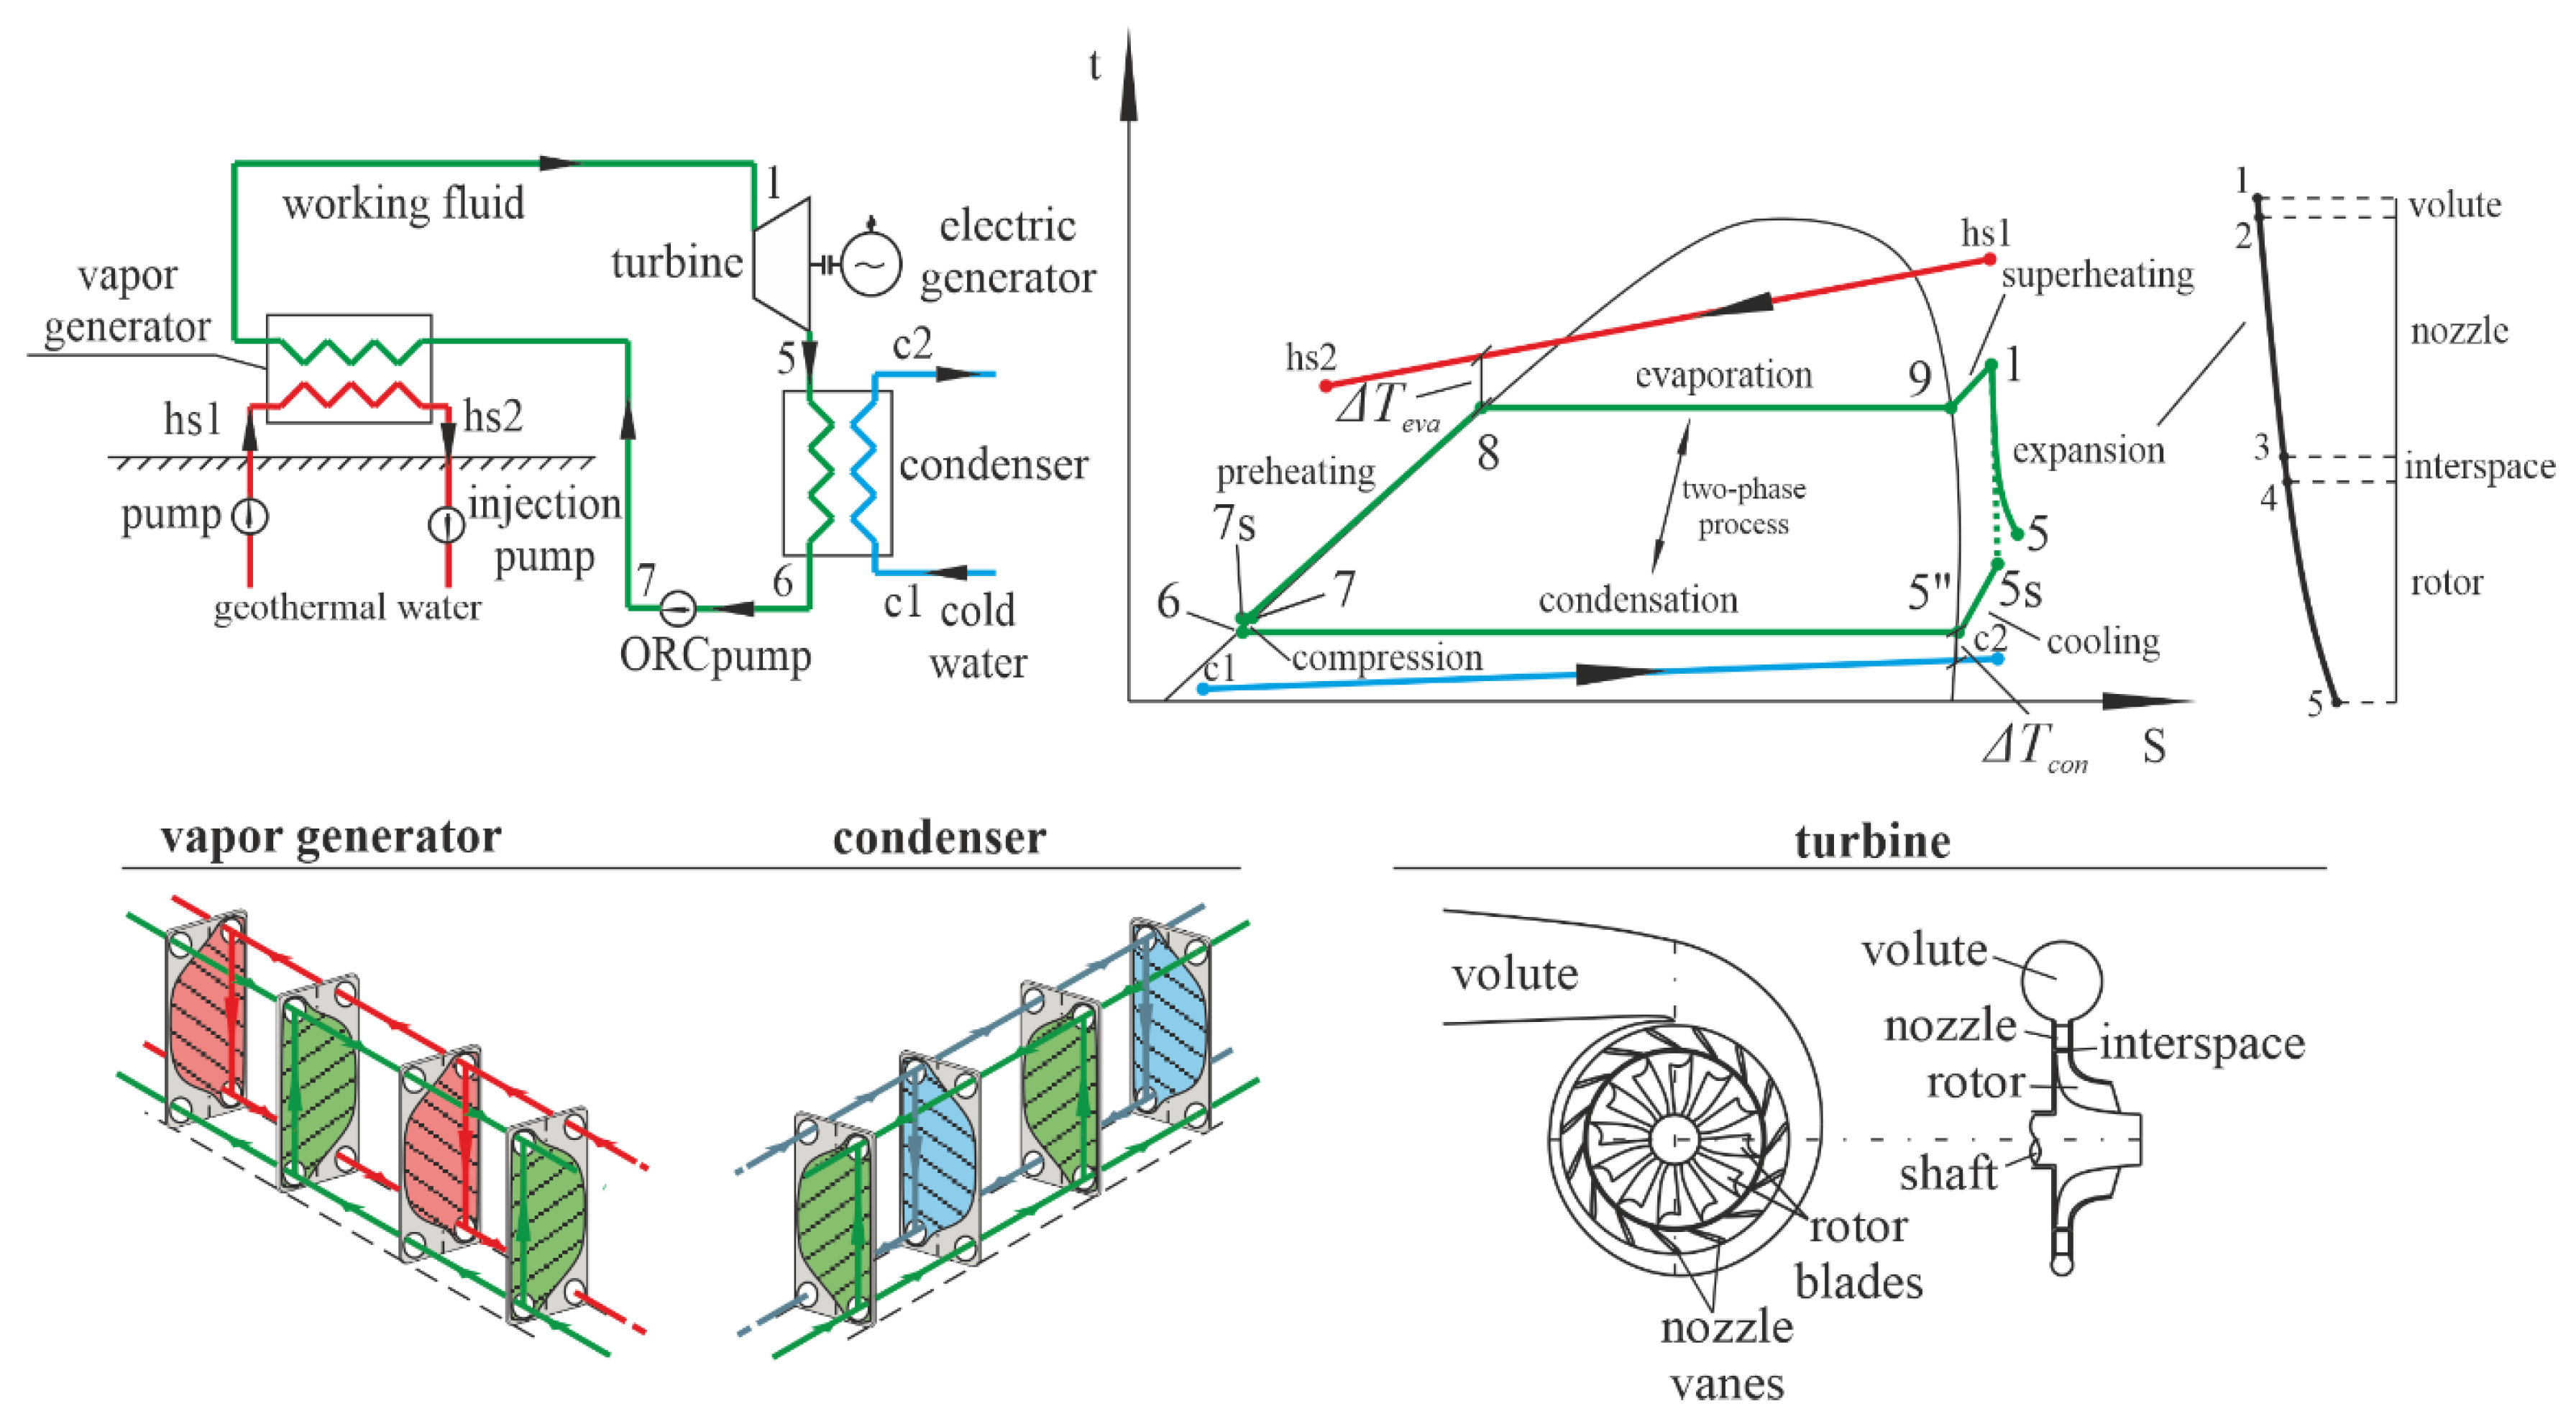
Figure 1. ORC system and modelling assumptions.
Energies 13 01598 g001
Figure 2. Flowchart of calculation procedure.
Energies 13 01598 g002
Figure 3. XUI and temperature ths2 of the heat carrier at the outlet of vapor generator as functions of evaporation temperature teva.
Energies 13 01598 g003
Figure 4. XUI and exergy flux B ˙ h s 2 of the heat carrier at the outlet of vapor generator as functions of evaporation temperature teva.
Energies 13 01598 g004
Figure 5. XUI and net power output Pout as functions of evaporation temperature teva.
Energies 13 01598 g005
Figure 6. XUI and exergy efficiency ηex as functions of evaporation temperature teva.
Energies 13 01598 g006
Figure 7. XUI and exergy-related indicators as functions of evaporation temperature teva.
Energies 13 01598 g007
Figure 8. XUI and SI index as functions of evaporation temperature teva.
Energies 13 01598 g008
Figure 9. XUI and effectiveness index ε as functions of evaporation temperature teva.
Energies 13 01598 g009
Figure 10. XUI and payback period PBP as functions of evaporation temperature teva.
Energies 13 01598 g010
Figure 11. Pareto frontier.
Energies 13 01598 g011
Table 1. Parameters and variables of ORC.
NoteParameterUnitValue
constant value V ˙ h s [m3 h−1]30.0
ths1[°C]120
fluid[-]R1234ze
ΔTsup[K]5.00
ΔTcon[K]5.00
tc1[°C]15.0
ηP[-]0.75
ΔTeva[K]5.00
Tr[K]288.15
decision variablesteva[°C]60.0 ÷ 100
tcon[°C]25.0 ÷ 40.0
ns[-]0.40 ÷ 0.70
initial guessηT[-]0.75
Table 2. Coefficients for determining costs of system components.
ComponentK1K2K3B1B2FmC1C2C3FBM
Vapor generator and condenser4.6656−0.15570.15470.961.212.40000-
Turbine2.62591.4398−0.1776------3.50
Pump3.38920.05360.15381.891.351.60−0.39350.3957-0.00226-
Table 3. Verification of proposed model.
RIT Rotor GeometryFluid: R245fa, wf = 20 kgs−1, teva = 110 °C, tcon = 33 °C, ns = 0.45
UnitDescriptionPresent studyDa Lio et al. [31]Percentage Error [%]
r4[m]radius at the rotor inlet0.1950.1940.51
r5,sh[m]shroud radius at the rotor outlet0.1270.1334.51
r5,hub[m]hub radius at the rotor outlet0.0580.0547.41
b4[m]blade width at the rotor inlet0.0140.0156.67
b5[m]blade width at the rotor outlet0.0690.07912.7
total-to-static turbine efficiency
ηT[%]turbine efficiency80.486.97.48
Table 4. Results of the multi-objective optimization.
Type of Quantity Symbol UnitMin AtotSelected Optimal PointMax XUI
decision variablesteva[°C]10094.476.2
tcon[°C]37.725.131.1
ns[-]0.530.550.55
objective functionsXUI[%]47.660.175.9
Atot[m2]117146176
ORC parameterswf[kg s−1]6.057.2910.6
ηT[-]0.830.820.83
ths2[°C]86.676.060.0
hs2[kW]294224135
Pout[kW]113170177
exergy-based indicatorsηex[%]20.230.431.6
WER[%]79.869.668.4
EEF[-]3.942.282.17
ESI[-]0.250.440.46
δḂtot[kW]116144203
SI[-]0.440.430.48
energy-based indicatorε[%]31.841.957.1
economic indicatorPBP[years]17.010.911.2