Repowering Steel Tubular Wind Turbine Towers Enhancing them by Internal Stiffening Rings


Abstract
:
1. Introduction
2. On the Numerical Modeling
3. Repowering of Wind Turbine Towers
3.1. Description of the Wind Turbine Tower Models
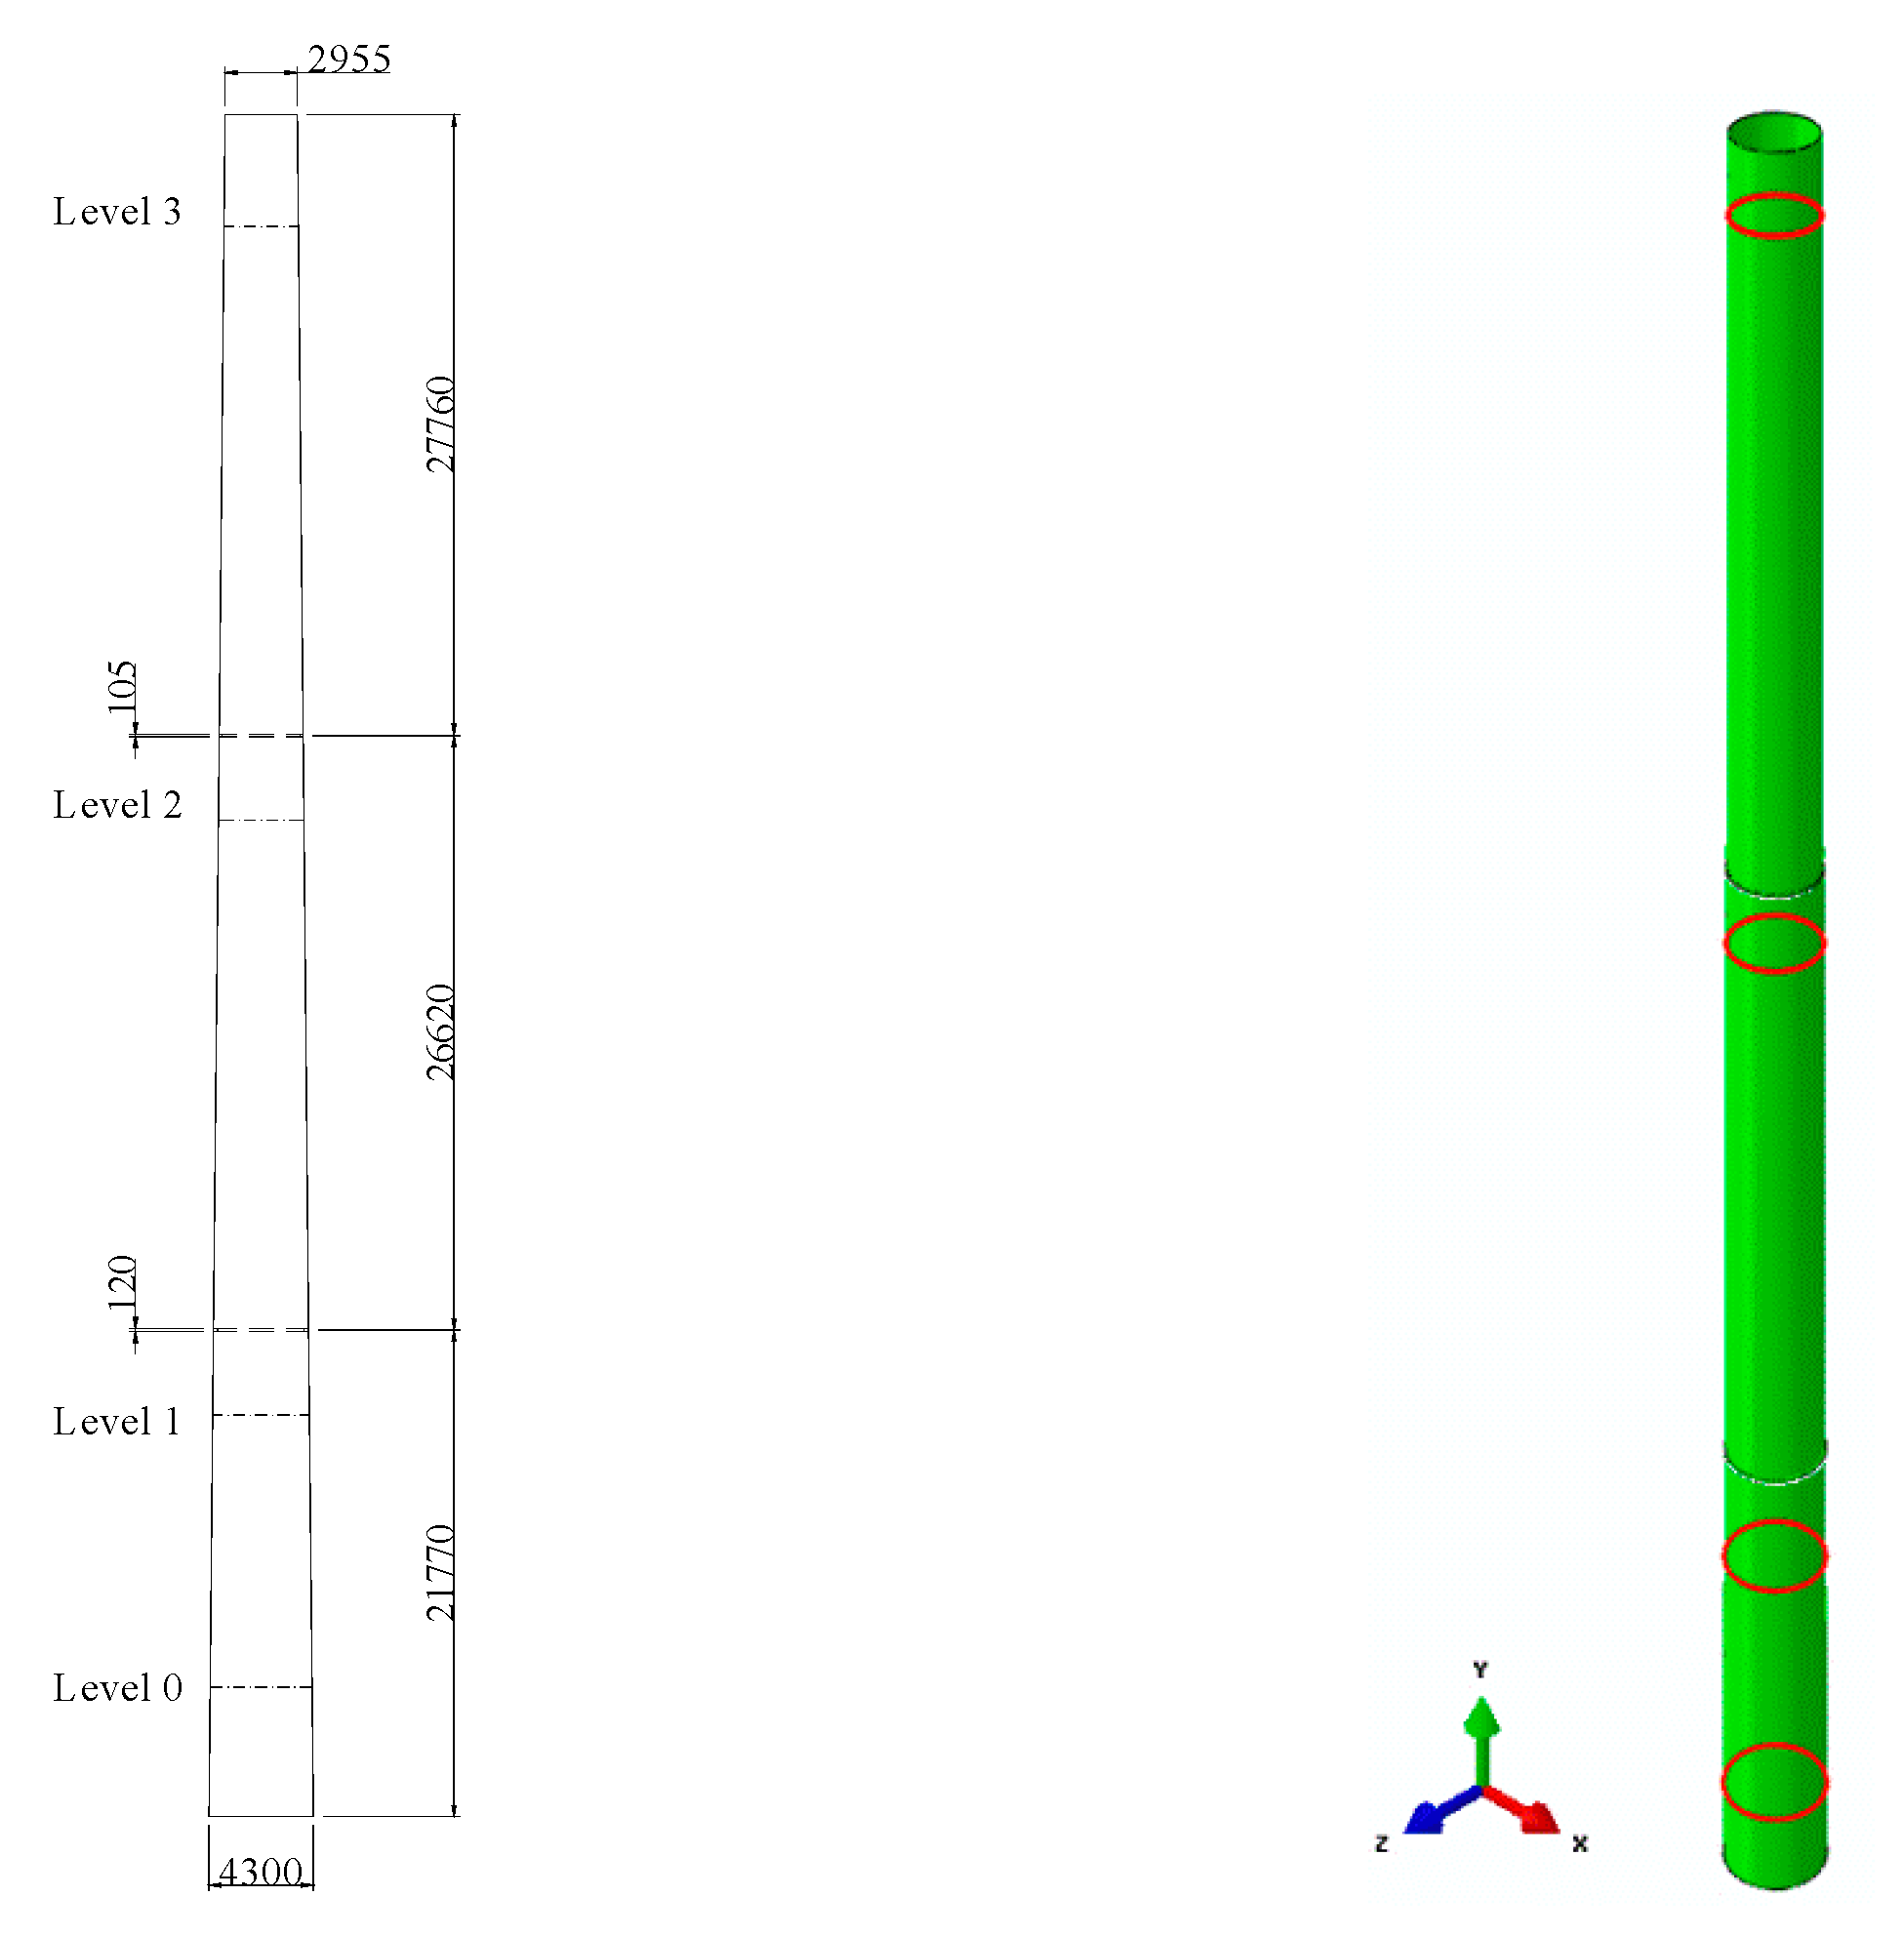
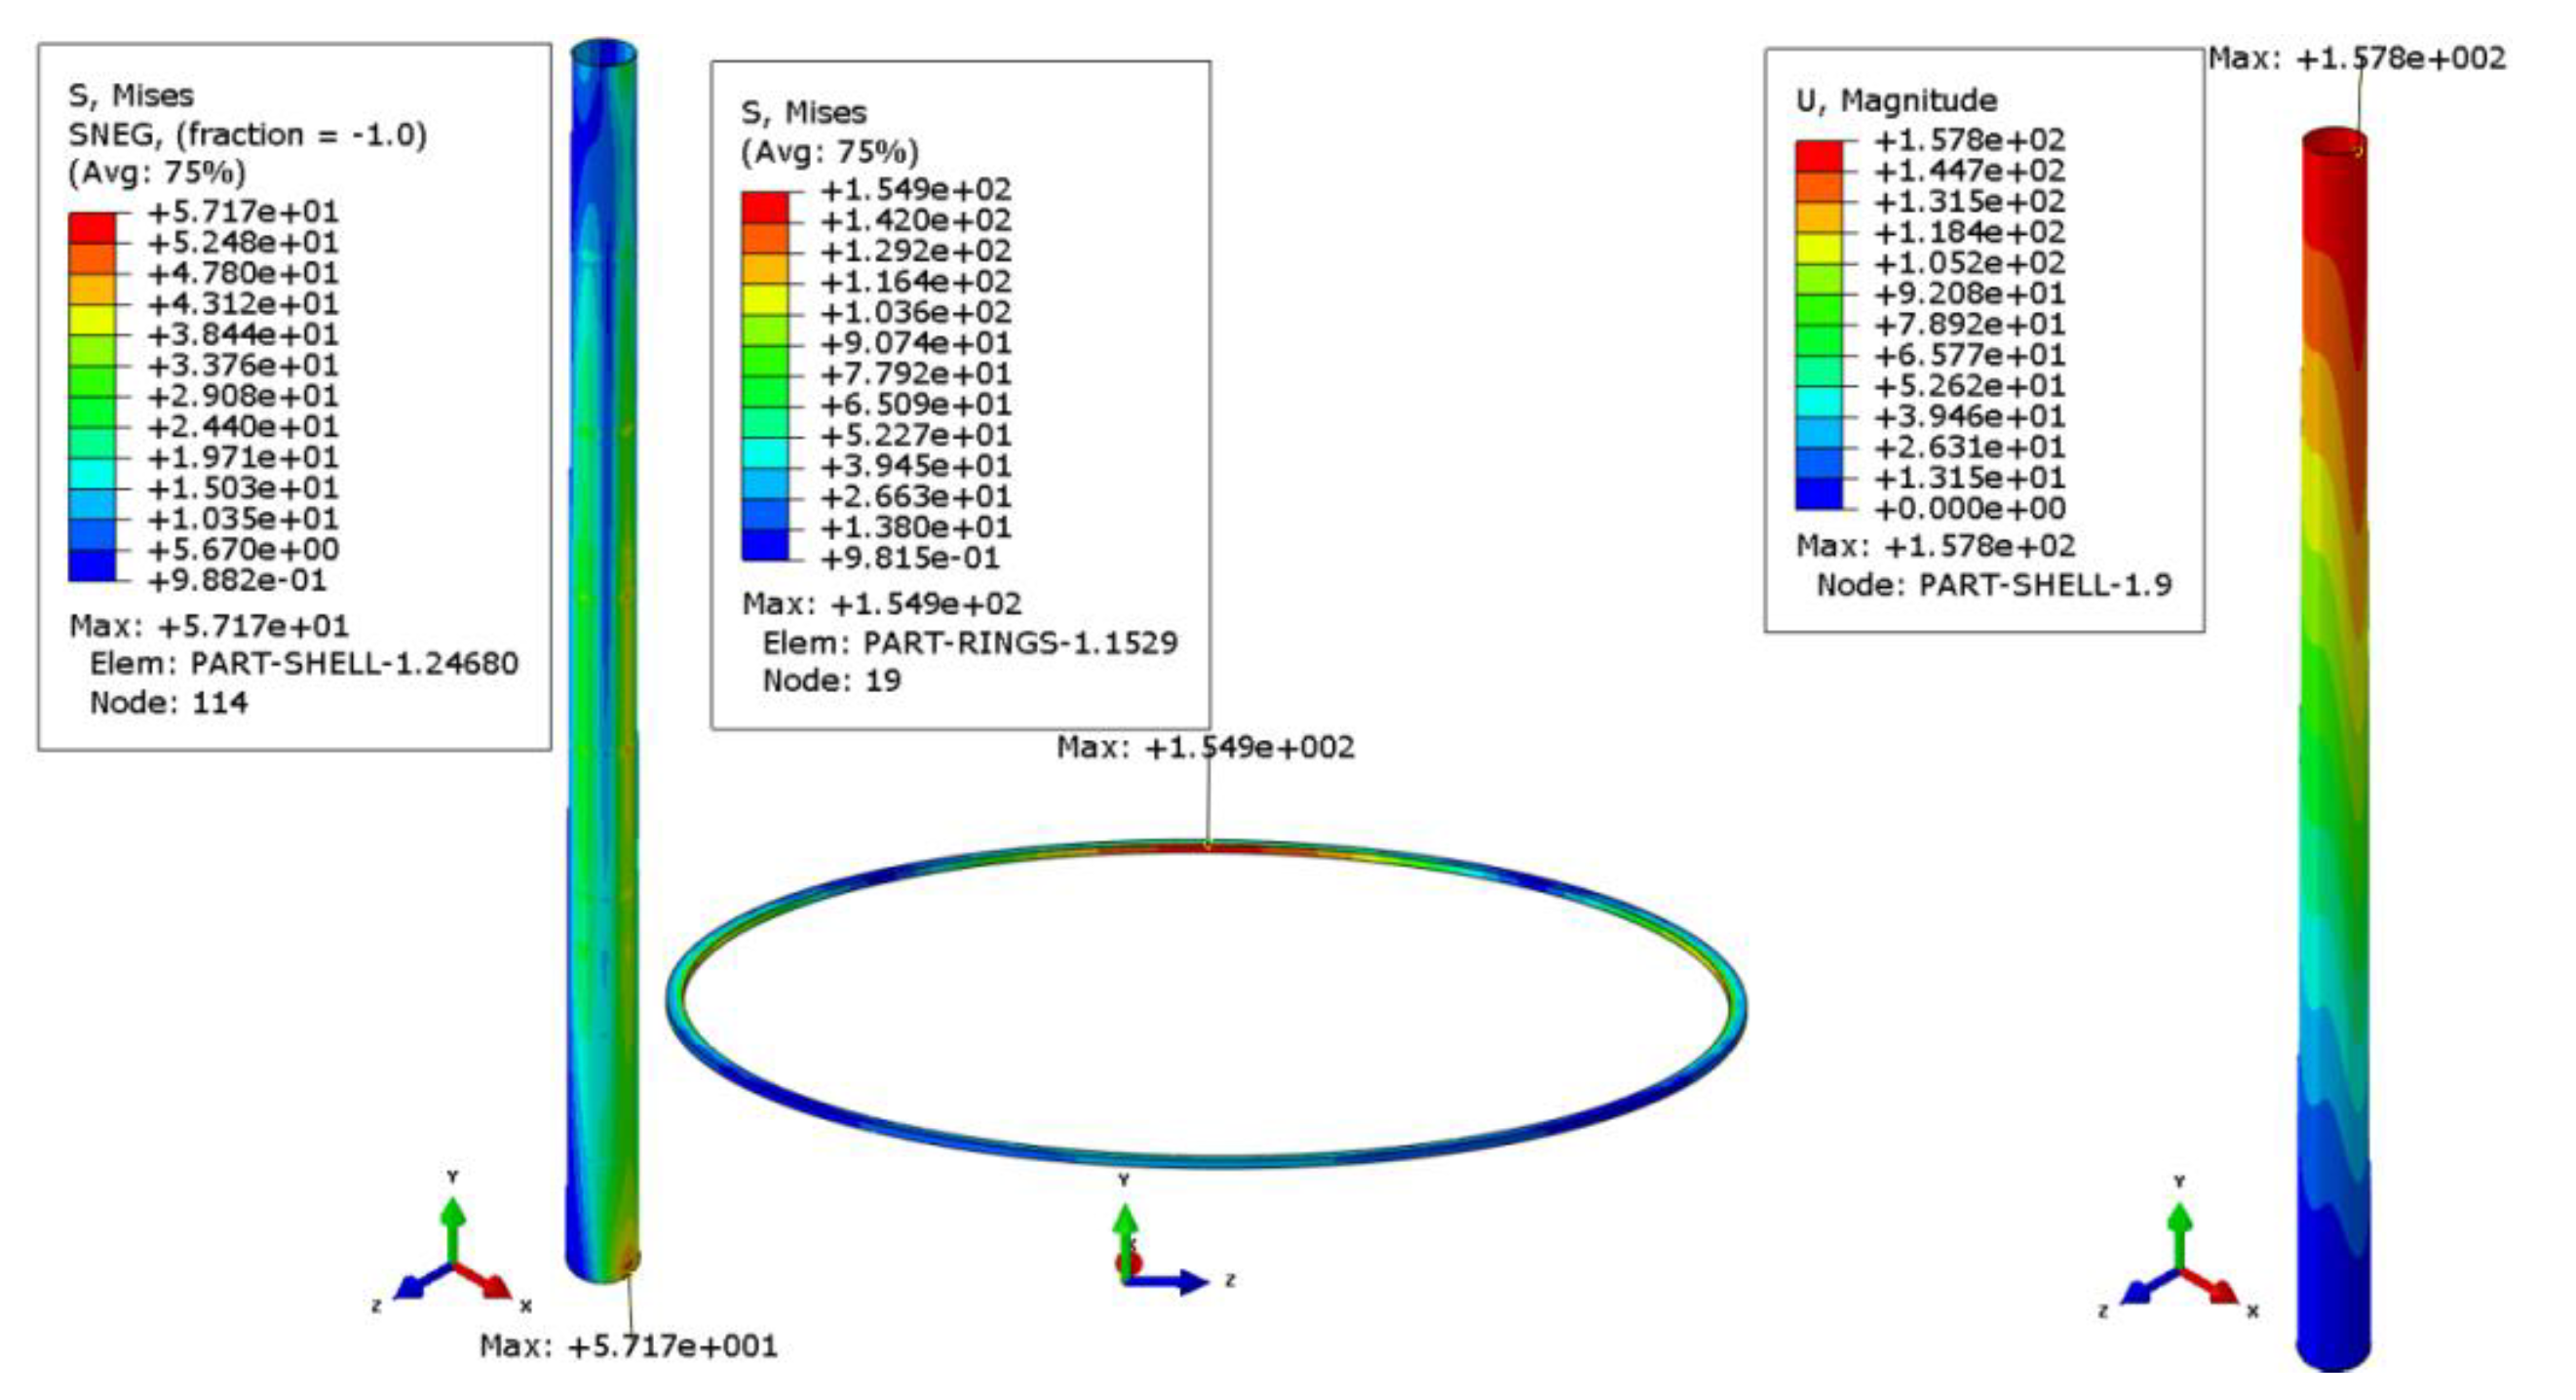
3.1.1. The 50 m tower models
3.1.2. The 150 m-Tower Models
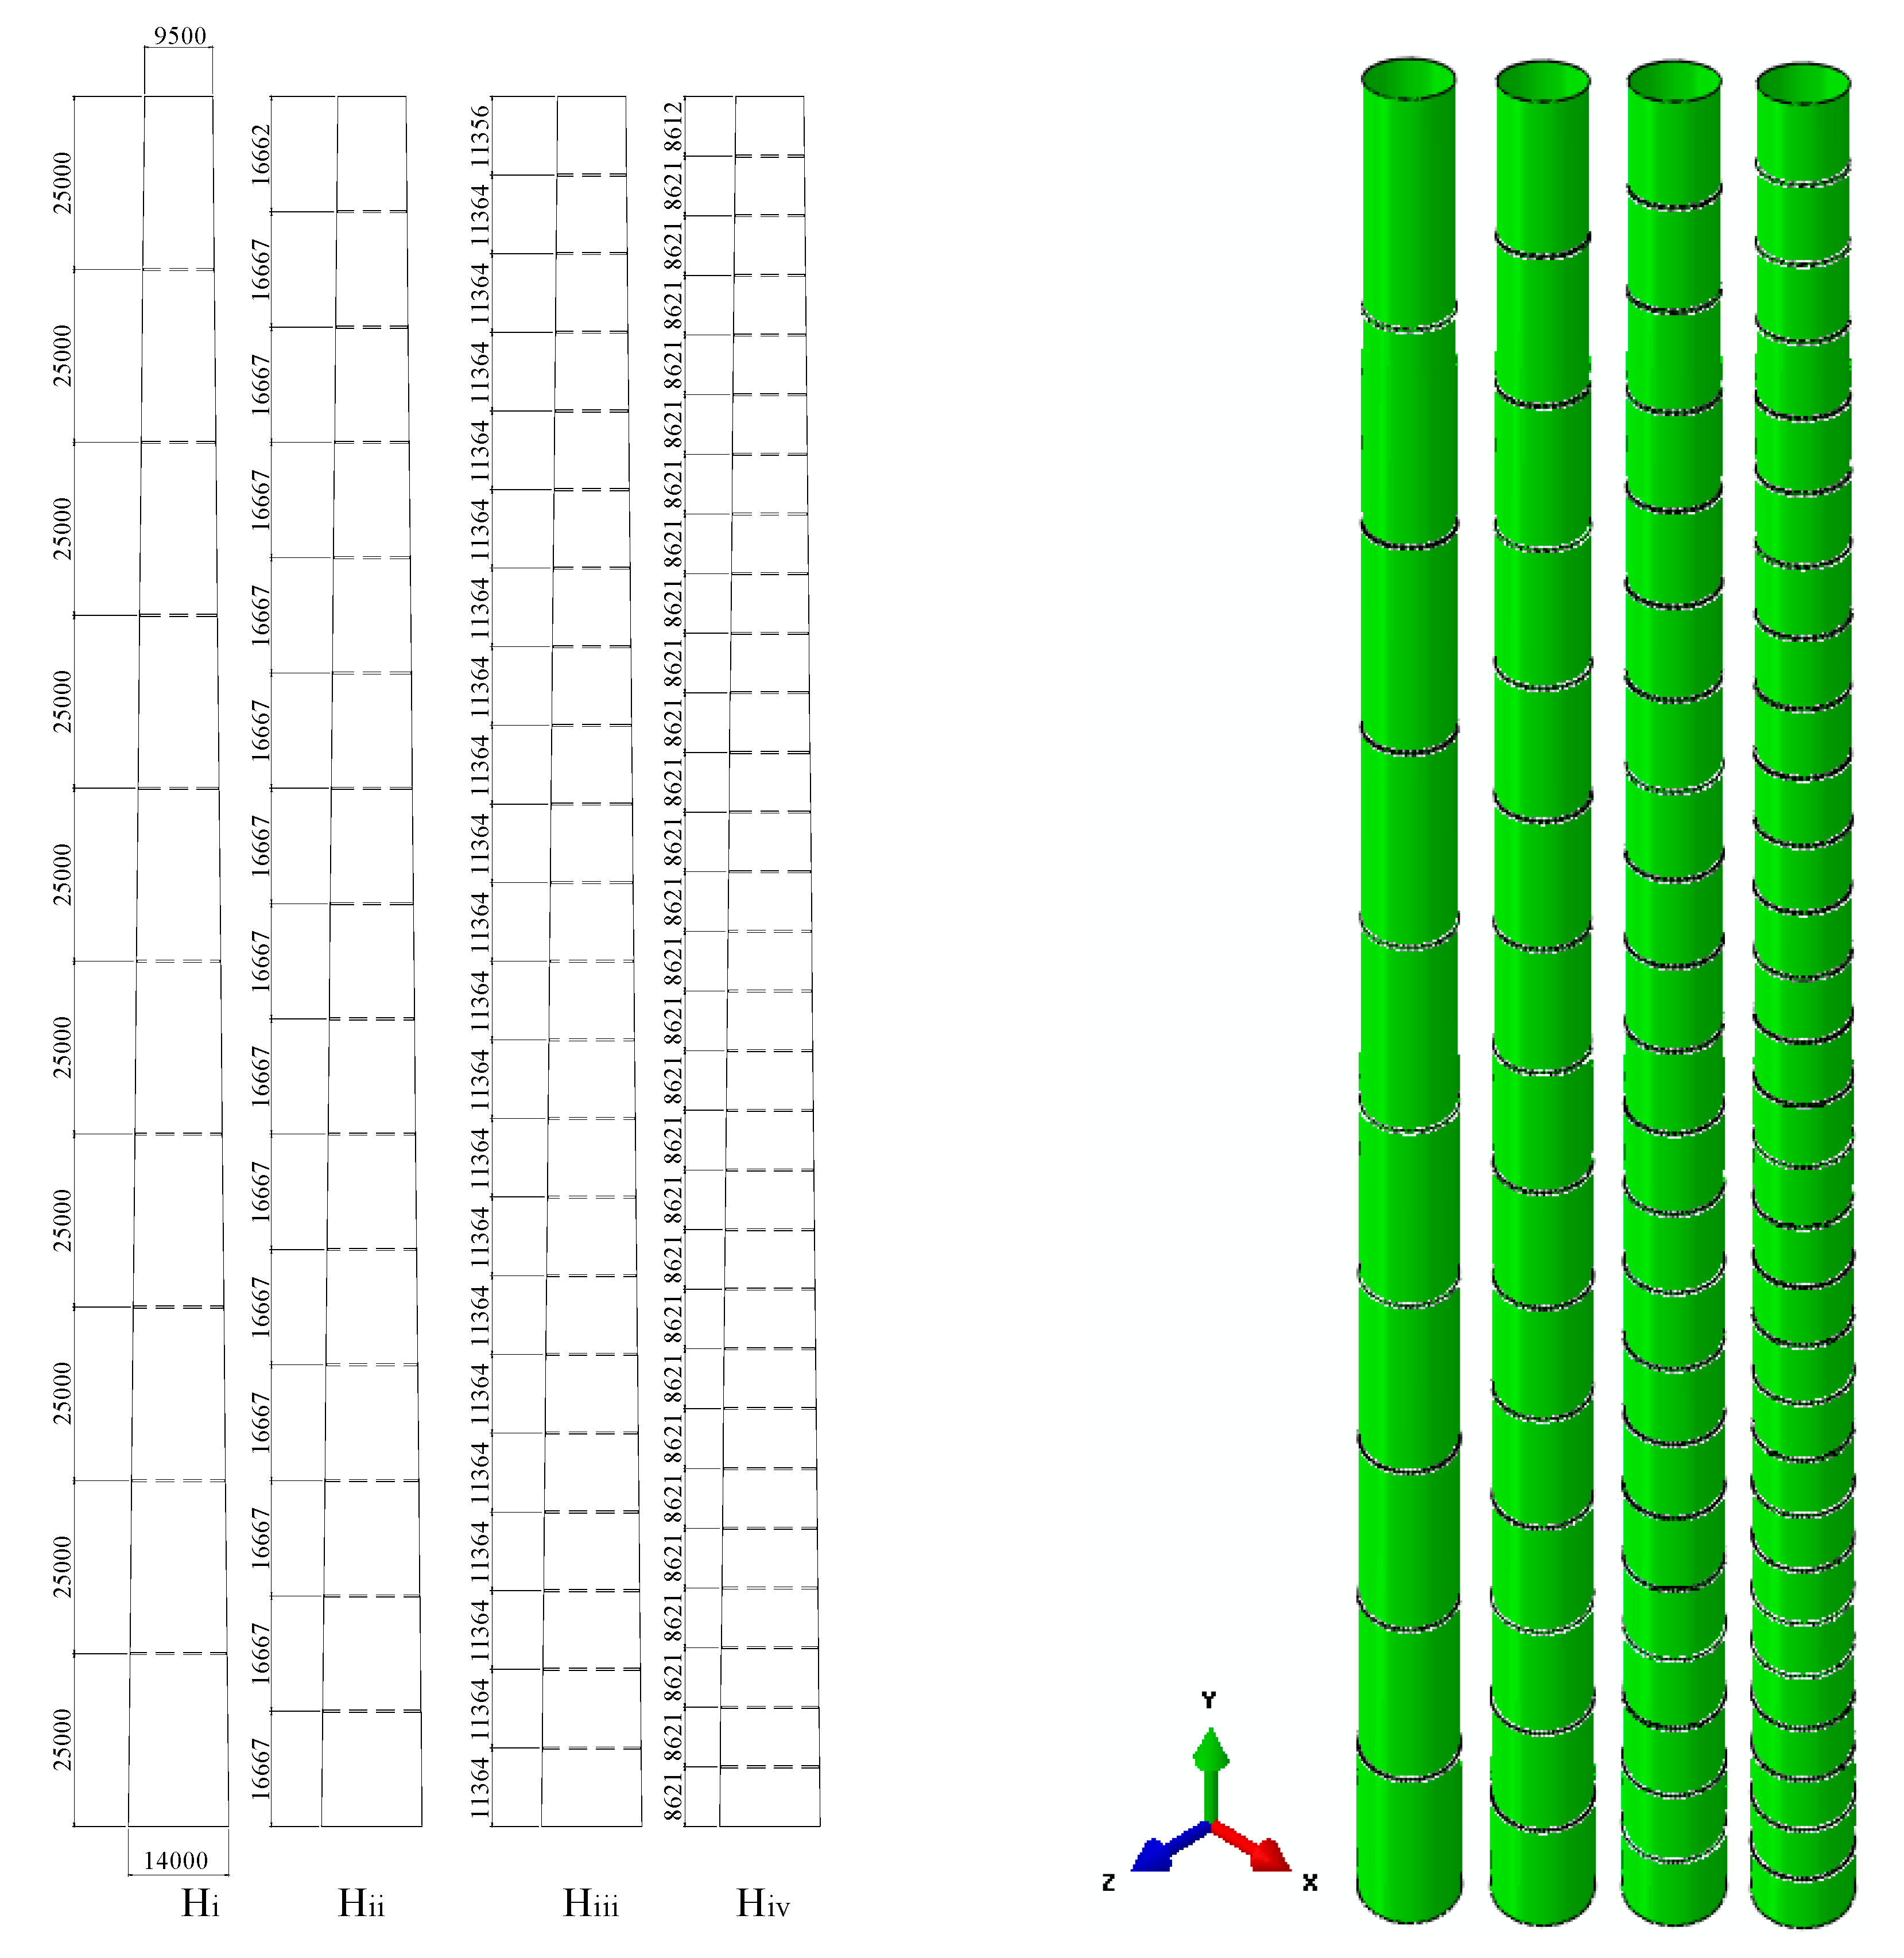
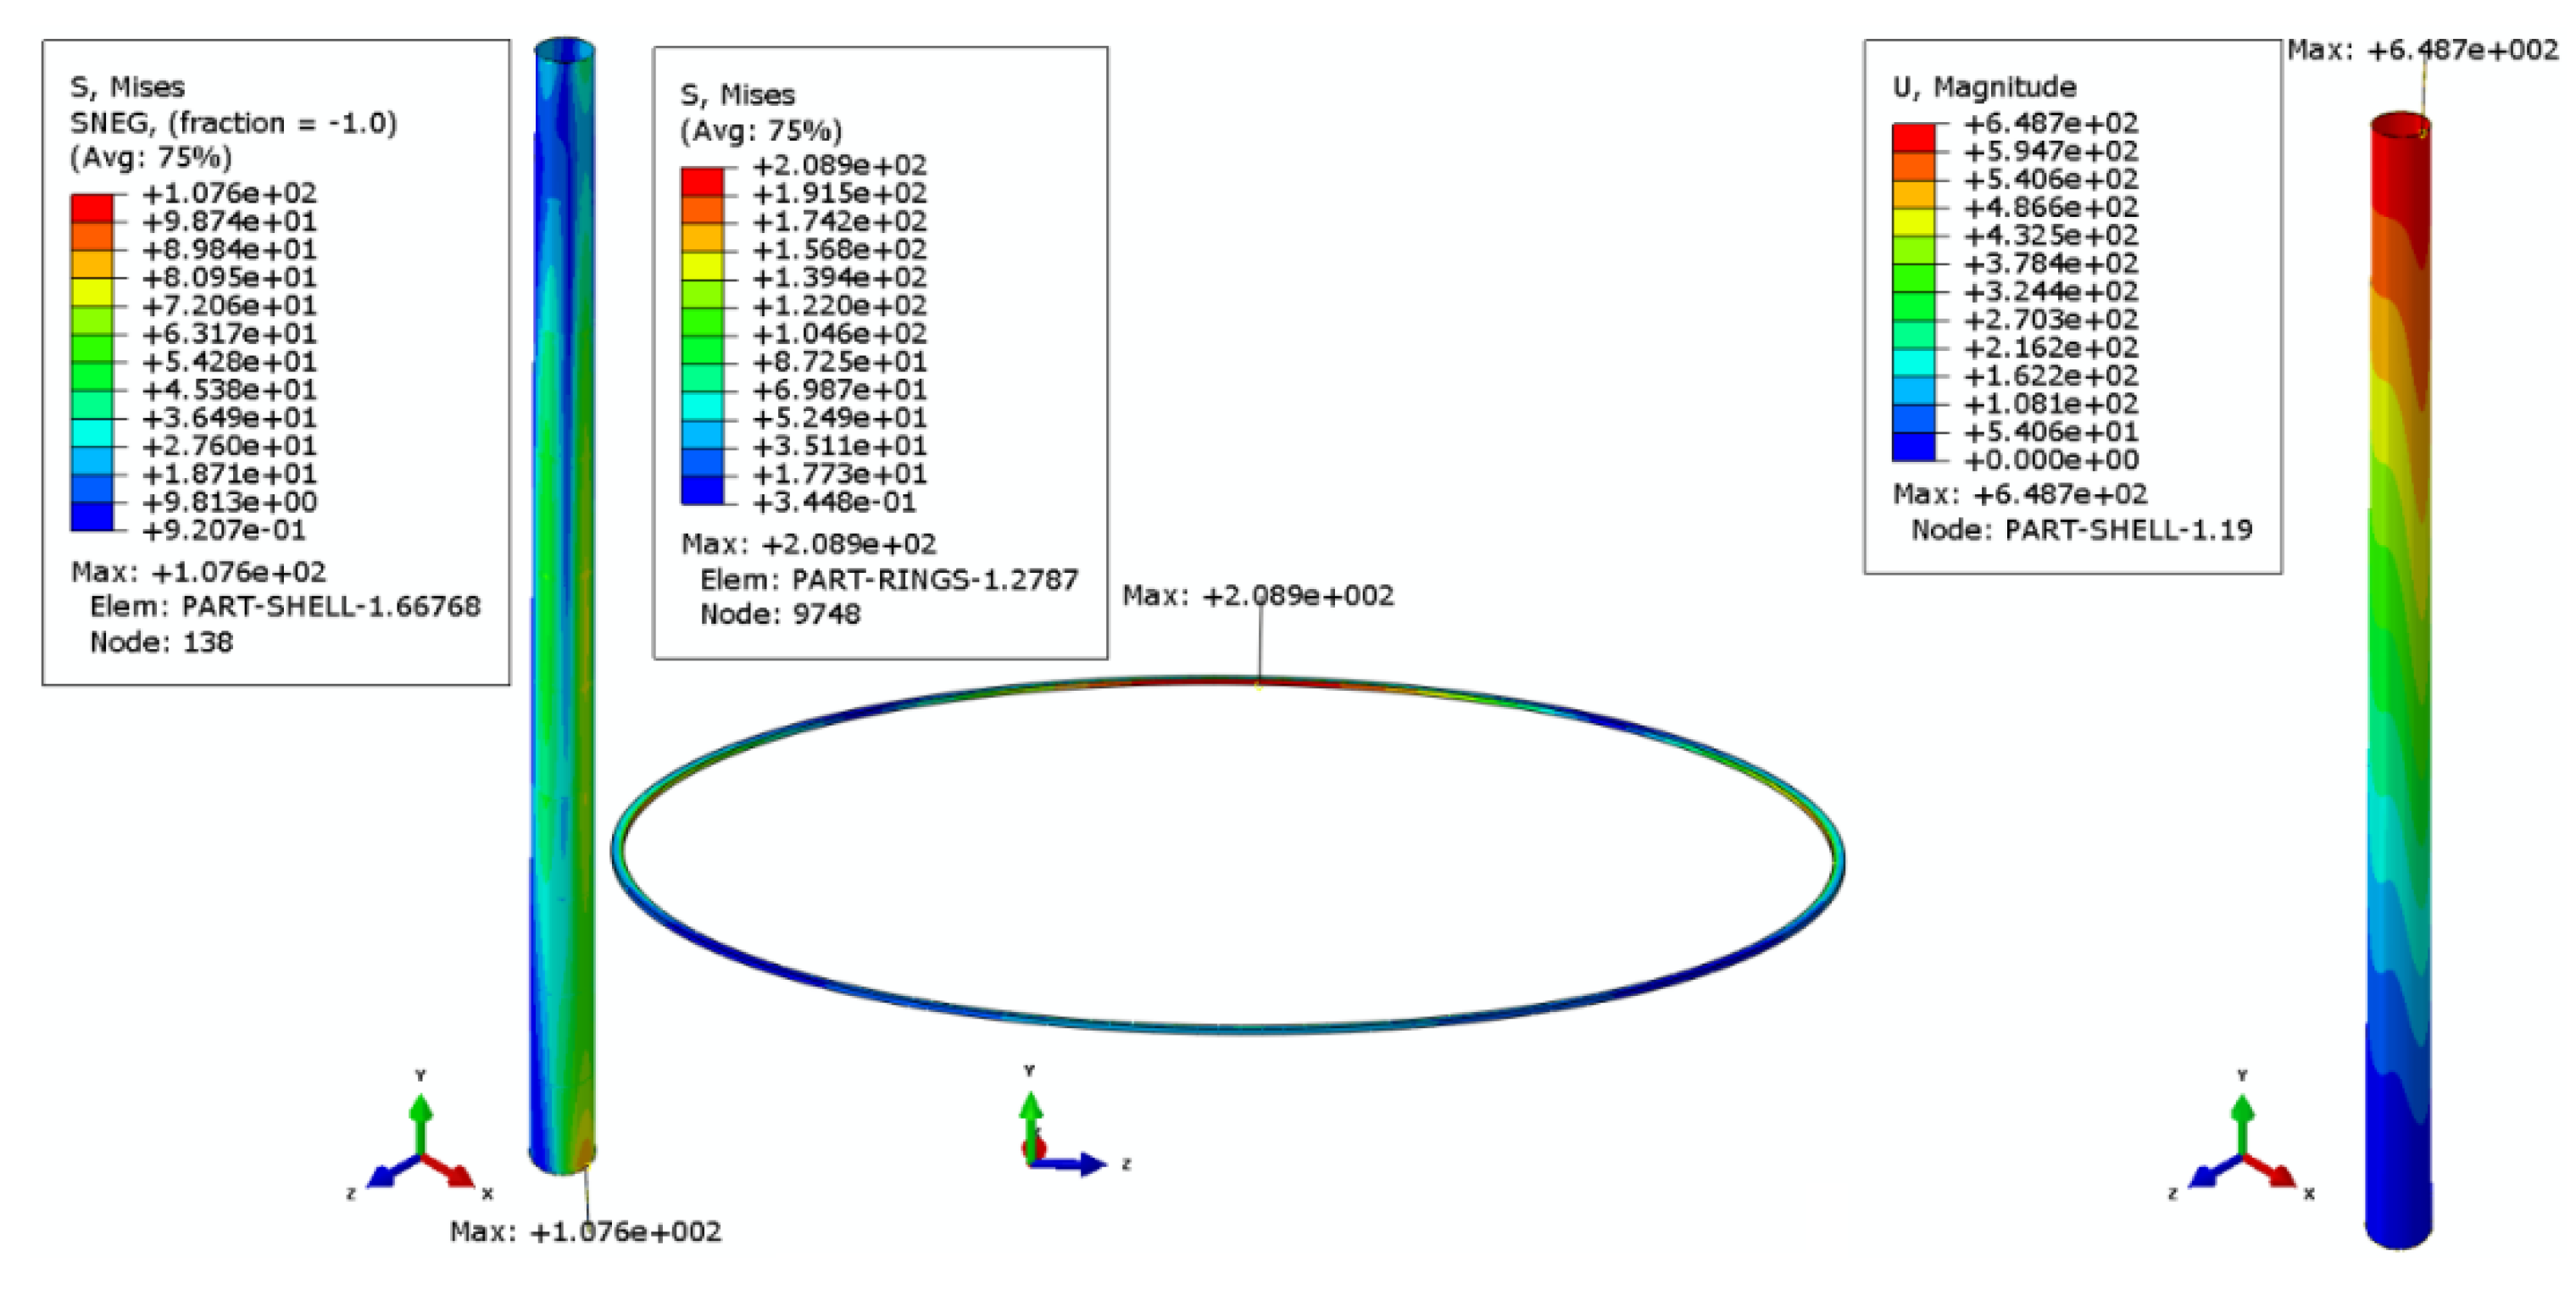
3.1.3. The 250 m-Tower Models
3.2. Efficiency Repowering Range of Design Variables for Repowering
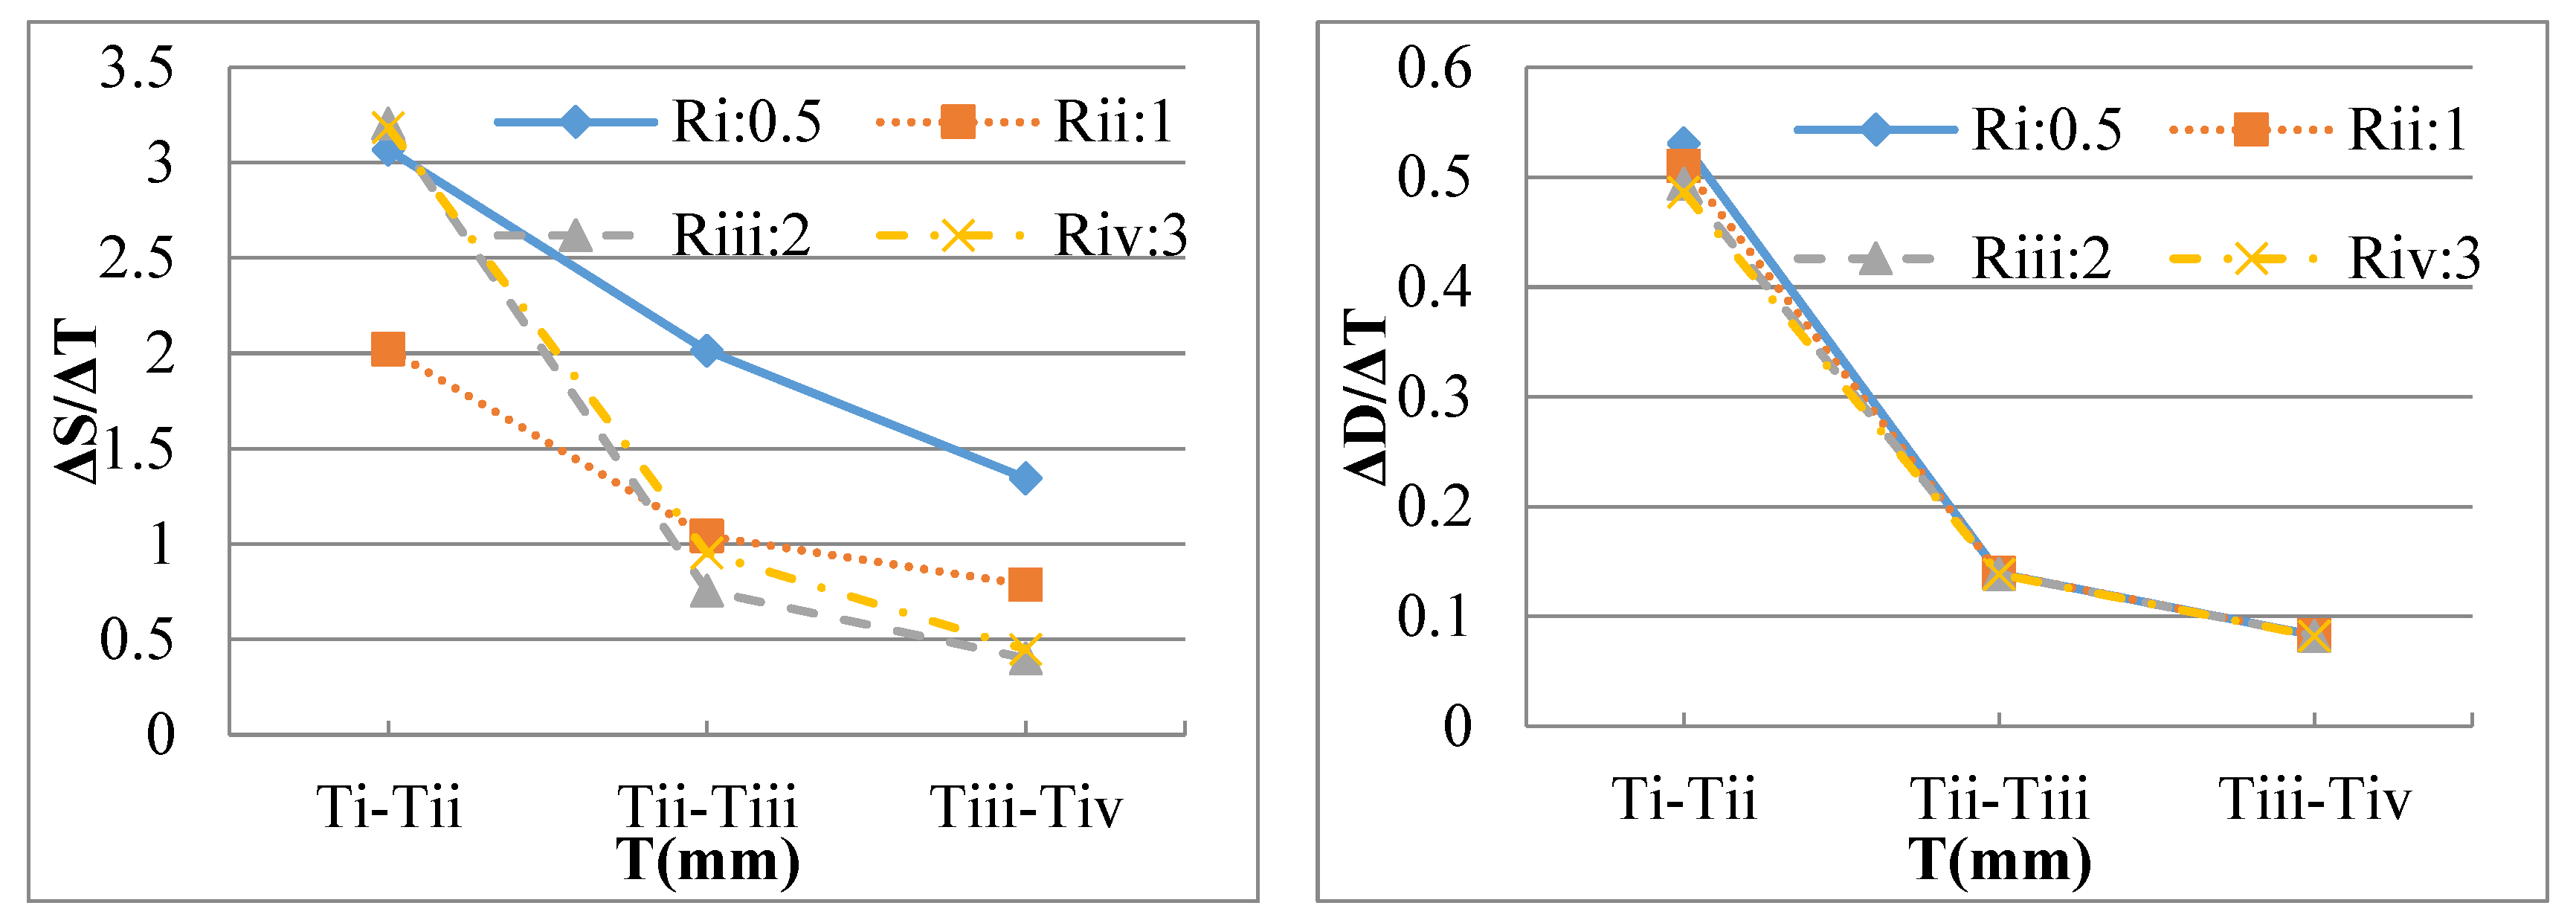
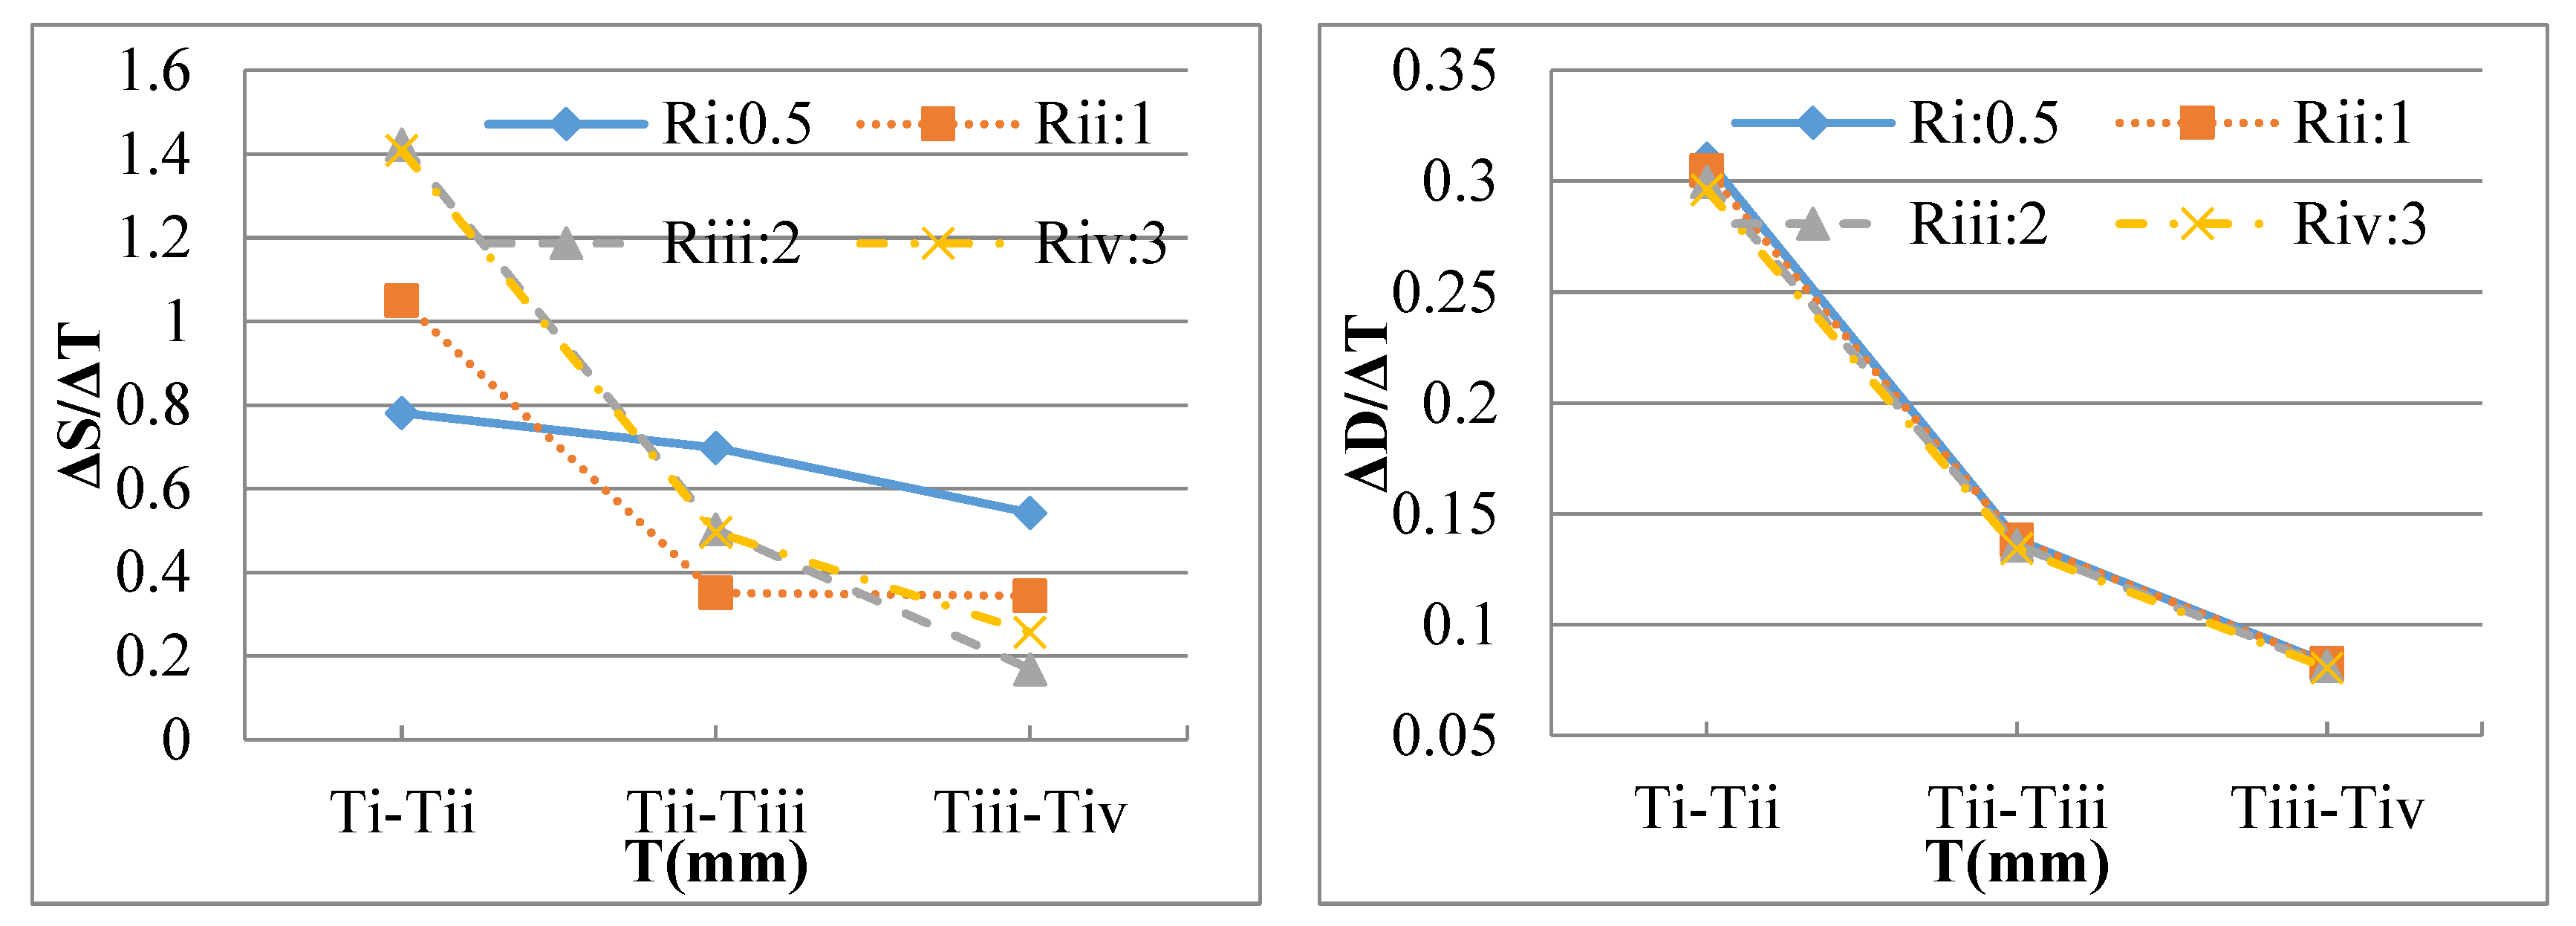
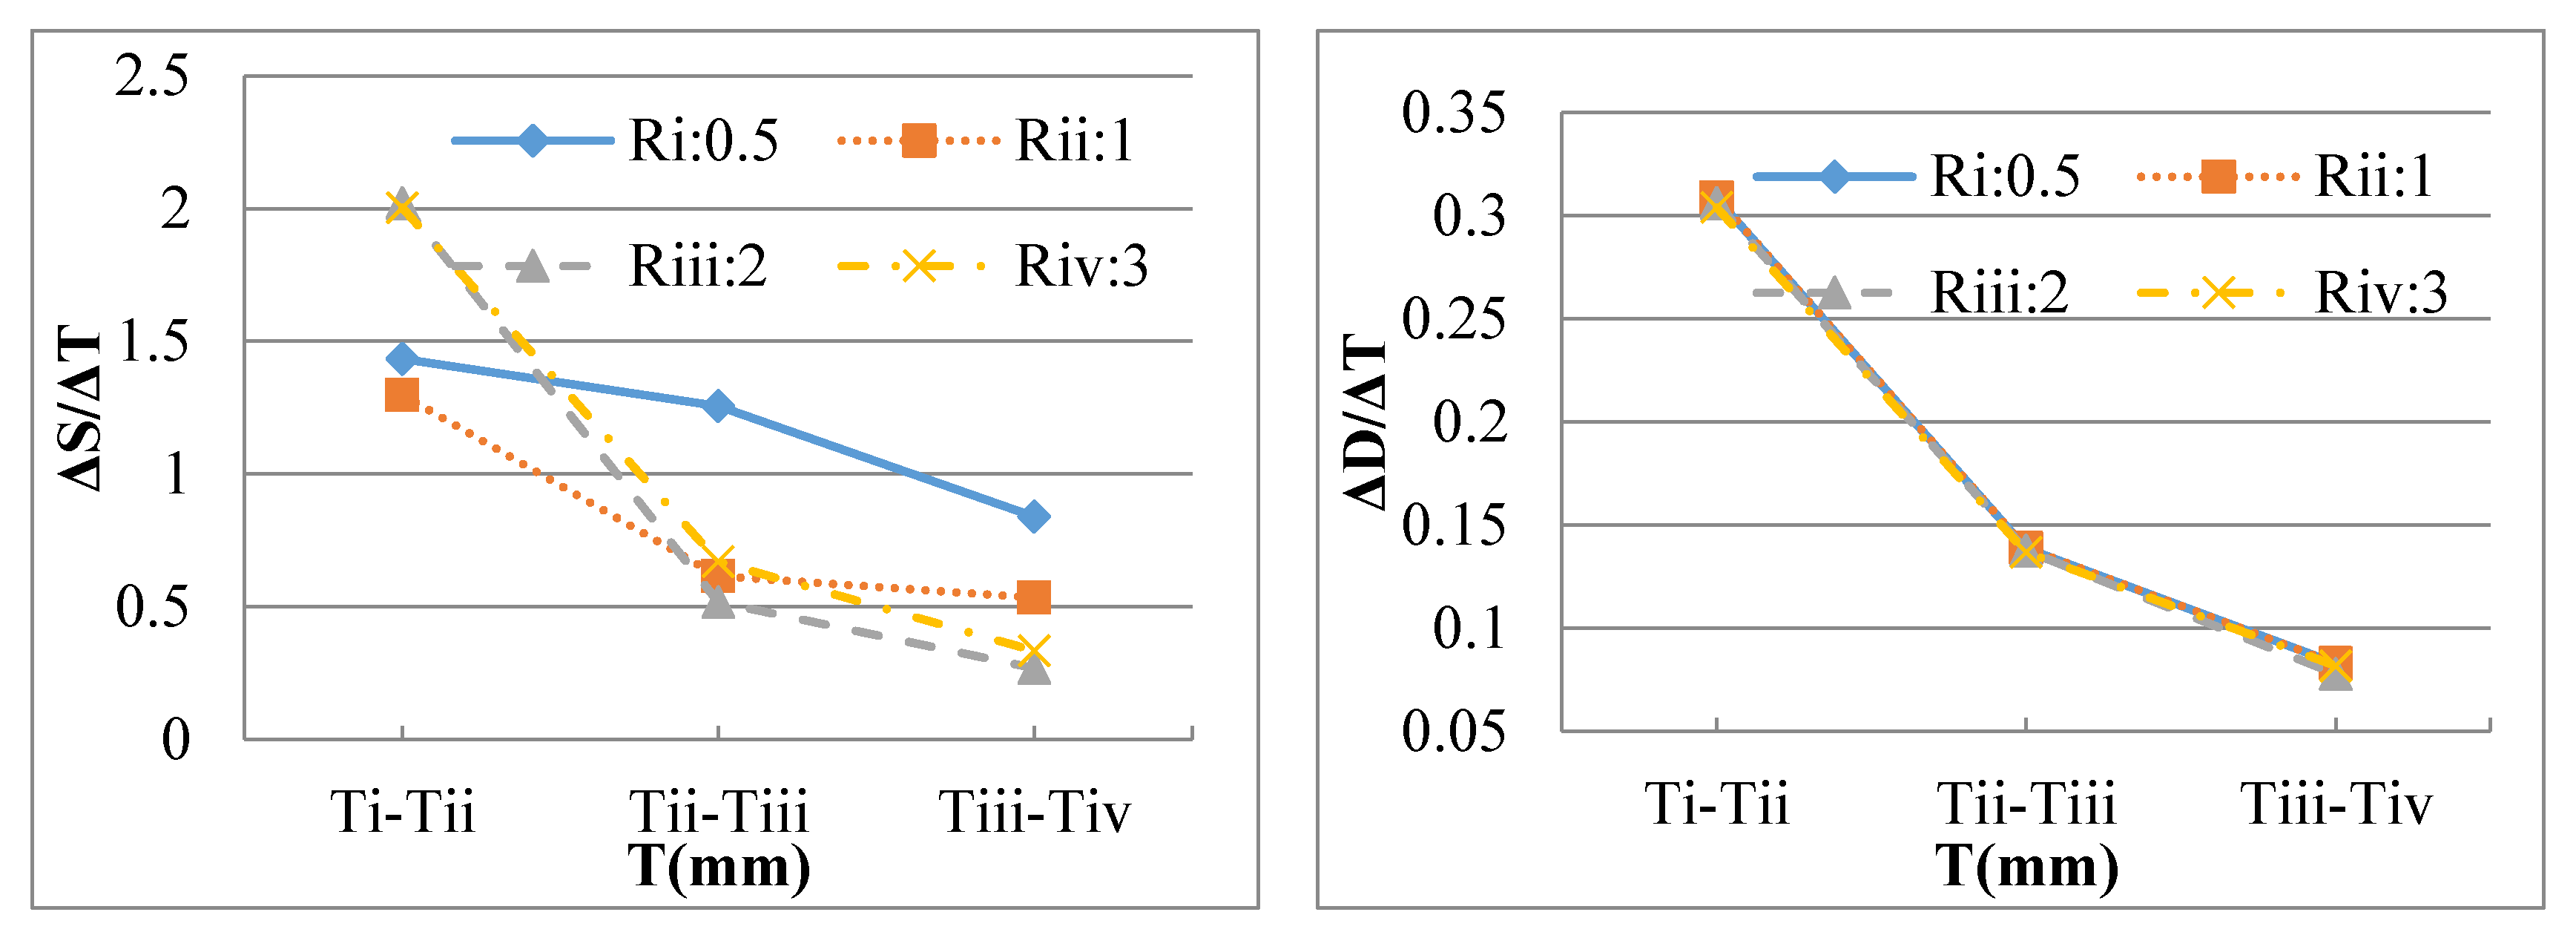
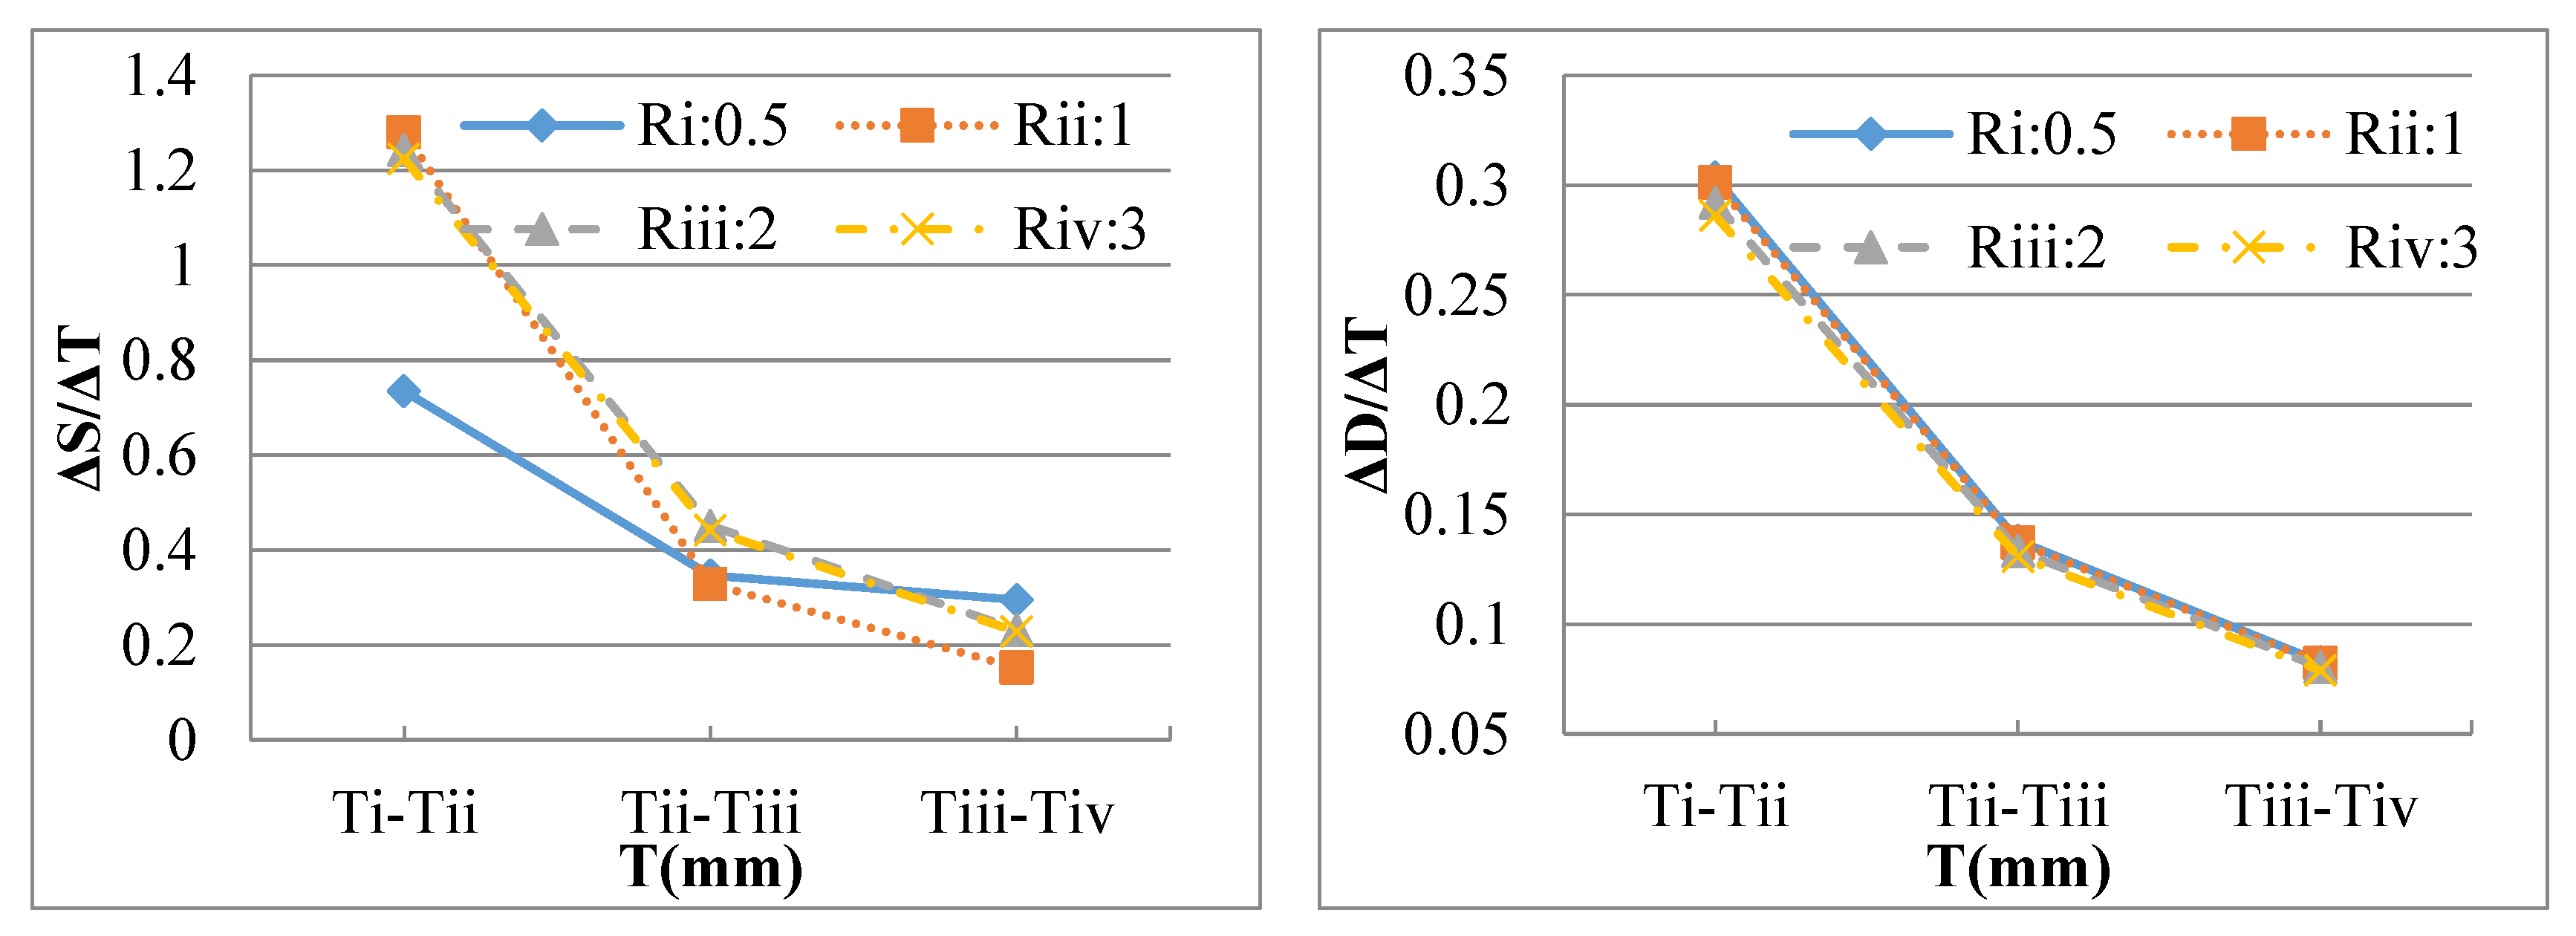
3.2.1. Efficiency Repowering Range of the Thickness T
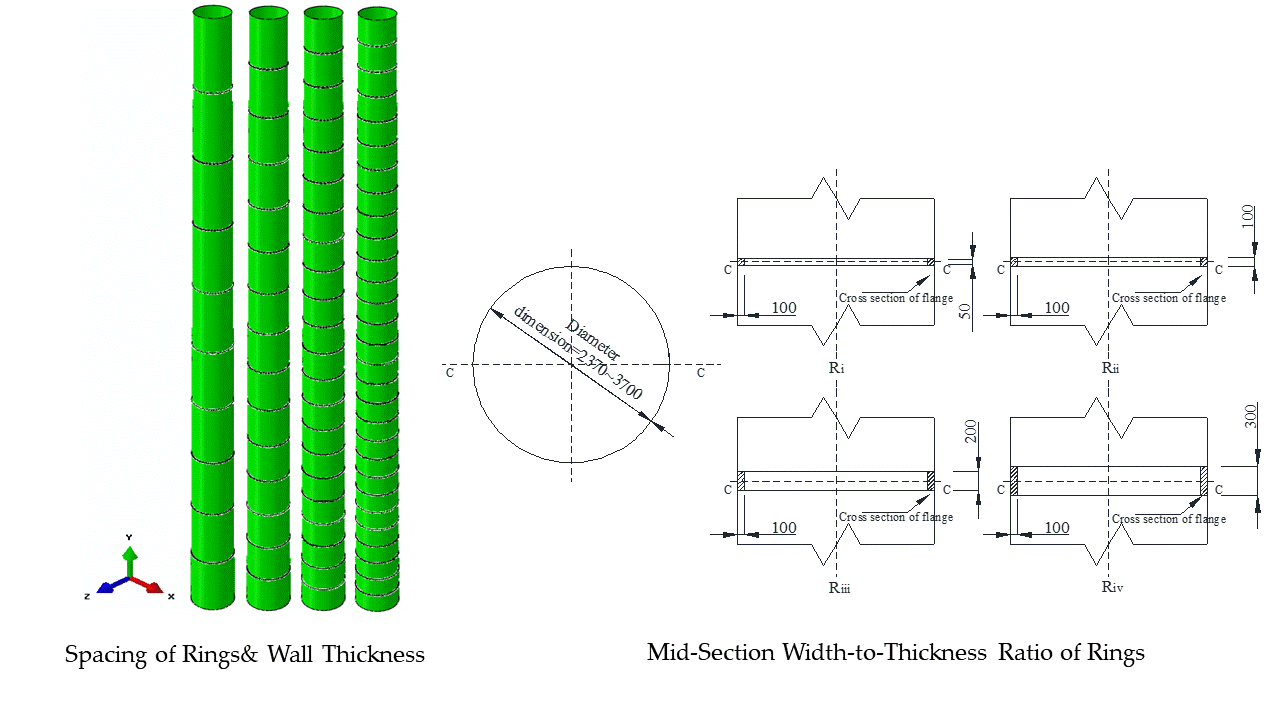
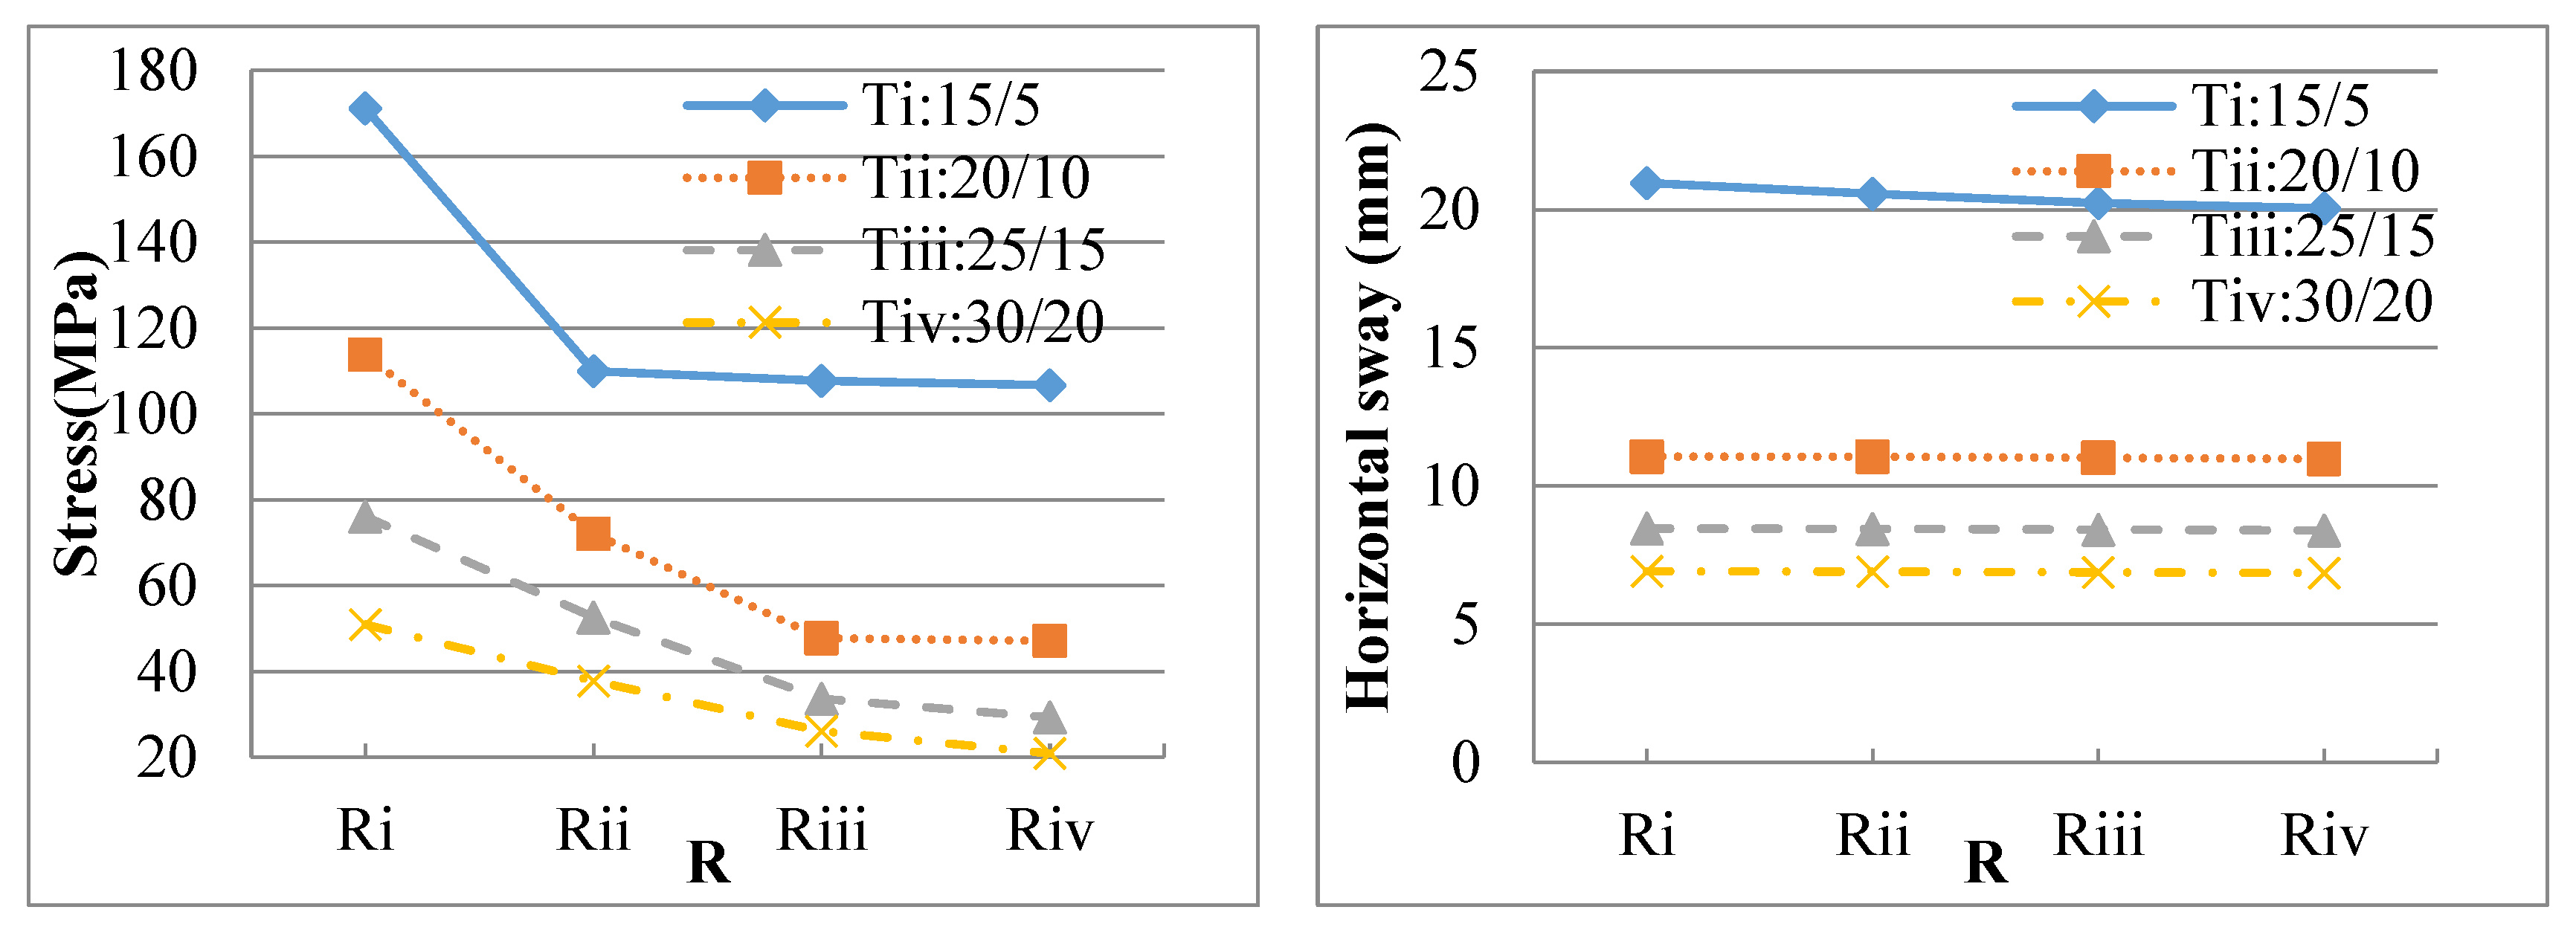
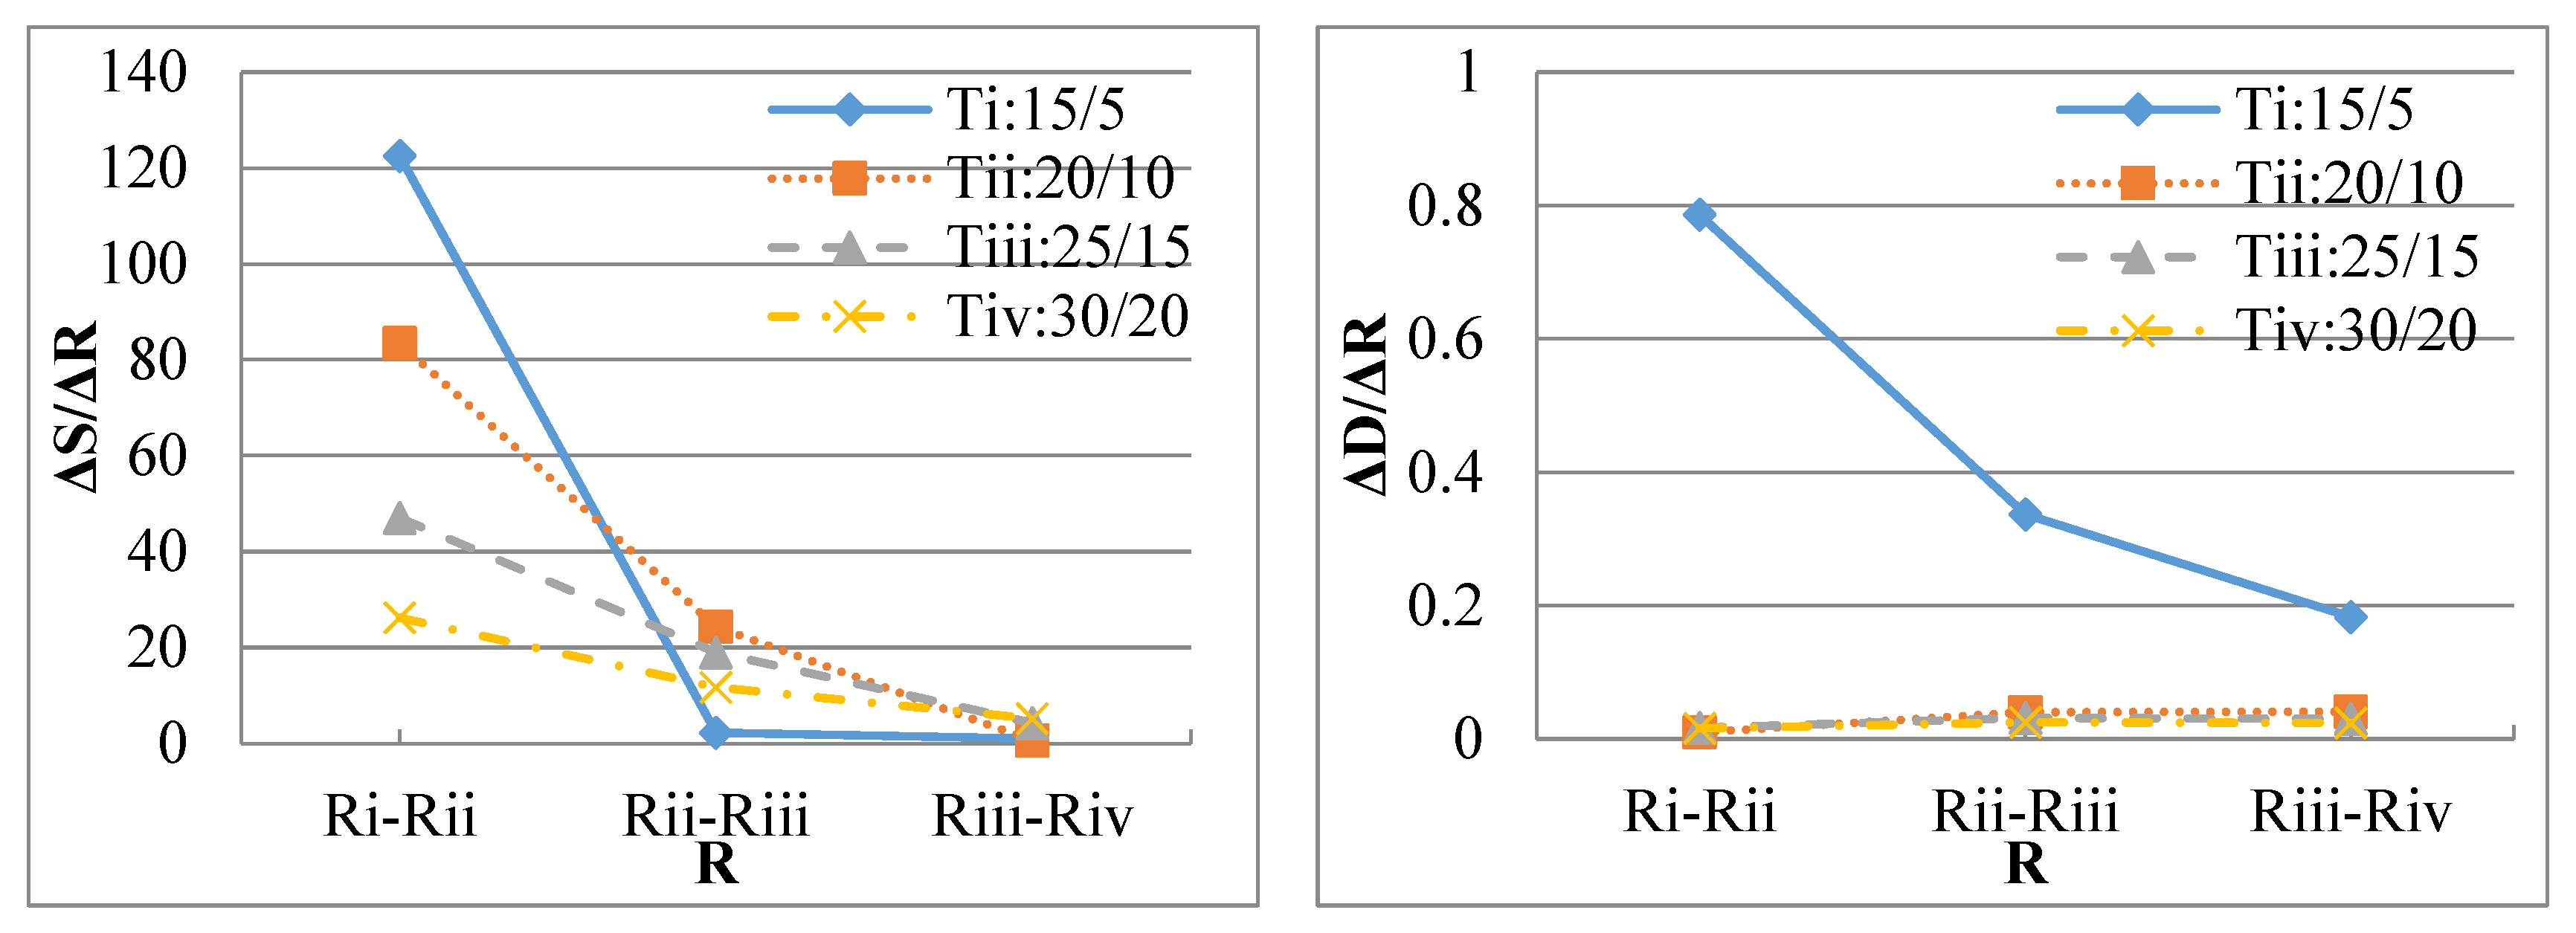
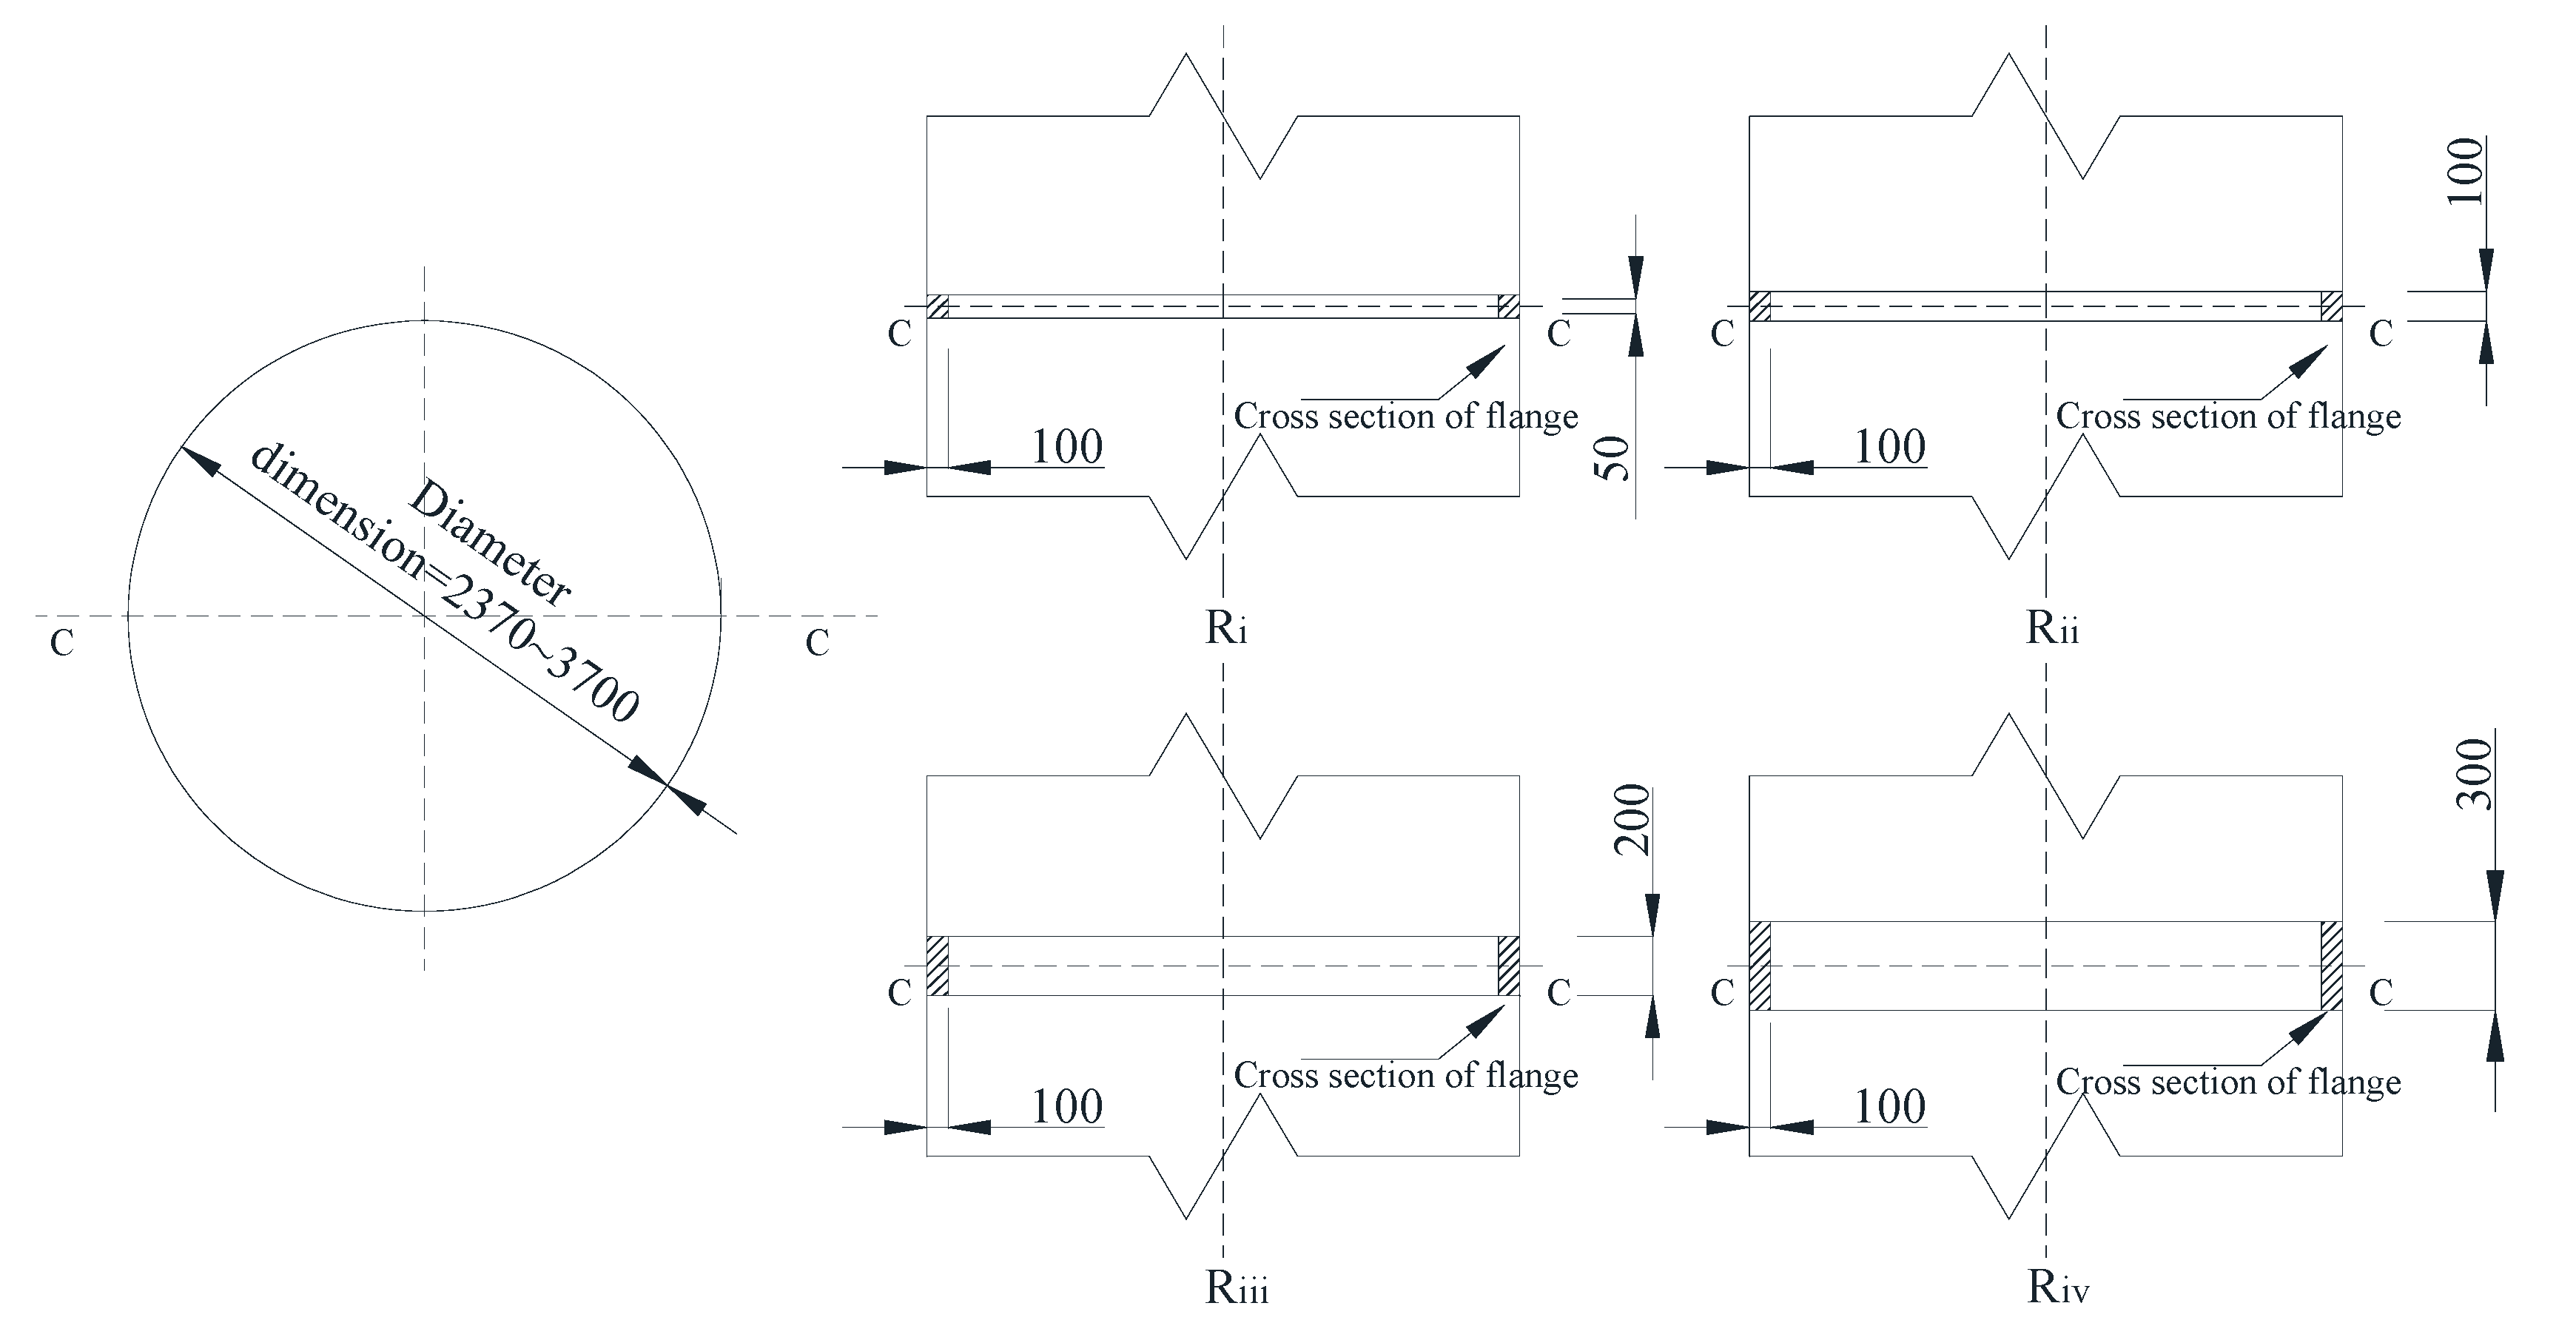
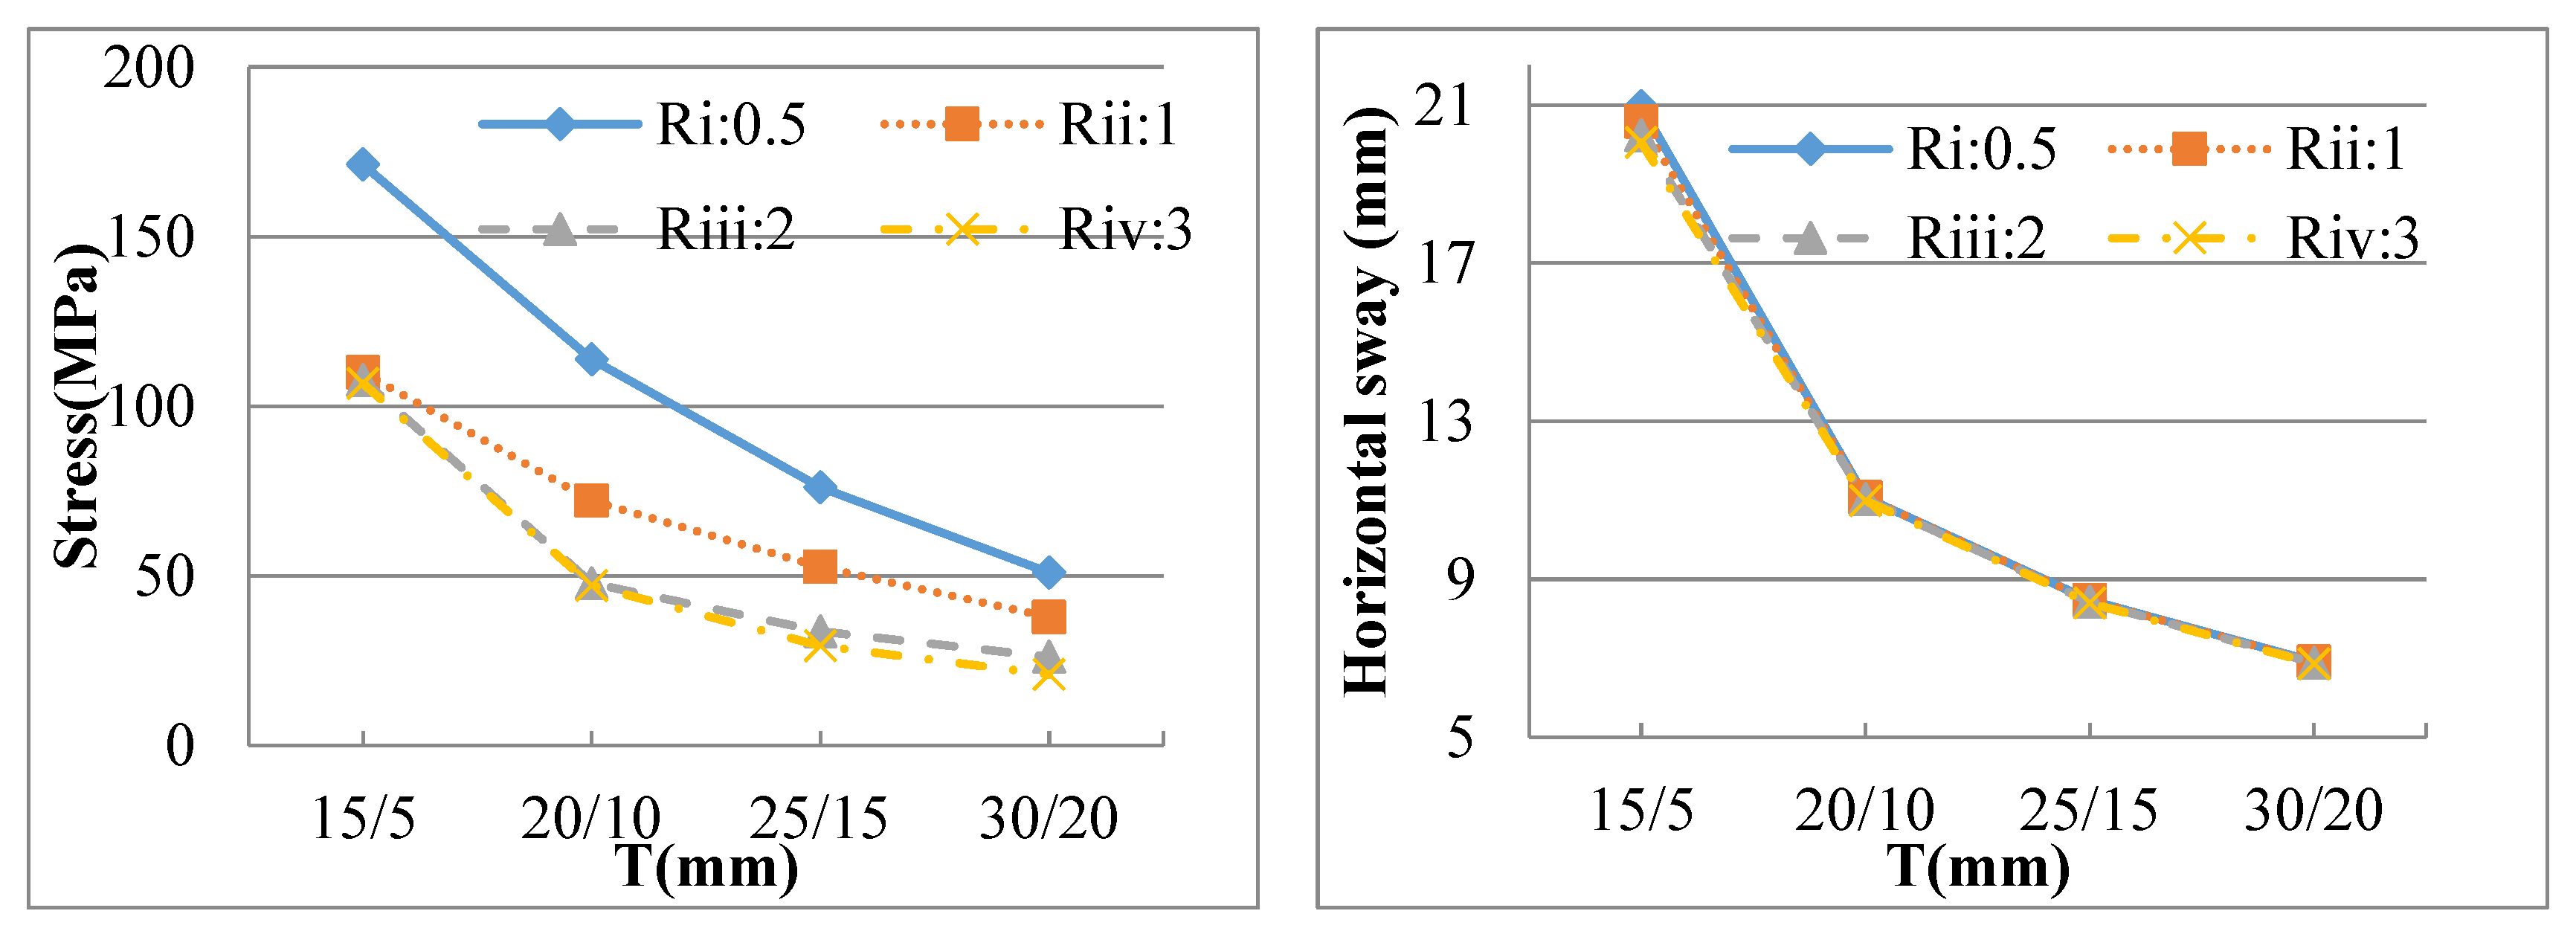
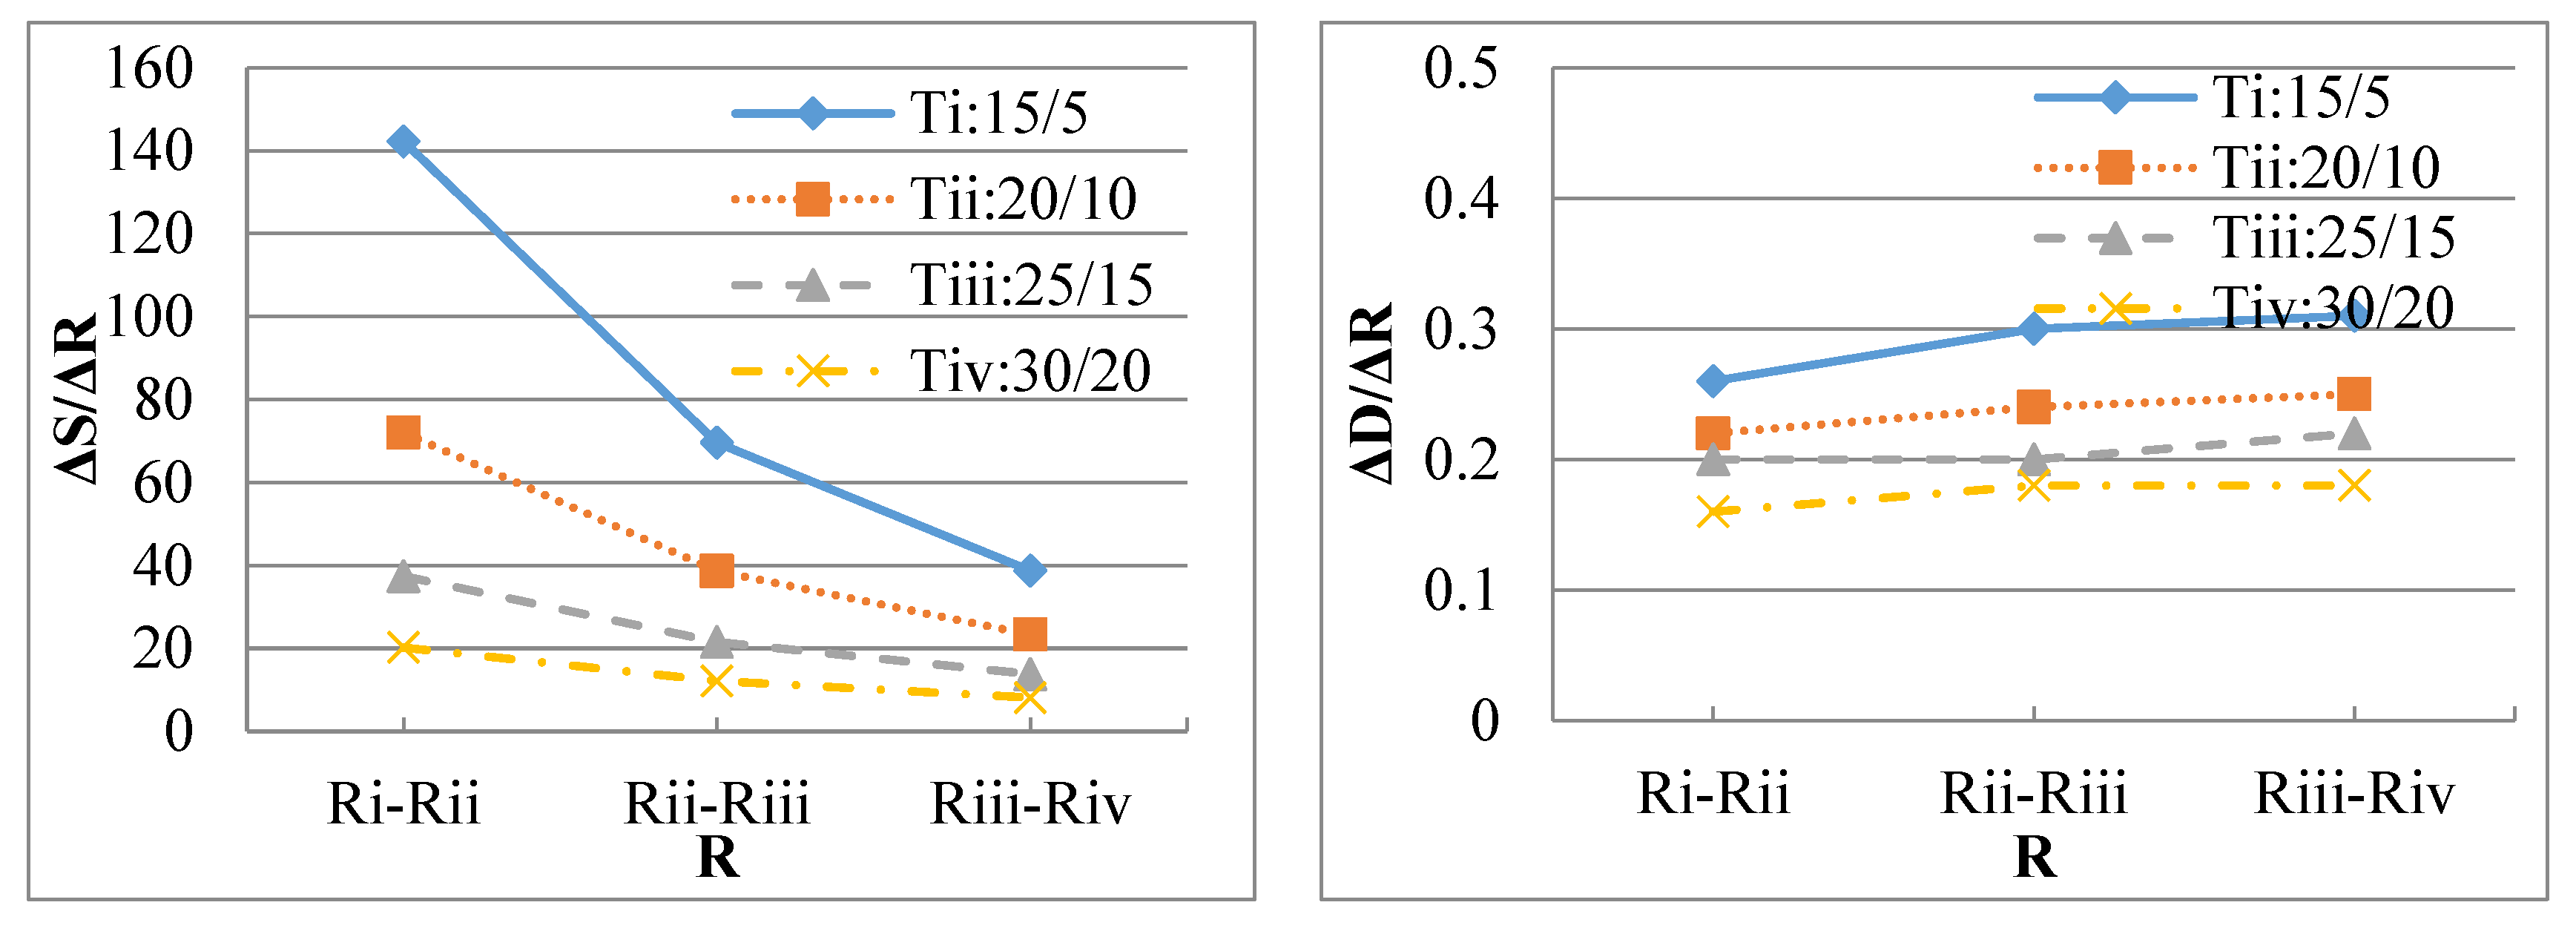
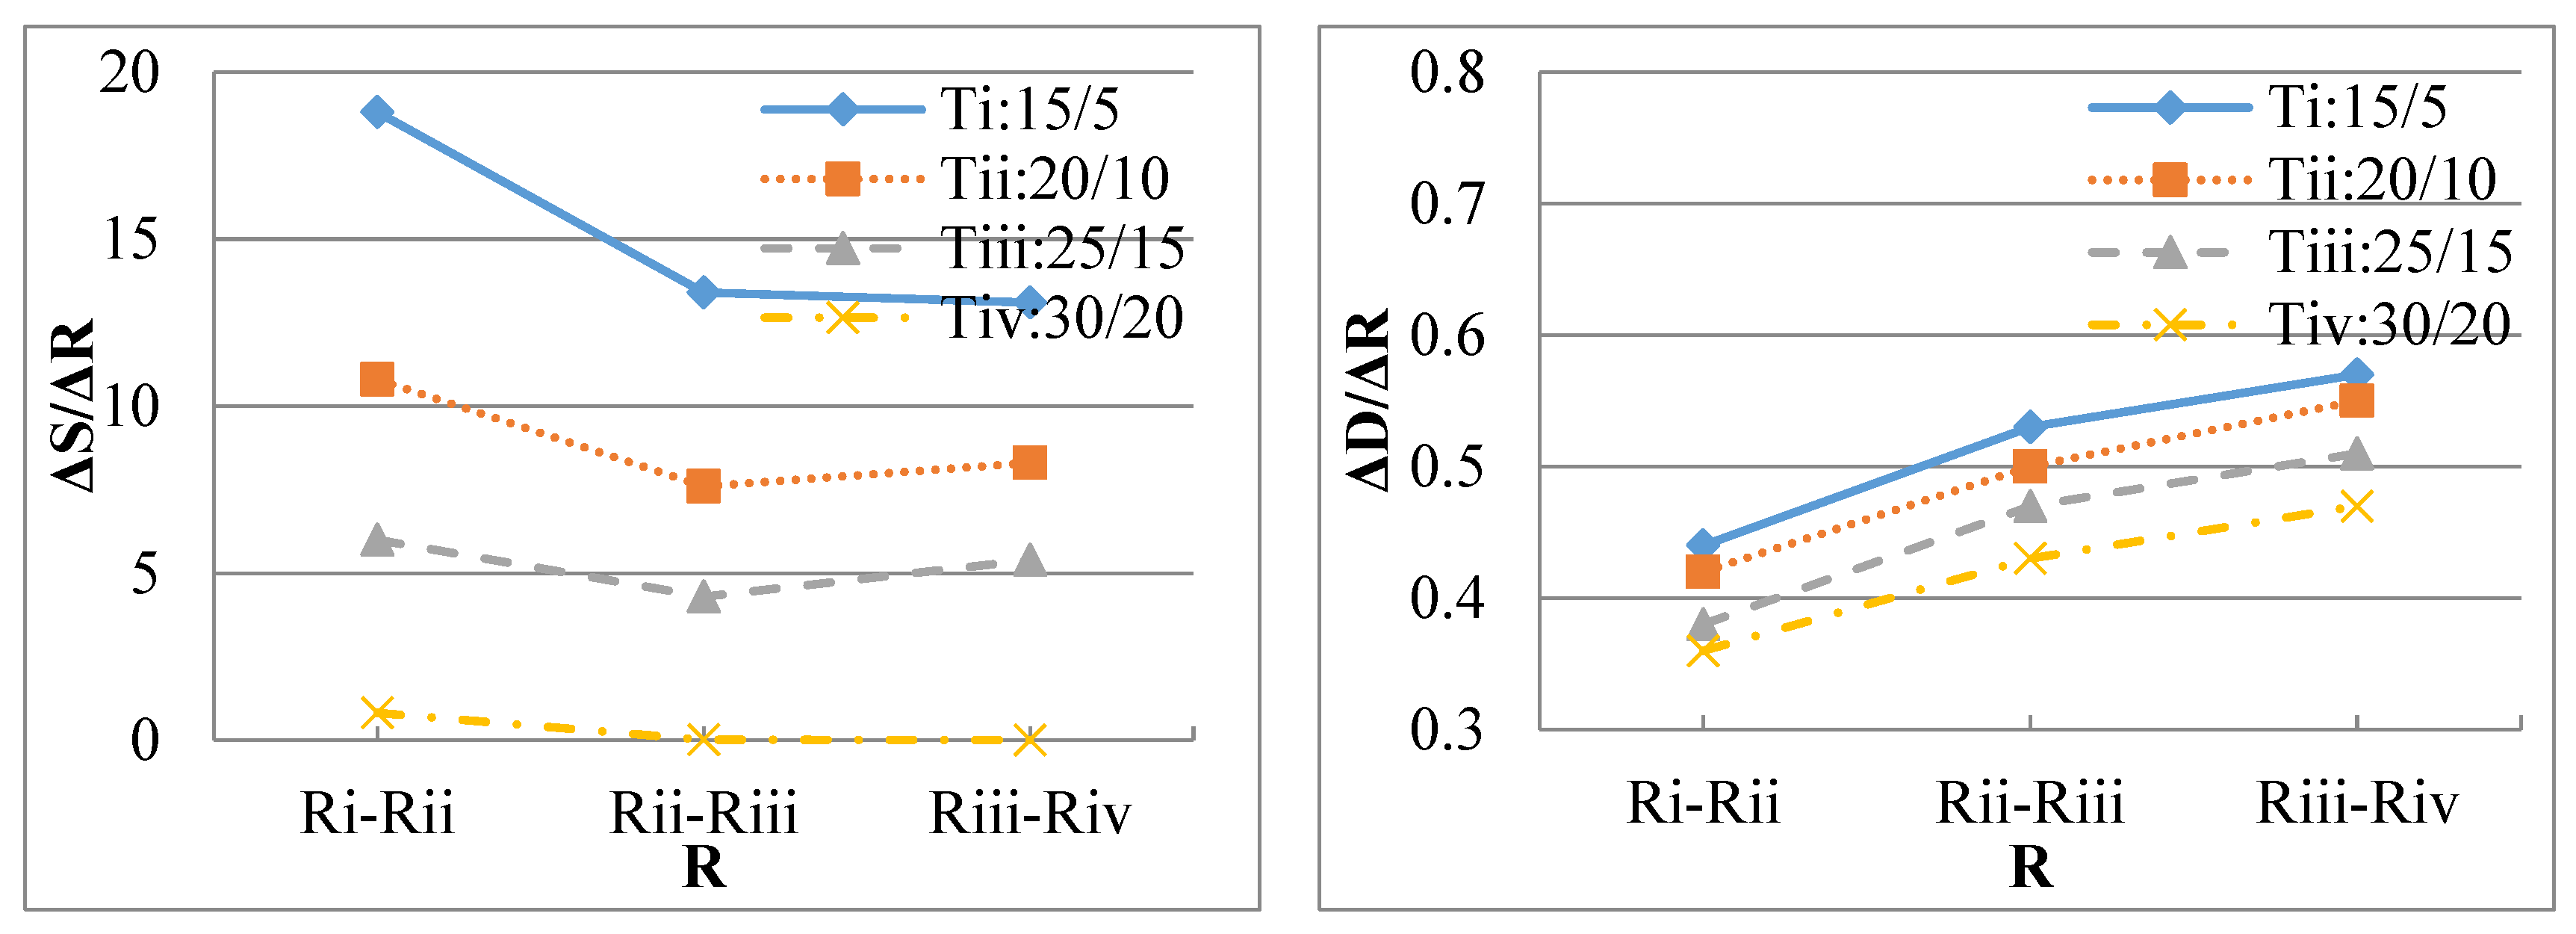
3.2.2. Efficiency Repowering Range of the Mid-Section Width-to-Thickness Ratio R of the Stiffening Rings
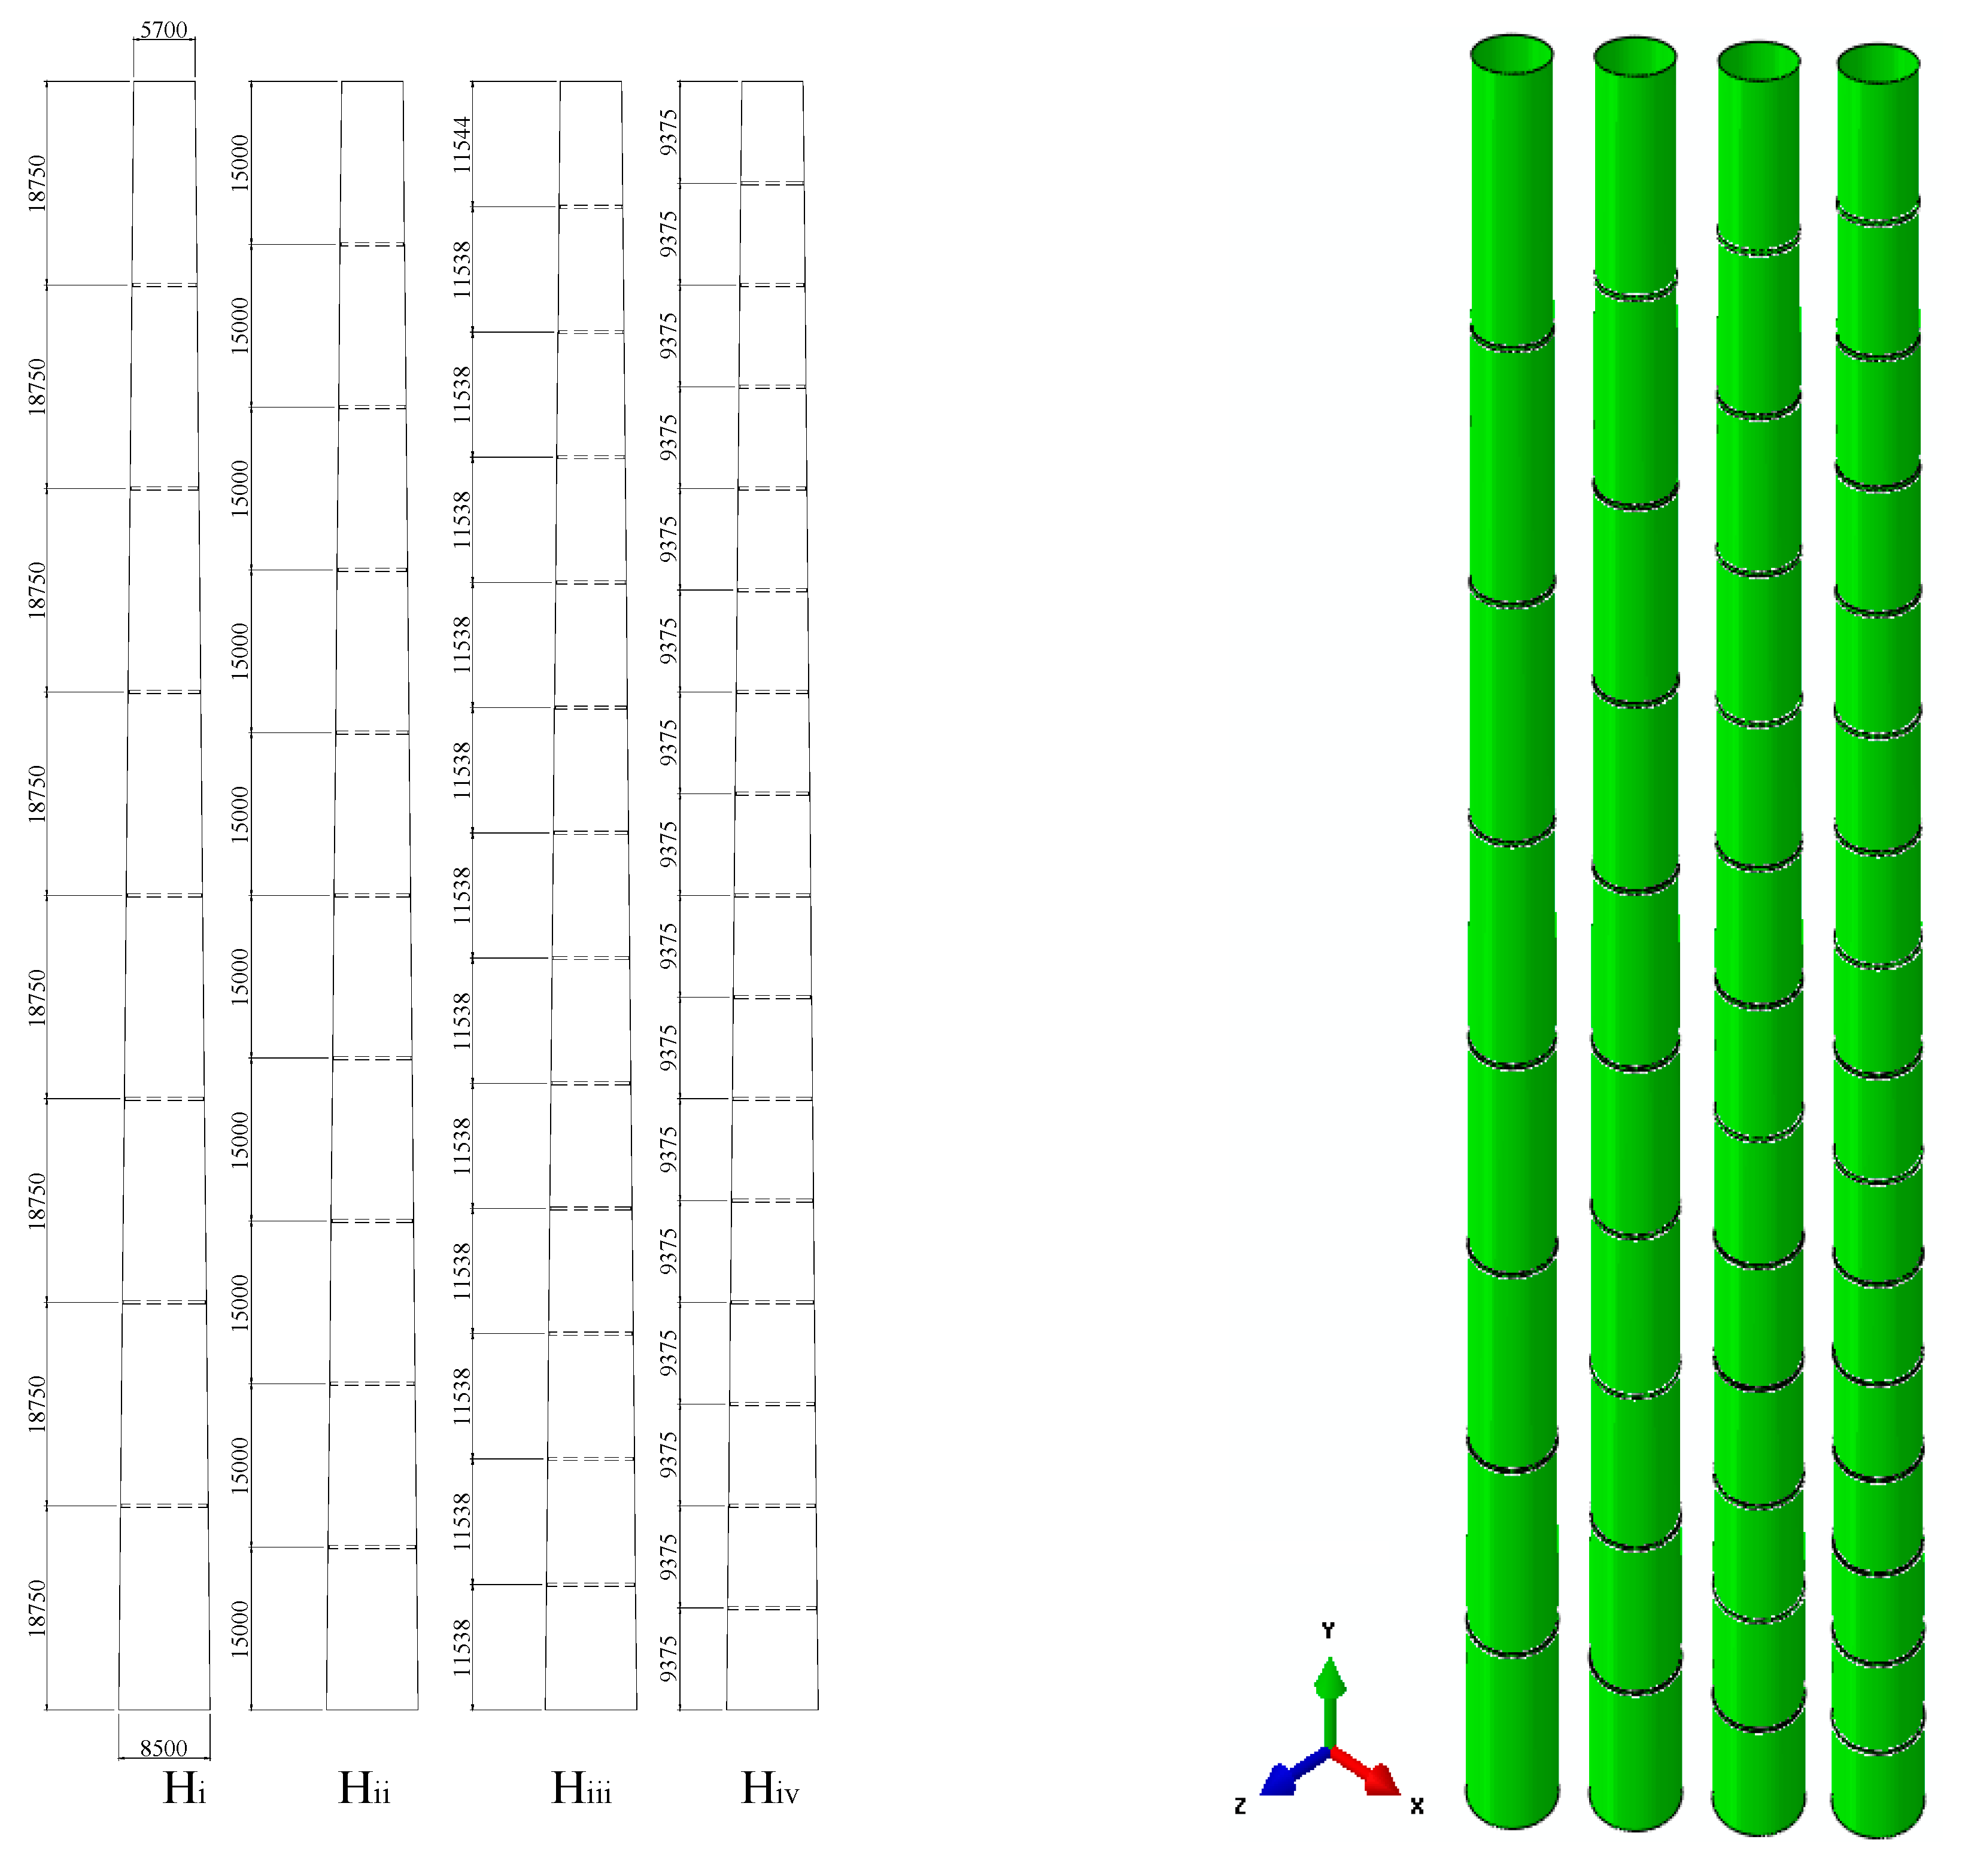
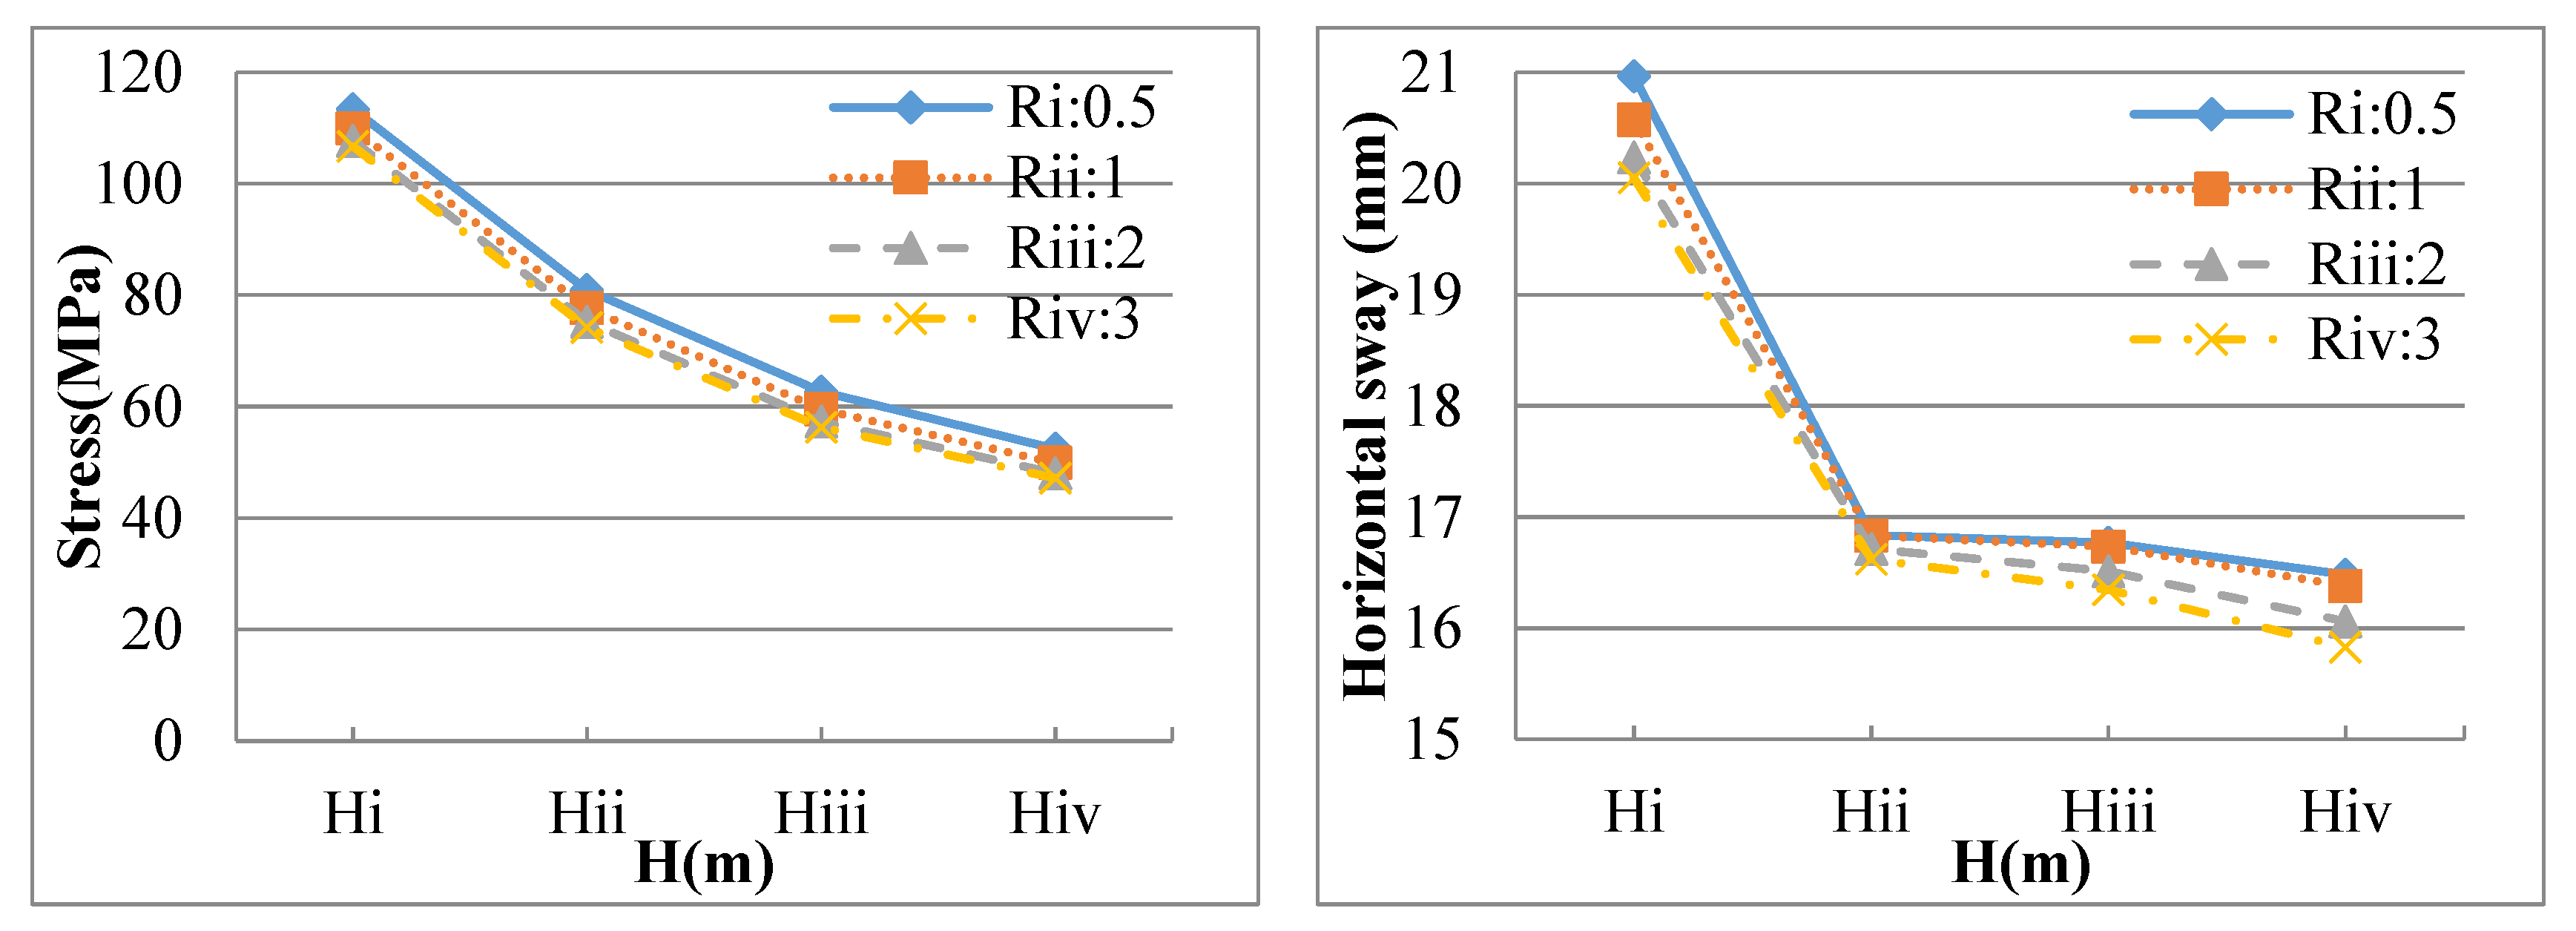
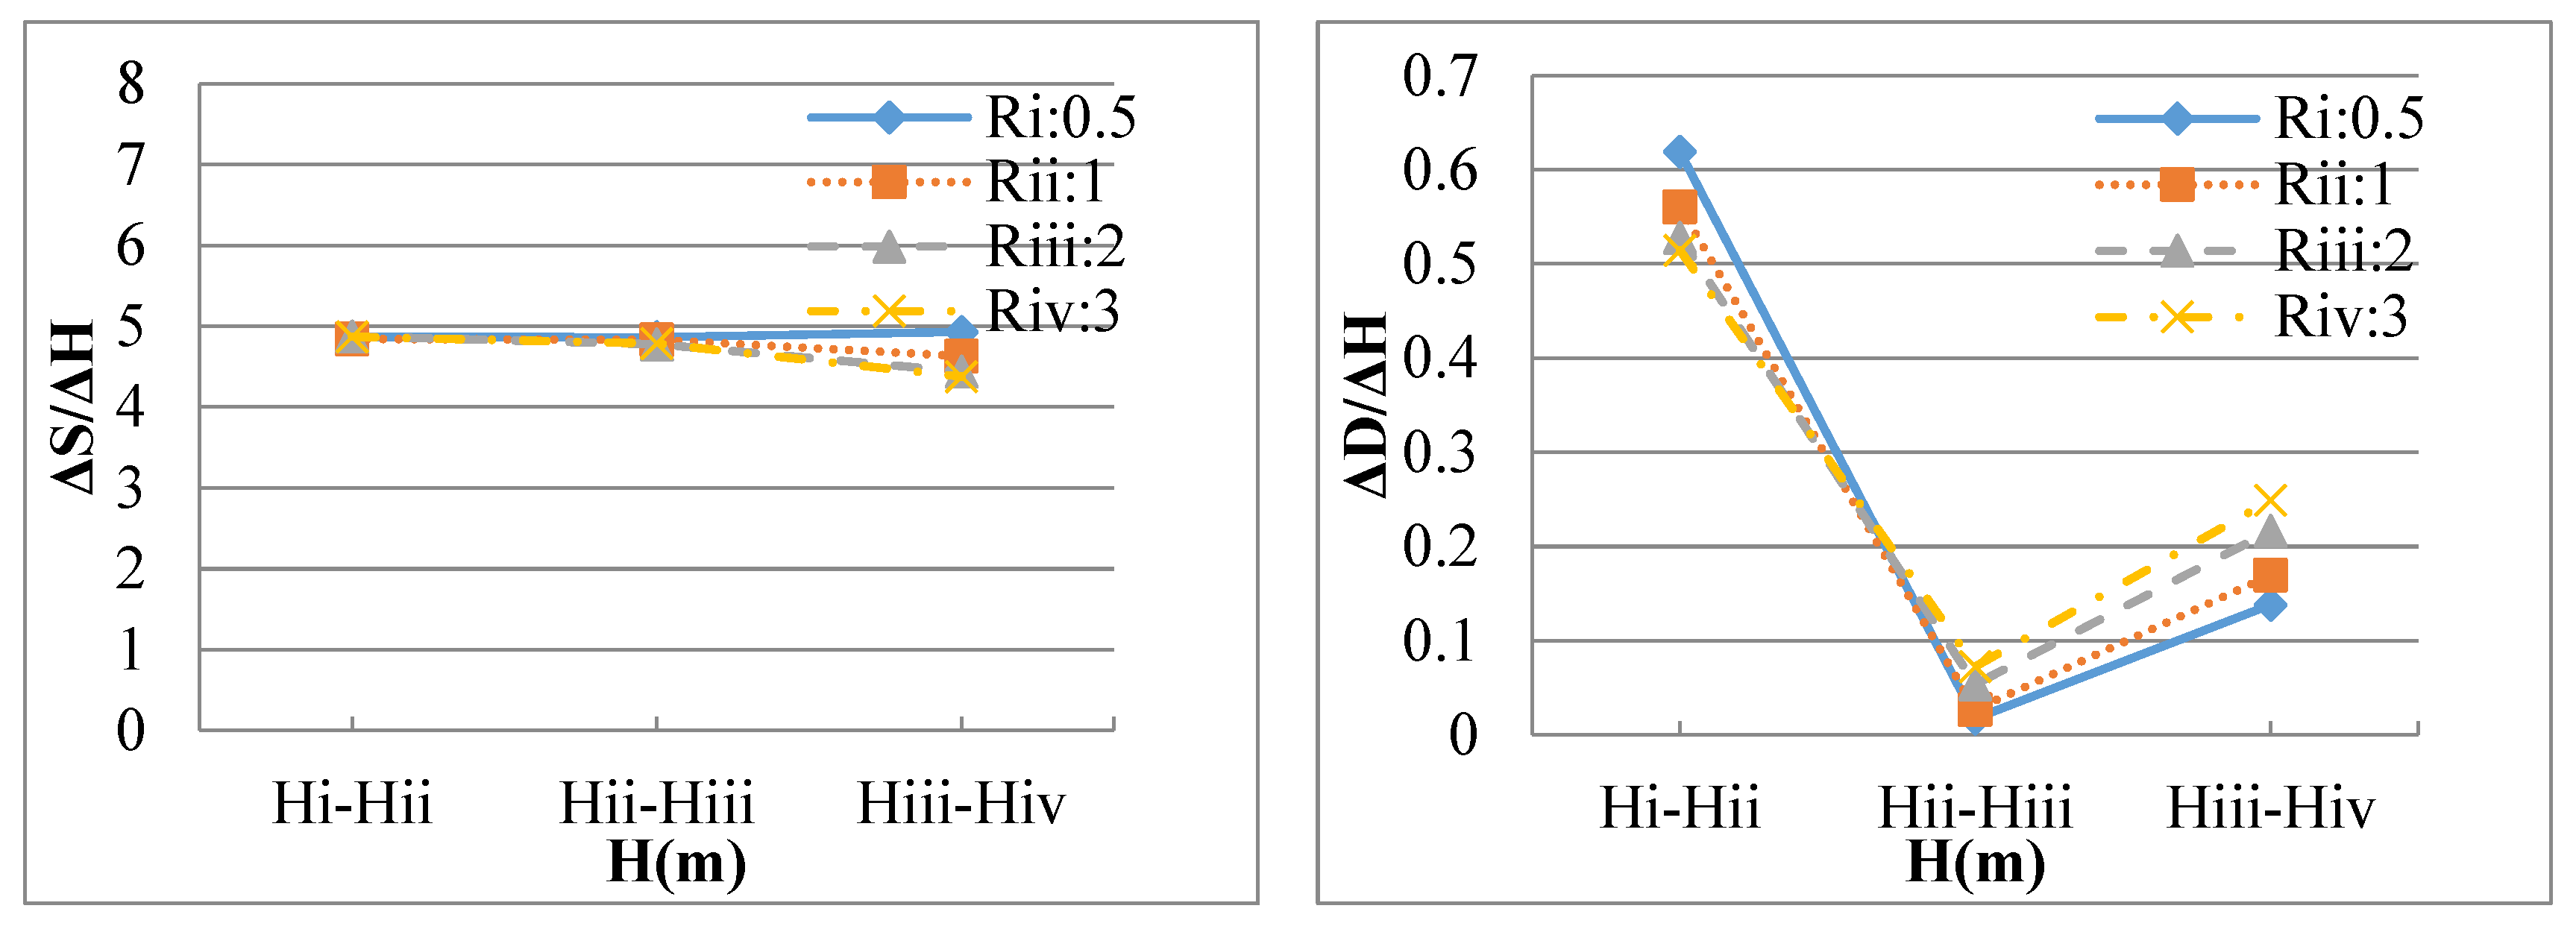
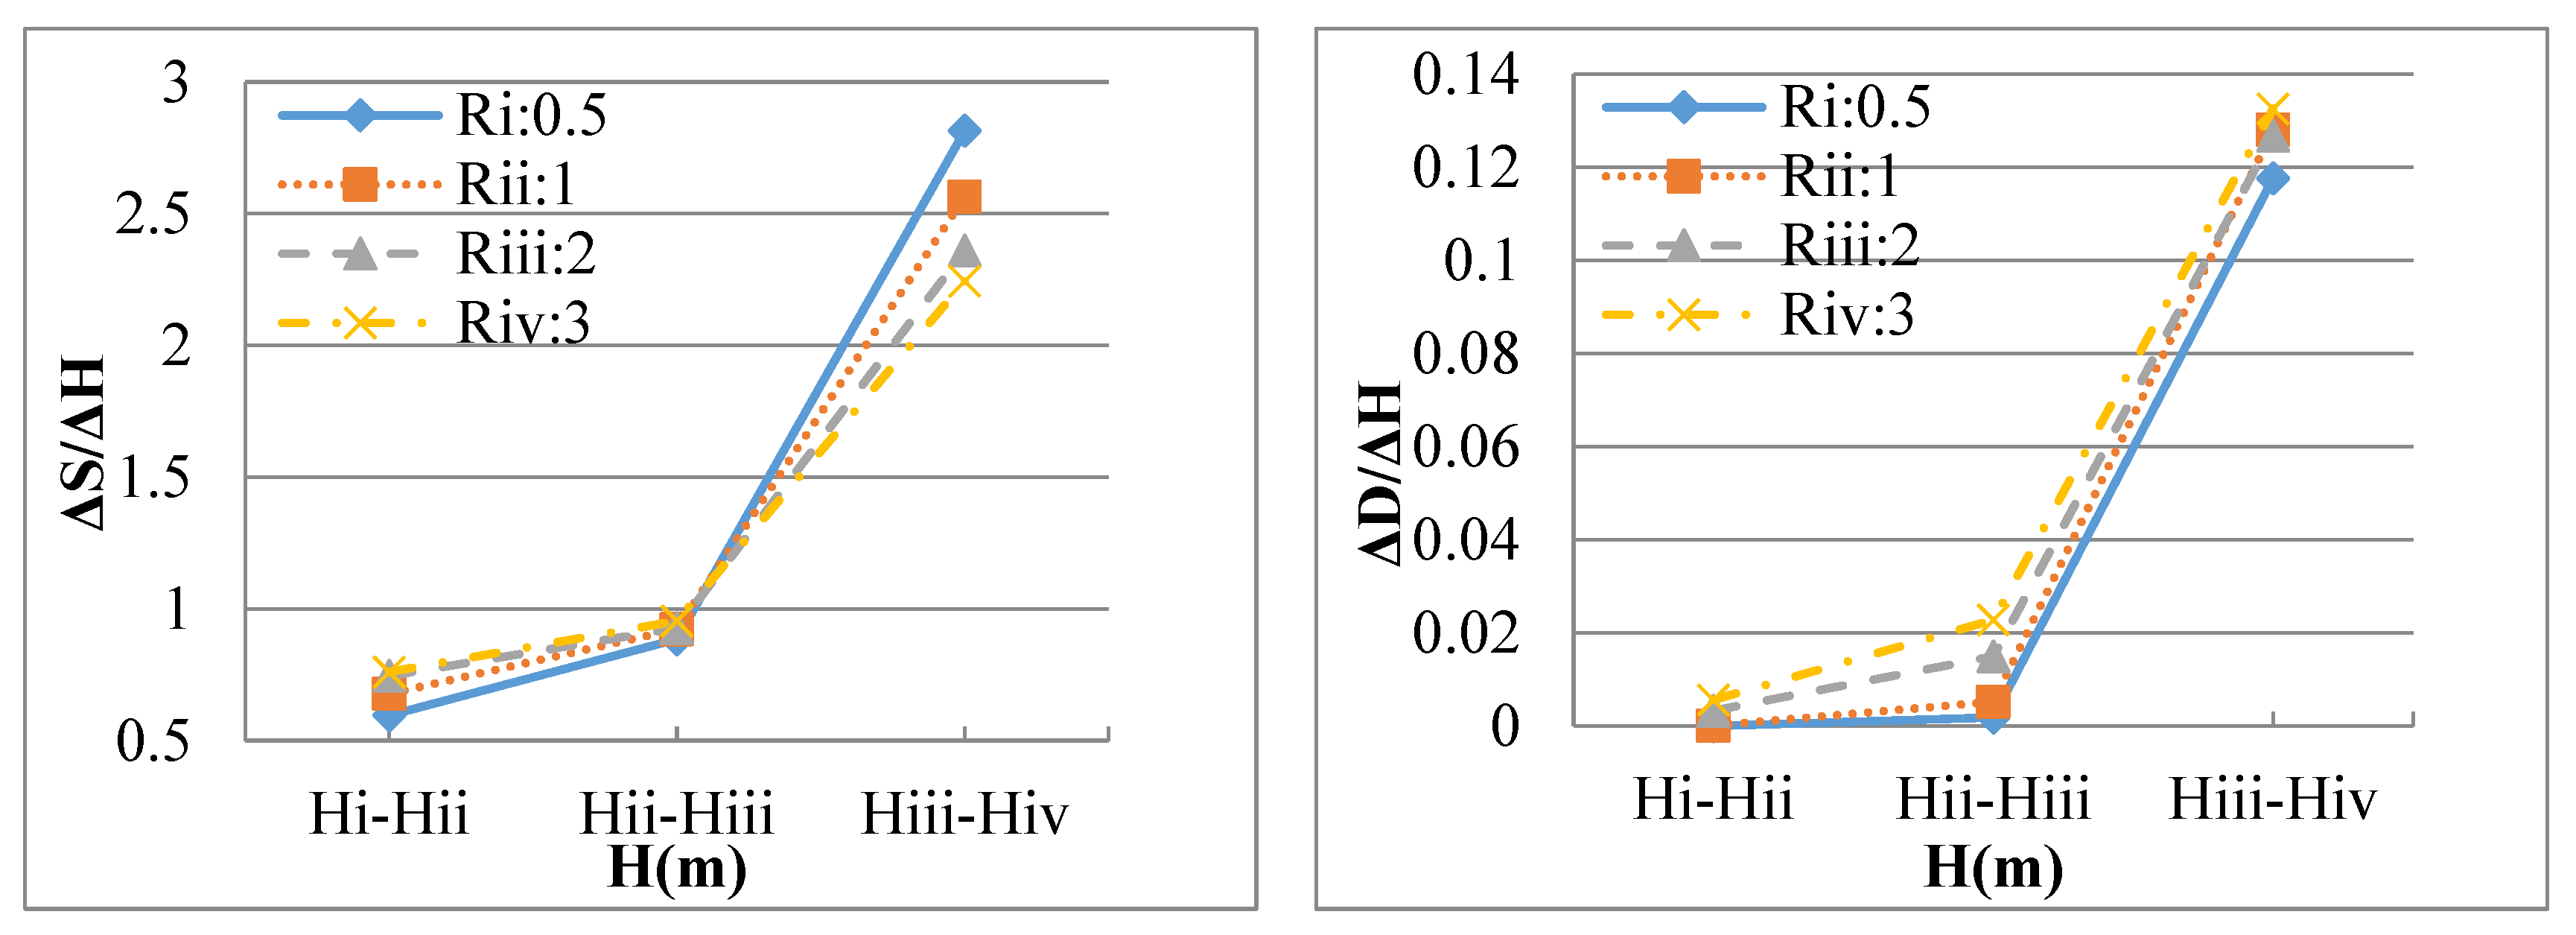
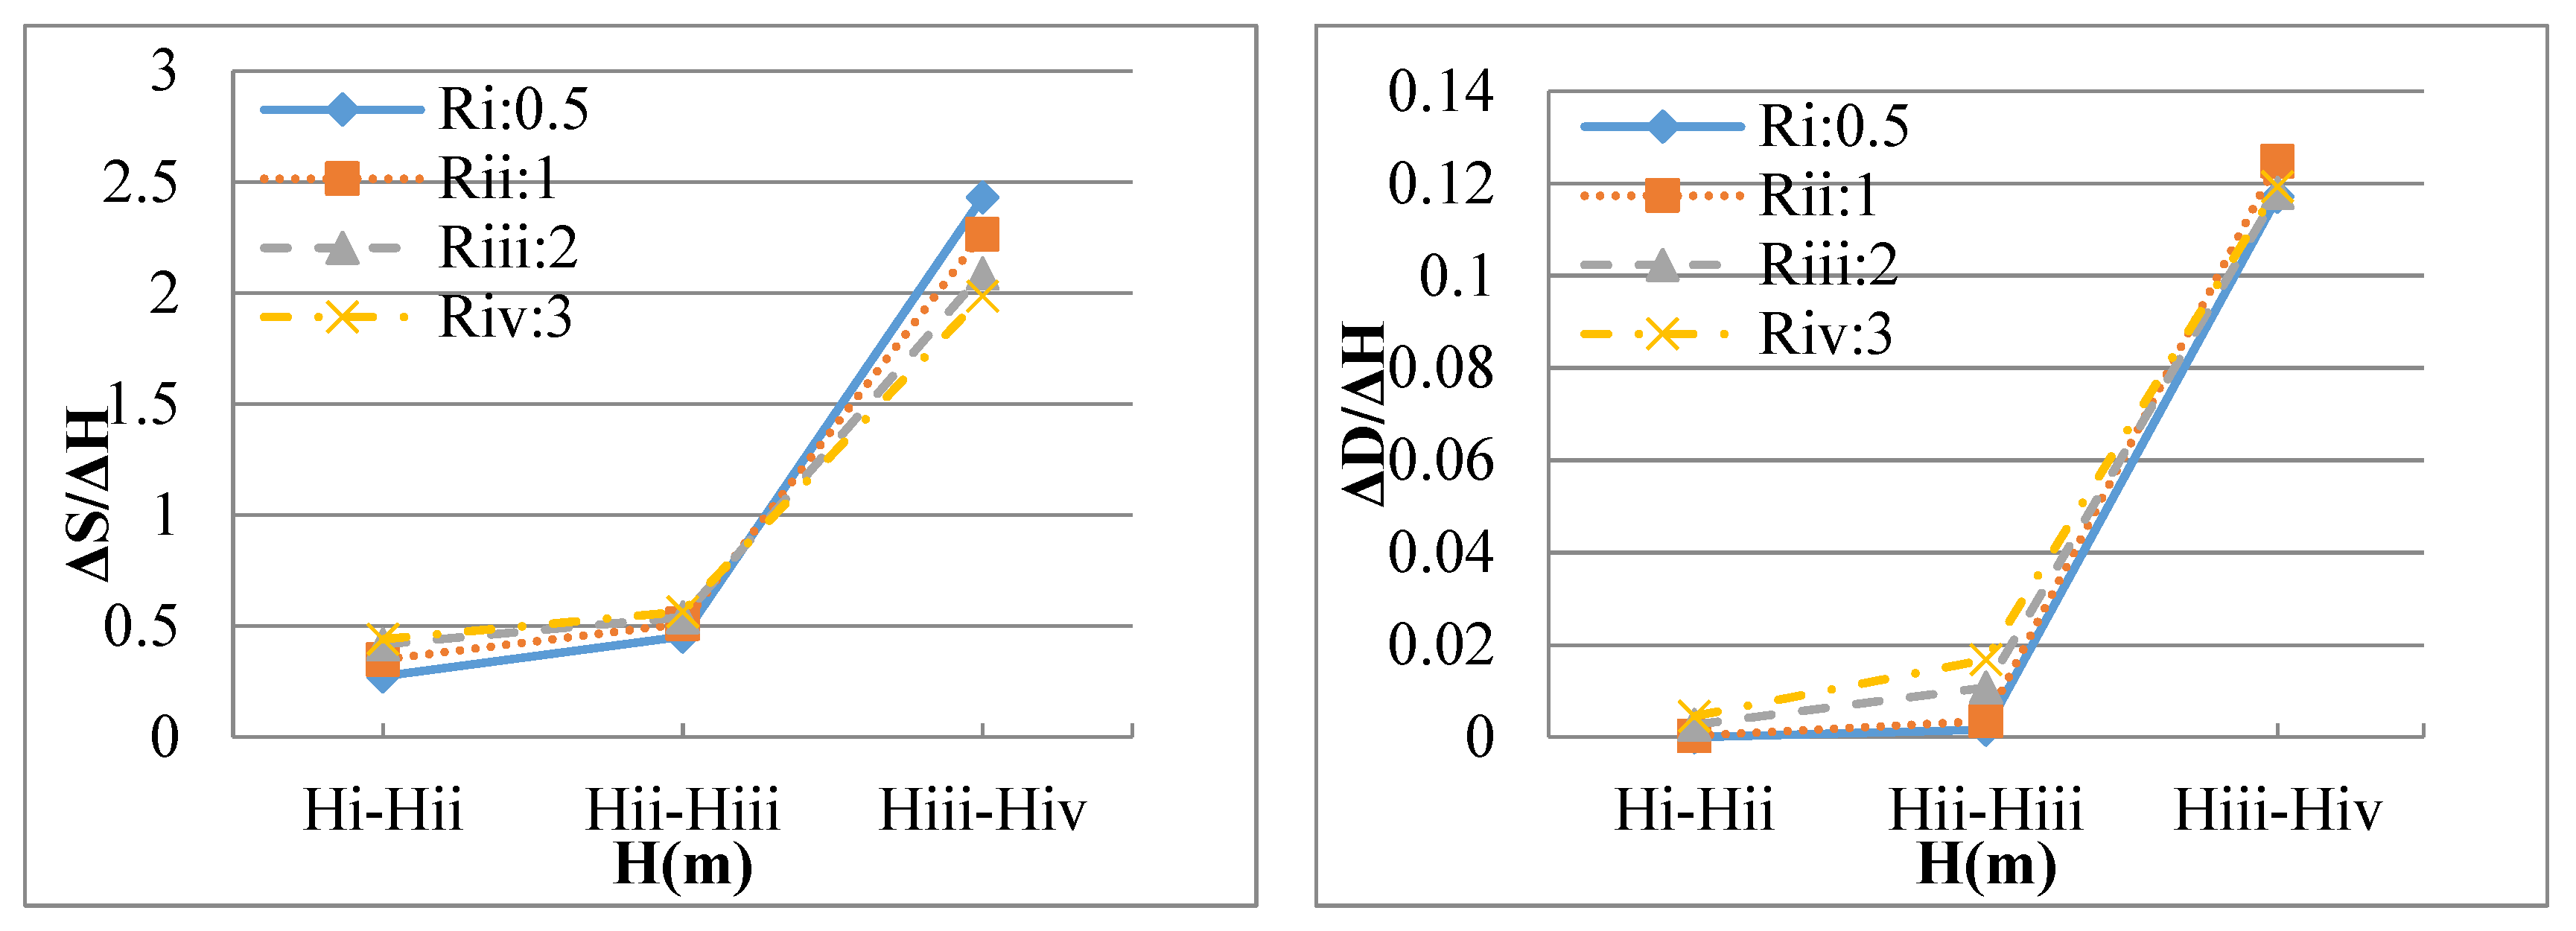
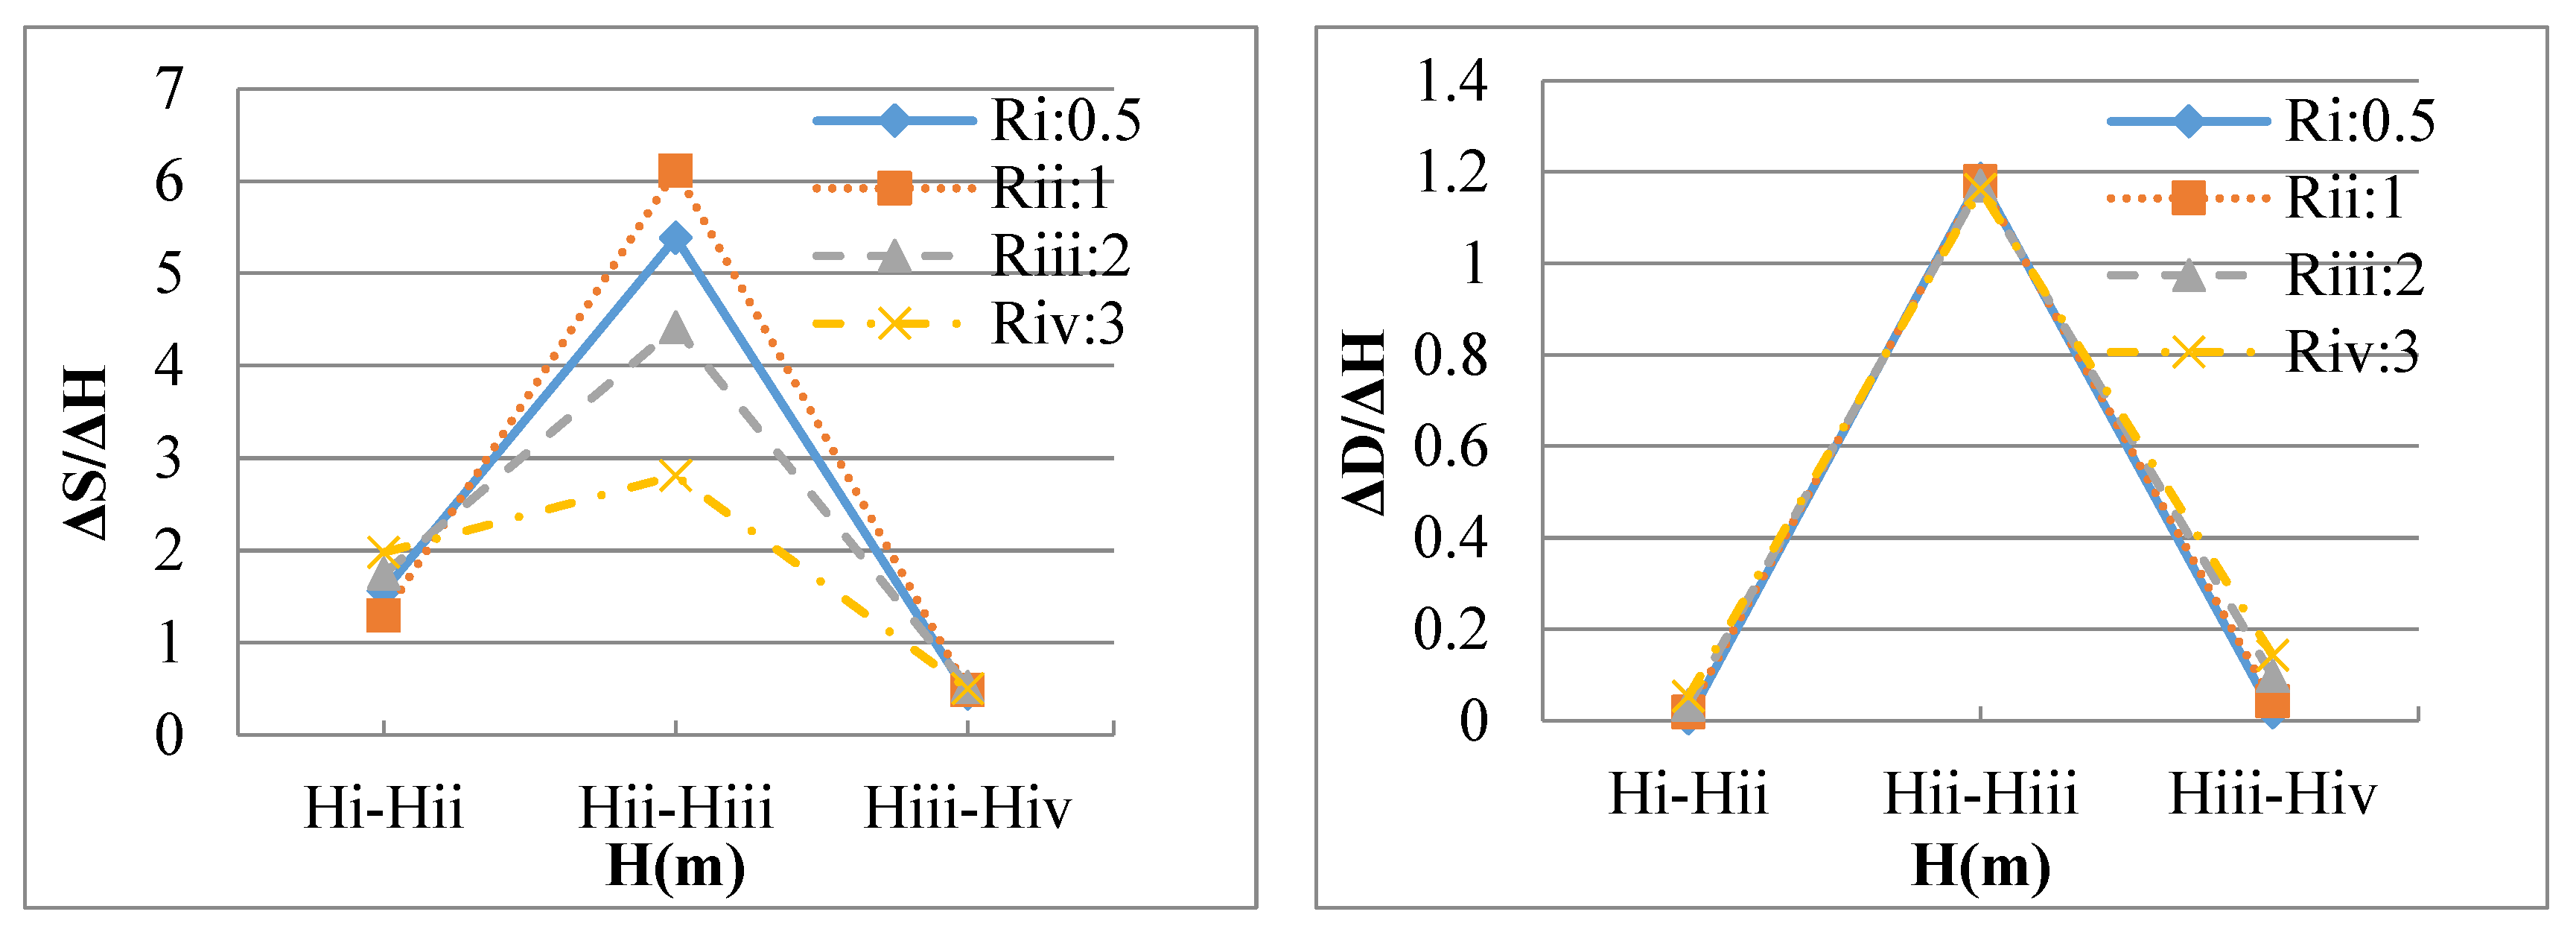
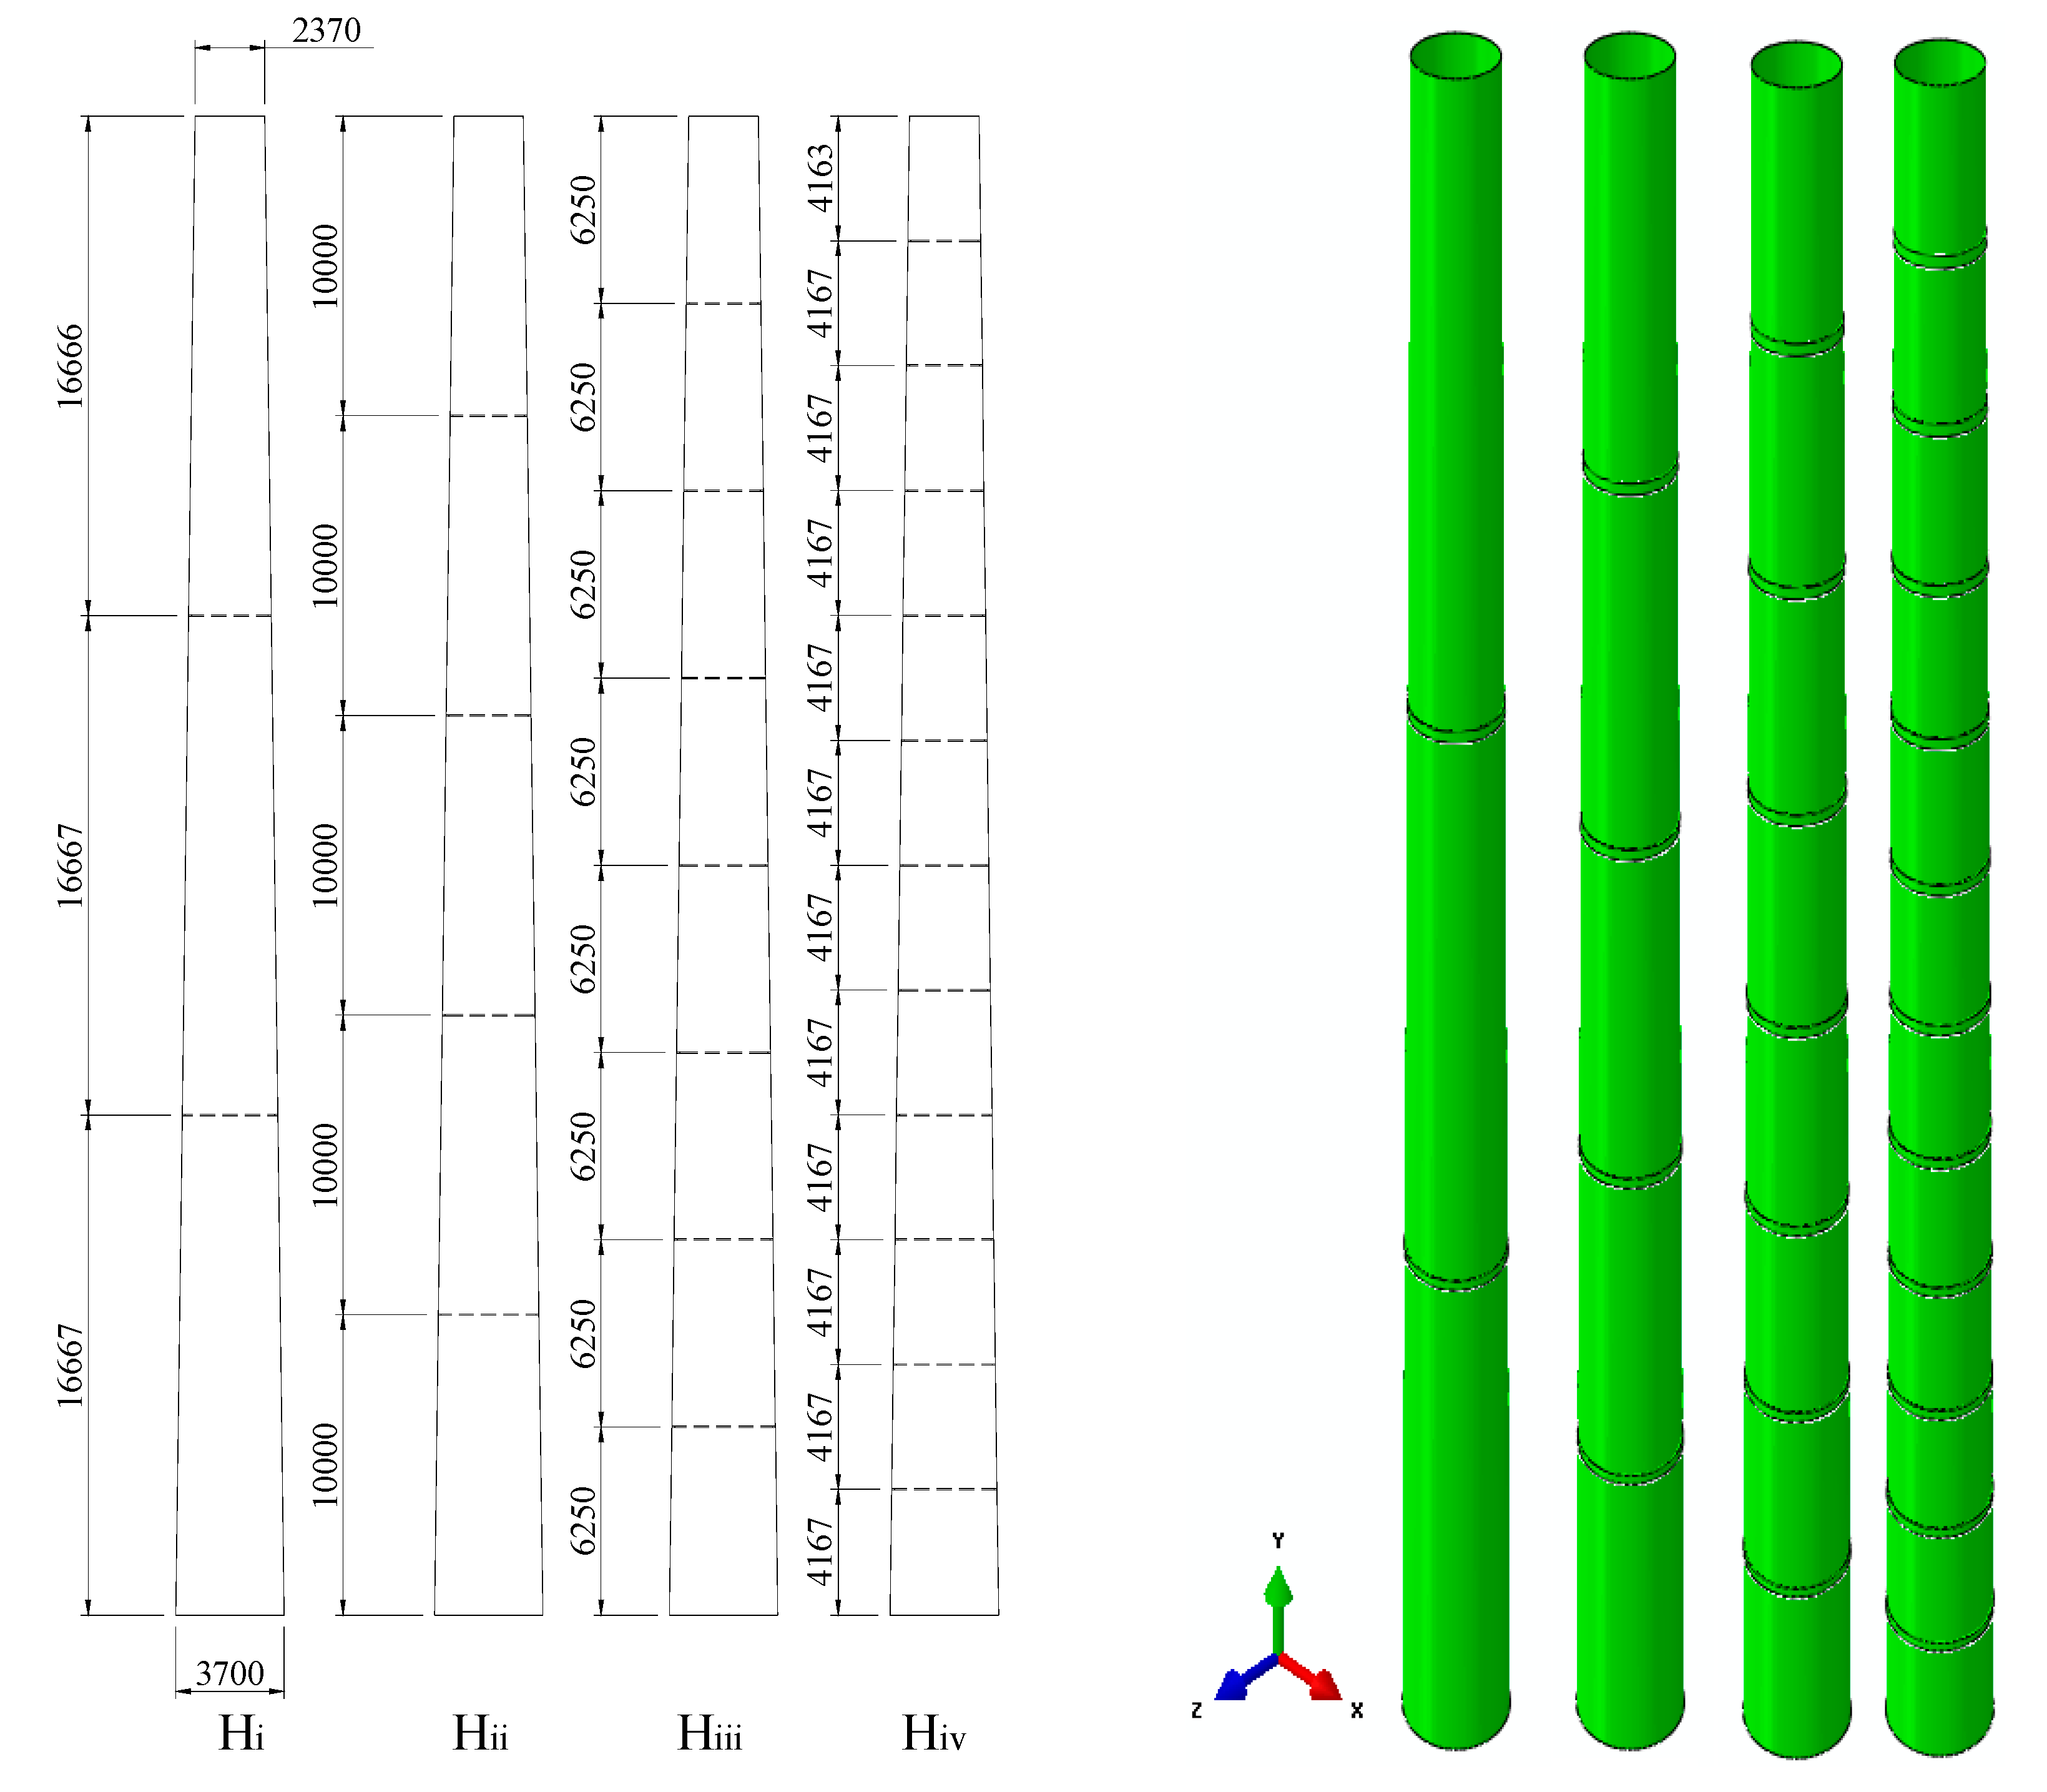
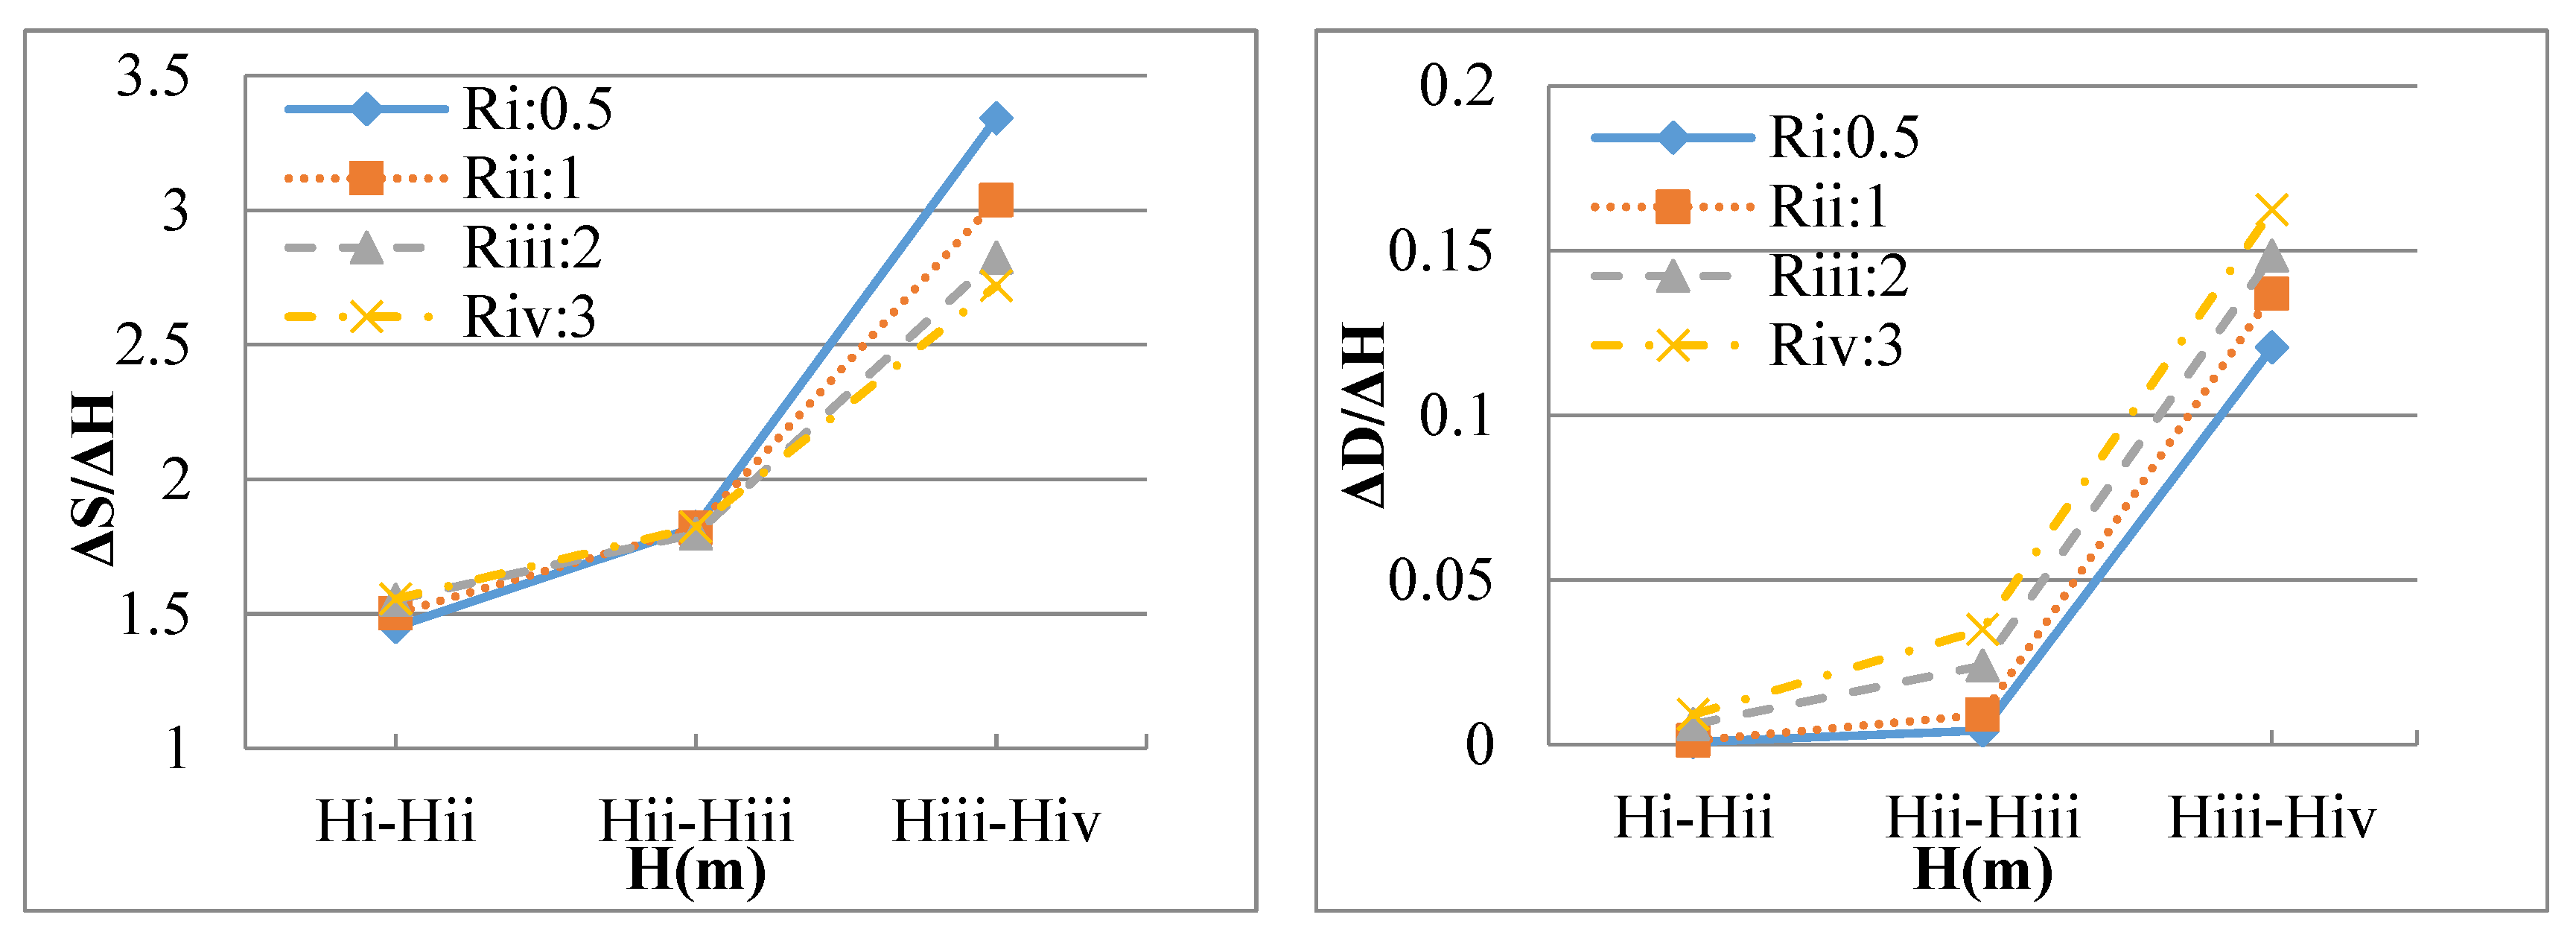
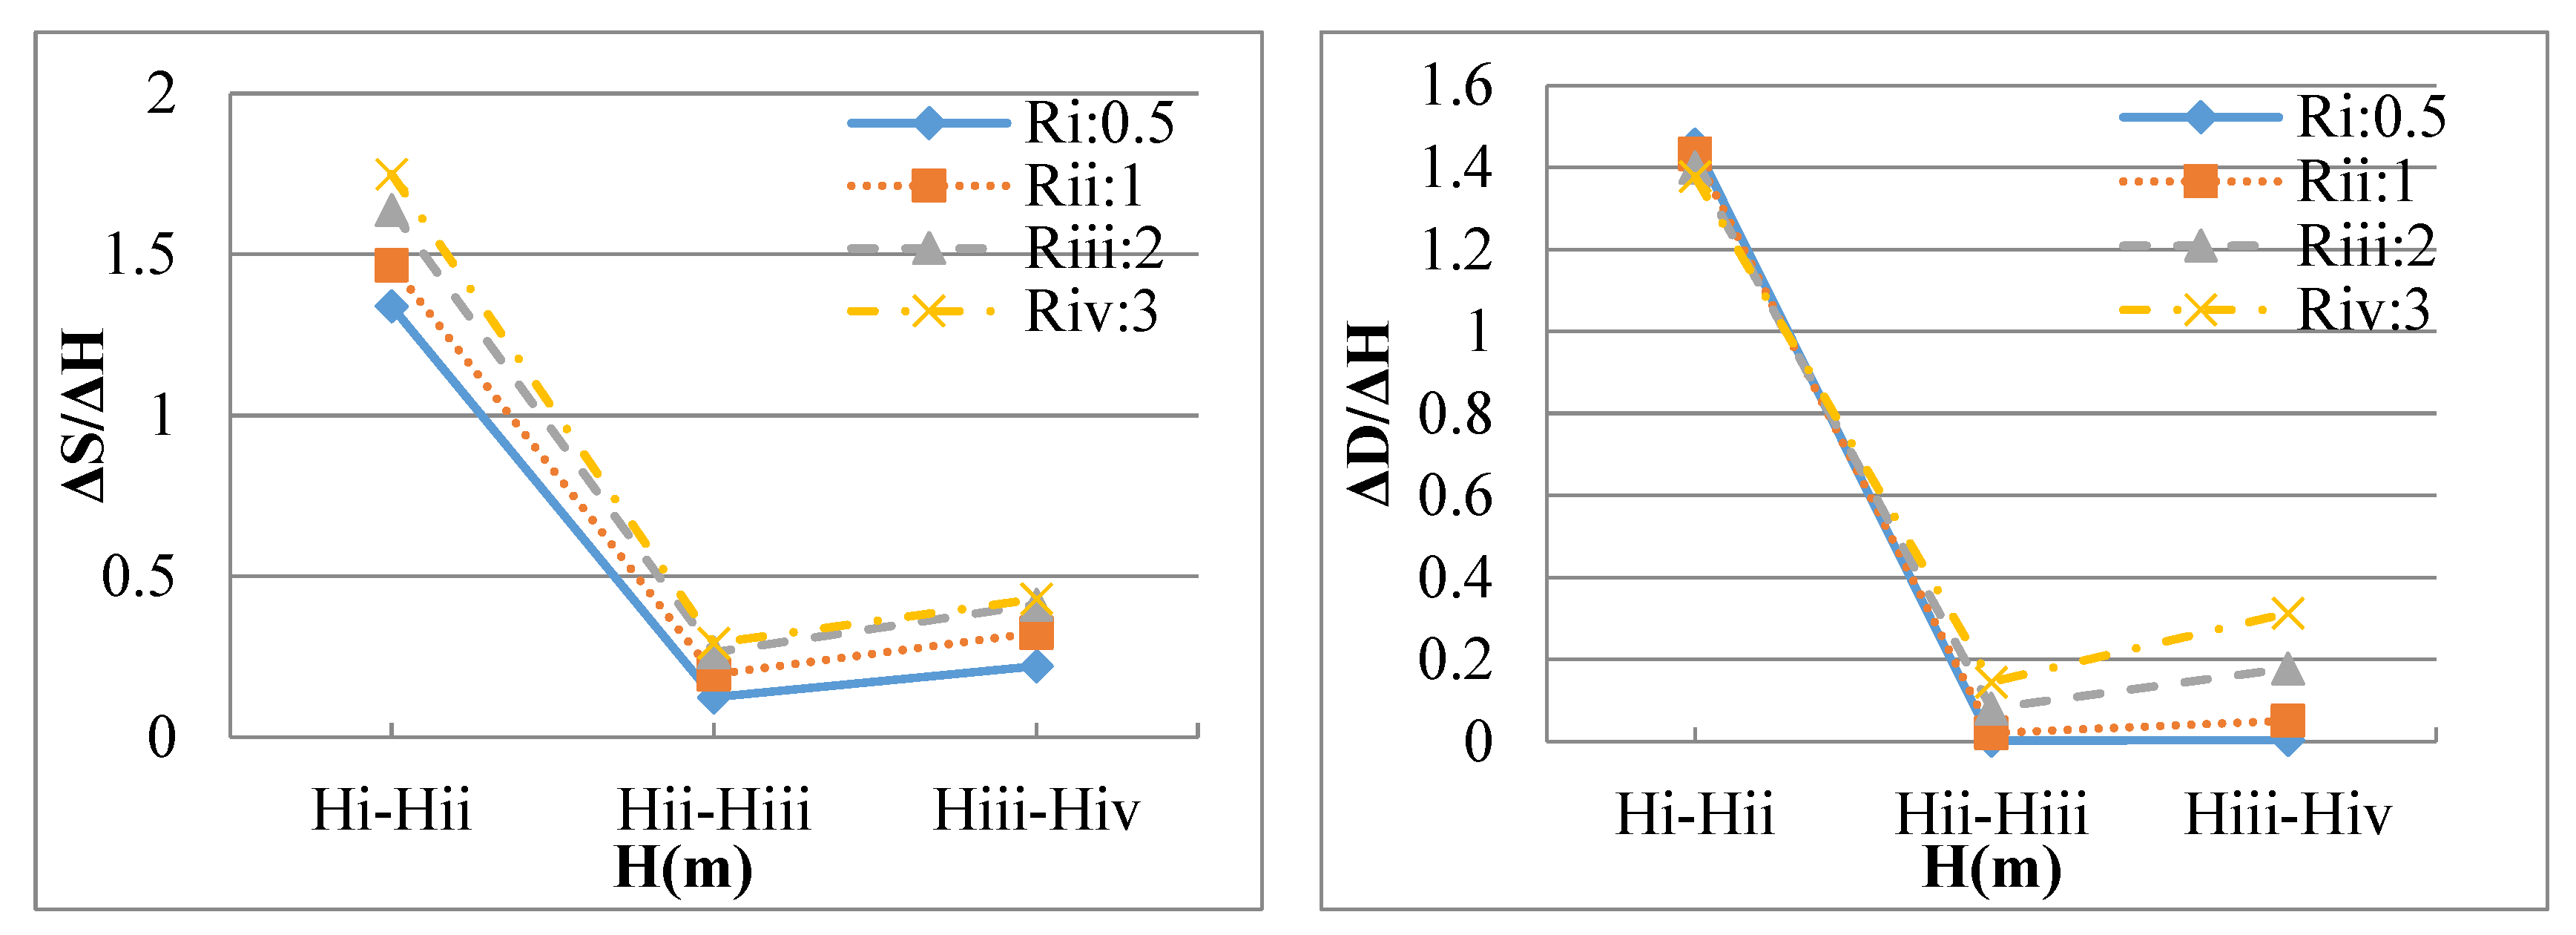
3.2.3. Efficiency Repowering Range of the Spacing H
4. Conclusions
Author Contributions
Funding
Conflicts of Interest
Appendix A

| Types of Towers | Max. Stress (MPa) | Max. Stress of Shell (MPa) | Max. Horizontal Sway (mm) | ||||||
|---|---|---|---|---|---|---|---|---|---|
| 50 m | 150 m | 250 m | 50 m | 150 m | 250 m | 50 m | 150 m | 250 m | |
| TiRiHi | 171.2 | 351.2 | 208.9 | 113.4 | 91.14 | 107.6 | 20.96 | 199.4 | 648.75 |
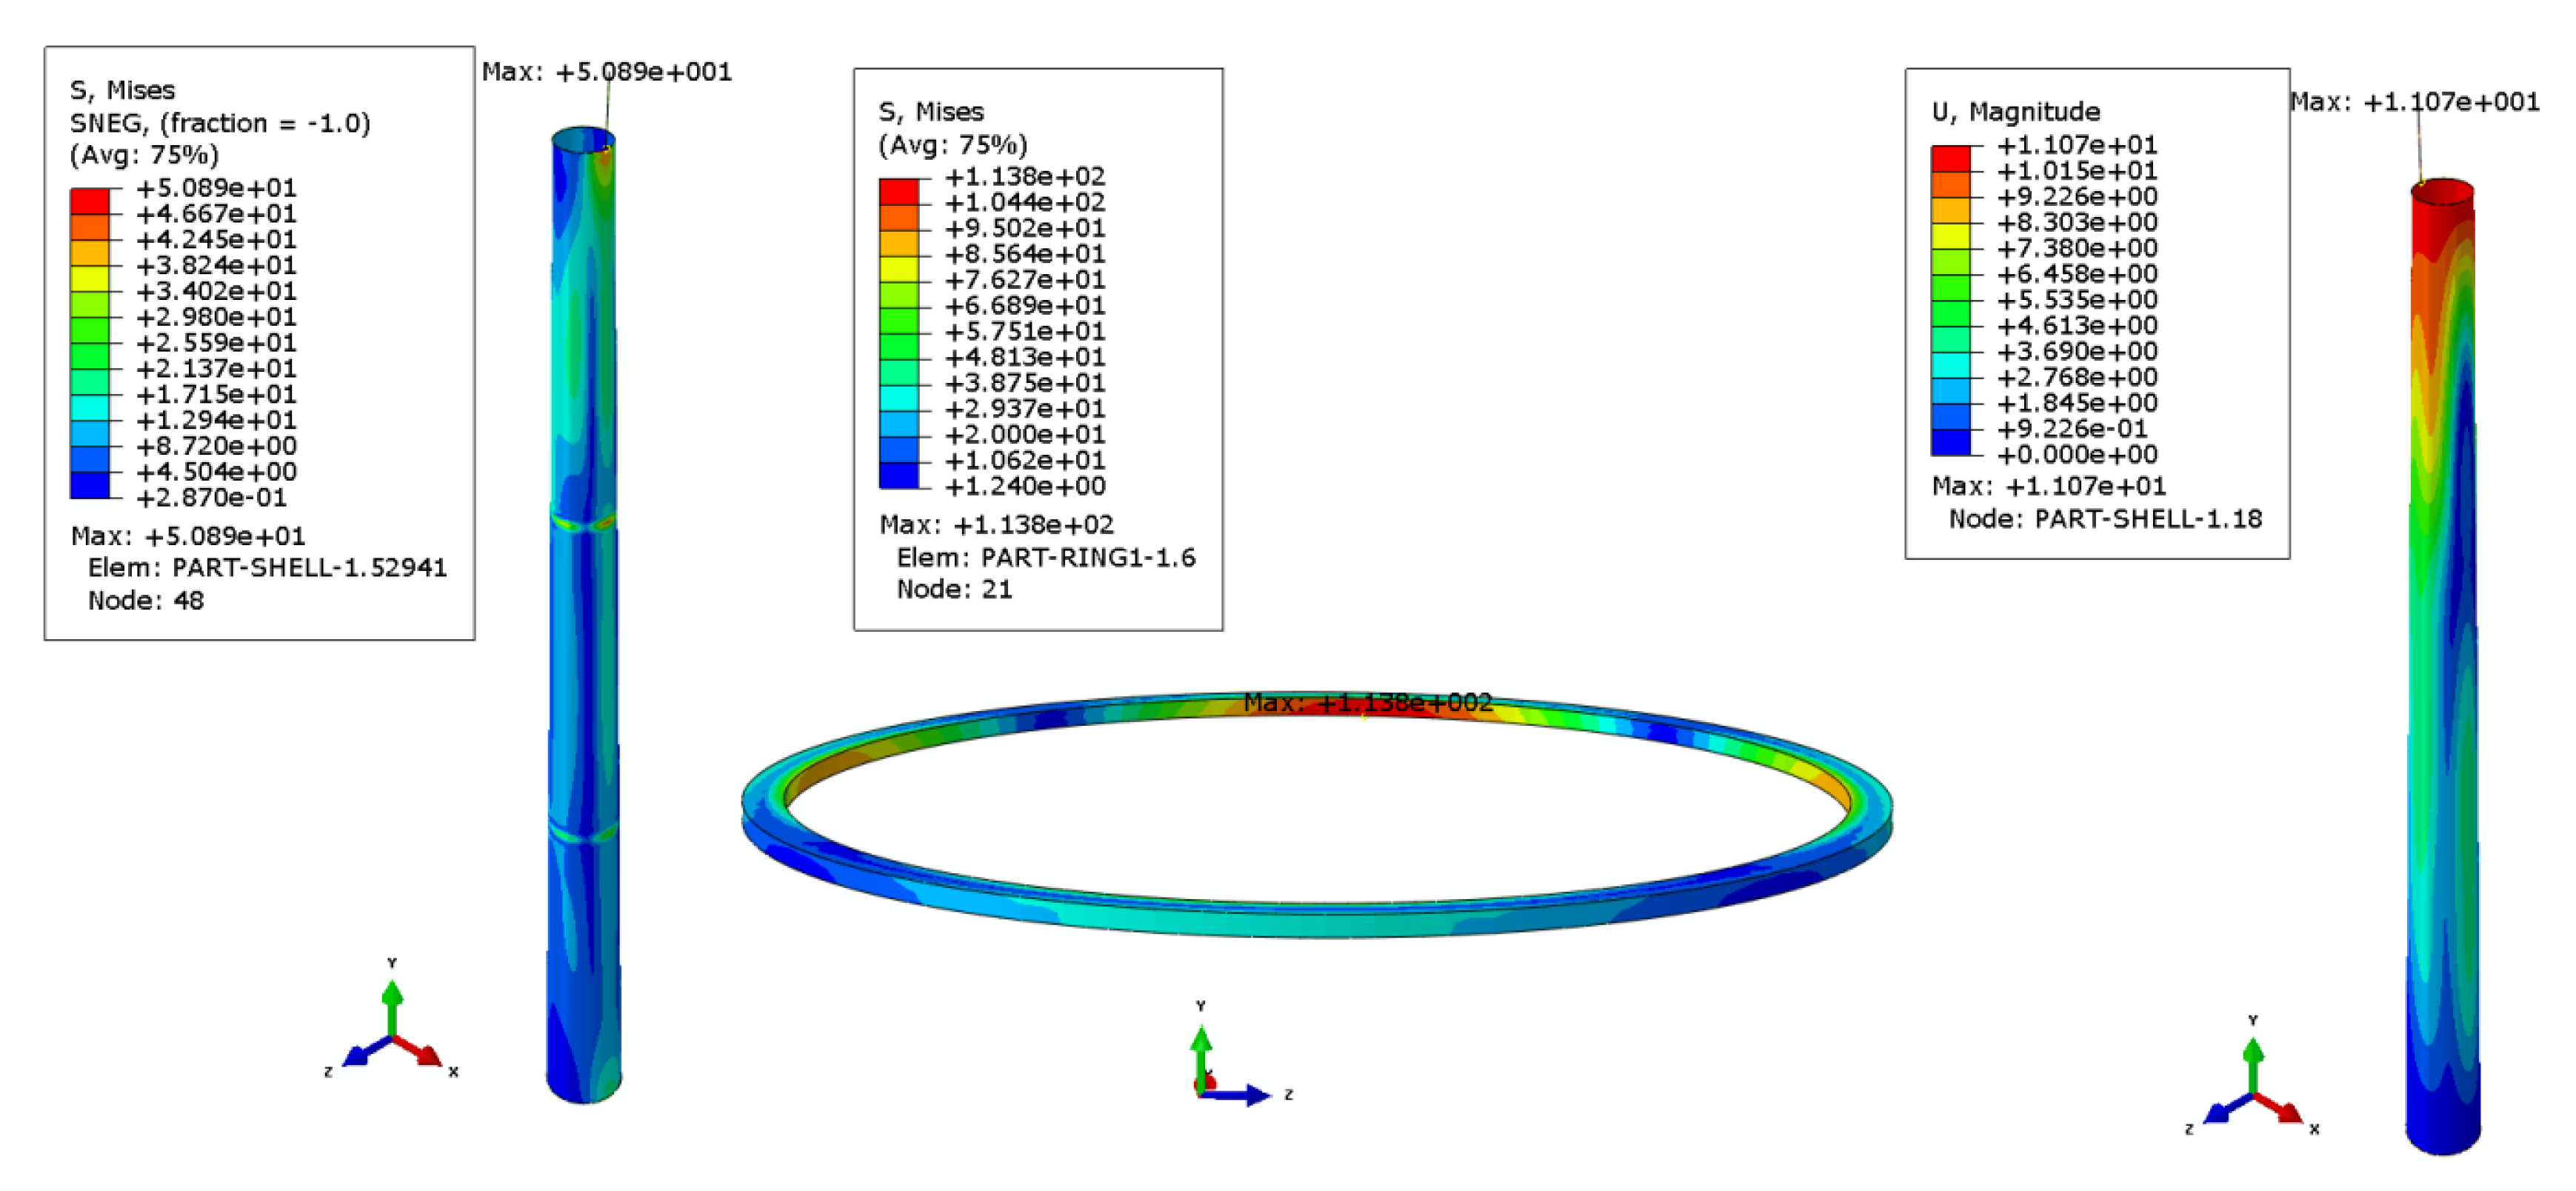
| TiiRiHi | 113.8 | 230.4 | 152.9 | 50.89 | 65.94 | 98.74 | 11.07 | 176.15 | 598.28 |
| TiiiRiHi | 76.1 | 154.9 | 113.7 | 31.30 | 57.17 | 91.45 | 8.47 | 157.8 | 555.10 |
| TivRiHi | 50.94 | 106.8 | 85.79 | 21.88 | 51.62 | 85.39 | 6.92 | 143.05 | 517.76 |
| TiRiiHi | 109.9 | 280.1 | 199.5 | 109.9 | 89.96 | 107.47 | 20.57 | 199.27 | 648.53 |
| TiiRiiHi | 72.09 | 194.4 | 147.5 | 49.1 | 64.75 | 98.65 | 11.07 | 176.04 | 598.07 |
| TiiiRiiHi | 52.58 | 136.2 | 110.7 | 30.47 | 56.91 | 91.42 | 8.46 | 157.75 | 554.91 |
| TivRiiHi | 37.84 | 96.71 | 85.379 | 21.53 | 51.49 | 85.38 | 6.91 | 142.97 | 517.58 |
| TiRiiiHi | 107.7 | 210.5 | 186.1 | 107.7 | 83.08 | 107.2 | 20.23 | 198.97 | 648.00 |
| TiiRiiiHi | 47.75 | 155.8 | 139.9 | 47.75 | 63.02 | 98.50 | 11.03 | 175.8 | 597.57 |
| TiiiRiiiHi | 33.61 | 114.7 | 106.4 | 29.70 | 56.47 | 91.35 | 8.43 | 157.55 | 554.44 |
| TivRiiiHi | 26.11 | 84.59 | 85.36 | 21.15 | 51.26 | 85.36 | 6.88 | 142.79 | 517.15 |
| TiRivHi | 106.7 | 171.8 | 173.0 | 106.7 | 76.84 | 106.9 | 20.05 | 198.66 | 647.43 |
| TiiRivHi | 47.14 | 132.5 | 131.6 | 47.14 | 62.37 | 98.35 | 10.99 | 175.55 | 597.02 |
| TiiiRivHi | 29.31 | 100.9 | 101.0 | 29.31 | 56.11 | 91.29 | 8.40 | 157.33 | 553.93 |
| TivRivHi | 20.92 | 76.45 | 85.35 | 20.92 | 51.07 | 85.35 | 6.86 | 142.61 | 516.68 |
| TiRiHii | 110.7 | 327.7 | 308.2 | 80.93 | 85.28 | 96.47 | 16.84 | 199.38 | 636.62 |
| TiiRiHii | 83.88 | 221.1 | 243.5 | 41.21 | 64.20 | 88.36 | 11.07 | 176.13 | 586.11 |
| TiiiRiHii | 60.39 | 151.6 | 195.7 | 27.33 | 57.09 | 81.64 | 8.47 | 157.82 | 542.93 |
| TivRiHii | 44.68 | 106.2 | 159.8 | 20.05 | 51.58 | 76.0 | 6.92 | 143.03 | 505.6 |
| TiRiiHii | 77.65 | 272.1 | 266.8 | 77.65 | 85.12 | 95.25 | 16.84 | 199.2 | 636.59 |
| TiiRiiHii | 53.36 | 195.5 | 215.4 | 39.09 | 63.56 | 87.50 | 11.06 | 175.98 | 585.99 |
| TiiiRiiHii | 41.83 | 140.2 | 175.9 | 25.95 | 56.76 | 81.02 | 8.46 | 157.7 | 542.77 |
| TivRiiHii | 31.83 | 101.3 | 145.3 | 19.2 | 51.41 | 75.55 | 6.91 | 142.92 | 505.42 |
| TiRiiiHii | 75.2 | 187.3 | 211.5 | 75.20 | 76.53 | 93.51 | 16.71 | 198.84 | 636.33 |
| TiiRiiiHii | 37.4 | 143.6 | 175.1 | 37.4 | 62.58 | 86.23 | 10.99 | 175.67 | 585.64 |
| TiiiRiiiHii | 27.71 | 109.2 | 146.1 | 24.73 | 56.23 | 80.09 | 8.41 | 157.44 | 542.38 |
| TivRiiiHii | 22.68 | 82.66 | 123.2 | 18.36 | 51.13 | 74.85 | 6.87 | 142.69 | 505.02 |
| TiRivHii | 74.24 | 154.9 | 176.6 | 74.24 | 69.43 | 92.3 | 16.62 | 198.46 | 635.95 |
| TiiRivHii | 36.77 | 122.5 | 148.5 | 36.77 | 61.82 | 85.33 | 10.92 | 175.36 | 585.23 |
| TiiiRivHii | 24.24 | 95.18 | 125.9 | 24.24 | 55.8 | 79.41 | 8.36 | 157.17 | 541.96 |
| TivRivHii | 17.98 | 73.28 | 107.5 | 17.98 | 50.89 | 74.33 | 6.83 | 142.46 | 504.61 |
| TiRiHiii | 78.00 | 306.9 | 290.6 | 62.69 | 66.65 | 95.81 | 16.77 | 195.28 | 636.61 |
| TiiRiHiii | 63.39 | 230.4 | 232.7 | 34.37 | 58.26 | 87.9 | 11.05 | 172.09 | 586.07 |
| TiiiRiHiii | 50.34 | 175.0 | 188.8 | 24.01 | 51.83 | 81.32 | 8.46 | 153.83 | 542.87 |
| TivRiHiii | 40.2 | 134.7 | 155.1 | 18.35 | 46.73 | 75.76 | 6.91 | 139.07 | 505.52 |
| TiRiiHiii | 59.53 | 214.9 | 241.4 | 59.53 | 63.97 | 94.21 | 16.73 | 195.12 | 636.48 |
| TiiRiiHiii | 39.9 | 169.8 | 197.8 | 32.27 | 56.54 | 86.76 | 11.02 | 171.94 | 585.82 |
| TiiiRiiHiii | 33.34 | 134.8 | 163.5 | 22.49 | 50.66 | 80.49 | 8.44 | 153.69 | 542.58 |
| TivRiiHiii | 26.91 | 107.7 | 136.3 | 17.29 | 45.92 | 75.15 | 6.89 | 138.94 | 505.22 |
| TiRiiiHiii | 57.29 | 137.0 | 185.6 | 57.29 | 61.25 | 92.11 | 16.51 | 194.79 | 635.9 |
| TiiRiiiHiii | 30.66 | 113.0 | 156.3 | 30.66 | 54.59 | 85.19 | 10.90 | 171.64 | 585.18 |
| TiiiRiiiHiii | 21.25 | 93.31 | 132.5 | 21.25 | 49.25 | 79.31 | 8.35 | 153.42 | 541.92 |
| TivRiiiHiii | 18.09 | 77.38 | 112.9 | 16.34 | 44.89 | 74.26 | 6.83 | 138.7 | 504.56 |
| TiRivHiii | 56.29 | 101.4 | 147.7 | 56.29 | 59.71 | 90.75 | 16.35 | 194.44 | 635.18 |
| TiiRivHiii | 29.93 | 85.35 | 126.6 | 29.93 | 53.44 | 84.15 | 10.79 | 171.34 | 584.46 |
| TiiiRivHiii | 20.66 | 71.96 | 109.0 | 20.66 | 48.39 | 78.50 | 8.28 | 153.16 | 541.21 |
| TivRivHiii | 15.86 | 60.83 | 94.25 | 15.86 | 44.24 | 73.64 | 6.77 | 138.47 | 503.9 |
| TiRiHiv | 52.42 | 274.9 | 279.5 | 52.42 | 65.68 | 95.20 | 16.48 | 195.24 | 636.6 |
| TiiRiHiv | 38.68 | 211.1 | 225.0 | 27.41 | 57.71 | 87.47 | 10.80 | 172.05 | 586.00 |
| TiiiRiHiv | 32.20 | 163.3 | 183.4 | 18.15 | 51.46 | 81.01 | 8.22 | 153.79 | 542.77 |
| TivRiHiv | 26.68 | 127.6 | 151.1 | 13.29 | 46.48 | 75.54 | 6.67 | 139.04 | 505.43 |
| TiRiiHiv | 49.88 | 188.0 | 224.0 | 49.88 | 62.92 | 93.32 | 16.38 | 195.03 | 636.34 |
| TiiRiiHiv | 25.94 | 151.6 | 186.0 | 25.94 | 55.81 | 86.11 | 10.74 | 171.85 | 585.64 |
| TiiiRiiHiv | 19.79 | 122.6 | 155.6 | 17.15 | 50.15 | 80.01 | 8.17 | 153.62 | 542.38 |
| TivRiiHiv | 16.94 | 99.54 | 131.1 | 12.57 | 45.56 | 74.79 | 6.63 | 138.88 | 505.02 |
| TiRiiiHiv | 48.04 | 114.5 | 159.3 | 48.04 | 60.13 | 90.98 | 16.06 | 194.58 | 635.41 |
| TiiRiiiHiv | 24.78 | 96.26 | 136.4 | 24.78 | 53.77 | 84.34 | 10.59 | 171.46 | 584.68 |
| TiiiRiiiHiv | 16.34 | 80.96 | 117.2 | 16.34 | 48.64 | 78.66 | 8.09 | 153.27 | 541.43 |
| TivRiiiHiv | 11.99 | 68.47 | 101.2 | 11.99 | 44.44 | 73.76 | 6.58 | 138.56 | 504.1 |
| TiRivHiv | 47.17 | 86.74 | 128.1 | 47.17 | 58.63 | 89.57 | 15.83 | 194.13 | 634.32 |
| TiiRivHiv | 24.26 | 74.4 | 111.2 | 24.26 | 52.63 | 83.23 | 10.46 | 171.07 | 583.64 |
| TiiiRivHiv | 15.99 | 63.89 | 96.80 | 15.99 | 47.77 | 77.8 | 8.0 | 152.92 | 540.44 |
| TivRivHiv | 11.72 | 54.96 | 84.56 | 11.72 | 43.78 | 73.09 | 6.52 | 138.26 | 503.17 |
References
- Martíneza, E.; Latorre-Bielb, J.I.; Jiménezc, E.; Sanza, F.; Blancoa, J. Life cycle assessment of a wind farm repowering process. Renew. Sustain. Energy Rev. 2018, 93, 260–271. [Google Scholar] [CrossRef]
- Buchsbaum, L.; Patel, S. Wind turbine repowering is on the horizon. Power 2016, 160, 52–55. [Google Scholar]
- Tziavos, N.; Hemida, H.; Metje, N.; Baniotopoulos, C. Non-linear Finite Element Analysis of Grouted Connections for Offshore Monopile Wind Turbines. Ocean Eng. 2018, 171, 633–645. [Google Scholar] [CrossRef] [Green Version]
- Tziavos, N.I.; Hemida, H.; Dirar, S.; Papaelias, M.; Metje, N.; Baniotopoulos, C.C. Structural health monitoring of grouted connections for offshore wind turbines by means of acoustic emission: An experimental study. Renew. Energy 2019, 147, 130–140. [Google Scholar] [CrossRef]
- Li, Z.-Q.; Chen, S.-J.; Ma, H.; Feng, T. Design defect of wind turbine operating in typhoon activity zone. Eng. Fail. Anal. 2013, 27, 165–172. [Google Scholar] [CrossRef]
- Kilic, G.; Unluturk, M.S. Testing of wind turbine towers using wireless sensor network and accelerometer. Renew. Energy 2015, 75, 318–325. [Google Scholar] [CrossRef]
- Binh, L.V.; Ishihara, T.; Phuc, P.V.; Fujino, Y. A peak factor for non-Gaussian response analysis of wind turbine tower. J. Wind Eng. Ind. Aerodyn. 2008, 96, 2217–2227. [Google Scholar] [CrossRef]
- Kim, D.H.; Lee, S.G.; Lee, I.K. Seismic fragility analysis of 5 MW offshore wind turbine. Renew. Energy 2014, 65, 250–256. [Google Scholar] [CrossRef]
- Tondini, N.; Hoang, V.L.; Demonceau, J.F.; Franssen, J.M. Experimental and numerical investigation of high-strength steel circular columns subjected to fire. J. Constr. Steel Res. 2013, 80, 57–81. [Google Scholar] [CrossRef]
- Van der Woude, C.; Narasimhan, S. A study on vibration isolation for wind turbine structures. Eng. Struct. 2014, 60, 223–234. [Google Scholar] [CrossRef]
- Tran, A.T.; Veljkovic, M.; Rebelo, C.; Simões da Silva, L. Resistance of door openings in towers for wind turbines. In Proceedings of the Third South-East European Conference on Computational Mechanics 2013, Kos Island, Greece, 12–14 June 2013. [Google Scholar]
- Do, T.Q.; Mahmoud, H.; van de Lindt, J.W. Fatigue life of wind turbine tower bases throughout Colorado. J. Perfor. Constr. Facil. 2014, 29, 04014109. [Google Scholar] [CrossRef]
- Schneider, W.; Zahlten, W. Load-bearing behaviour and structural analysis of slender ring-stiffened cylindrical shells under quasi-static wind load. J. Constr. Steel Res. 2004, 60, 125–146. [Google Scholar] [CrossRef]
- Valamanesh, V.; Myers, A.T. Aerodynamic Damping and Seismic Response of Horizontal Axis Wind Turbine Towers. J. Struct. Eng. 2014, 140, 04014090. [Google Scholar] [CrossRef]
- Guo, L.; Yang, S.; Jiao, H. Behavior of thin-walled circular hollow section tubes subjected to bending. Thin-Walled Struct. 2013, 73, 281–289. [Google Scholar] [CrossRef] [Green Version]
- Ghanbari Ghazijahani, T.; Jiao, H.; Holloway, D. Structural behavior of shells with different cutouts under compression: An experimental study. J. Constr. Steel Res. 2015, 105, 129–137. [Google Scholar] [CrossRef]
- Sabouri-Ghomi, S.; Kharrazi, M.H.K.; Javidan, P. Effect of stiffening rings on buckling stability of R.C. hyperbolic cooling towers. Thin-Walled Struct. 2006, 44, 152–158. [Google Scholar] [CrossRef]
- Perelmuter, A.; Yurchenko, V. Parametric optimization of steel towers of high-power wind turbines. 11th international conference on modern building materials, structures and techniques, MBMST. Procedia Eng. 2013, 57, 895–905. [Google Scholar] [CrossRef] [Green Version]
- Sim, H.-B.; Prowell, I.; Elgamal, A.; Uang, C.-M. Flexural tests and associated study of a full-scale 65-kW wind turbine tower. J. Struct. Eng. 2014, 140, 04013110. [Google Scholar] [CrossRef]
- Hu, Y.; Baniotopoulos, C.C.; Yang, J. Effect of internal stiffening rings and wall thickness on the structural response of steel wind turbine towers. Eng. Struct. 2014, 81, 148–161. [Google Scholar] [CrossRef]
- Negm, H.M.; Maalawi, K.Y. Structural design optimization of wind turbine towers. Comput. Struct. 2000, 74, 649–666. [Google Scholar] [CrossRef]
- Shi, G.; Jiang, X.; Zhou, W.; Chan, T.-M.; Zhang, Y. Experimental study on column buckling of 420MPa high strength steel welded circular tubes. J. Constr. Steel Res. 2014, 100, 71–81. [Google Scholar] [CrossRef]
- Zhu, J.H.; Young, B. Design of cold-formed steel oval hollow section columns. J. Constr. Steel Res. 2012, 71, 26–37. [Google Scholar] [CrossRef]
- Karpat, F. A virtual tool for minimum cost design of a wind turbine tower with ring stiffeners. Energies 2013, 6, 3822–3840. [Google Scholar] [CrossRef] [Green Version]
- Chen, J.; Xu, Y.; Li, J. Numerical investigation of the strengthening method by circumferential prestressing to improve the fatigue life of embedded-ring concrete foundation for onshore wind turbine tower. Energies 2020, 13, 533. [Google Scholar] [CrossRef] [Green Version]
- Ding, H.; Feng, Z.; Zhang, P.; Le, C.; Guo, Y. Floating performance of a composite bucket foundation with an offshore wind tower during transportation. Energies 2020, 13, 882. [Google Scholar] [CrossRef] [Green Version]
- ABAQUS/Standard and ABAQUS/Explicit-Version 6.8-1. In Abaqus Theory Manual, Dassault System; Dassault System: Paris, France, 2008.
- Rebelo, C.; Veljkovic, M.; Simões da Silva, L.; Simões, R.; Henriques, J. Structural monitoring of a wind turbine steel tower Part I system description and calibration. Wind Struct. 2012, 15, 285–299. [Google Scholar] [CrossRef]
- Rebelo, C.; Veljkovic, M.; Matos, R.; Simões da Silva, L. Structural monitoring of a wind turbine steel tower Part II monitoring results. Wind Struct. 2012, 15, 301–311. [Google Scholar] [CrossRef]
- ENV 1991-01-04: Actions on Structures; CEN: Brussels, Belgium, 1991.
- Lavassas, I.; Nikolaidis, G.; Zervas, P.; Efthimiou, E.; Doudoumis, I.N.; Baniotopoulos, C.C. Analysis and design of the prototype of a steel 1-MW wind turbine tower. Eng. Struct. 2003, 25, 1097–1106. [Google Scholar] [CrossRef]
- Baniotopoulos, C.C.; Borri, C.; Stathopoulos, T. (Eds.) Environmental Wind Engineering and Design of Wind Energy Structures; Springer: New York, NY, USA, 2010. [Google Scholar]


| Size of Elements (mm) | Max. von Mises Stress (MPa) | Max. Horizontal Sway (mm) |
|---|---|---|
| 400 | 102.64 | 575.13 |
| 300 | 103.9 | 572.8 |
| 200 | 102 | 570.7 |
| 100 | 101.6 | 568.5 |
| 80 | 101.6 | 568.5 |
| 50 | 101.6 | 568.5 |
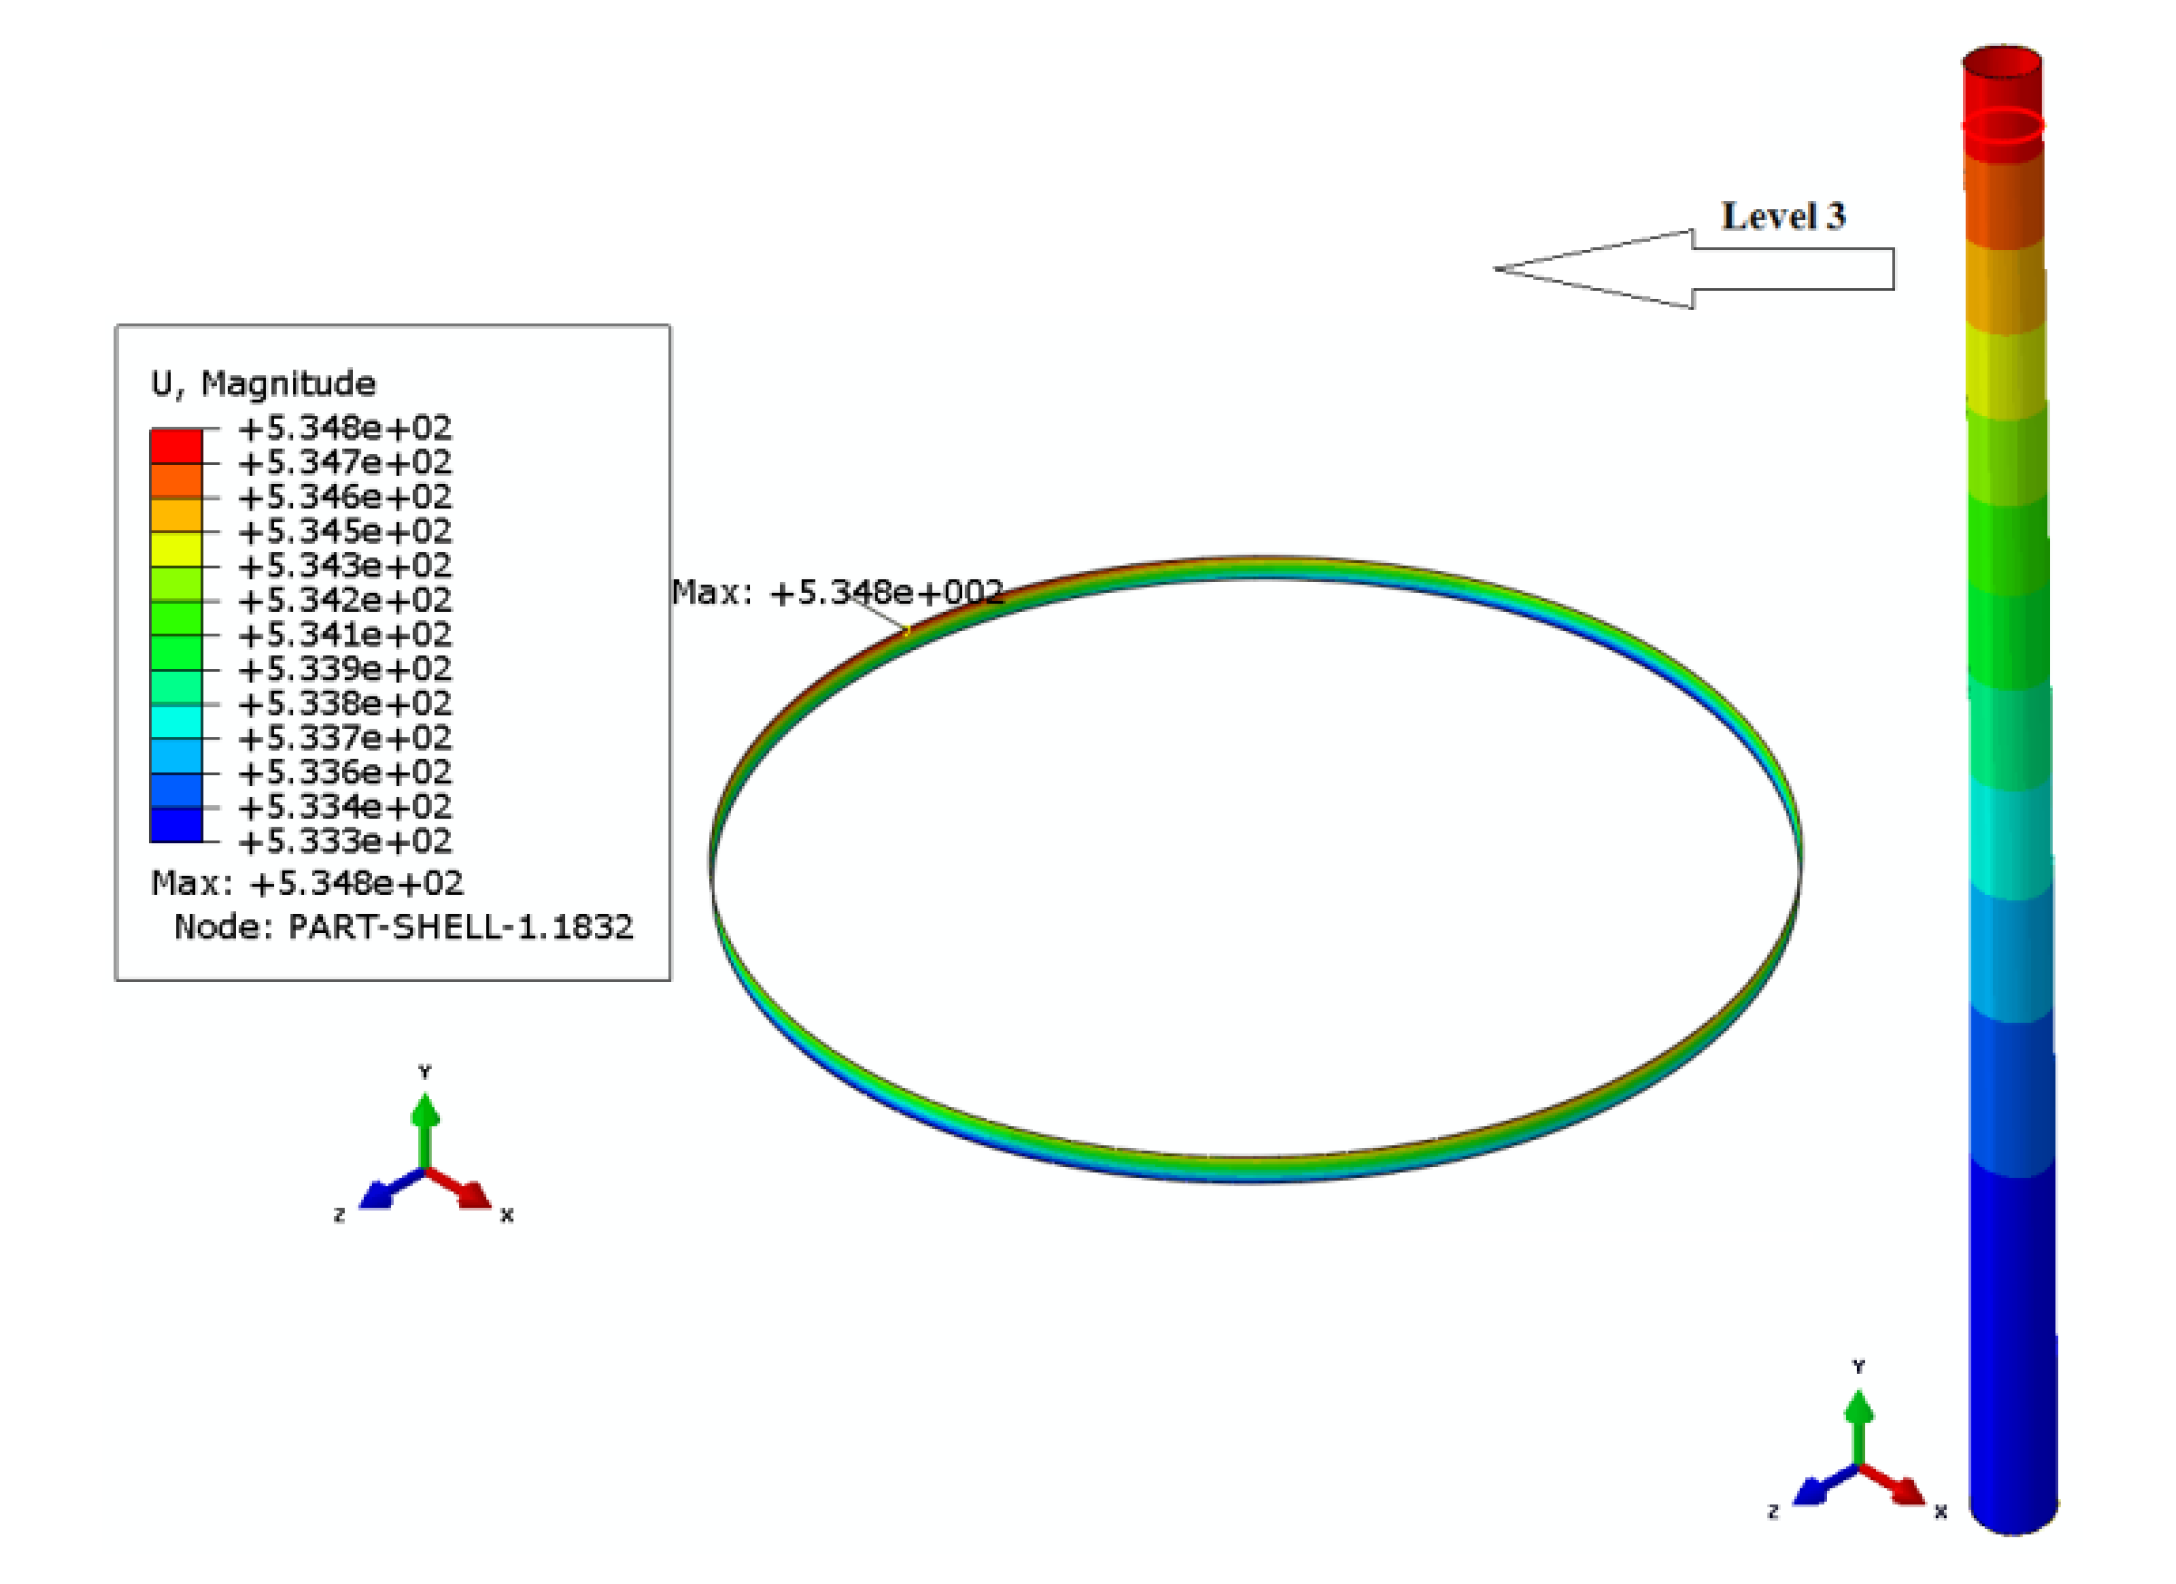
| Values | Numerical Results | Experimental Results | Errors |
|---|---|---|---|
| Stress at level 0 | 72.99 MPa | 73 MPa | 0.01% |
| Stress at level 1 | 66.41 MPa | 68 MPa | 1.96% |
| Sway at level 3 | 534.8 mm | 534.23 mm | 0.1% |
| 50 m Towers | Height Range of the Towers | Mid-Section Width-to-Thickness Ratio of Rings | Spacing of Rings (m) | Thickness of Rings (mm) | |||
|---|---|---|---|---|---|---|---|
| 0–33.334 m | 33.334 m–50 m | ||||||
| Thickness | Thickness | ||||||
| Ti | 15 mm | 5 mm | Ri | 0.5 | Hi | 16.667 | 50 |
| Tii | 20 mm | 10 mm | Rii | 1 | Hii | 10 | 100 |
| Tiii | 25 mm | 15 mm | Riii | 2 | Hiii | 6.25 | 200 |
| Tiv | 30 mm | 20 mm | Riv | 3 | Hiv | 4.167 | 300 |
| 150 m Towers | Height Range of the Towers | Ratio of Mid-Section Width-to-Thickness of Rings | Spacing of Rings (m) | Thickness of Rings (mm) | ||||
|---|---|---|---|---|---|---|---|---|
| 0 to 50 m | 50 to 100 m | 100 to 150 m | ||||||
| Thickness | Thickness | Thickness | ||||||
| Ti | 40 mm | 30 mm | 25 mm | Ri | 0.5 | Hi | 18.75 | 50 |
| Tii | 45 mm | 35 mm | 30 mm | Rii | 1 | Hii | 15 | 100 |
| Tiii | 50 mm | 40 mm | 35 mm | Riii | 2 | Hiii | 11.544 | 200 |
| Tiv | 55 mm | 45 mm | 40 mm | Riv | 3 | Hiv | 9.375 | 300 |
| 250 m Towers | Height Range of the Towers | Ratio of Mid-Section Width-to-Thickness of Rings | Spacing of Rings (m) | Thickness of Rings (mm) | ||||
|---|---|---|---|---|---|---|---|---|
| 0 to 100 m | 100 to 200 m | 200 to 250 m | ||||||
| Thickness | Thickness | Thickness | ||||||
| Ti | 60 mm | 50 mm | 45 mm | Ri | 0.5 | Hi | 25 | 50 |
| Tii | 65 mm | 55 mm | 50 mm | Rii | 1 | Hii | 16.667 | 100 |
| Tiii | 70 mm | 60 mm | 65 mm | Riii | 2 | Hiii | 11.364 | 200 |
| Tiv | 75 mm | 65 mm | 60 mm | Riv | 3 | Hiv | 8.612 | 300 |
© 2020 by the authors. Licensee MDPI, Basel, Switzerland. This article is an open access article distributed under the terms and conditions of the Creative Commons Attribution (CC BY) license (http://creativecommons.org/licenses/by/4.0/).
Share and Cite
Hu, Y.; Yang, J.; Baniotopoulos, C. Repowering Steel Tubular Wind Turbine Towers Enhancing them by Internal Stiffening Rings. Energies 2020, 13, 1538. https://doi.org/10.3390/en13071538
Hu Y, Yang J, Baniotopoulos C. Repowering Steel Tubular Wind Turbine Towers Enhancing them by Internal Stiffening Rings. Energies. 2020; 13(7):1538. https://doi.org/10.3390/en13071538
Chicago/Turabian StyleHu, Yu, Jian Yang, and Charalampos Baniotopoulos. 2020. "Repowering Steel Tubular Wind Turbine Towers Enhancing them by Internal Stiffening Rings" Energies 13, no. 7: 1538. https://doi.org/10.3390/en13071538
APA StyleHu, Y., Yang, J., & Baniotopoulos, C. (2020). Repowering Steel Tubular Wind Turbine Towers Enhancing them by Internal Stiffening Rings. Energies, 13(7), 1538. https://doi.org/10.3390/en13071538