Article

Emission Characteristics of Ammonia at Bituminous Coal Power Plant

1
Chang Research Center, Sejong University, Seoul 05006, Korea
2
Cooperate Course for Climate Change, Sejong University, Seoul 05006, Korea
3
Department of Earth and Environmental Sciences, Sejong University, Seoul 05006, Korea
*
Author to whom correspondence should be addressed.
Energies 2020, 13(7), 1534; https://doi.org/10.3390/en13071534
Submission received: 21 February 2020 / Revised: 11 March 2020 / Accepted: 19 March 2020 / Published: 25 March 2020
(This article belongs to the Section B: Energy and Environment)

Abstract

:
This study developed a NH3 emission factor for bituminous coal power plants in South Korea in order to investigate the NH3 emission characteristics. The NH3 concentration analysis results showed that emissions from the selected bituminous coal power plants were in the range of 0.21–0.99 ppm, and that the difference in NH3 concentration was affected by NOx concentration. The NH3 emission factor was found to be 0.0029 kg NH3/ton, which demonstrated that the difference in the values obtained from the research conducted in South Korea was lower than the difference in the emission factor provided by the U.S. EPA, which is currently applied in the statistics of South Korea. NH3 emissions were compared by using the NH3 emission factor developed in this study alongside the EPA’s NH3 emission factor that is currently applied in South Korea’s statistics; the difference was found to be 206 NH3 ton/year. This implies that an emission factor that reflects the national characteristics of South Korea needs to be developed. The uncertainty range of the NH3 emission factor developed in this study was between −6.9% and +10.34% at a 95% confidence level.

1. Introduction

In 2016, Ultrafine (≤2.5) Particulate Matter (PM2.5) concentration in South Korea was 26 µg/m3, which was higher than that of Europe, the United States, and Japan. From 1990 to 2015, the average PM2.5 concentration in South Korea was 29 µg/m3, which was the highest among all the member countries of the Organization for Economic Co-operation and Development (OECD) except Turkey. Moreover, South Korea fared worse than Vietnam, Mongolia, Japan (13 µg/m3), and Singapore [1].
One of major causes of PM2.5 is the increase in secondary sources of particulate matters (PM), such as NOx, SOx, VOCs, and NH3 [2,3,4,5]. In South Korea, NOx and SOx are controlled by the “Air Pollutant Emission Limit Regulation”, with many studies using it for research [6,7,8]. However, few studies have focused on the emission factor and emission estimation of NH3 (ammonia).
Among the secondary sources of PM, emission estimation and emission sources of NH3 are important with respect to air pollution management because emission reduction of NH3 is closely related to the changes in PM2.5 concentration. A previous study analyzed PM2.5 concentration changes in South Korea based on the reduction in air pollutants (NOx, SOx, NH3 and PM) using an air quality model (CMAQ) and concluded that a reduction in NH3 emissions leads to a greater reduction in PM2.5 concentration as compared to any other pollutant [9,10]. Accordingly, there has been an increased focus on research related to NH3 emission sources and emission estimation [11].
South Korea constructs NH3 emission inventories using various categories, including energy industry combustion, non-industry combustion, manufacturing industry combustion, production process, off-road mobile sources, waste treatment, agriculture, other area sources and biomass combustion. In the case of energy industry combustion, bituminous coal power plants comprise the majority of power plants [12].
The NH3 emission factor of bituminous coal power plants is difficult to obtain for South Korea because the U.S. Environmental Protection Agency (EPA) value for the year 1994 is used. Therefore, this study aims to analyze the NH3 emission of bituminous coal power plants in South Korea and conduct research on the emission characteristics, including the development of an emission factor and an analysis of uncertainty. Furthermore, the differences in NH3 emissions are examined by using the NH3 emission factor developed for this study, which reflects the characteristics of South Korea, the EPA’s value currently applied in South Korea, and an emission factor value developed previously in South Korea.

2. Method

2.1. Selection of Objective Facilities

This study collected NH3 samples from three bituminous coal power plants to investigate their NH3 emission characteristics. Table 1 shows the power generation capacity, fuel consumption, and frequency of sampling conducted at the power plants. Sampling was performed at least three times at each power plant, with ten or more samples collected.

2.2. Analysis of Ammonia at Bituminous Coal Power Plant

This study employed the indophenol method presented in the “Odor Analysis Method” and “Standard Methods for the Measurements of Air Pollution” of South Korea to measure the NH3 emission concentration of bituminous coal power plants [13]. The indophenol method adds phenol-sodium nitroprusside solution and sodium hypochlorite solution to the sample solution for analysis and measures the absorbance of indophenols, which reacts with ammonium ions, to quantify NH3. To collect NH3 samples, an ammonia absorbing solution (50 mL 0.5% boric acid solution) was put into two 50 mL capacity flasks, and a mini pump was used to pump in 80 L of emission gas for 20 min at 4 L/min. A moisture absorption bottle containing silica gel was installed in front of the NH3 sampling device to remove the moisture in the gas emitted from the power plants. Figure 1 shows a schematic diagram of NH3 sample collection. Furthermore, a spectrophotometer (Shimadzu 17A, Japan) was used to measure the absorbance of the ammonia absorbing solution at a wavelength of 640 nm.

2.3. Development of NH3 Emission Factor

The NH3 emission factor calculation is shown in Equation (1). CleanSYS data from the three bituminous power plants were used for the flowrate data required in the development of an NH3 emission factor, and one-day cumulative flowrate data were used for the flowrate. In the case of fuel usage amount, the data were obtained from the power plants.
E F N H 3 = [ C N H 3 × M w V m × Q d a y × 10 6 ] / F C d a y
where E F is emission factor (kg NH3/ton); C N H 3 is NH3 concentration in exhaust gas (ppm); M w is molecular weight of NH3 (constant) = 17.031 (g/mol); V m is one mole ideal gas volume in standardized condition (constant) = 22.4 (10−3 m3/mol); Q d a y is daily accumulated flow rate (Sm3/day) (based on dry combustion gas); and F C d a y is daily fuel consumption (ton/day).

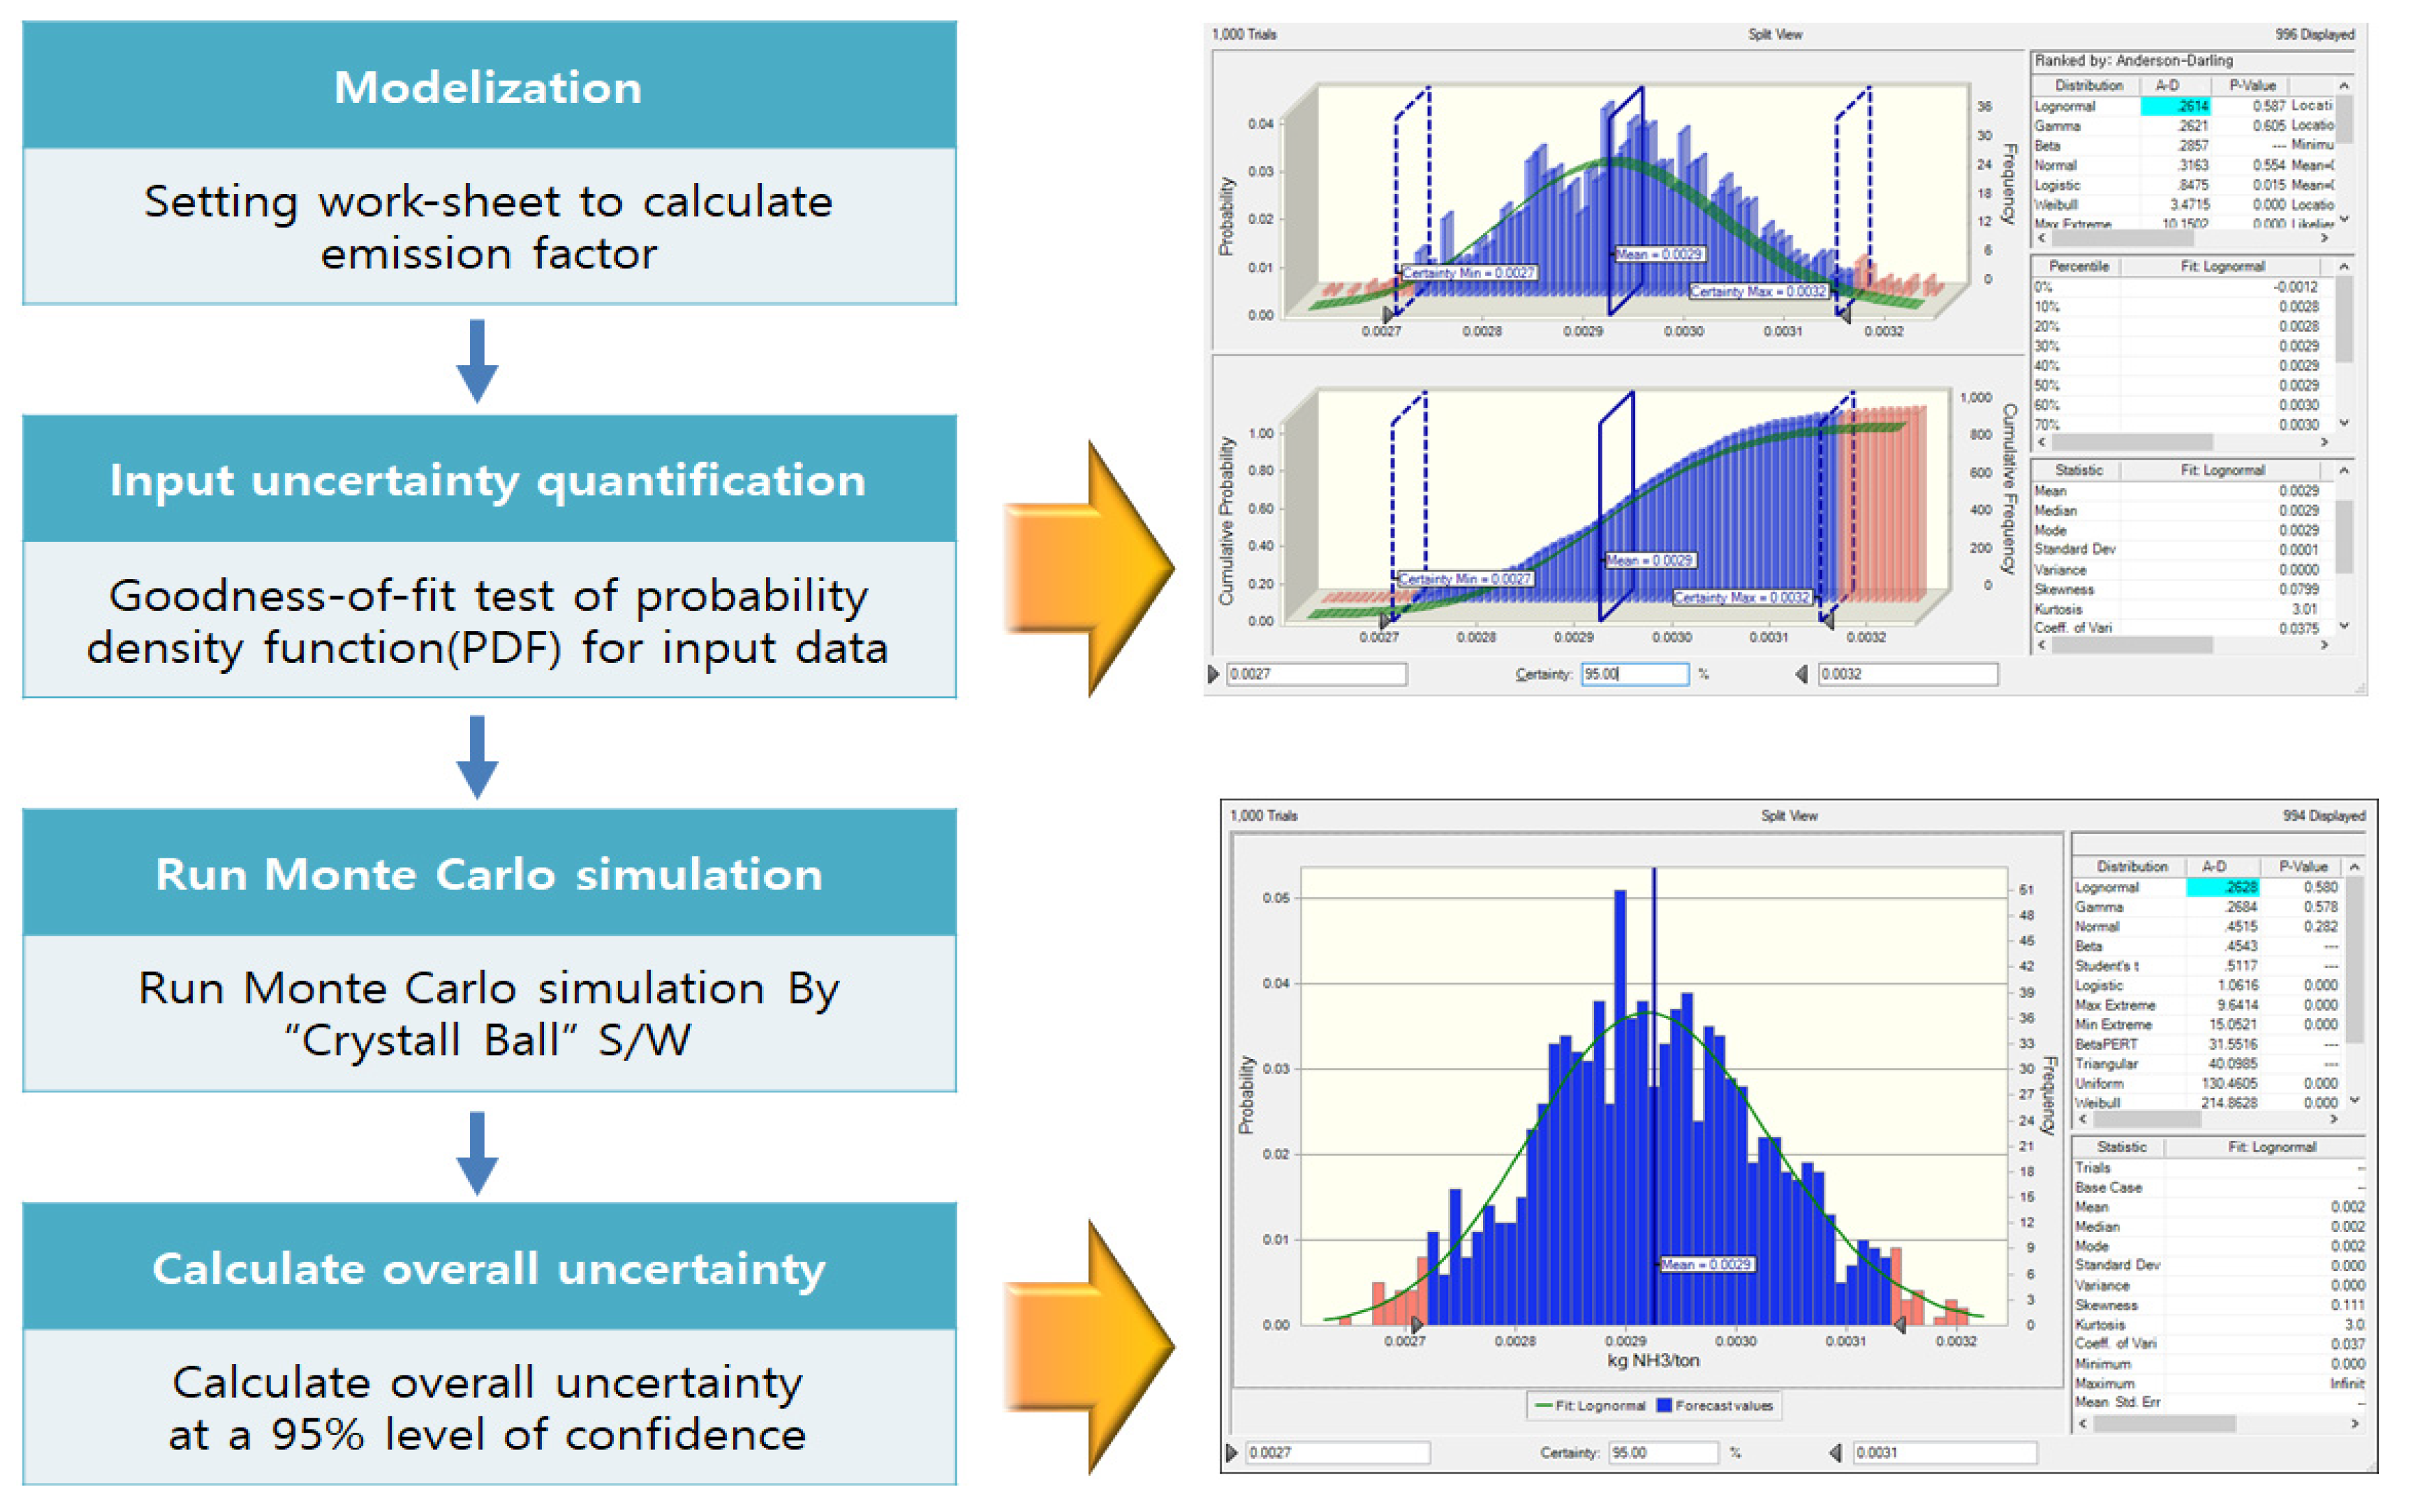
2.4. Uncertainty Analysis by Monte Carlo Simulation

This study used Monte Carlo simulations to estimate the uncertainty of the NH3 emission factor and performed the analysis in four stages, as shown in Figure 2 [14,15]. First, in the model selection stage, a NH3 emission factor estimation worksheet was constructed. Second, the probability density functions of input variables needed for the development of the NH3 emission factor were tested through fitness tests. The level of significance was set to 5% for the hypothesis test, and the probability density functions were calculated through the fitness tests using the data required for NH3 emission factor development, such as NH3 emission concentration, emission flowrate, and low calorific value of fuel. Third, when performing the Monte Carlo simulations, random sampling simulations were performed using a “Crystal Ball”. Fourth, the uncertainty range of 95% confidence interval was calculated through the simulation results.
“Crystal Ball” constructs the probability density function of the emission factor as the result of each calculation performed through an iterative process using simulation. It also gives a range of 95% confidence intervals (±   Z a / 2 ) in the generated emission factors. We can estimate the uncertainty through that range.

3. Result and Discussion

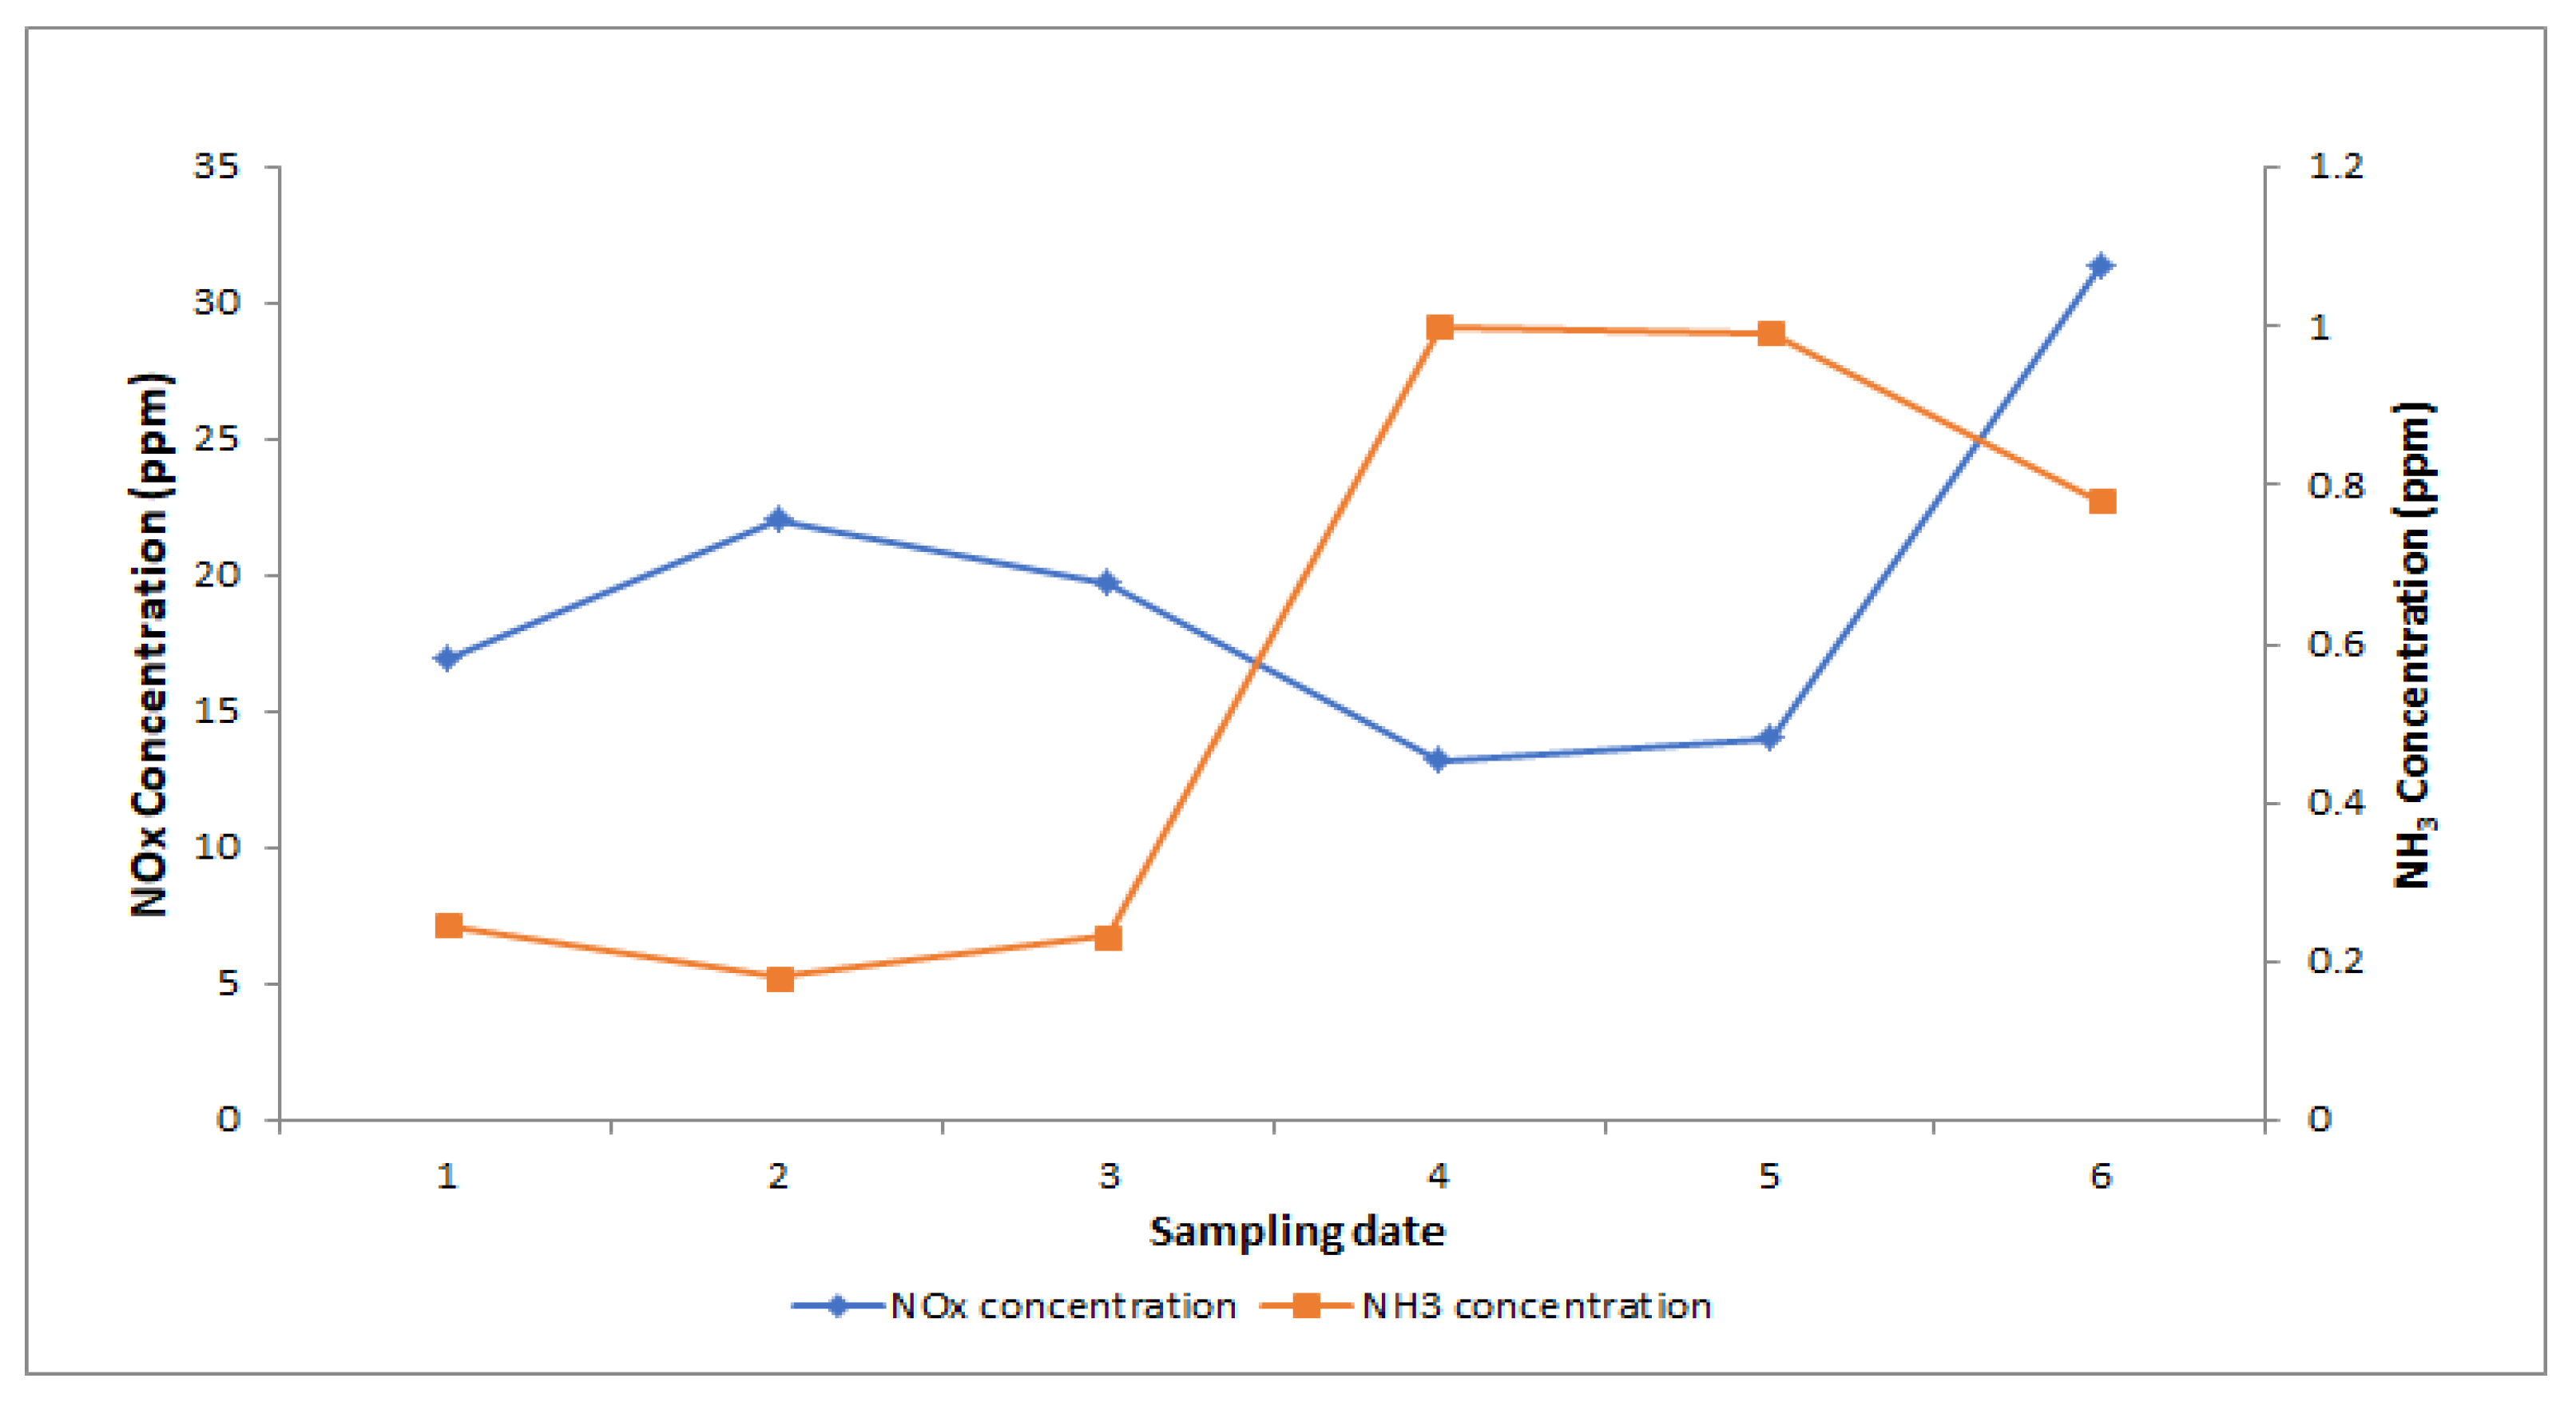
3.1. Characteristics of NH3 Emission

Table 2 shows the results of the NH3 concentration analysis for three bituminous coal power plants. The mean NH3 concentration of bituminous coal power plant A was 0.21 ppm, with a standard deviation of 0.14 ppm. The NH3 concentration of bituminous coal power plant C was 0.26 ppm, which showed a similar concentration band as the bituminous coal power plant A. Moreover, it showed a standard deviation of 0.21 ppm, which was higher than that of the bituminous coal power plant A. The NH3 concentration of bituminous coal power plant B was 0.99 ppm, which was approximately five times higher than that of bituminous coal power plants A and C, and the standard deviation was 0.56 ppm. High NH3 concentration exhibited by the bituminous coal power plant B was related to NOx concentrations [16]. In the case of coal-fired power plants, NH3 is injected in the SCR (Selective Catalytic Reduction) in order to reduce NOx concentrations; NH3 that does not completely react is emitted through the final emission outlet. Therefore, the NH3 concentration emitted through the final emission outlet will be high in proportion to the amount of NH3 injected to reduce NOx concentrations. To confirm this, a comparison of the NOx data acquired during the measurement period from the three selected bituminous coal power plants was conducted. The results demonstrated that the NOx concentration of power plant A (20 ppm) and the NOx concentration of Unit No. 6 of power plant C (23 ppm) were higher than that of power plant B (14 ppm). Therefore, it was estimated that the NH3 concentration of power plant B was high because a large amount of NH3 was injected to reduce its NOx concentration.
The correlation of NH3 concentration and NOx concentration was examined in detail, using the daily average NH3 concentration and the daily average NOx concentration of the selected power plants, as shown in Figure 3. The analysis revealed that as the NH3 concentrations decreased, the NOx concentrations increased, thus exhibiting an inversely proportional relationship. Therefore, as the amount of NH3 was increased for NOx reduction, NH3 slip increased, leading to high NH3 emission concentration.

3.2. NH3 Emission Factor and Comparison of NH3 Emissions

This study developed the NH3 emission factor by collecting 45 NH3 samples from three bituminous coal power plants. The results are shown in Table 3.
The NH3 emission factor development result was found to be 0.0029 kg NH3/ton, which is approximately ten times larger than the currently-applied EPA NH3 emission factor of energy industry combustion that is used in South Korea’s national statistics (0.00028 kg NH3/ton) [17]. This value is about two times lower than the emission factor of 0.0054 kg NH3/ton for a bituminous coal power plant, which was analyzed in a 2019 South Korean research report [18]. It was also found that this figure is significantly lower than the range of ammonia emission factor (0.07 kg NH3/ton to 1.17 kg NH3/ton) for household stoves, which is among the combustion partial ammonia emission factors studied more recently than studies done by the U.S. EPA [19].
Considering these results, the difference in the emission factor obtained from the research conducted in South Korea is lower than the difference in the emission factor of the EPA, which is currently applied in the statistics of South Korea. Therefore, it is important to develop an NH3 emission factor, which reflects the characteristics of South Korea.
The emission factor that was developed in this study and the EPA’s emission factor, which is currently applied in the statistics of South Korea, were used to compare the difference in NH3 emissions at the selected bituminous coal power plants. Figure 4 shows the results.
When the emission factor developed in this study was applied, the NH3 emission was calculated to be 228 NH3 ton/year. When compared to the NH3 emission estimate (22 NH3 ton/year), which is calculated by applying the conventional EPA emission factor, the difference was approximately 206 NH3 ton/year. Therefore, it is necessary to develop a NH3 emission factor to improve the confidence level of inventory.

3.3. Uncertainty of NH3 Emission Factor

Monte Carlo simulation was used to estimate the uncertainty of the NH3 emission factor of bituminous coal power plants selected for this study. Figure 5 shows the estimation results. The probability density function of the NH3 emission factor of bituminous coal power plants developed in this study had lognormal distribution. The mean was 0.0029 kg NH3/ton at a 95% confidence level; the lower 2.5% showed 0.0027 kg NH3/ton and the upper 97.5% showed 0.0031 kg NH3/ton. The uncertainty range of the NH3 emission factor was estimated using these values from −6.9% to +10.34% at 95% confidence level. At present, the values and range are not available for NH3 uncertainty. Therefore, comparison with relevant cases is difficult. However, in the case of greenhouse gas, uncertainty range and values are available.
When the uncertainty of the NH3 emission factor of bituminous coal power plants from this study is compared with the greenhouse gas uncertainty range provided by the Intergovernmental Panel on Climate Change (IPCC), the NH3 emission factor is found to be much lower than the basic uncertainty range, that is 50–150% for CH4 emission factor. Moreover, the uncertainty is 1000% of the uncertainty of the N2O in the stationary combustion sector of energy provided in the 2006 IPCC guidelines, but is larger than the uncertainty (−1.0 to +1.04) of the carbon emission factor of bituminous coal [20]. In South Korea, the uncertainties in air pollutants are expressed in ranks and evaluated by experts. If the uncertainty range of air pollutants is provided, as in the case of greenhouse gases, it is possible to evaluate them quantitatively.

4. Conclusions

This study developed a NH3 emission factor for bituminous coal power plants in South Korea to investigate the NH3 emission characteristics. Furthermore, three different emission factors were used to compare the NH3 emissions, namely the EPA value, which is currently applied in South Korea, a previously developed emission factor value in South Korea, and the emission factor value developed in this study, which reflects the characteristics of South Korea. Three bituminous coal power plants were selected to compare the NH3 emission characteristics, including NH3 emission factor development.
The NH3 concentration analysis results showed that emissions from the selected bituminous coal power plants were in the range of 0.21–0.99 ppm, and that the difference in NH3 concentration was affected by NOx concentration. The NH3 emission factor was found to be 0.0029 kg NH3/ton, which demonstrated that the difference in the values obtained from the research conducted in South Korea was lower than the difference in the emission factor from the EPA, which is currently applied in the statistics of South Korea. Furthermore, when NH3 emissions were compared by using the NH3 emission factor developed in this study alongside that of the EPA’s NH3 emission factor that is currently applied in South Korea’s statistics, the difference was found to be 206 NH3 ton/year. This implies that an emission factor needs to be developed which reflects the national characteristics of South Korea.
The uncertainty range of the NH3 emission factor developed in this study was between −6.9% and +10.34% at a 95% confidence level. At present, numerical values of uncertainty are not available for air pollutants, thus making their comparison difficult. When compared with the uncertainty of greenhouse gas, the NH3 emission factor’s uncertainty was higher than that of the carbon emission factor of bituminous coal and lower than that of the emission factors of CH4 and N2O. If the uncertainty ranges are provided for air pollutants, like those of greenhouse gas, quantitative evaluation will be feasible.
This study investigated the NH3 emission factor and emission characteristics for only three bituminous coal power plants. In the future, if a NH3 emission factor is developed for a larger number of facilities by considering the seasonal effects, the confidence level of NH3 inventory in South Korea will significantly improve.

Author Contributions

All authors contributed to the research presented in this work. Their contributions are presented below. “Conceptualization, E.-C.J.; Methodology and writing- original draft preparation, S.K. and Analysis, S.-D.K.; All authors have read and agreed to the published version of the manuscript.

Funding

This work is supported by Korea Ministry of Environment(MOE) and Korea Environment Corporation.

Acknowledgments

This work is financially supported by Korea Ministry of Environment(MOE) as Graduate School specialized in Climate Change.

Conflicts of Interest

The authors declare no conflict of interest.

References

  1. KEI(Korea Environmet Institute). Basic Research on Ammonia Management Policy for Reduction of Secondary Generation Fine Dust; Korea Environmet Institute: Sejong, Korea, 2017. [Google Scholar]
  2. Weixiang, Z.; Hopke, P.K. Source apportionment for ambient particles in the San Gorgonio wilderness. Atmos. Environ. 2004, 38, 5901–5910. [Google Scholar] [CrossRef]
  3. Gibson, M.D.; Pierce, J.R.; Waugh, D.; Kuchta, J.S.; Chisholm, L.; Duck, T.J.; Hopper, J.T.; Beauchamp, S.; King, G.H.; Franklin, J.E.; et al. Identifying the sources driving observed PM2.5 temporal variability over Halifax, Nova Scotia, during BORTAS-B. Atmos. Chem. Phys. 2013, 13, 7199–7213. [Google Scholar] [CrossRef] [Green Version]
  4. Ahmad, M.; Cheng, S.; Yu, Q.; Qin, W.; Zhang, Y.; Chen, J. Chemical and source characterization of PM2.5 in summertime in severely polluted Lahore, Pakistan. Atmos. Res. 2020, 234, 104715. [Google Scholar] [CrossRef]
  5. Agarwal, A.; Satsangi, A.; Lakhani, A.; Kumari, K.M. Seasonal and spatial variability of secondary inorganic aerosols in PM2.5 at Agra: Source apportionment through receptor models. Chemosphere 2020, 242, 125132. [Google Scholar] [CrossRef] [PubMed]
  6. Environmental Preservation Association. POLICY & ISSUES Environment column: Air Pollutant Total Management System. Environ. Inf. 2015, 416, 2–5. [Google Scholar]
  7. Rhee, V.A. Reveiw of the Special Act on the Seoul Metropolitan Air Improvement: The Total Mass emissions Managements and the Tradable Permit Programs. Public Law J. 2007, 8, 255–280. [Google Scholar]
  8. Moon, T.H.; Hur, J.W. Linking the Total Pollution Load Management System (TPLMS) and the Total Industrial Site Volume Control System (ISVCS) in the Capital Region, Korea. J. Korea Plan. Assoc. 2009, 44, 19–30. [Google Scholar]
  9. Wu, Y.; Gu, B.; Erisman, J.W.; Reis, S.; Fang, Y.; Lu, X.; Zhang, X. PM2.5 pollution is substantially affected by ammonia emissions in China. Environ. Pollut. 2016, 218, 86–94. [Google Scholar] [CrossRef] [PubMed] [Green Version]
  10. Kim, S.T.; Bae, C.H.; Kim, B.U.; Kim, H.C. PM2.5 Simulations for the Seoul Metropolitan Area: (I) Contributions of Precursor Emissions in the 2013 CAPSS Emissions Inventory. J. Korean Soc. Atmos. Environ. 2017, 33, 139–158. [Google Scholar] [CrossRef] [Green Version]
  11. San joaquin valley air pollution control district. Demonstration of NH3 Precursor Contributions to PM2.5 in the San Joaquin Valley; San joaquin valley air pollution control district: Fresno, CA, USA, 2019.
  12. NIER(National Institute of Environmental Research in Korea). 2016 National Air Pollutants Emission; National Institute of Environmental Research in Korea: Incheon, Korea, 2019.
  13. Ministry of Environment. Standard Methods for the Measurements of Air Pollution; Ministry of Environment in Korea: Seoul, Korea, 2019.
  14. Law, A.M.; Kelton, W.D. Simulation Modeling and Analysis; McGraw-Hill: New York, NY, USA, 1991. [Google Scholar]
  15. Winiwarter, W.; Rypdal, K. Assessing the uncertainty associated with national greenhouse gas emission inventories: A case study for Austria. Atmos. Environ. 2001, 35, 5425–5440. [Google Scholar] [CrossRef]
  16. Zhang, L.; Pierce, J.; Leung, V.L.; Wang, D.; Epling, W.S. Characterization of Ceria’s Interaction with NOx and NH3. J. Phys. Chem. C 2013, 117, 8282–8289. [Google Scholar] [CrossRef]
  17. U.S. Environmental Protection Agency. Development and Selection of Ammonia Emission Factors Final Report; U.S. Environmental Protection Agency: Washington, DC, USA, 1994.
  18. Improvement of Reliability and Accuracy of Air Pollutant Emissions (18)-Focusing on Improving Ammonia Emissions; NIER(National Institute of Environmental Research in Korea): Incheon, Korea, 2019.
  19. Li, Q.; Jiang, J.K.; Cai, S.; Zhou, W.; Wang, S.H.; Duan, L.; Hao, J. Gaseous Ammonia Emissions from Coal and Biomass Combustion in Household Stoves with Different Combustion Efficiencies. Environ. Sci. Technol. Lett. 2016, 3, 98–103. [Google Scholar] [CrossRef]
  20. IPCC. The 2006 IPCC Guidelines for National Greenhouse Gas Inventories. In General Guidance and Reporting; IPCC: Geneva, Switzerland, 2006; Volume 1. [Google Scholar]
Figure 1. Schematic of the field setup for ammonia sampling at power plant.
Energies 13 01534 g001
Figure 2. Process of the Monte Carlo Simulation for estimating the uncertainty of the emission factor.
Energies 13 01534 g002
Figure 3. Correlation of NH3 concentration and NOx concentration.
Energies 13 01534 g003
Figure 4. The comparison of NH3 EF(Emission Factor)for NH3 emissions at bituminous coal power plants.
Energies 13 01534 g004
Figure 5. Process of the Monte Carlo Simulation for estimating the uncertainty of the emission factor.
Energies 13 01534 g005
Table 1. Characteristics of the investigated bituminous coal power plant.
SiteCapacity (MW)Fuel TypeSampling
Power Plant A1020Bituminous Coal16
Power Plant B1050Bituminous Coal10
Power Plant C500Bituminous Coal19
Table 2. NH3 concentration of the investigated bituminous coal power plants.
SiteNH3 Concentration
(ppm)
SD(Standard Deviation)
(ppm)
SamplingNOx Concentration
(ppm)
Power Plant A0.210.141620
Power Plant B0.990.561014
Power Plant C0.270.211923
Table 3. NH3 emission factor of the investigated bituminous coal power plant.
This Study
(kgNH3/ton)
US EPA(1994)
(kgNH3/ton)
NIER (2019)
(kgNH3/ton) [18]
0.0029 0.000280.0054

