Article

Study of the Miller Cycle on a Turbocharged DI Gasoline Engine Regarding Fuel Economy Improvement at Part Load

1
College of Automotive Studies, Tongji University, Shanghai 200092, China
2
SAIC Maxus Automotive Co., Ltd., Shanghai 200438, China
*
Authors to whom correspondence should be addressed.
Energies 2020, 13(6), 1500; https://doi.org/10.3390/en13061500
Submission received: 17 February 2020 / Revised: 10 March 2020 / Accepted: 18 March 2020 / Published: 22 March 2020
(This article belongs to the Special Issue Modelling of Thermal and Energy Systems)

Abstract

:
This contribution is focused on the fuel economy improvement of the Miller cycle under part-load characteristics on a supercharged DI (Direct Injection) gasoline engine. Firstly, based on the engine bench test, the effects with the Miller cycle application under 3000 rpm were studied. The results show that the Miller cycle has different extents of improvement on pumping loss, combustion and friction loss. For low, medium and high loads, the brake thermal efficiency of the baseline engine is increased by 2.8%, 2.5% and 2.6%, respectively. Besides, the baseline variable valve timing (VVT) is optimized by the test. Subsequently, the 1D CFD (Computational Fluid Dynamics) model of the Miller cycle engine after the test optimization at the working condition of 3000 rpm and BMEP (Brake Mean Effective Pressure) = 10 bar was established, and the influence of the combined change of intake and exhaust valve timing on Miller cycle was studied by simulation. The results show that as the effect of the Miller cycle deepens, the engine’s knocking tendency decreases, so the ignition timing can be further advanced, and the economy of the engine can be improved. Compared with the brake thermal efficiency of the baseline engine, the final result after simulation optimization is increased from 34.6% to 35.6%, which is an improvement of 2.9%.

1. Introduction

As one of the main means of transportation in people’s lives, cars have become an indispensable part of modern life. The dramatic increase in the number of cars poses a huge challenge to the environment and energy, causing increasingly stringent fuel consumption regulations. Facing the pressure of regulations, improving fuel economy has become the top priority of internal combustion engine development. When operating in urban conditions (generally 2000–3000 rpm, medium and low load), the traditional Otto cycle gasoline engine has a higher fuel consumption due to larger pumping loss. Nowadays, gasoline engines have a growing trend toward downsizing and lightweighting, so the displacement is reduced. To ensure that the engine has sufficient output torque at high load, turbocharging technology is often used, which increases the tendency of knock during the high-load operation. To solve this problem, a common solution is to delay the ignition advance angle; another way is to simply reduce the geometric compression ratio of the engine, but these strategic or structural changes make it difficult for the engine to achieve optimal thermal efficiency, which in turn sacrifices the fuel economy of the engine [1].
By either early or late intake valve closing, the Miller cycle can decouple the expansion ratio and the compression ratio of the engine so that the effective compression is significantly lower than the geometric compression ratio [2,3]. In 1998, Porsche developed the VarioCam Plus system that combines the best features of shifting the timing phases and changes of cam profile [4]. This system applied in the 911 Turbo uses a hydraulic camshaft phaser with helical teeth instead of changing the chain length. The BMW Valvetronic, well known from the four- and eight-cylinder engines, facilitates low throttle losses as well as efficient partial load control [5], which pioneered this trend and thus put Miller cycle in wider production in 2001 [6,7]. Starting with a 1.6L, four-cylinder engine, VW made an implementation of advanced variable valve timing (VVT) on intake and exhaust to enable effective reduction in compression, while also increasing the exhaust temperature under low-load operation [8]. Besides, the VTEC system (variable valve timing and stroke) of Honda and the Nissan NVCS system of timing changes also the performance well on the engines in production [9]. Many scholars have made some contributions to the research of Miller cycle: Kovács from Braunschweig University of Technology has made a profound study on the potential of Miller cycle in diesel engines [10]; Neher from Karlsruhe University conducted an in-depth research on a naturally aspirated cogeneration lean-burn engine under an external characteristic condition [11,12]; Czech Technical University in Prague made a detailed study on Miller cycle with mixture heating as a means for the fuel economy improvement [13]; Gottschalk conducted a thorough experimental work on the knocking of the Miller cycle engine [14]. Besides, some research over valve train actuation [15] combined with high compression ratio [16] also made remarkable contributions to the valve train techniques.
Up to now, the research on the influence of the combined change of intake and exhaust valve timing on the Miller cycle is still insufficient. Besides, the impact on the fuel economy after using the Miller cycle for a gasoline engine equipped with turbocharger also needs further study. For these purposes, based on a supercharged DI gasoline engine, this paper begins with a description of the investigation approach followed by an overview of the experimental setup and test procedure.
After that, the results of effects with Miller cycle application and performance improvement are discussed. Finally, the impact of the combined change of intake and exhaust valve timing on the Miller cycle is analyzed by simulation, and thus accomplishes brake thermal efficiency improvement of the baseline engine by experimental and numerical optimization.

2. Experimental Study

The experimental test is carried out to achieve an over-expansion cycle of the engine by changing the VVT. The point of operation is selected at speed 3000 rpm, and the BMEP 5, 10, and 15 bar, respectively, to cover the low, medium and high loads of the engine.

2.1. Equipment

The research engine is a gasoline engine, equipped with a 350 bar high-pressure fuel injection system and a turbocharger. The specifications are shown in Table 1.
To ensure the accuracy and rationality of the data collected by the test, the equipment and measurement were thoroughly determined. The layout of the engine bench test is shown in Figure 1.
During the data collection, data such as power, torque, and fuel consumption during the test are collected by the engine test bench; the control parameters during engine operation are read and adjusted by ETAS-INCA (v7.2, ETAS GmbH, Stuttgart, Germangy); the Kistler combustion analyzer (Kistler Group, Winterthur, Switzerland) analyzes the data collected from the cylinder pressure sensor, and then calculates the combustion performance parameters such as CA50 during engine operation. The main equipment of the test bench and measurement errors are shown in the Table 2.

2.2. Test Procedure

The baseline maximum lift of the intake and exhaust valves is 7.5 mm. The intake valve opening period is 210 °CA, and the exhaust valve opening period is 242 °CA. Taking the TDC at the end of the exhaust stroke as the reference point, the intake valve closing (IVC) can vary from 151.5 to 223.5 °CA, and the exhaust valve closing (EVC) can vary from −1 to 64 °CA.
During the test, the engine is set under the test condition, starting from the baseline working VVT. First, ensure that EVC timing is unchanged, and gradually advance the IVC timing to increase intake advance angle so that the Miller cycle effect is deepened. The optimization principle of ignition advance angle is to increase ignition advance angle as much as possible under a certain VVT so that the engine has the lowest BSFC (Brake Specific Fuel Consumption) and only a slight knock at the target ignition advance angle. According to the experimental experience, under the medium and low load conditions, when CA50 is below 8 °CA, the change of the ignition advance angle has little effect on combustion. Therefore, under medium and low load, it is reckoned that the ignition advance angle is adjusted to the optimum when CA50 reaches about 8 °CA, while the ignition advance angle is adjusted to knock limit under high load.
To optimize the throttle angle and EWG (electrical waste gate) opening, the EWG maintains fully open under low load. Only the throttle angle is adjusted to meet the load demand. On the other hand, to achieve the load demand after the VVT change under medium and high loads, the throttle angle is first adjusted, and meanwhile the EWG position changes with the EWG map of the engine. When the throttle is fully opened and the required load is still not satisfied, the EWG position is manually adjusted.
Taking the point of operation BMEP = 10 bar as an example, Figure 2 shows the process of adjusting IVC timing to deepen the Miller cycle.
For comprehensive consideration of the purpose on studying the influence of exhaust retardation angle on the engine characteristics under Miller cycle, the effect of deep Miller cycle and the limitation of the VVT range, when exhaust retardation angle is analyzed at the points of test operation, intake advance angle is fixed under deep Miller cycle position. Using the method above, the influence of the exhaust retardation angle on the engine characteristics under the Miller cycle can be studied precisely. Table 3 shows the values of the intake advance angle of the Miller cycle at different points of operation during the test. Figure 3 shows the process of adjusting EVC timing to change the exhaust retardation angle to study the Miller cycle.

2.3. Results and Discussion

2.3.1. Effects with Miller Cycle Application

This paper will elaborate the effects with the Miller cycle application in three aspects, which are pumping loss, combustion and friction loss.
To express without ambiguity, in this paper, the increase or decrease rate of a parameter in the following analysis (such as BSFC, thermal efficiency, etc.) is defined as |A-Abaseline|/Abaseline.
• Pumping Loss
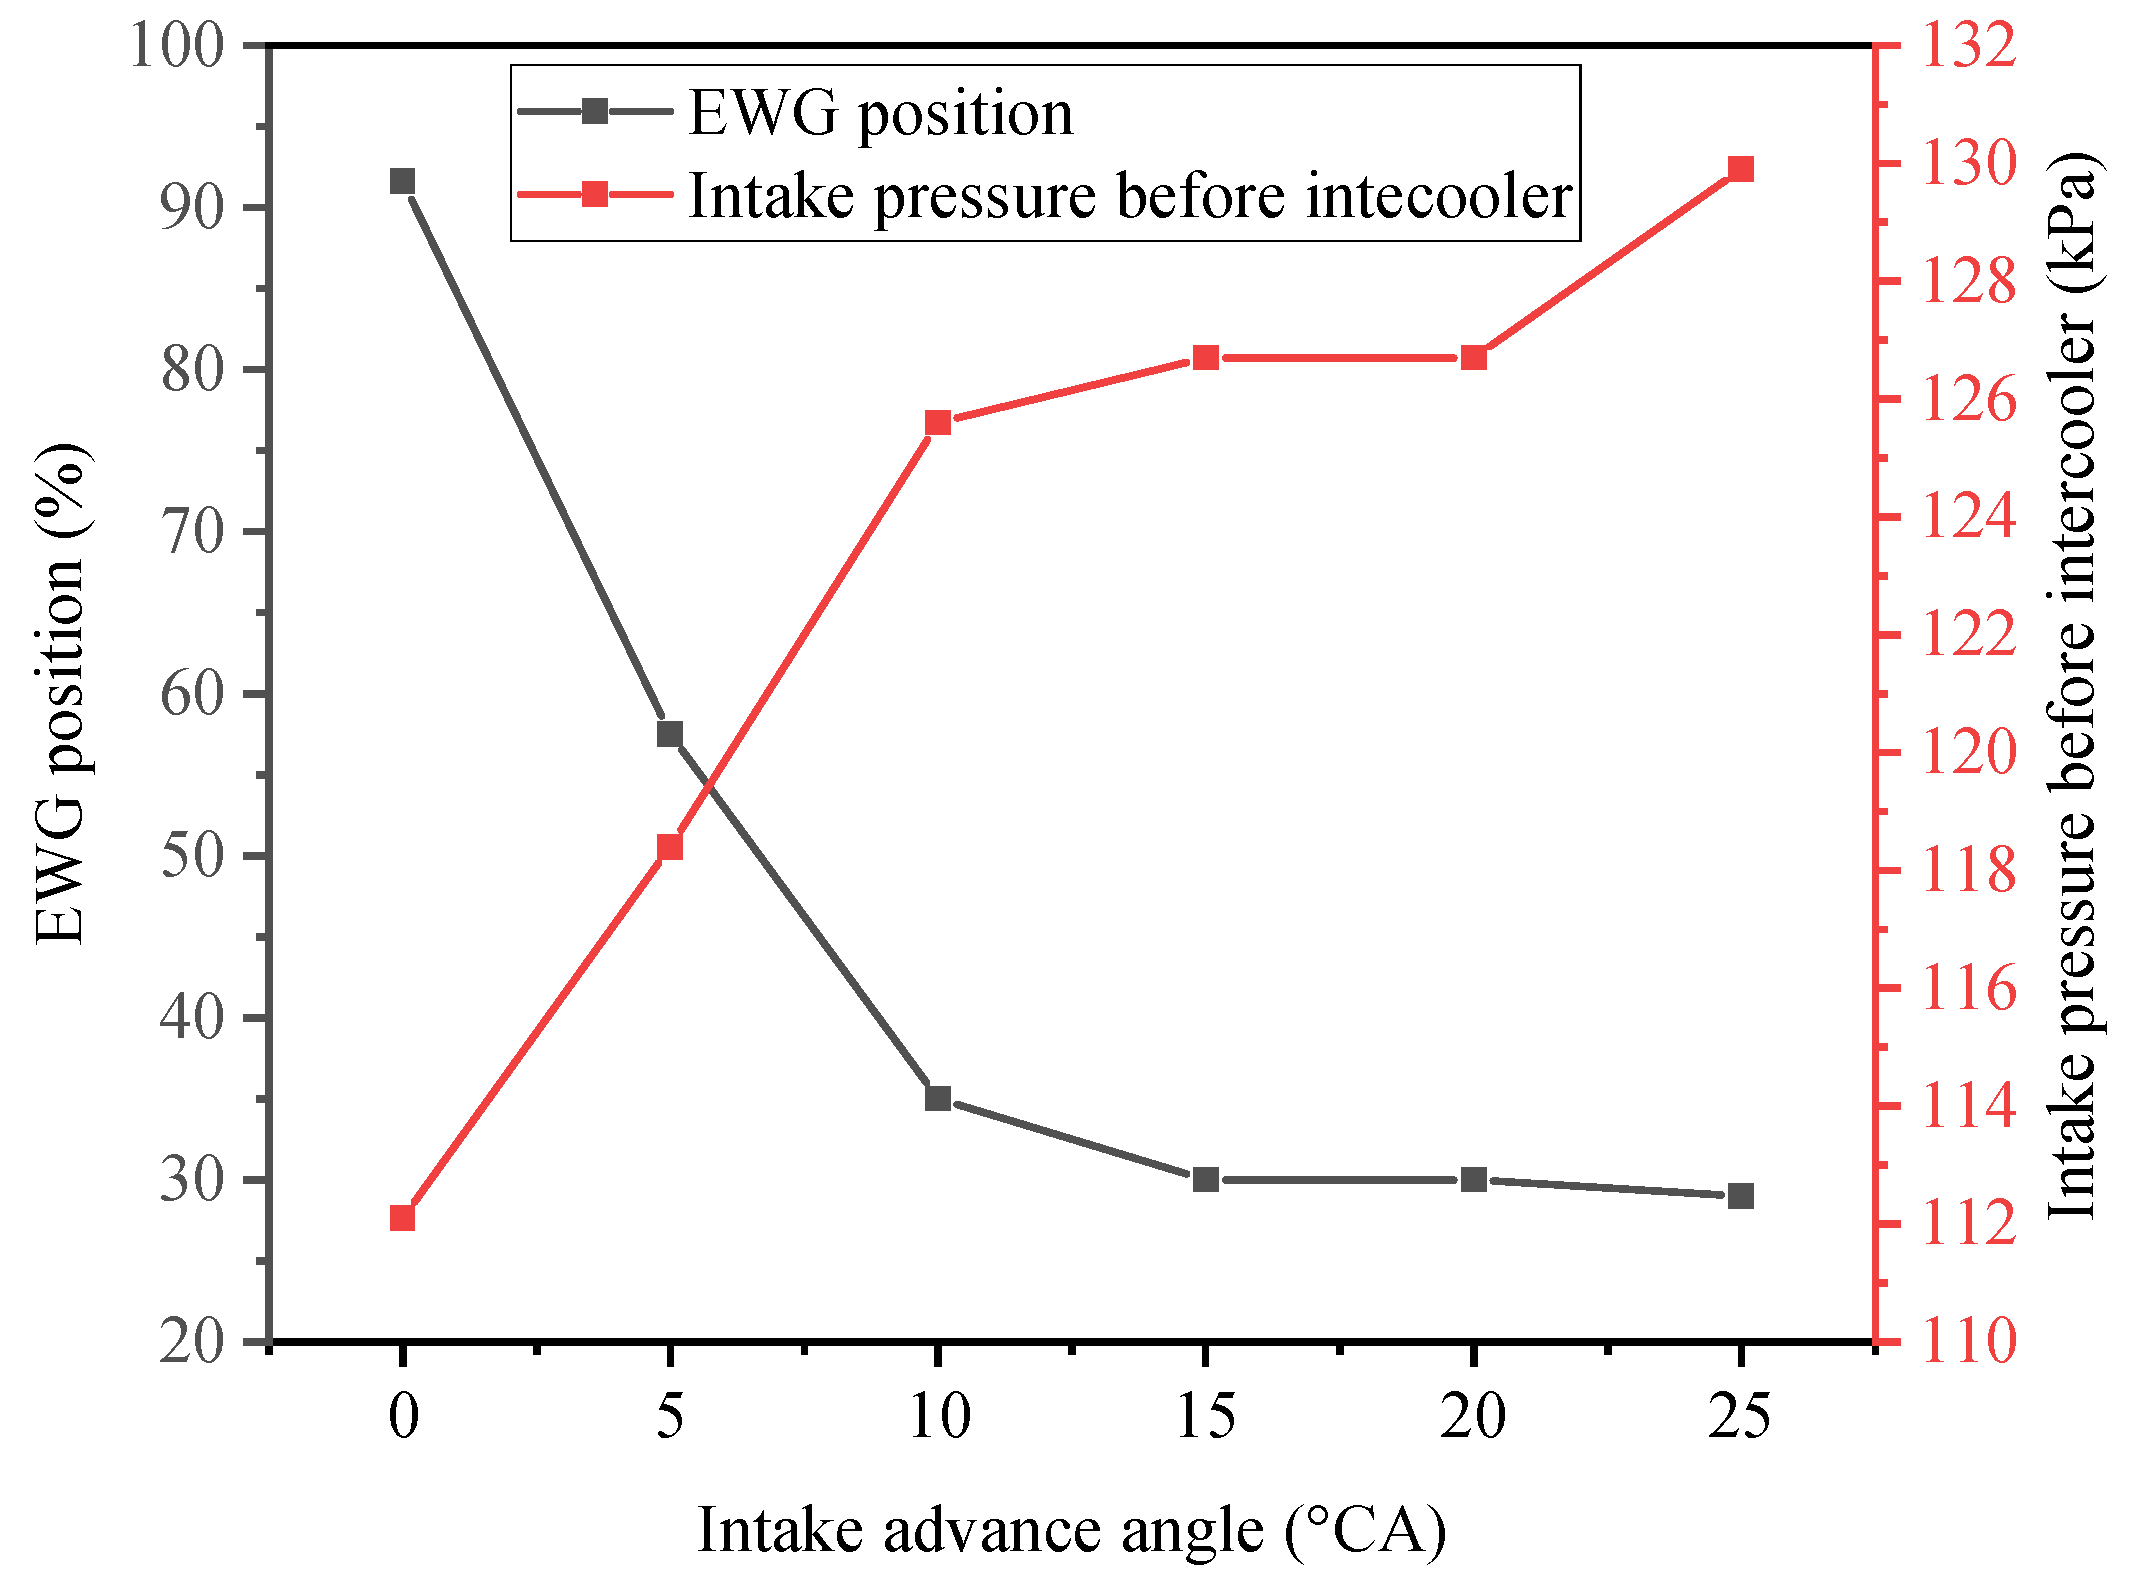
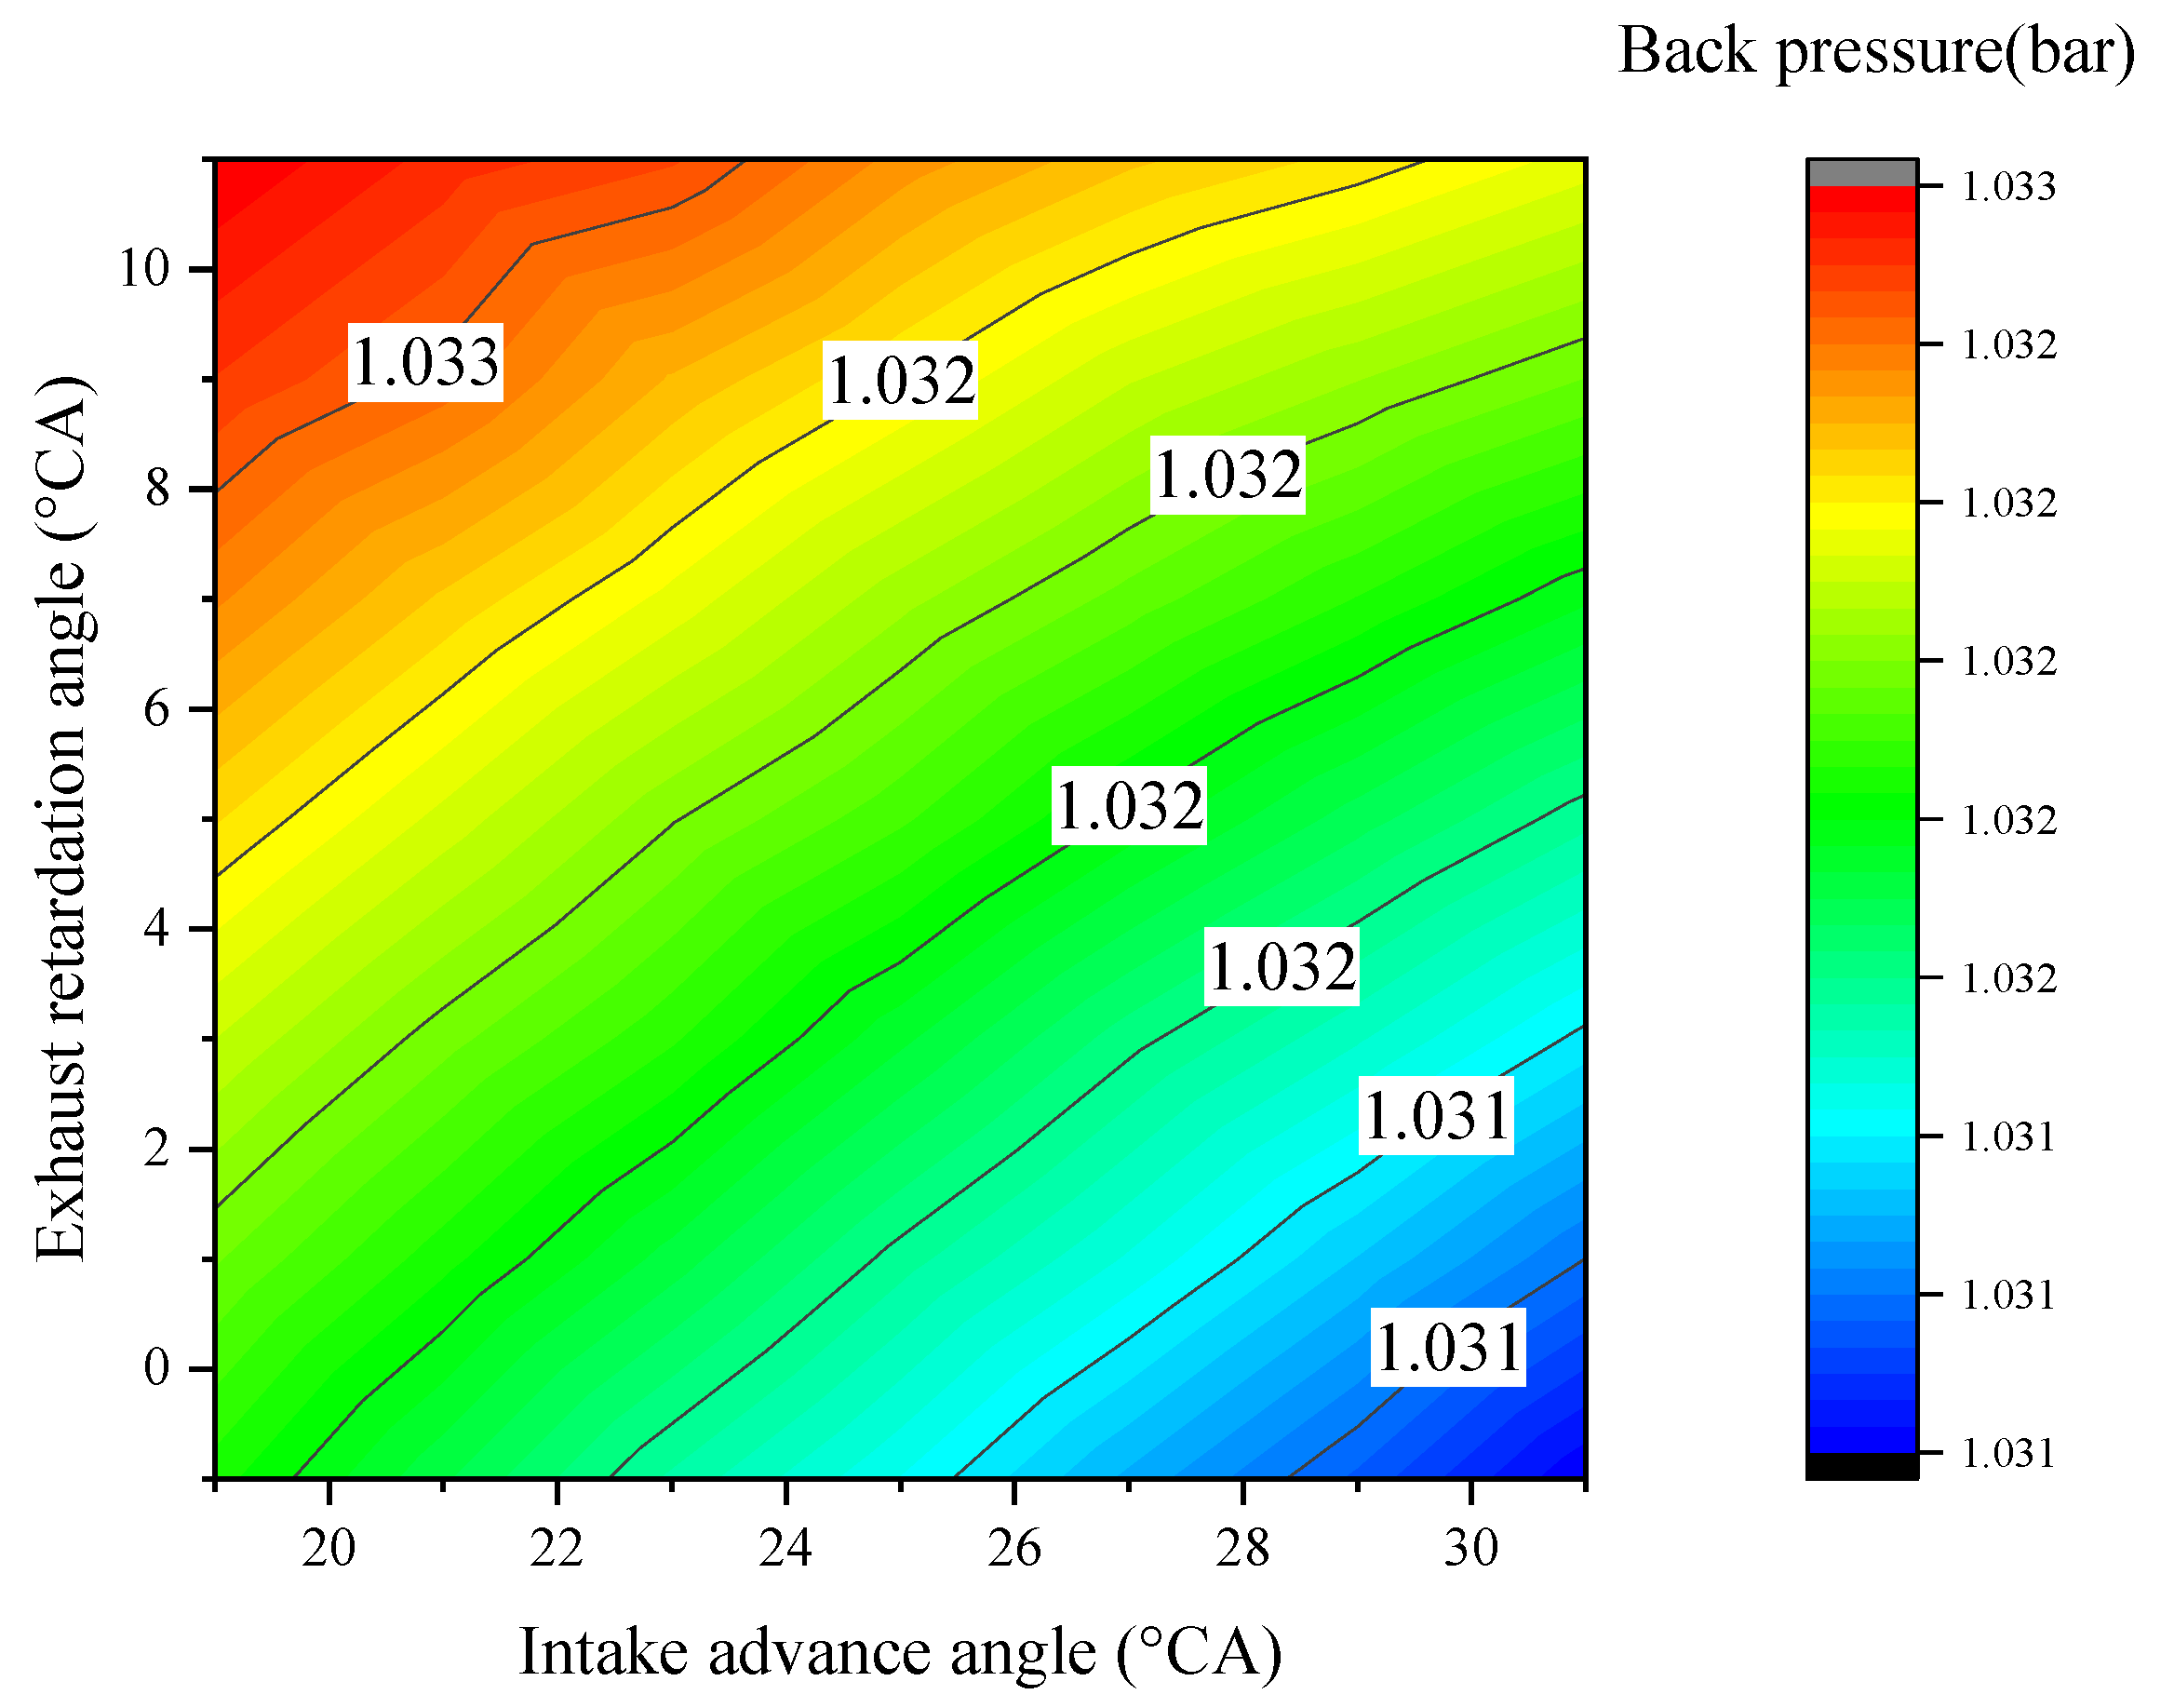
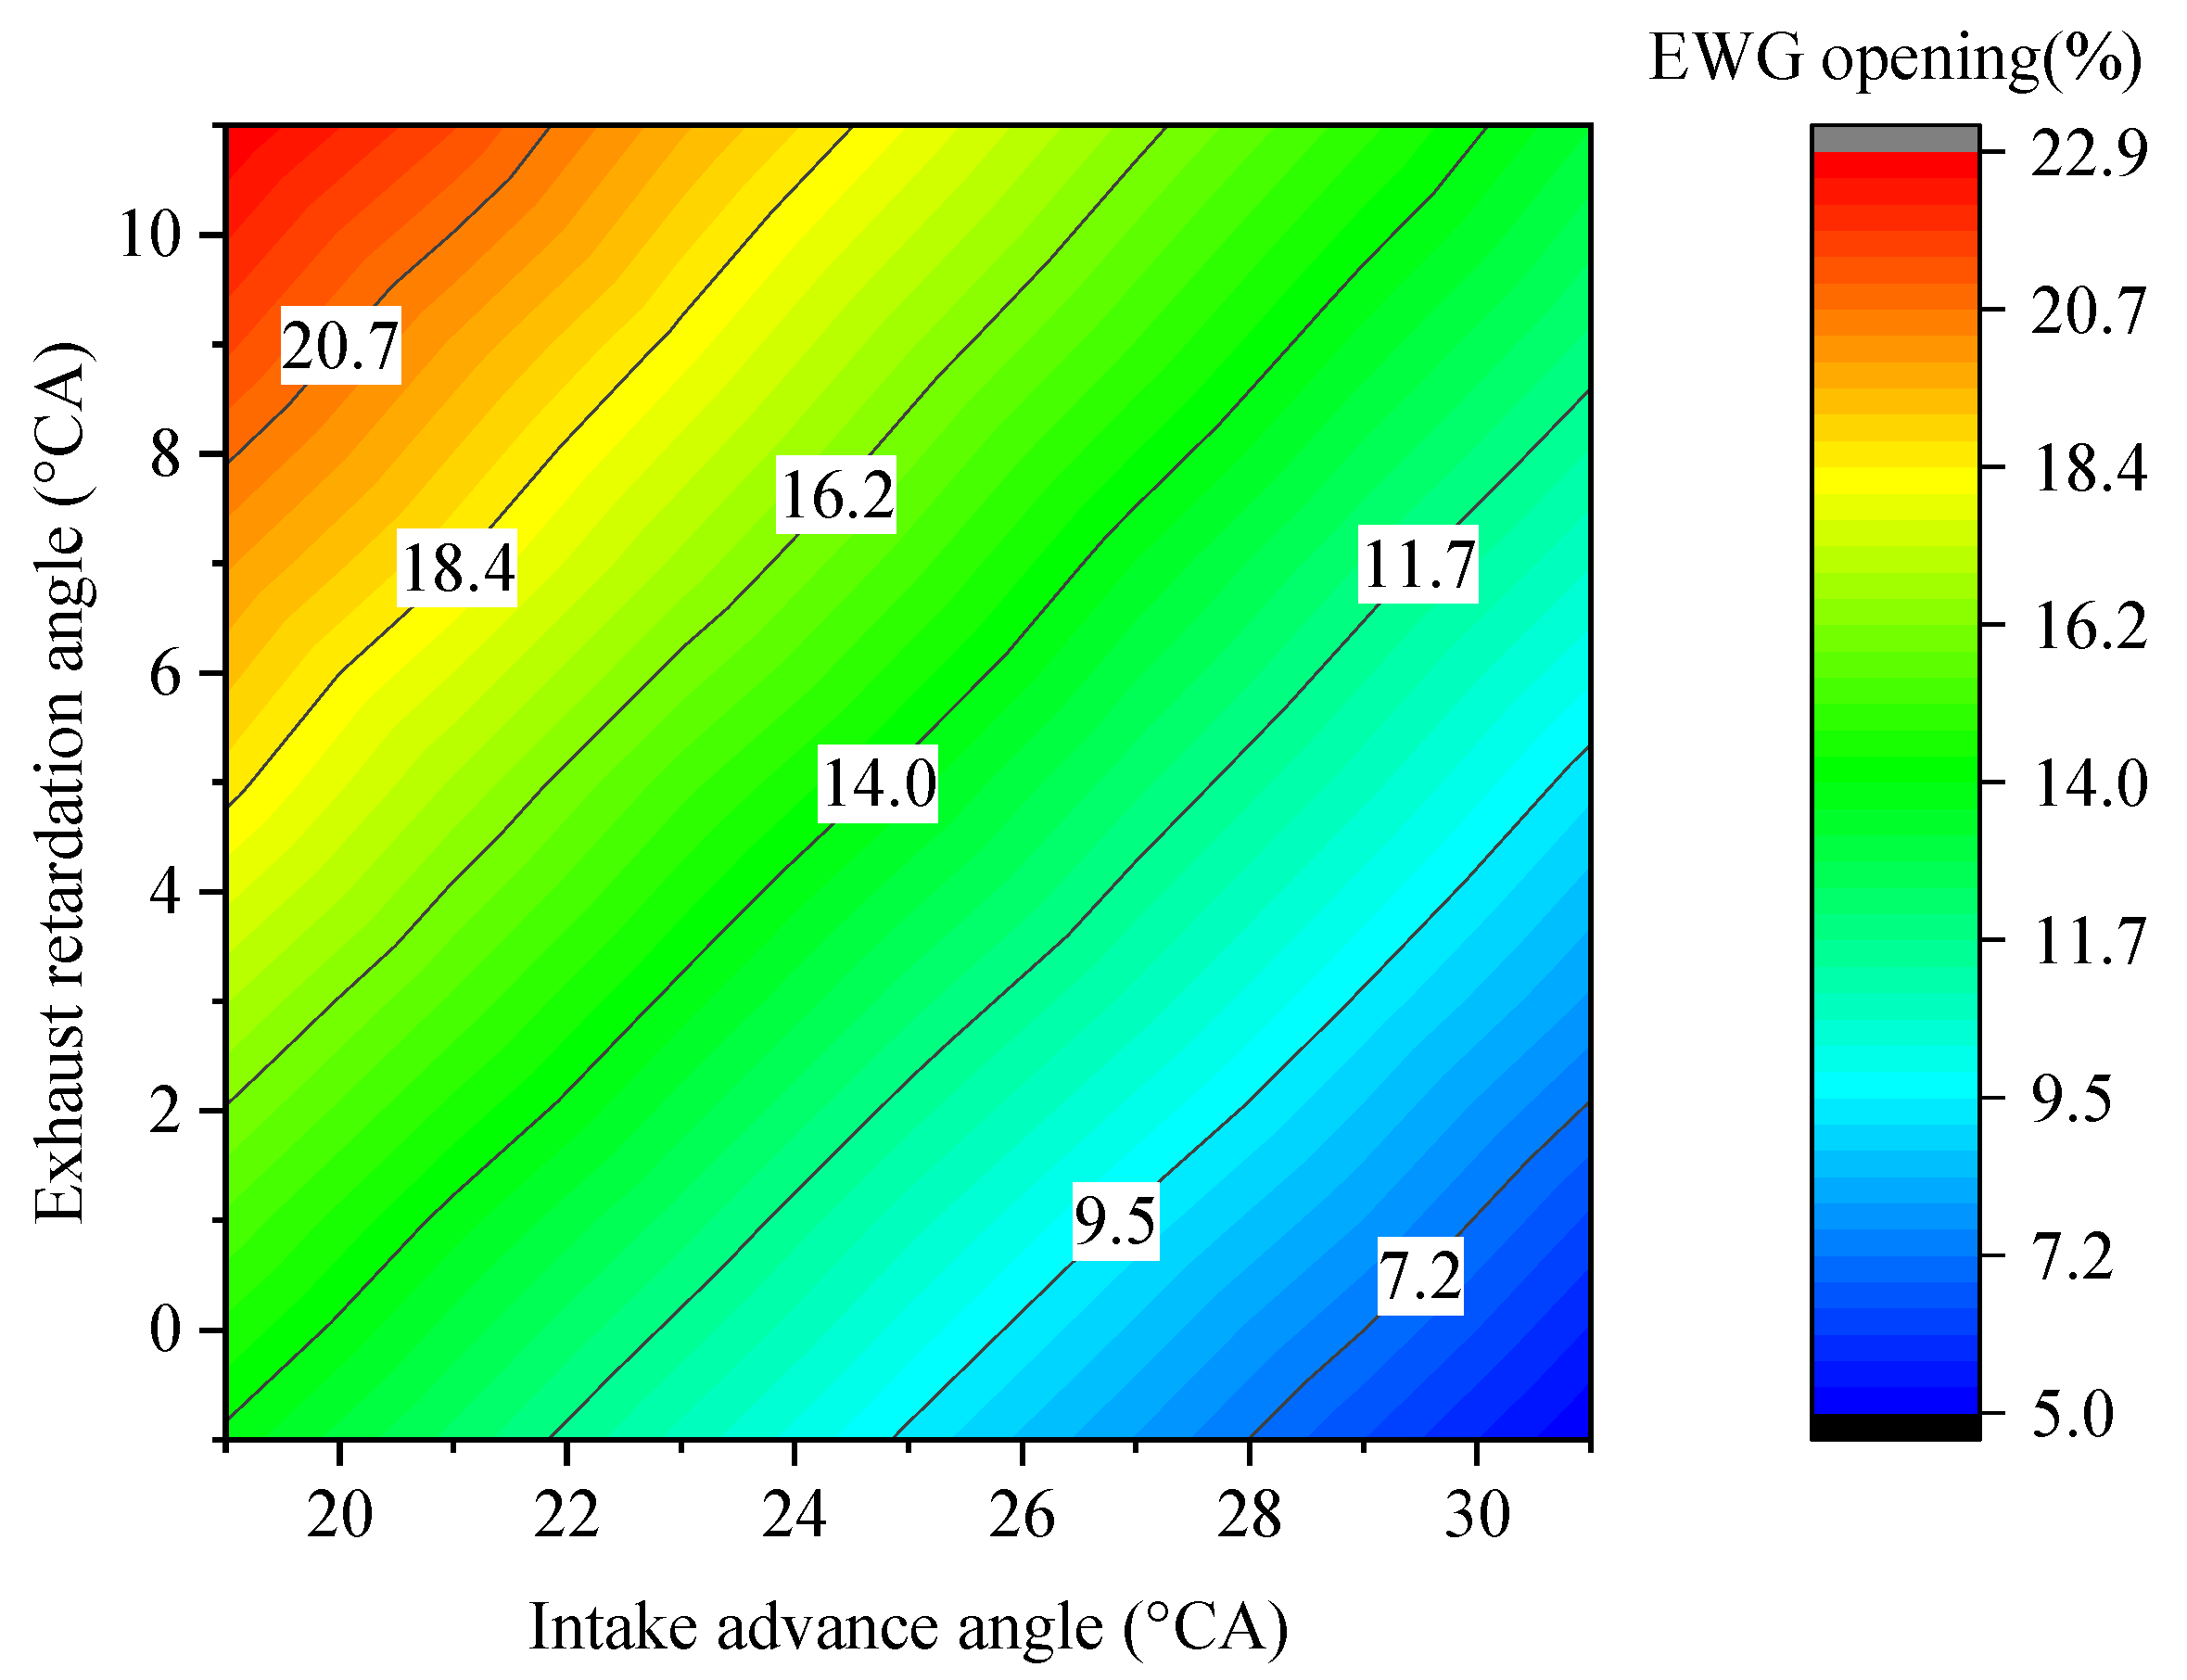
EWG position directly affects intake pressure before intercooler. Since the test shows that EWG position and intake pressure before intercooler relative to intake advance angle changes similarly under various points of operation, for the sake of simplicity, the point of operation at 3000 rpm and 10 bar is illustrated in detail. This is shown in graphical form in Figure 4 at the point of operation at 3000 rpm and 10 bar.
As shown in Figure 4, intake pressure before intercooler rises dramatically as EWG opening drops. When the intake advance angle is increased from 0 (baseline engine) to 25 °CA, EWG opening is reduced from 91.6% to 29%, and the corresponding intake pressure before intercooler is increased from 112.1 to 129.9 kPa, which can guarantee the required load of Miller cycle engines.
On the one hand, since the exhaust gas still contains high energy, the further intervention of the turbocharger is beneficial to the utilization of exhaust energy, thereby improving the thermal efficiency of the engine; on the other hand, the application of turbocharger causes an increase in exhaust backpressure, which, to some extent, mitigates the pumping loss improvement due to the larger throttle angle. In general, attributed to a turbocharger, the output power under the deep Miller cycle is not worse than that of the baseline engine under medium and high load at 3000 rpm, and making good use of the exhaust gas has a certain improvement on the thermal efficiency of Miller cycle engines.
Pumping mean effective pressure (PMEP) is a common parameter that characterizes the pumping loss in the engine’s working cycle [17]. Figure 5 shows PMEP relative to intake advance angle under baseline EVC, and PMEP relative to exhaust retardation angle under the Miller cycle at different points of operation during the test. 
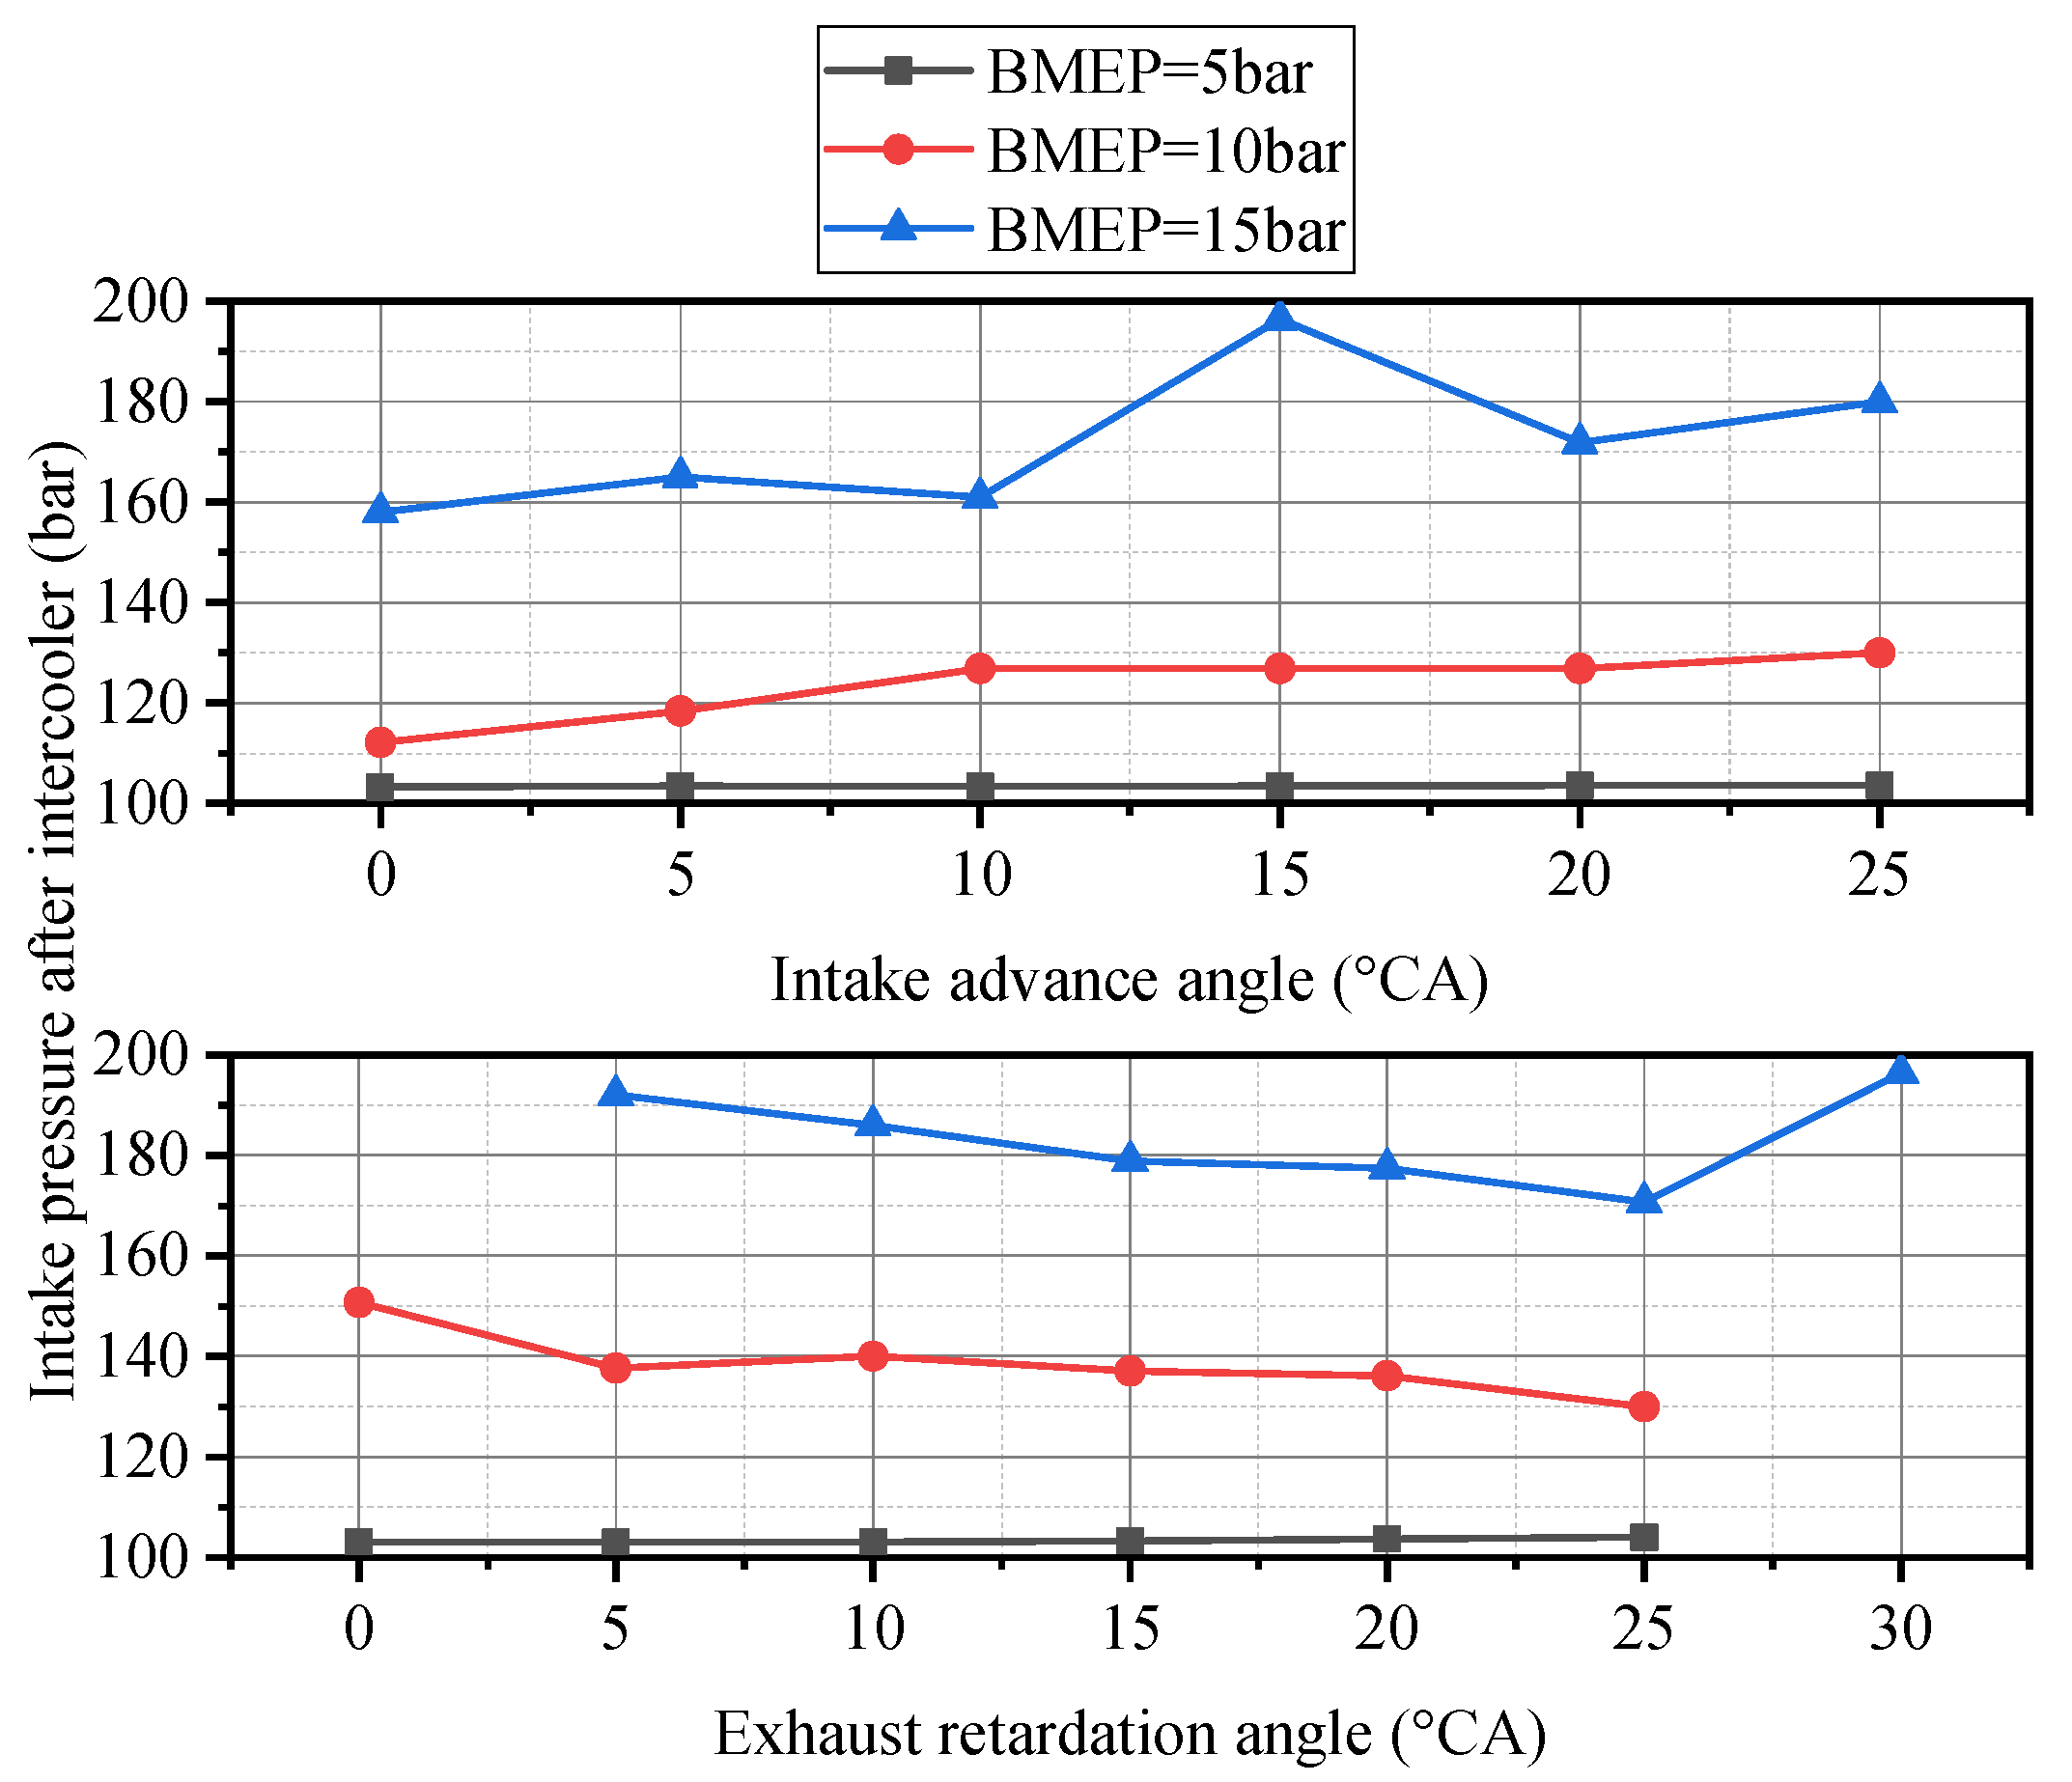
Figure 6 illustrates intake pressure after intercooler versus intake advance angle and exhaust retardation angle.
As can be seen in Figure 5, due to larger throttle opening, PMEP is increased from −0.44 to −0.29 bar when intake advance angle changes from 0 (baseline engine) to 25 °CA at the point of operation at 3000 rpm and 5 bar, which conspicuously reduces pumping loss in the engine’s working cycle; while under medium- and high-load conditions, the drop of the EWG opening adversely affects the exhaust backpressure due to the increase of turbocharging effect, which weakens the improvement of the throttle opening on pumping loss. As a result, PMEP under medium- and high-load conditions only slightly improved relative to the baseline engine during the Miller cycle deepening process.
The change of exhaust retardation angle also had certain effects on pumping loss under the load characteristics of 3000 rpm. At the point of operation at 3000 rpm and 5 bar, as the exhaust retardation angle decreases, the throttle opening angle can be further enlarged. Consequently, when the baseline exhaust retardation angle is reduced from 25 to 0 °CA, PMEP follows from −0.29 to −0.26 bar, which mitigates pumping loss. Under medium- and high-load conditions, due to the faster gas flow in the cylinder, the excessive exhaust retardation angle of the baseline engine causes the exhaust back pressure to affect PMEP during the intake process for a longer time. As a result, when the exhaust retardation angle is advanced, the pumping loss of the Miller cycle intake process is greatly improved. For the high-load condition of 3000 rpm with the most obvious improvement, PMEP is improved from −0.28 to 0.06 bar after the baseline exhaust retardation angle 30 °CA is adjusted to 5 °CA. According to the test, the improved exhaust retardation angle even has a positive effect on the pumping process. Compared with the results above, the influence of the throttle opening and the EWG opening on the Miller cycle pumping loss under medium- and large-load conditions is relatively insignificant.
As shown in Figure 6, the intake pressure after intercooler remains low at the point of operation at 3000 rpm and 5 bar; under medium and high load, the intake pressure after intercooler rises quickly when the Miller cycle becomes deeper, which guarantees the sufficient air supply. Meanwhile, the intake pressure after intercooler keeps increasing with the decrease of the exhaust retardation angle.
• Combustion
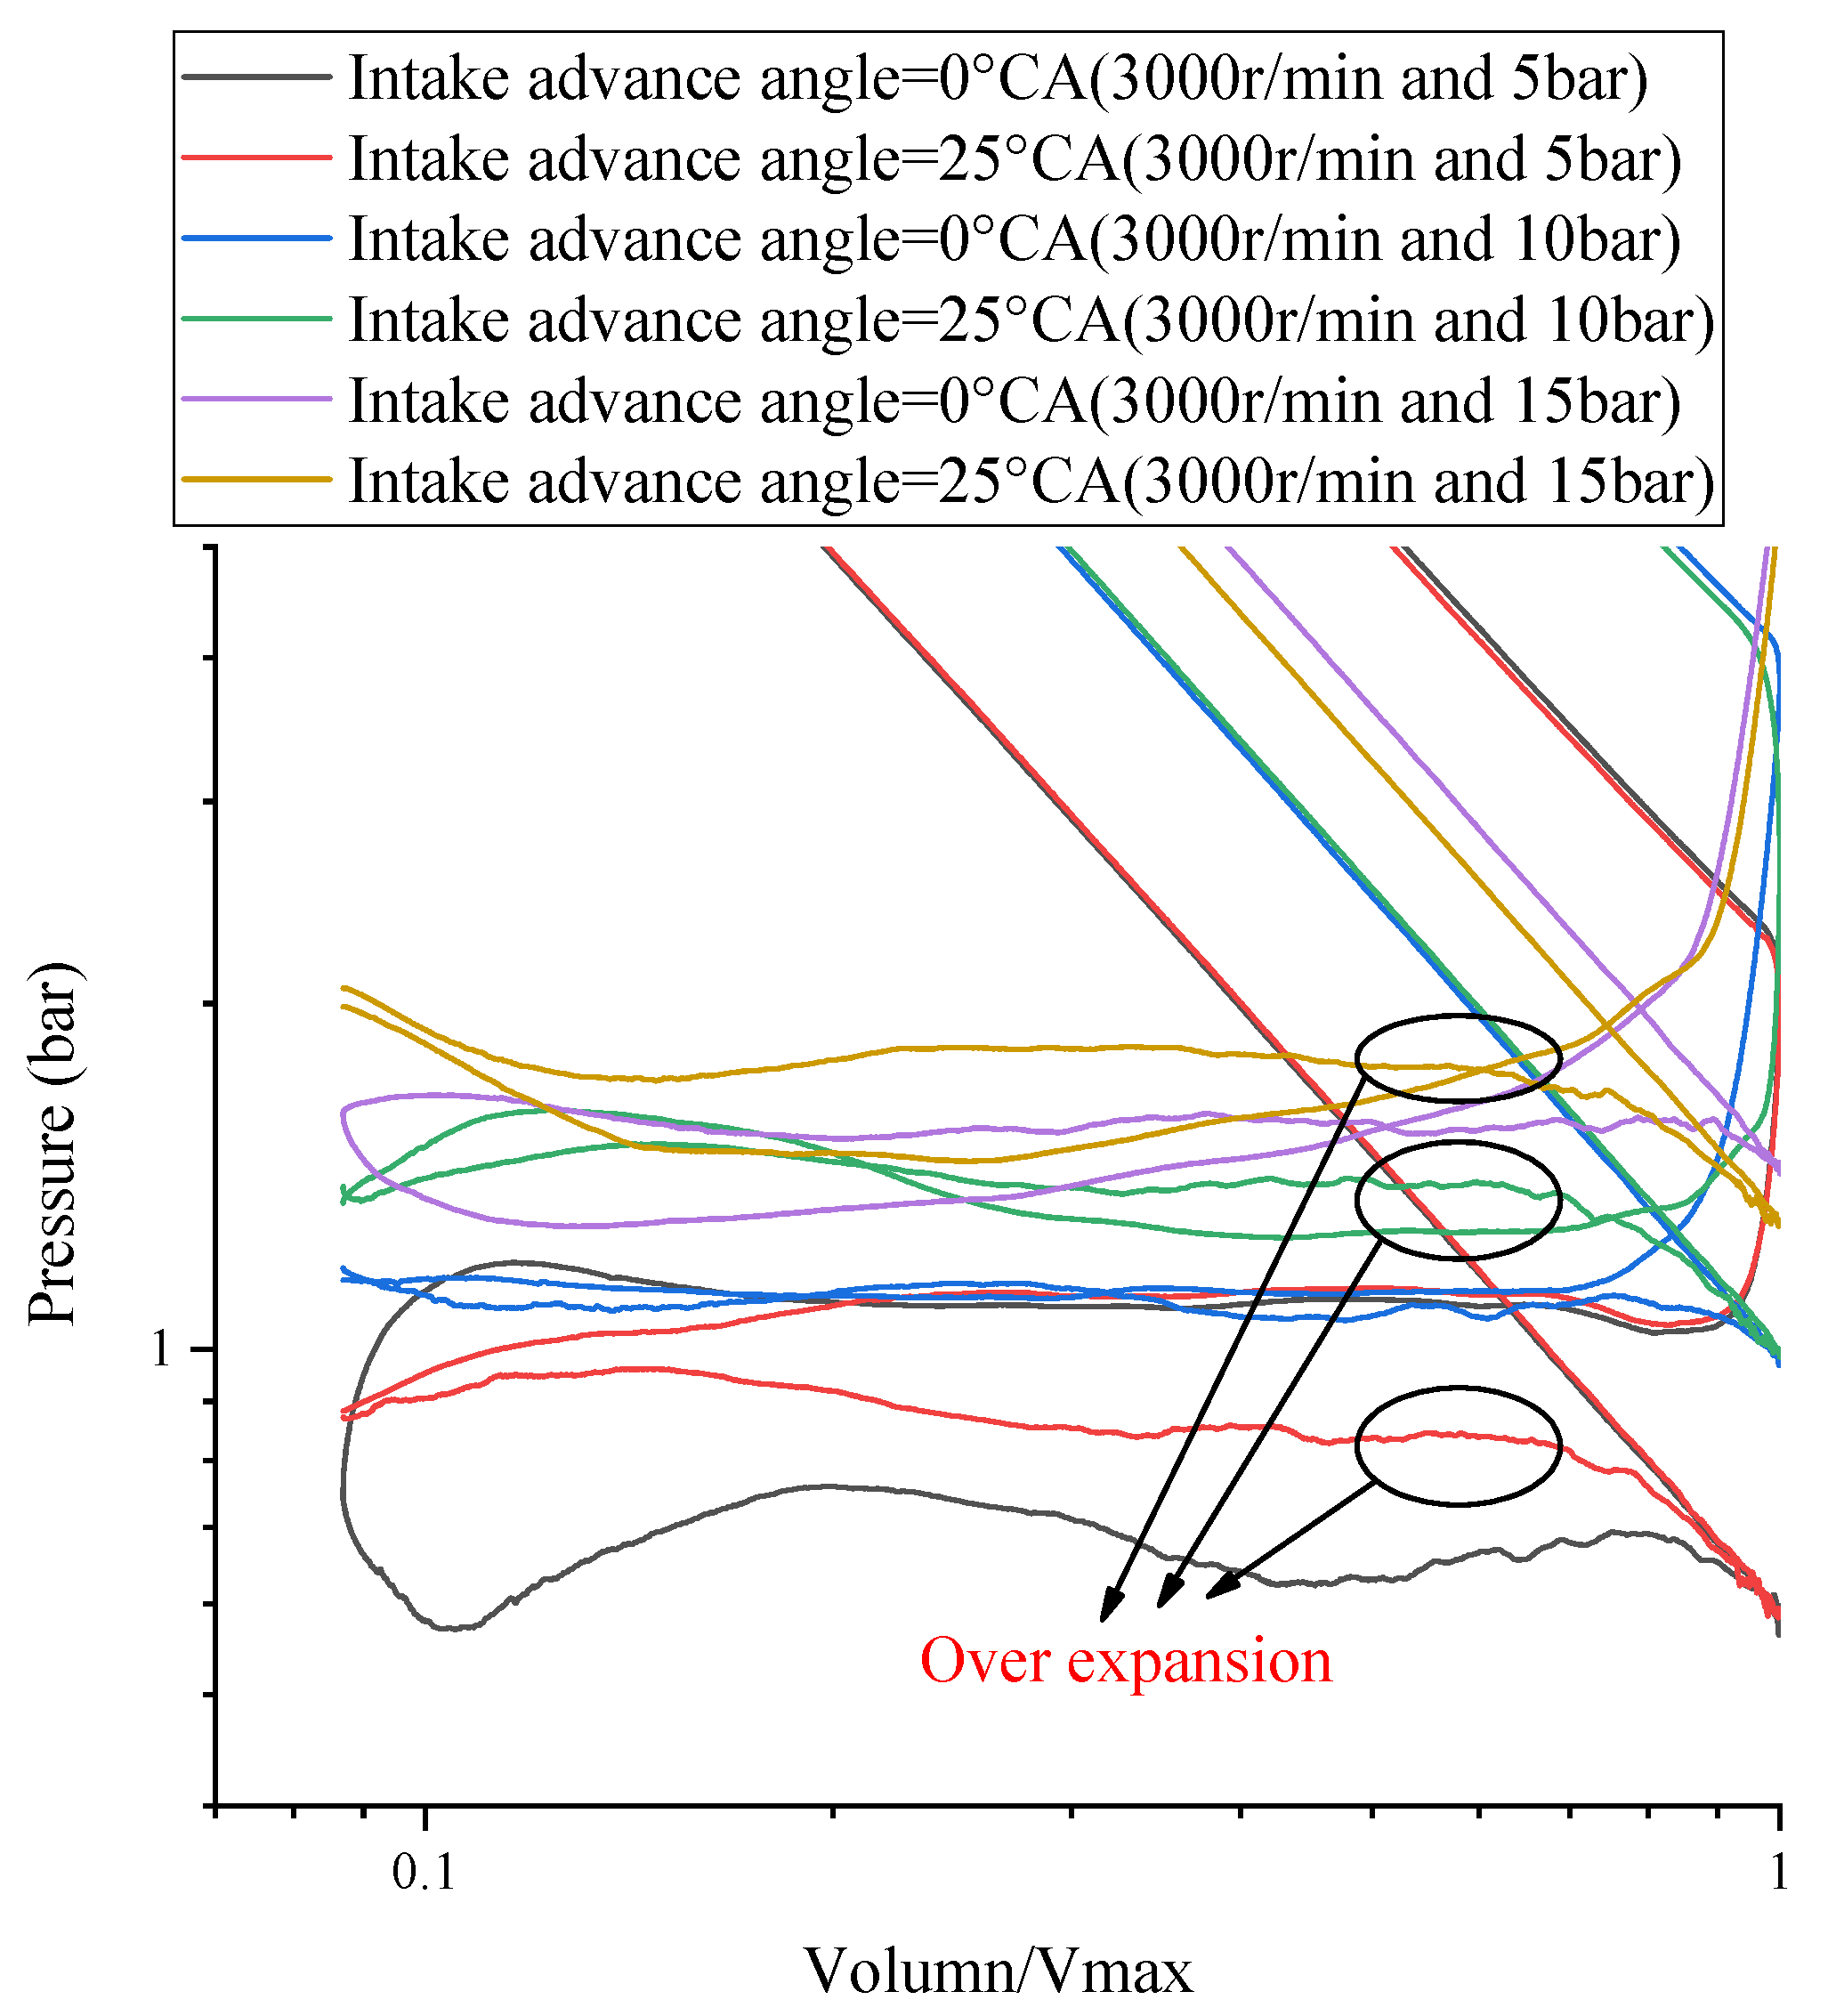
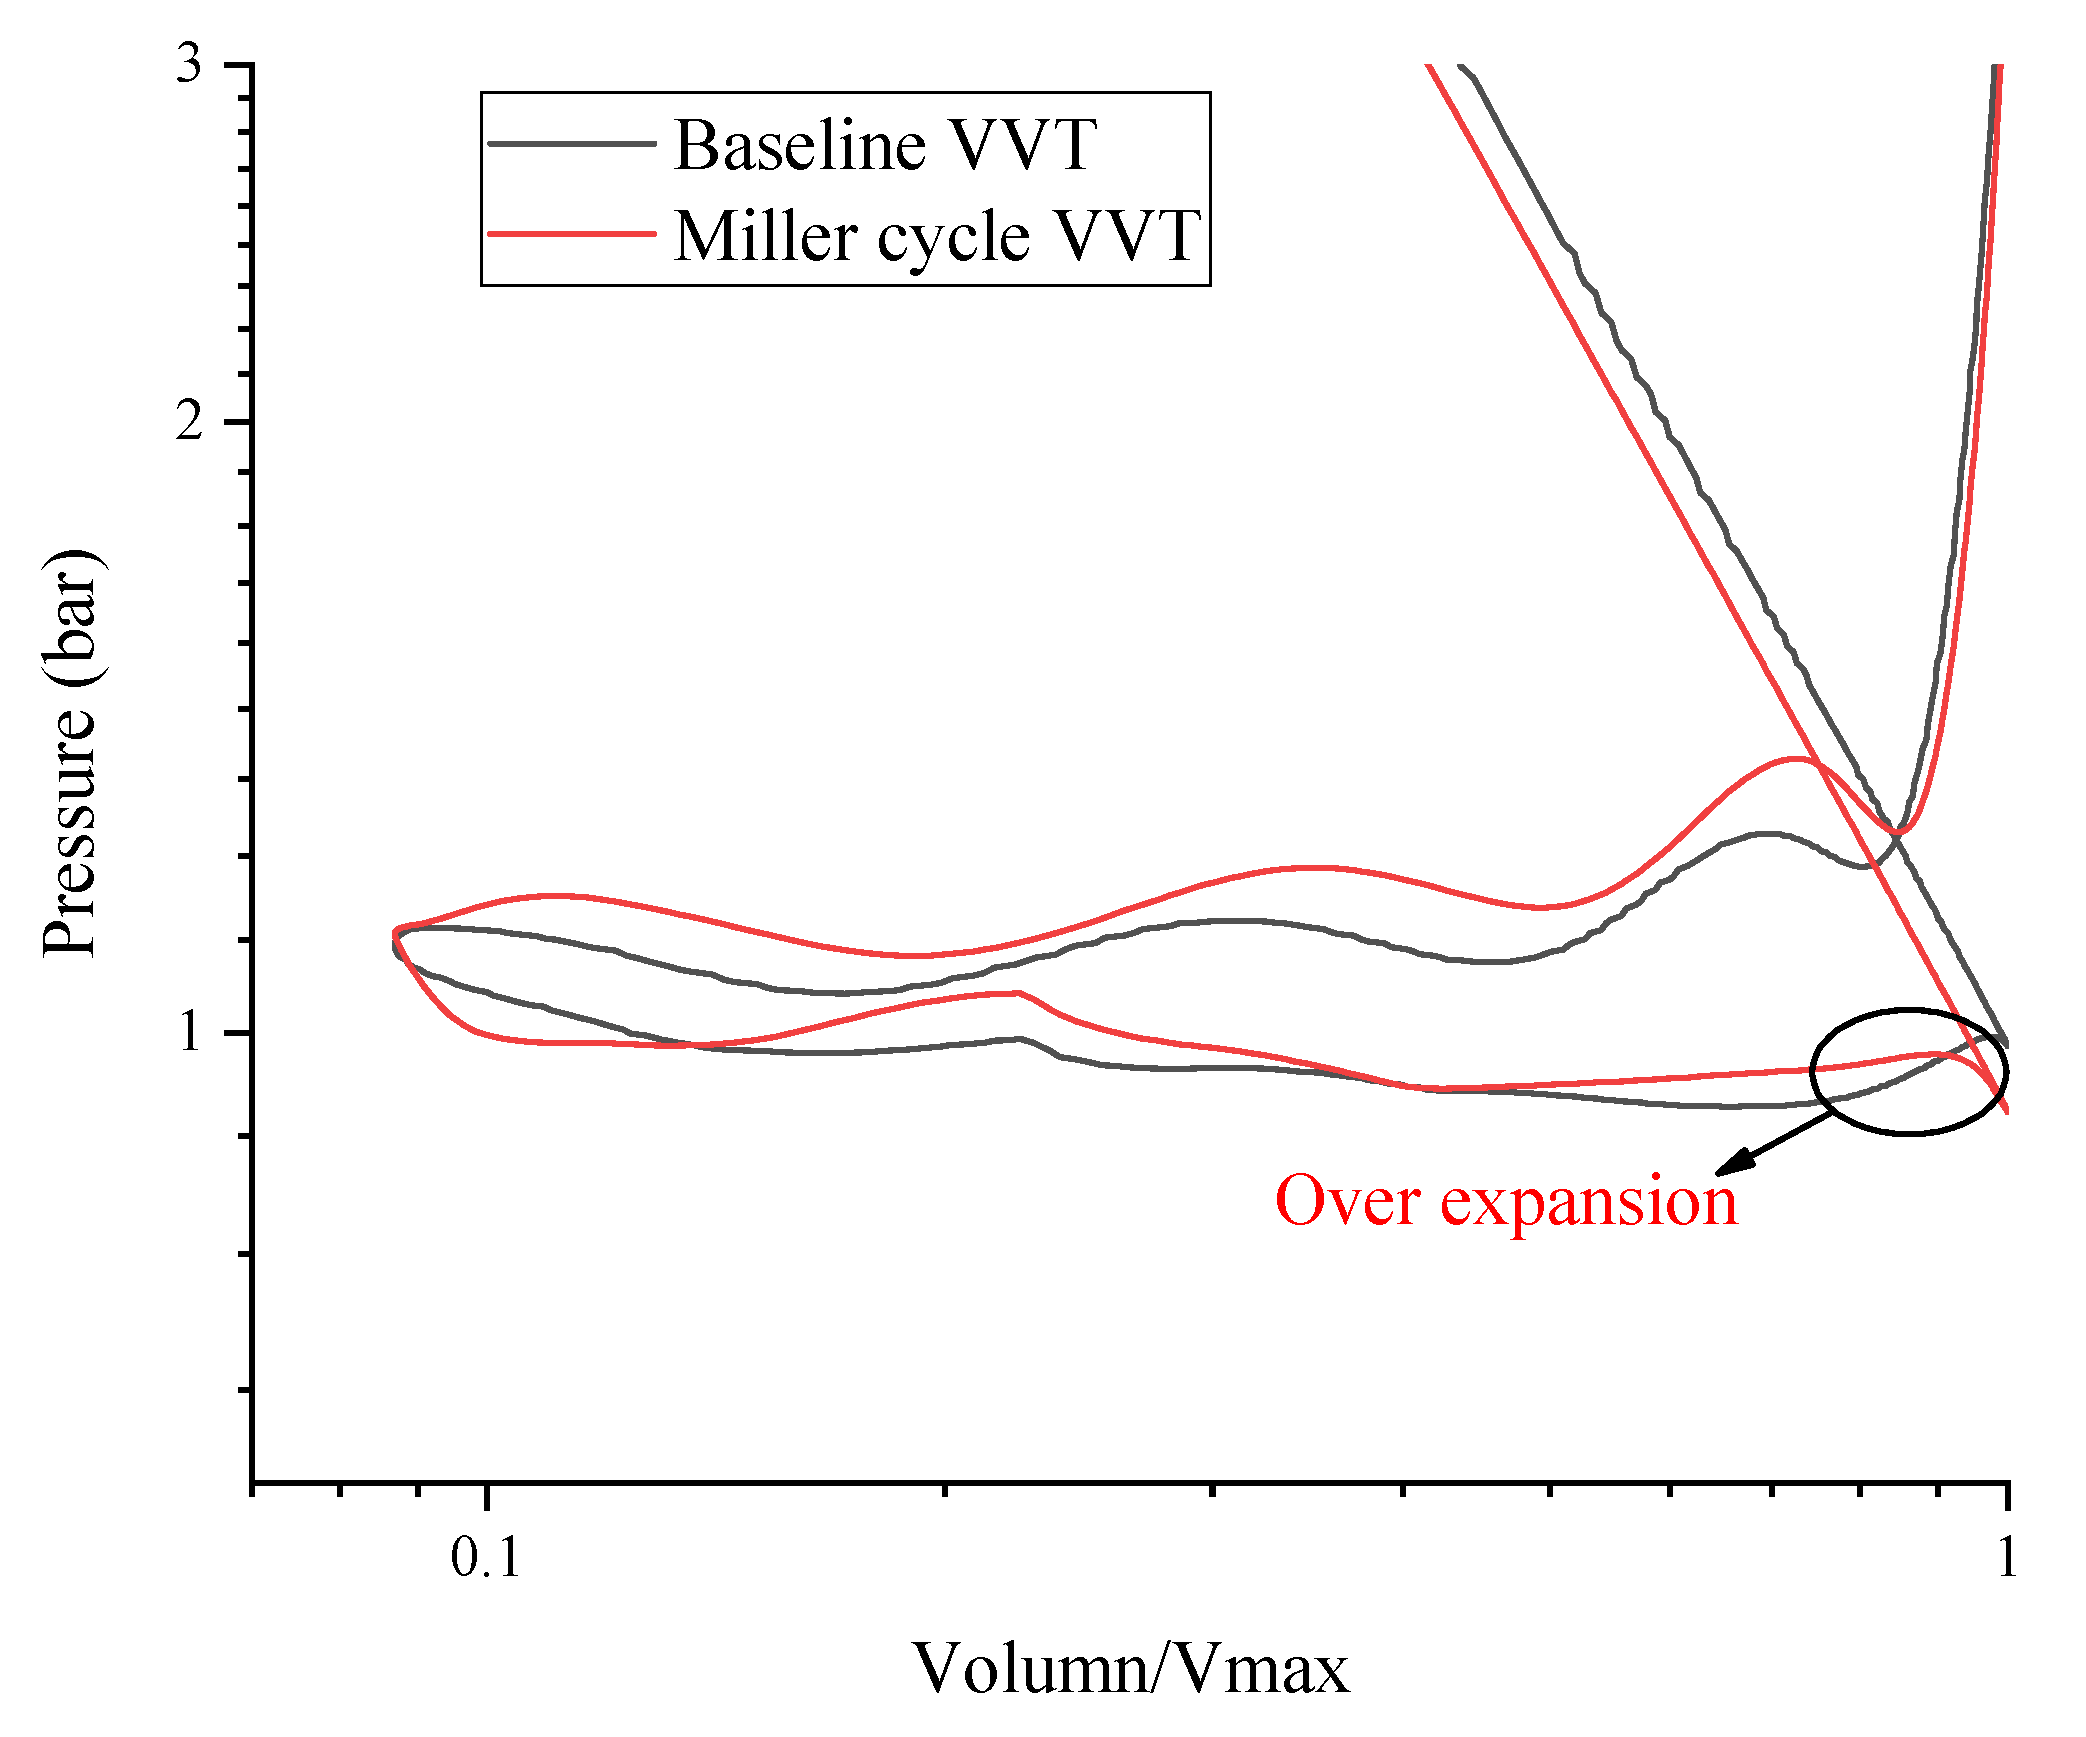
Figure 7 shows the logP versus logV diagram relative to intake advance angle under baseline EVC at different points of operation. It should be noted that, due to the fluctuation of the test value, the curve was smoothed to a certain extent without decreasing the accuracy.
As shown in Figure 7, an obvious effect of over expansion occurs when the baseline engine is adjusted to the extreme Miller condition at different points of operation, which confirms that the application of the Miller cycle by VVT adjustment is effective. On this basis, a further analysis on combustion can be performed properly.
The change of intake advance angle has a significant influence on the combustion phase. 
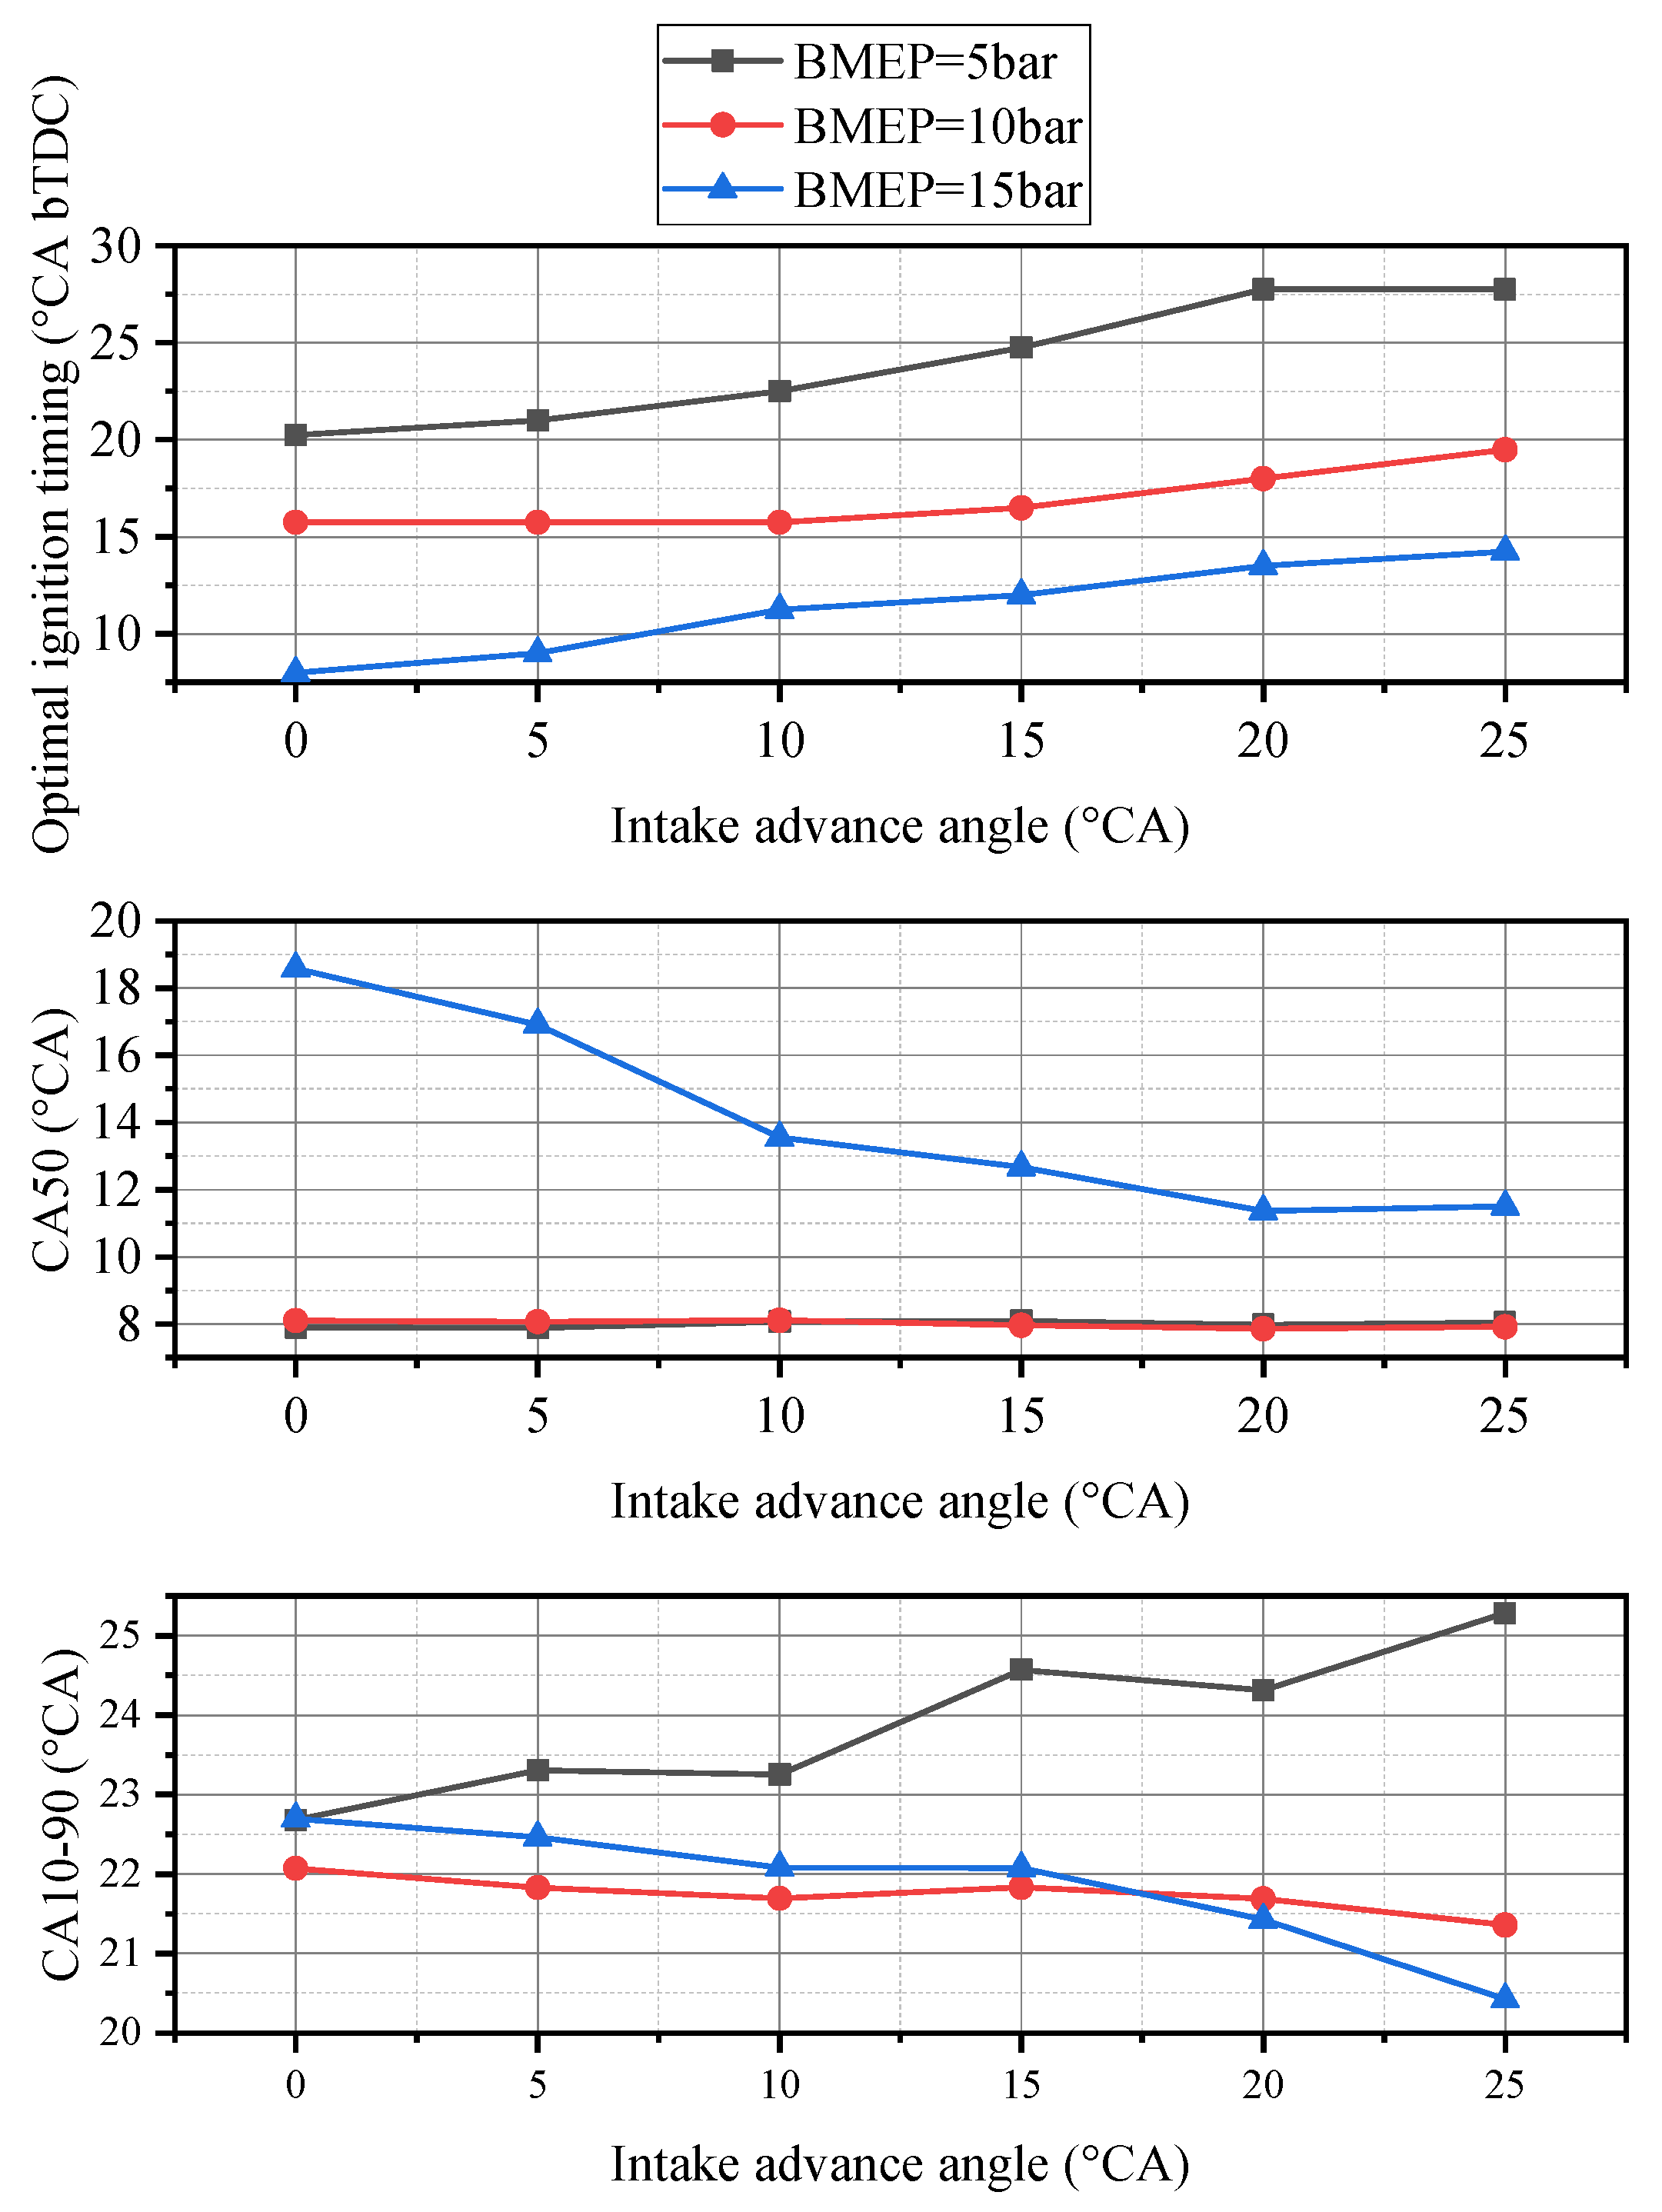
Figure 8 shows the optimal ignition timing, CA50 and CA10-90 relative to intake advance angle under baseline EVC.
Figure 8 first shows the control principle of CA50 during the test: When CA50 is around 8 °CA, the ignition timing is considered to be the best. (If knock occurs when CA50 is greater than 8 °CA, the minimum ignition timing is set at the knock limitation point). Subsequently, as shown in Figure 8, the optimal ignition timing is conspicuously affected by the intake advance angle. As the intake advance angle increases, the effective compression ratio of the Miller cycle decreases, so the knock tendency is suppressed, which could further advance the ignition timing. The load of the engine also has a great influence on the optimal ignition timing: When the intake advance angle is 25 °CA, the optimum ignition timings at 3000 rpm and 5 bar, 3000 rpm and 10 bar, and 3000 rpm and 15 bar are at 27.75, 19.5 and 14.25 °CA BTDC (Before Top Dead Center), respectively. This is because, as the load rises, more fuel is injected in one working cycle, which augments the possibility of knock. Therefore, as the load rises, the ignition timing must be delayed to suppress the tendency of knock.
The change of CA10-90 relative to intake advance angle indicates the influence of the Miller cycle on combustion duration. It can be found from Figure 8 that, at the point of operation at 3000 rpm and 15 bar, due to the ignition timing advance caused by the Miller cycle, combustion duration is remarkably reduced; the combustion duration under medium load conditions also decreases slightly (about 3.2%) with the increase of intake advance angle. The shortening of the combustion duration also indicates the optimization effect of the Miller cycle on in-cylinder combustion. For low-load conditions, the Miller cycle has not been found to improve CA10-90 during combustion.
Additionally, the test found that the variation of exhaust retardation angle under medium and low load conditions had only little effects on the combustion phase. However, after applying the Miller cycle, the change in in-cylinder maximum combustion temperature deserves further attention. In this paper, the in-cylinder temperature is calculated as follows. Firstly a calculation of the air density is completed with the help of in-cylinder pressure, specific gas constant and the intake temperature:
ρ 0 = p n o r m R T i n
Then the temperature in the cylinder by the thermal equation of state is calculated:
T = p i n c y c l i n d e r V i n c y c l i n d e r ρ 0 V 0 v e f f R
In this formula, V0 represents the displacement of the cylinder while veff represents the volumetric efficiency. The value 0.9 is a suggested value for the volumetric efficiency which will automatically be corrected by the formula with the help of the calculated intake pressure.
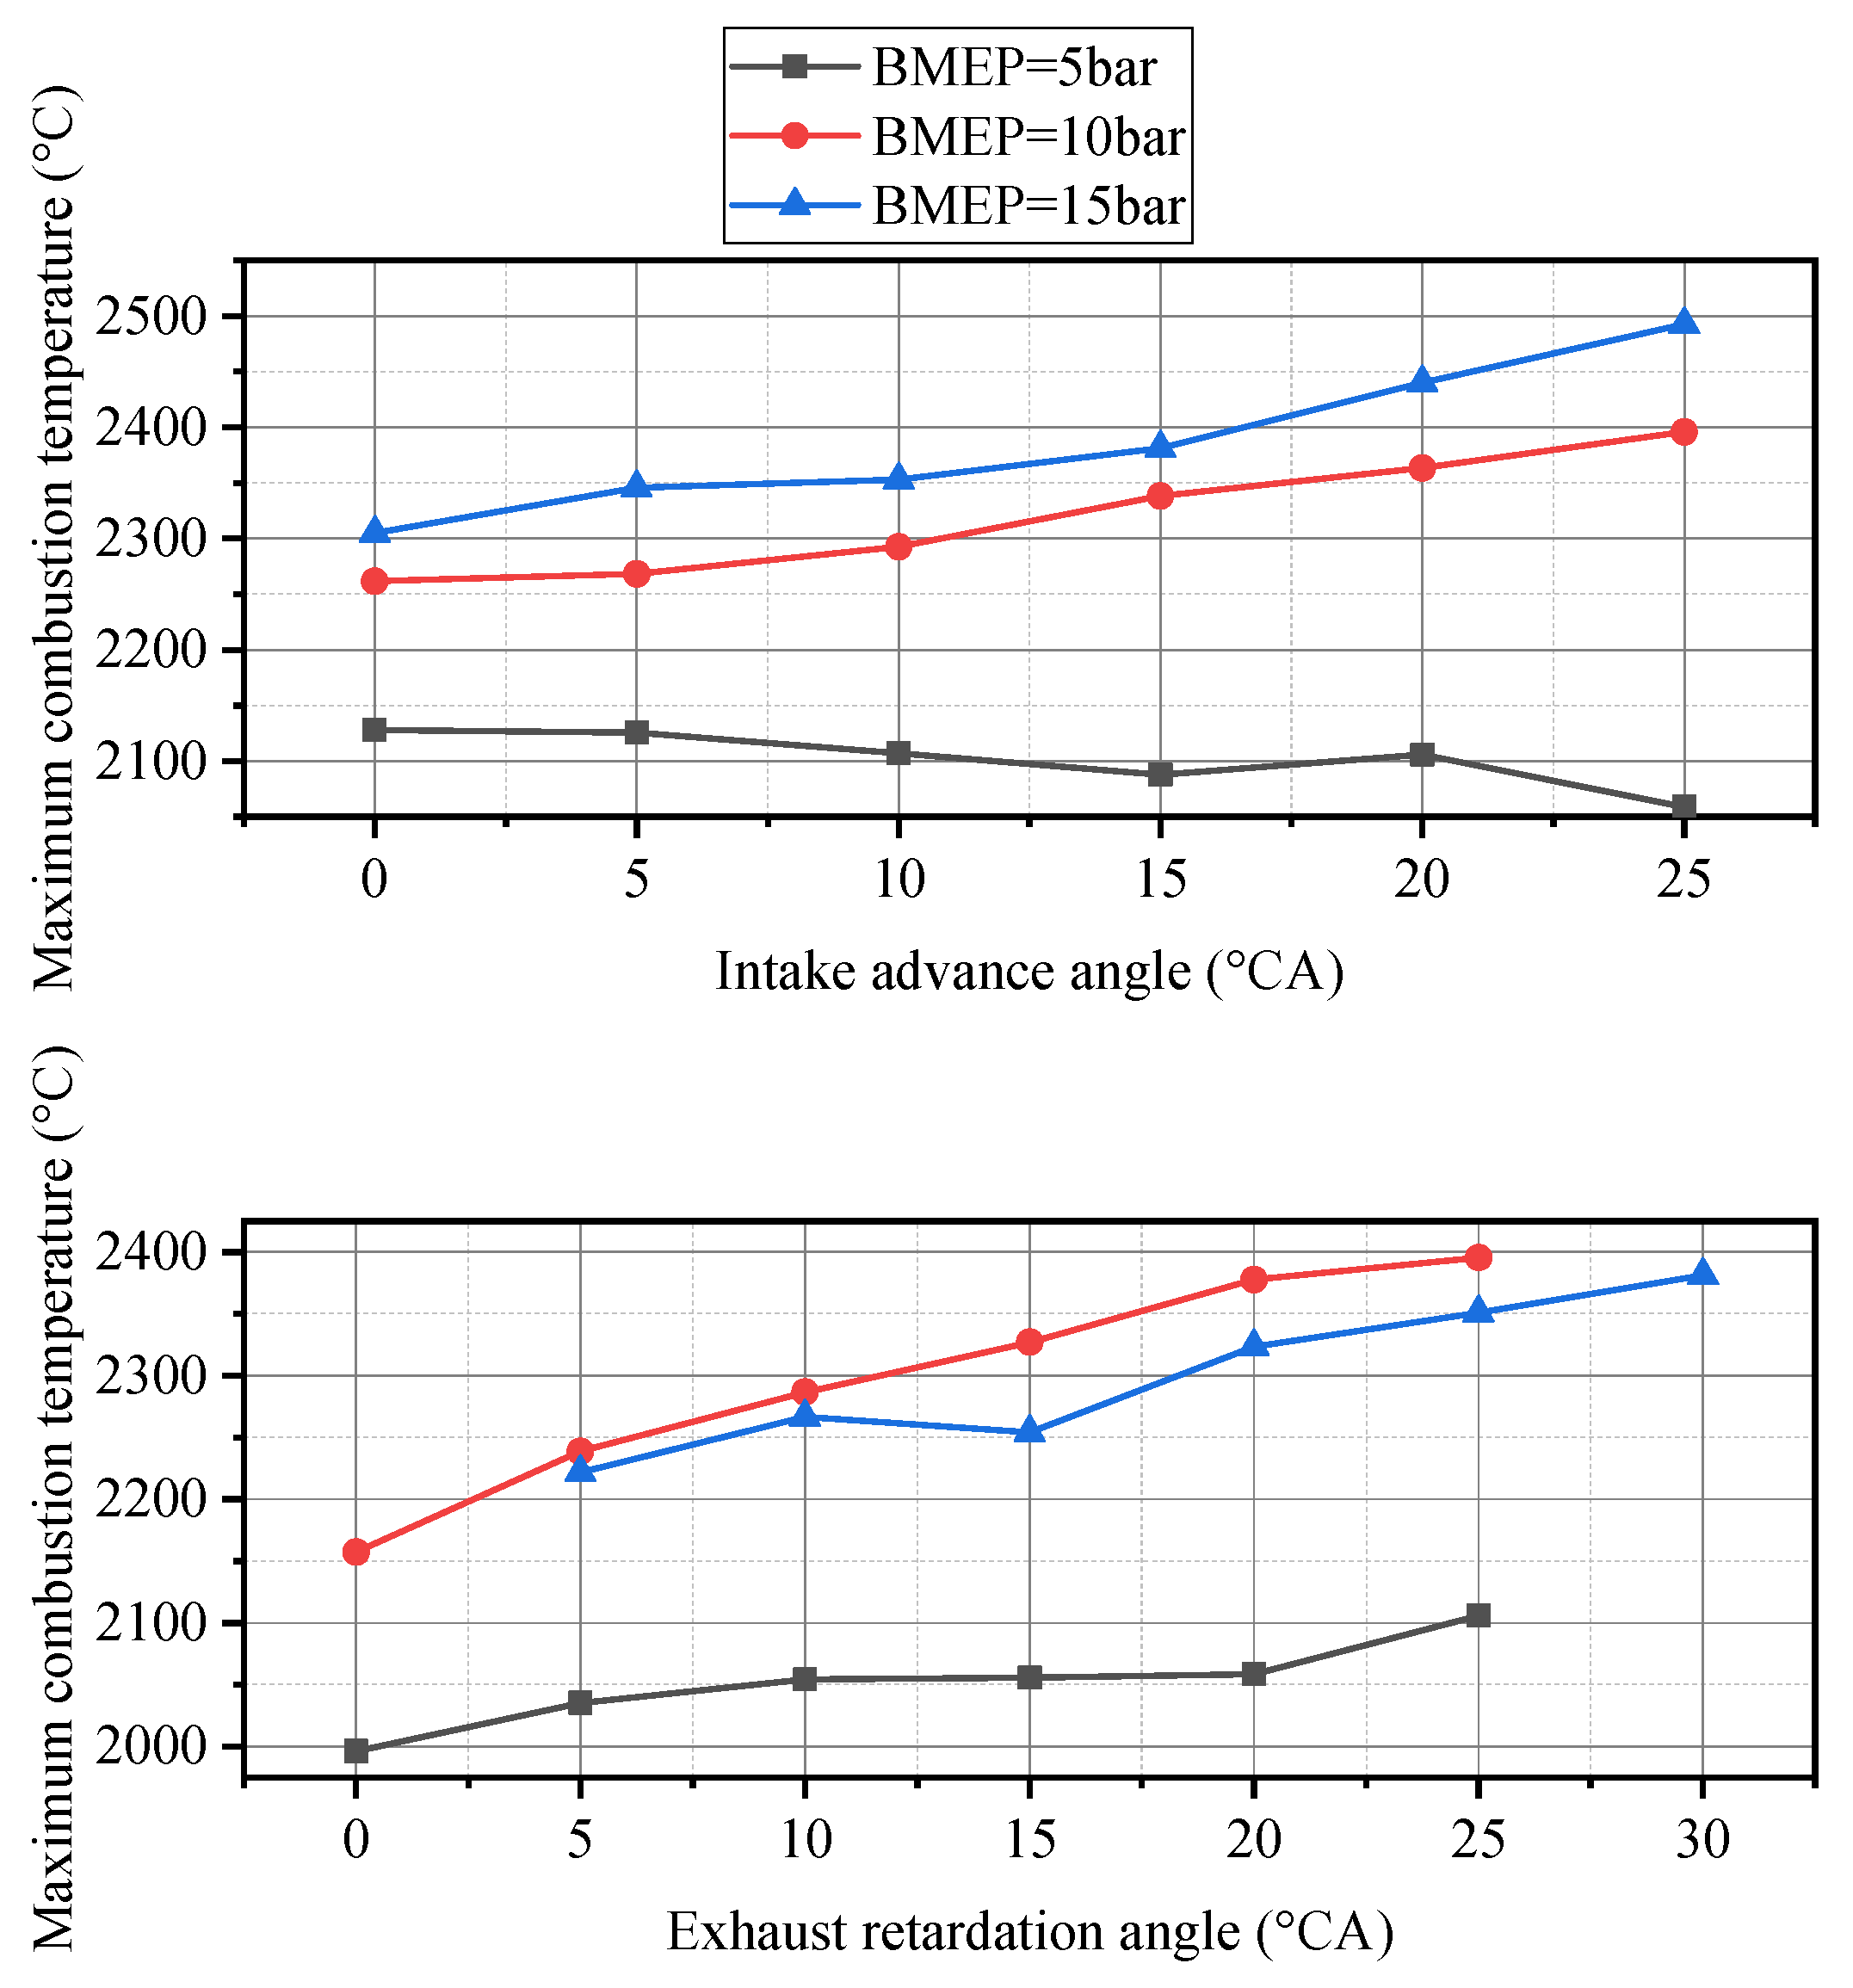
Figure 9 illustrates maximum combustion temperature relative to intake advance angle under baseline EVC, and maximum combustion temperature relative to exhaust retardation angle under the Miller cycle at different points of operation during the test.
It can be seen from Figure 9 that the in-cylinder maximum combustion temperature relative to intake advance angle varies from loads at 3000 rpm: At the point of operation at 3000 rpm and 5 bar, the in-cylinder maximum combustion temperature shows a slight downward trend while the in-cylinder maximum combustion temperature shows an opposite trend under medium- and high-load conditions. On the other hand, the in-cylinder maximum combustion temperature relative to exhaust retardation angle under different loads at 3000 rpm shows a much more obvious change: As the exhaust retardation angle decreases, the in-cylinder maximum combustion temperature drops remarkably. The dramatic drop occurs under the high load condition at 3000 rpm, and a deep Miller cycle combined with a smaller exhaust retardation angle can reduce the maximum combustion temperature even below the baseline engine under all three test conditions. The reason for this phenomenon is that when the exhaust retardation angle is reduced, less high-temperature exhaust gas in the intake stroke is returned to the cylinder, so the temperature of the cylinder gas at the end of the intake stroke is lower, which is beneficial to the combustion process.
According to the above analysis, it can be concluded that deep Miller cycle with the appropriate valve overlap angle can effectively reduce in-cylinder maximum combustion temperature at 3000 rpm: For the most commonly used 3000 rpm and 10 bar condition, the in-cylinder maximum combustion temperature of the baseline engine reaches approximately 2260 °C. After applying deep Miller cycle combined with the smaller exhaust retardation angle (30 °CA for the intake advance angle and 5 °CA for the exhaust retardation angle), the in-cylinder maximum combustion temperature drops to approximately 2240 °C, and further reducing the exhaust retardation angle can even lower the maximum combustion temperature to below 2200 °C.
The reduction of in-cylinder maximum combustion temperature is a manifestation of the improvement in combustion conditions because a higher in-cylinder maximum combustion temperature produces a higher thermal load, which causes the thermal efficiency deterioration of the engine; at the same time, a higher in-cylinder maximum combustion temperature does harm to the lubrication and the durability of the components; besides, a higher in-cylinder maximum combustion temperature increases the generation of NOx, which adversely influences the engine emission characteristics.
• Friction loss
The energy lost in one cycle to overcome the friction also has a significant impact on the fuel economy. Friction mean effective pressure (FMEP) is a common parameter to characterize the friction loss in the engine working cycle. The main influencing factor of FMEP is the average speed of the piston during the working cycle and in-cylinder peak pressure. Since the engine speed is always maintained at 3000 rpm during the test, the average piston speed does not affect the FMEP. Consequently, only the in-cylinder peak pressure determines the value of FMEP.
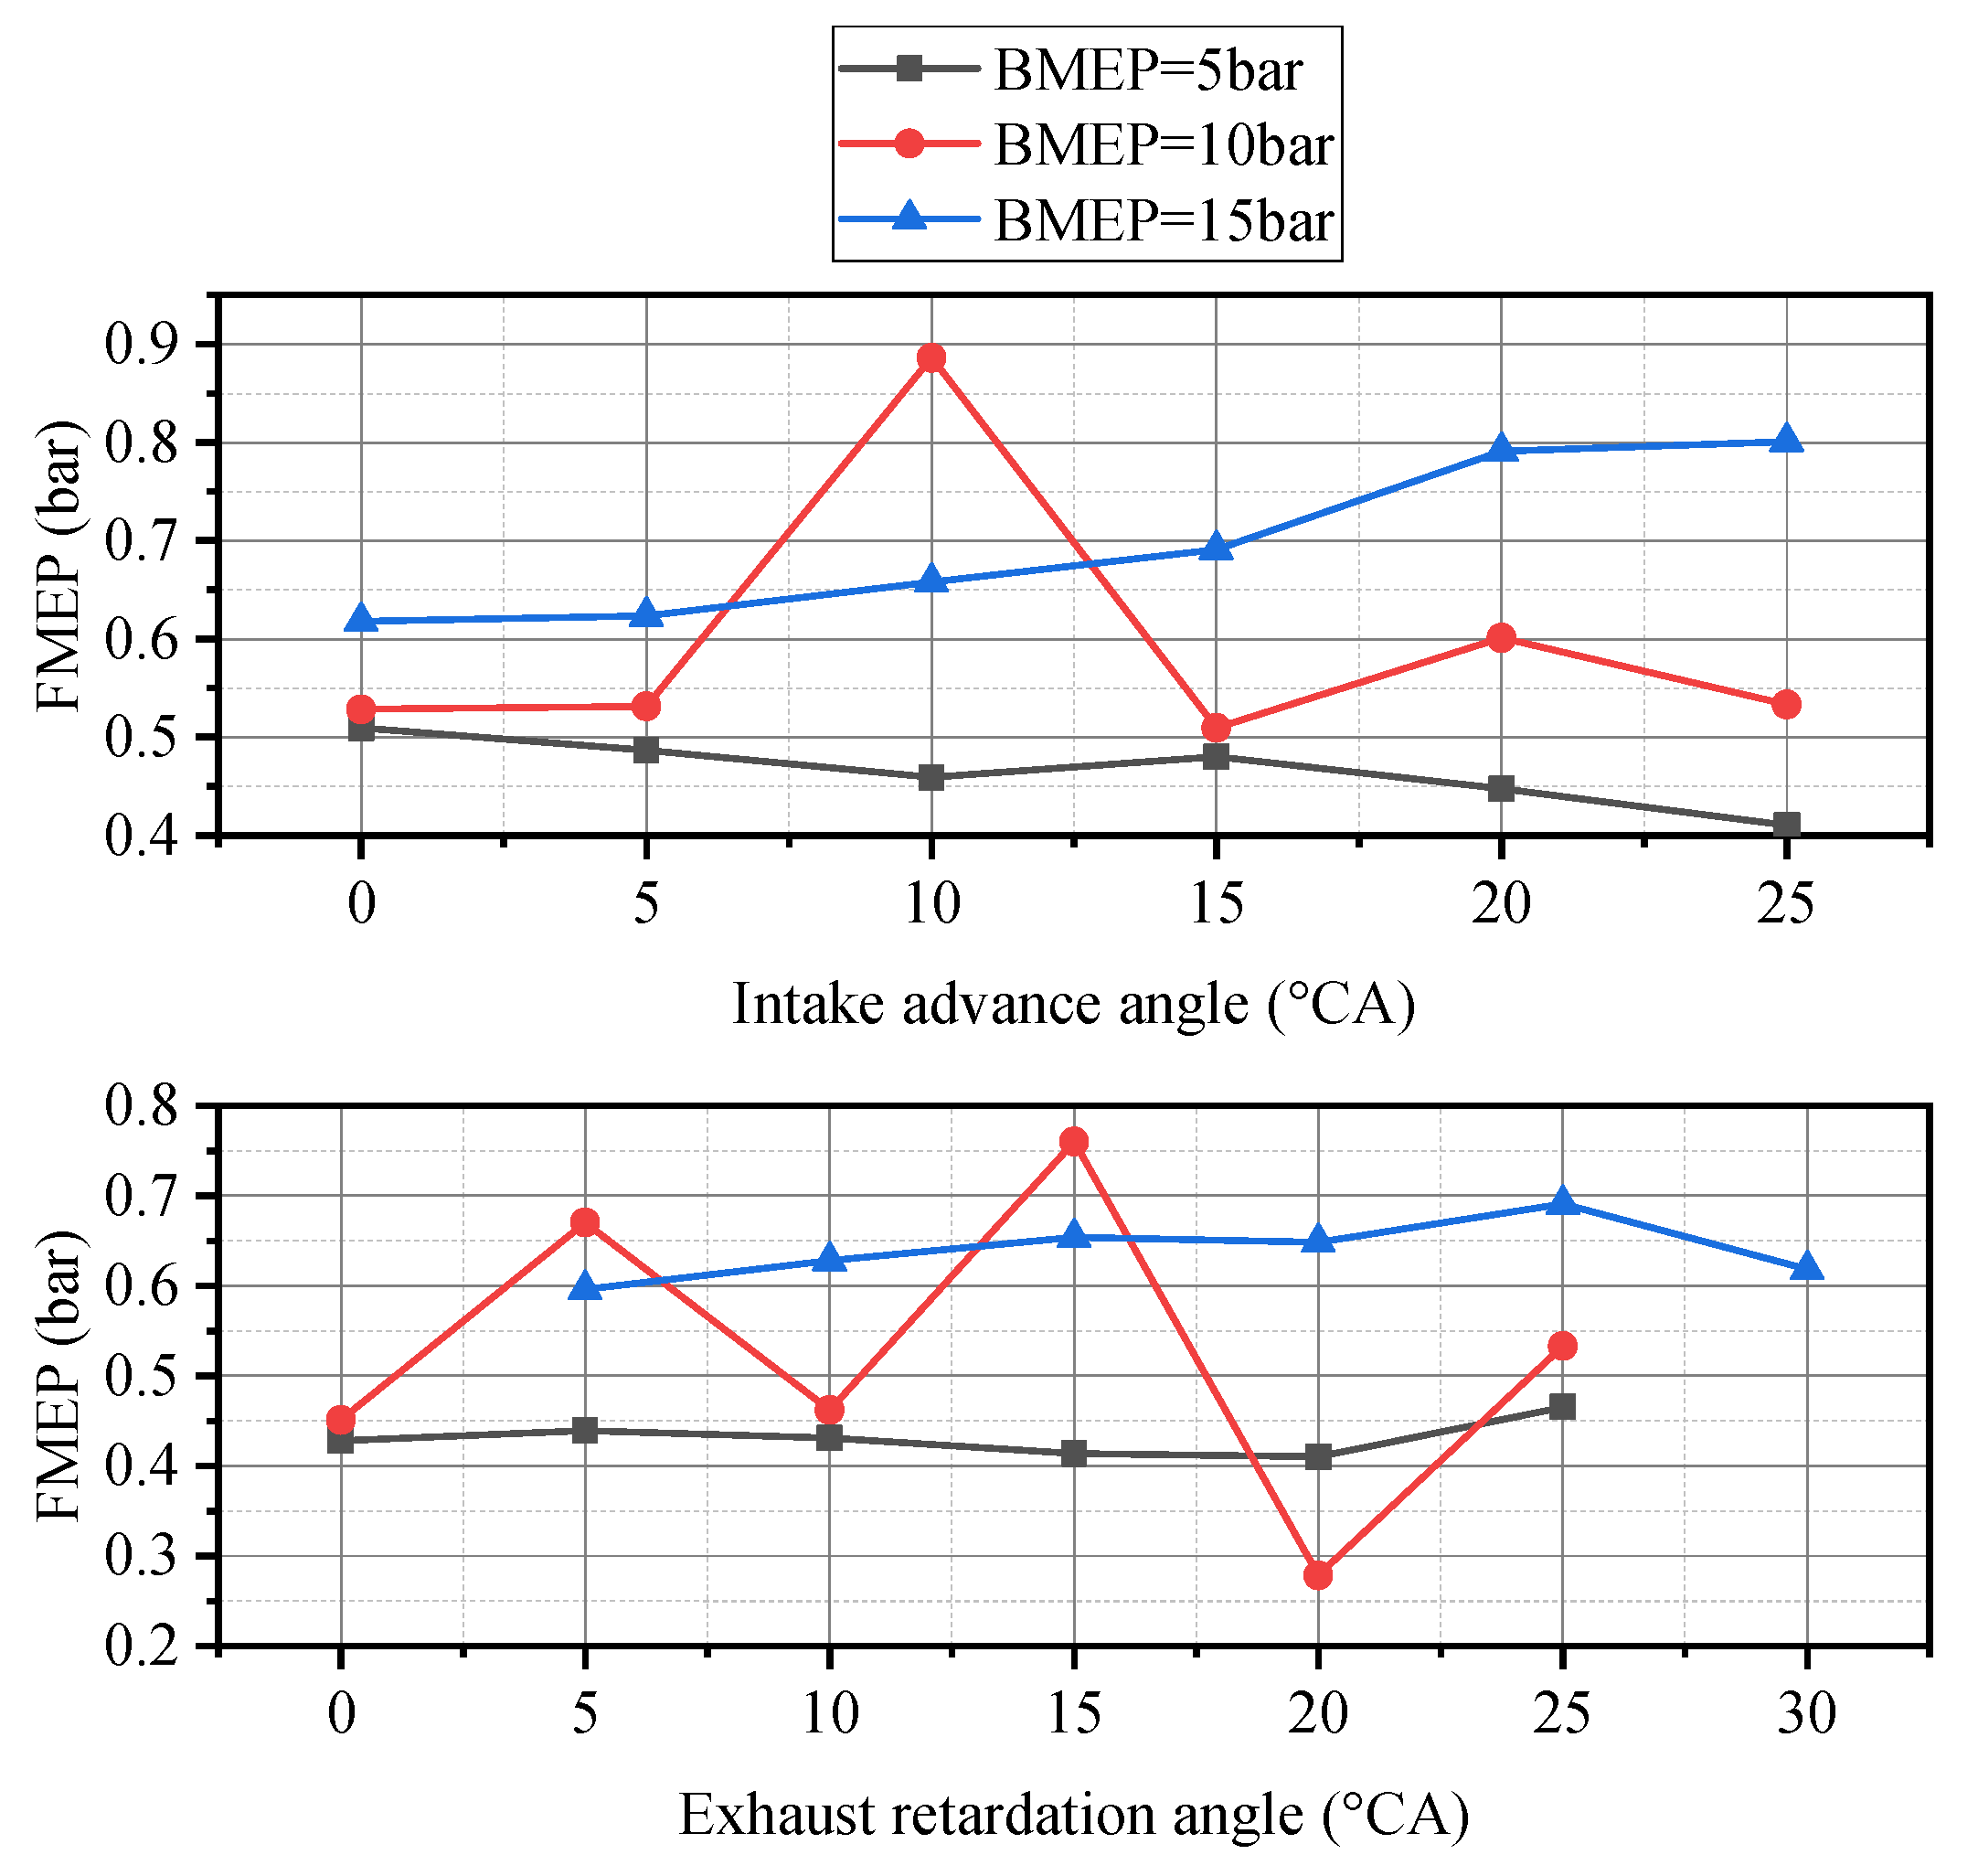
 Figure 10 and Figure 11 show in-cylinder peak pressure and FMEP relative to intake advance angle under baseline EVC, and in-cylinder peak pressure relative to exhaust retardation angle under the Miller cycle at different points of operation during the test.
As shown in Figure 10, the in-cylinder peak pressure is remarkably affected by the load: The in-cylinder peak pressure increases as the load rises, which, as a result, magnifies the friction loss. As can be seen in Figure 11, the fluctuation of FMEP at 3000 rpm and 10 bar seems to be abnormal, but generally speaking, the trends at different loads are consistent with the relationship between the peak pressure and intake advance angle or exhaust retardation angle.
Under high-load conditions, as the Miller cycle is deepened, the in-cylinder peak pressure changes oppositely from the medium and low load. This is because when the Miller cycle is deepened, the CA50 is greatly decreased due to the advance of the ignition timing. Moreover, the in-cylinder combustion rate is accelerated, which causes the in-cylinder peak pressure and FMEP to rise, so that the friction loss becomes correspondingly larger. Contrary to the intake advance angle characteristic, under the high load condition, as the exhaust retardation angle decreases, the in-cylinder peak pressure decreases remarkably. When the exhaust retardation angle decreases from 30 to 5 °CA, the in-cylinder peak pressure drops from 77.32 to 67.11 bar, which is a drop of about 13%. This is followed by a drop in FMEP, which dramatically reduces the in-cylinder friction loss, which indicates that a deep Miller cycle matching a smaller exhaust retardation angle under the high load condition can achieve an equivalent FMEP to the baseline engine. Meanwhile, the baseline engine is further improved in terms of pumping loss and combustion after the Miller cycle application.

2.3.2. Performance Increase of the Miller Cycle

After the Miller cycle application, the above effects directly affect the BSFC under different loads. 
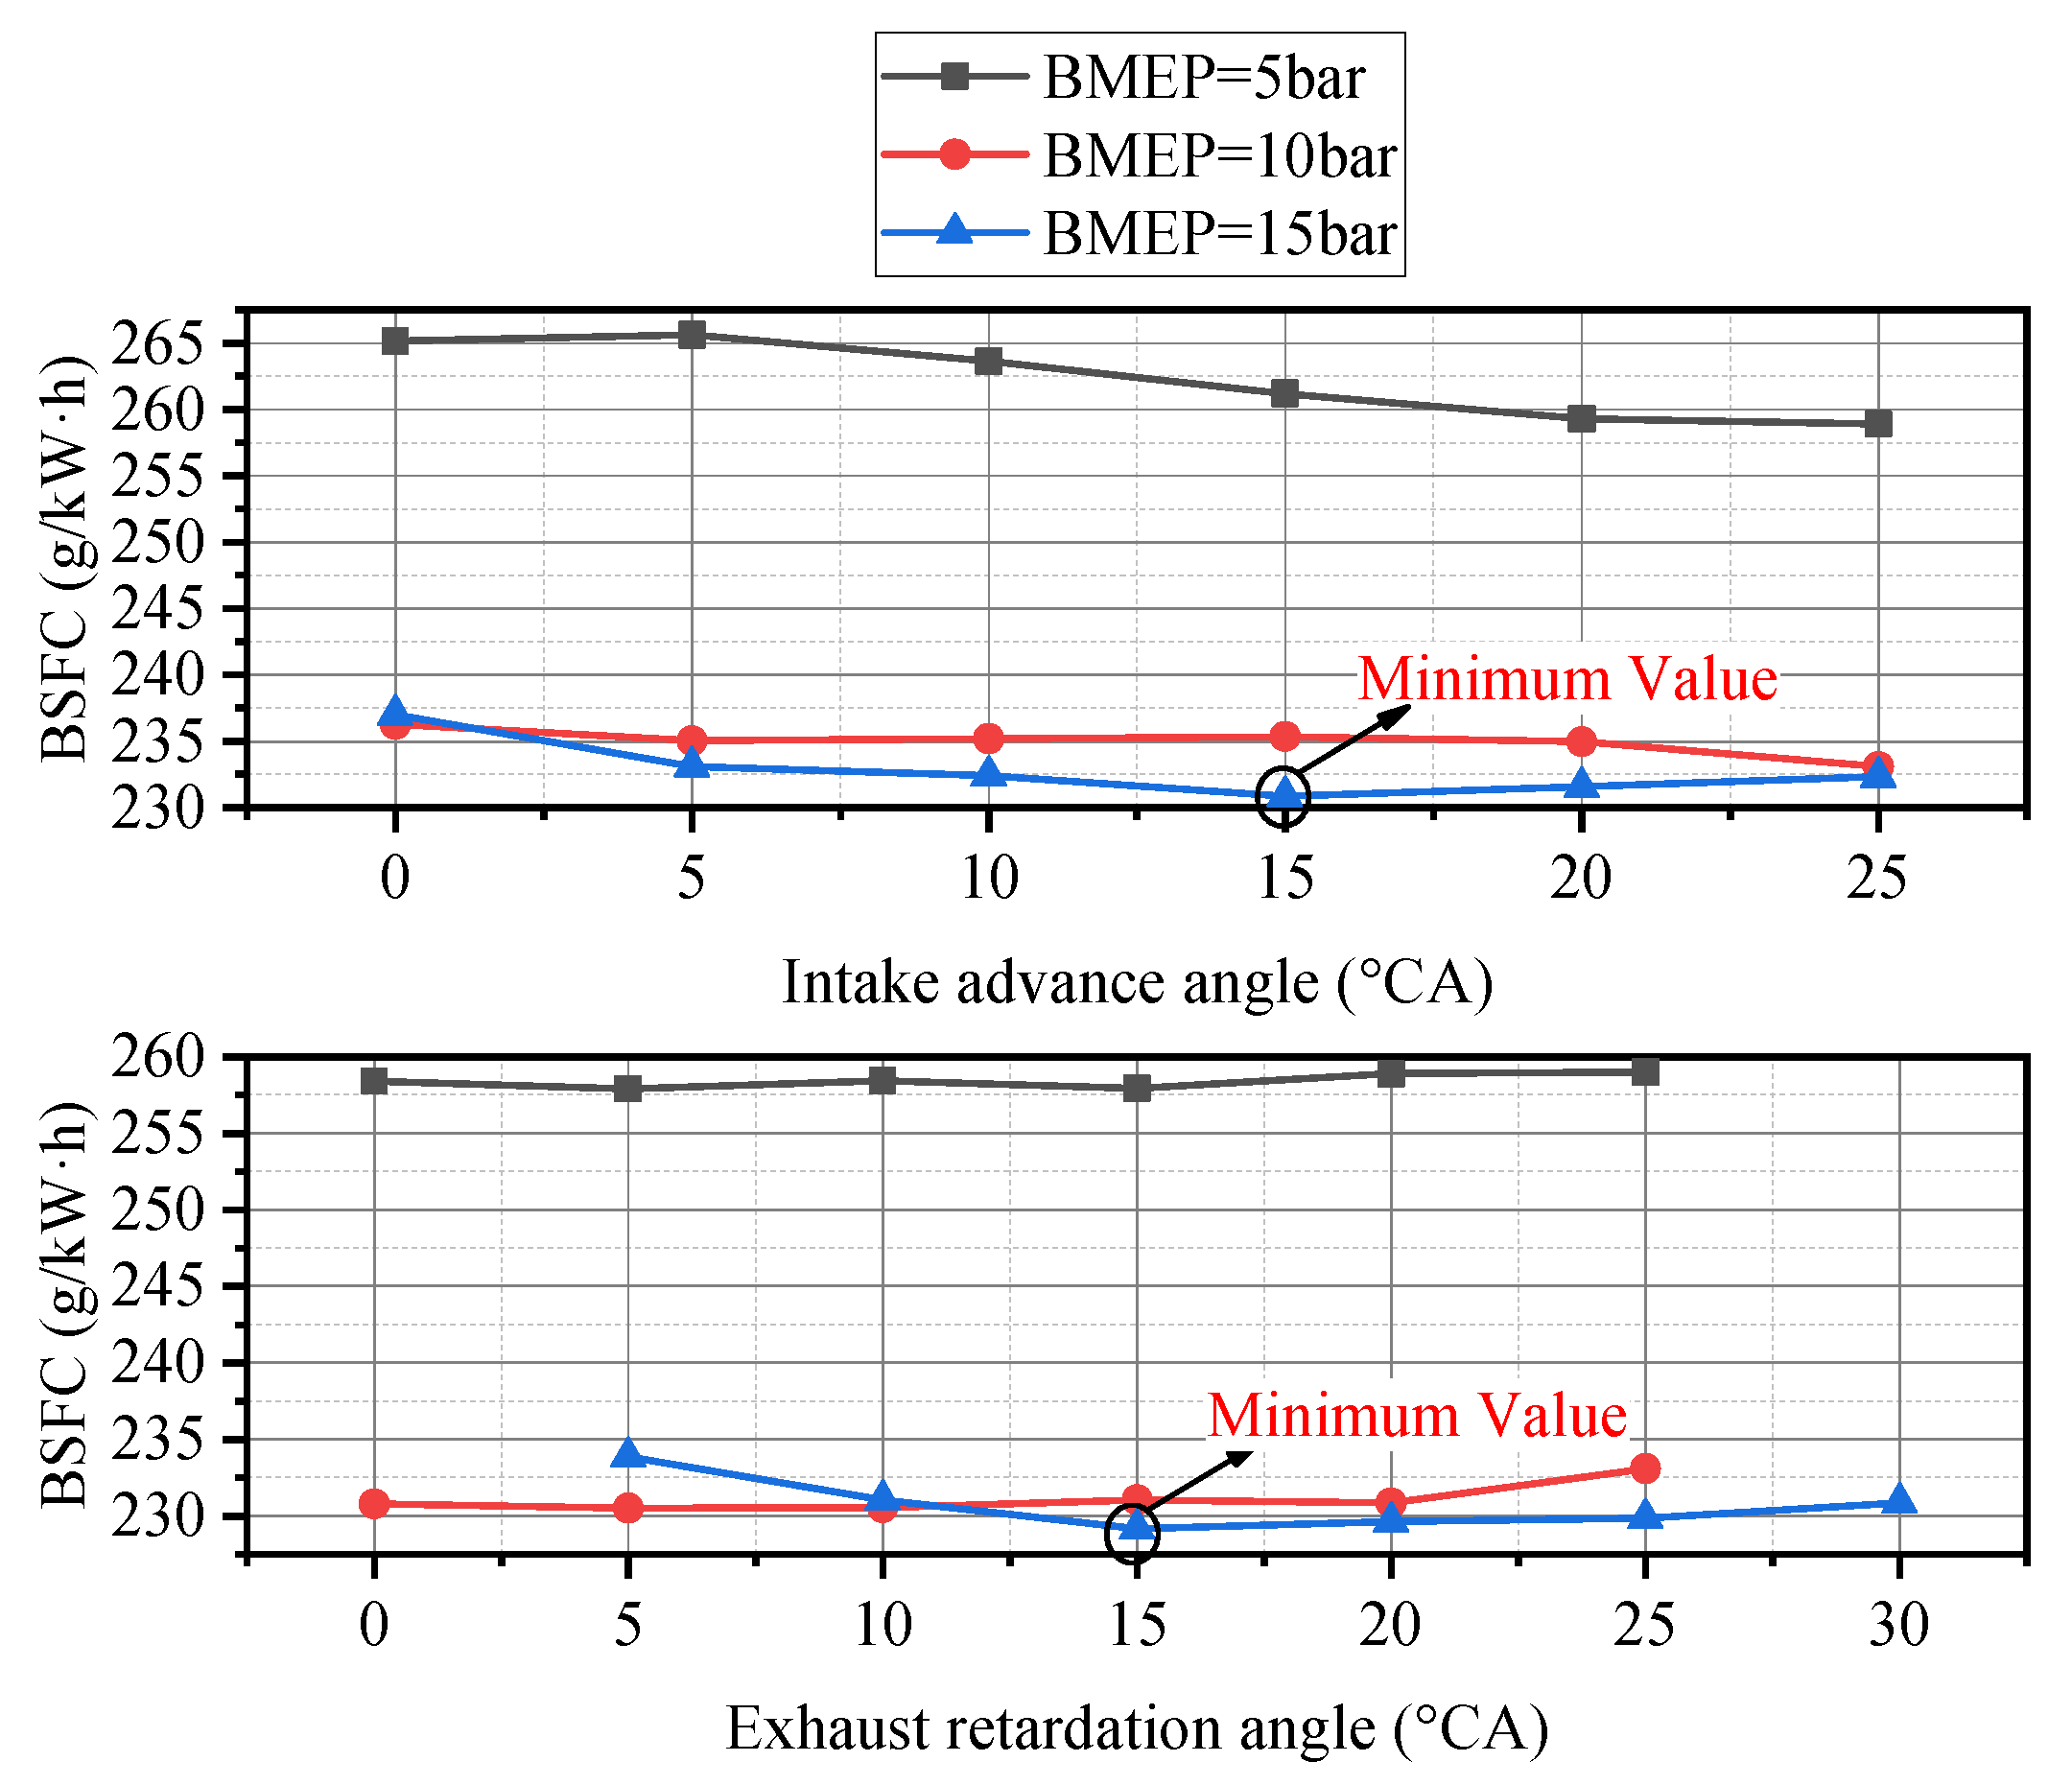
Figure 12 shows BSFC relative to intake advance angle under baseline EVC, and BSFC relative to exhaust retardation angle under the Miller cycle at different points of operation during the test.
It can be seen from Figure 12 that, as the intake advance angle increases, the continuous deepening of the Miller cycle has a significant influence on BSFC. At the point of operation at 3000 rpm and 5 bar, the BSFC is reduced from 265.1 g/kW·h of the baseline engine to 258.9 g/kW·h, with an improvement of about 2.3%. For low-load conditions, the reduction in BSFC is mainly due to the significant improvement in PMEP as the Miller cycle is deepened, which is beneficial to the fuel economy. For medium load conditions, when the Miller cycle is deepened, the influence of PMEP is negligible, while the combustion and FMEP are slightly improved. As a result, when the intake advance angle is adjusted from baseline VVT to Miller cycle VVT, BSFC drops from 236.3 to 233.1 g/kW·h.
In addition, it can be inferred from Figure 12 that the engine load also determines BSFC considerably. The rise of engine load can accelerate the in-cylinder air flow speed and the speed of flame front, which is beneficial to reduce the BSFC. However, as the engine load rises, the gas flow in the cylinder is strengthened and the heat transfer loss is also increased. Therefore, the optimal BSFC is achieved within the range from medium to high load at 3000 rpm (the above two effects are balanced at medium and high load). The exhaust retardation angle also has a certain impact on BSFC. Under low load conditions, since the pumping loss, combustion and friction loss vary slightly with the change of exhaust retardation angle, the BSFC change is also insignificant. BSFC reaches 257.9 g/kW·h when the exhaust retardation angle is 5 °CA at 3000 rpm and 5 bar, which is slightly lower than the IVC optimization result by 1g/kW·h. At the point of operation of 3000 rpm and 10 bar, the change of exhaust retardation angle still has a potential for the BSFC reduction. The reason is that the pumping loss and combustion are improved to some extent with the advance of the exhaust retardation angle. Therefore, compared with the IVC optimization results, when the exhaust retardation angle is 5 °CA, the BSFC can reach 230.5 g/kW·h, which is about 2.4% lower than the BSFC of the baseline engine.
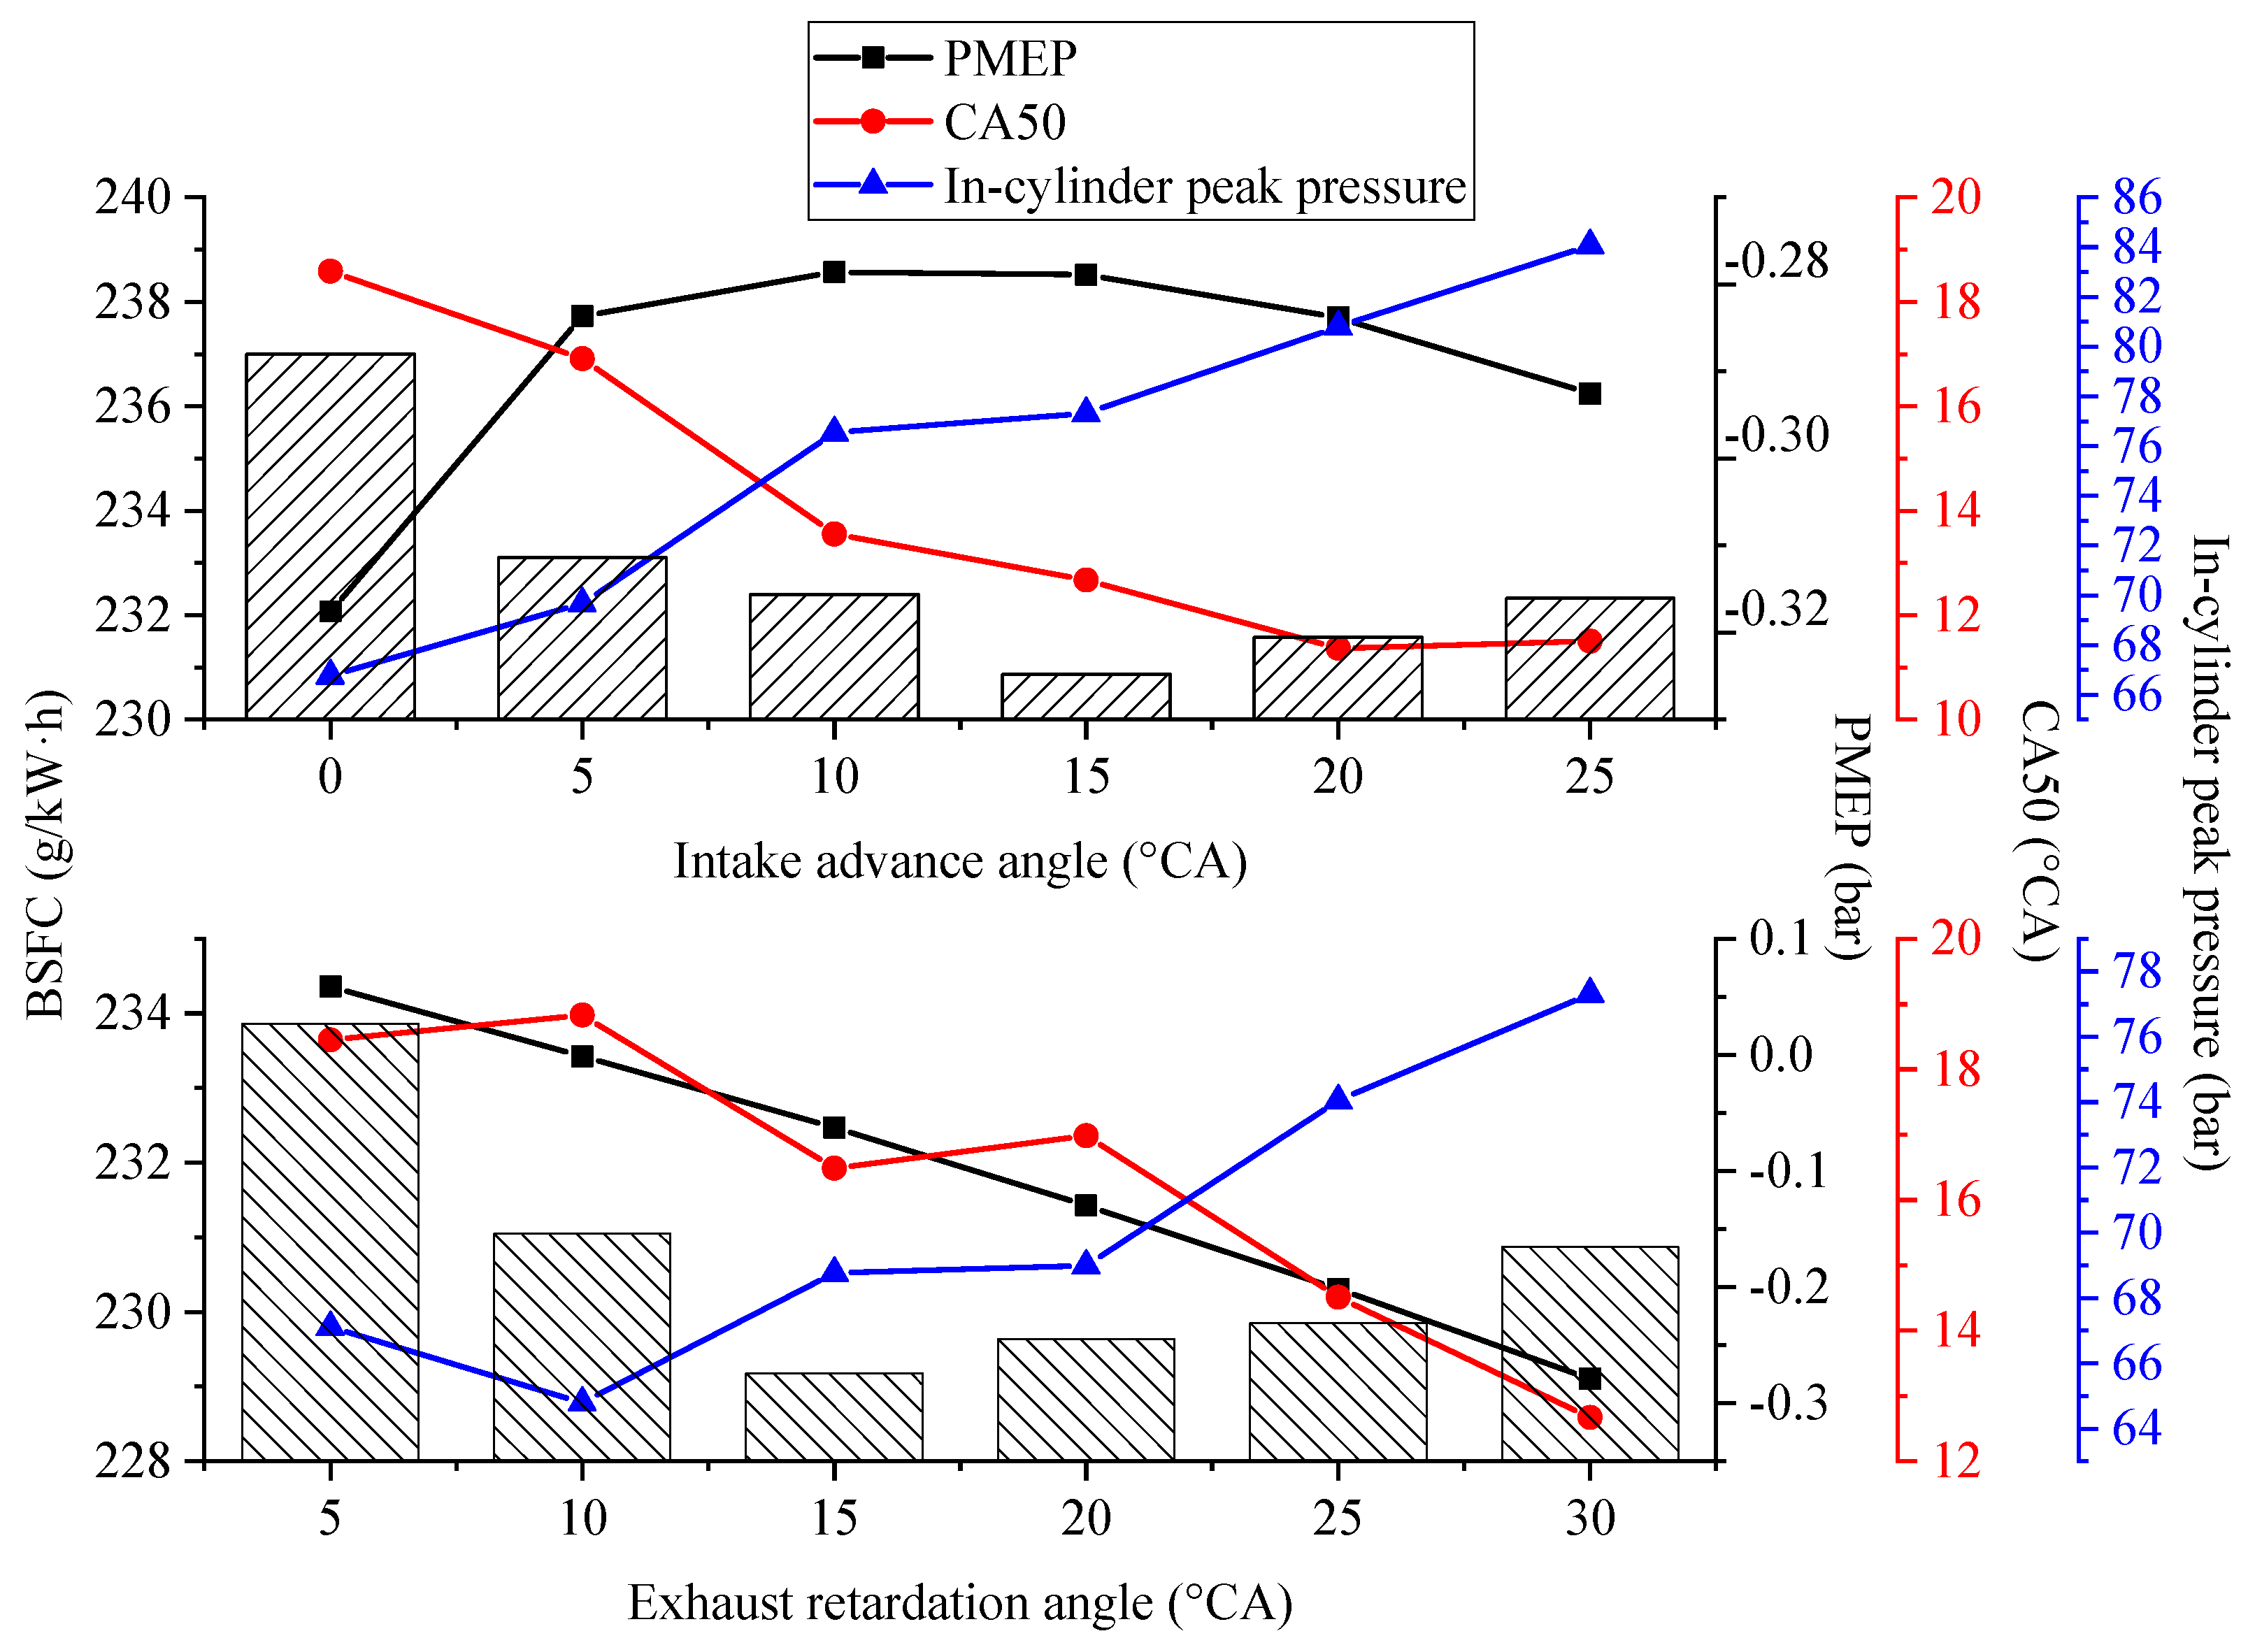
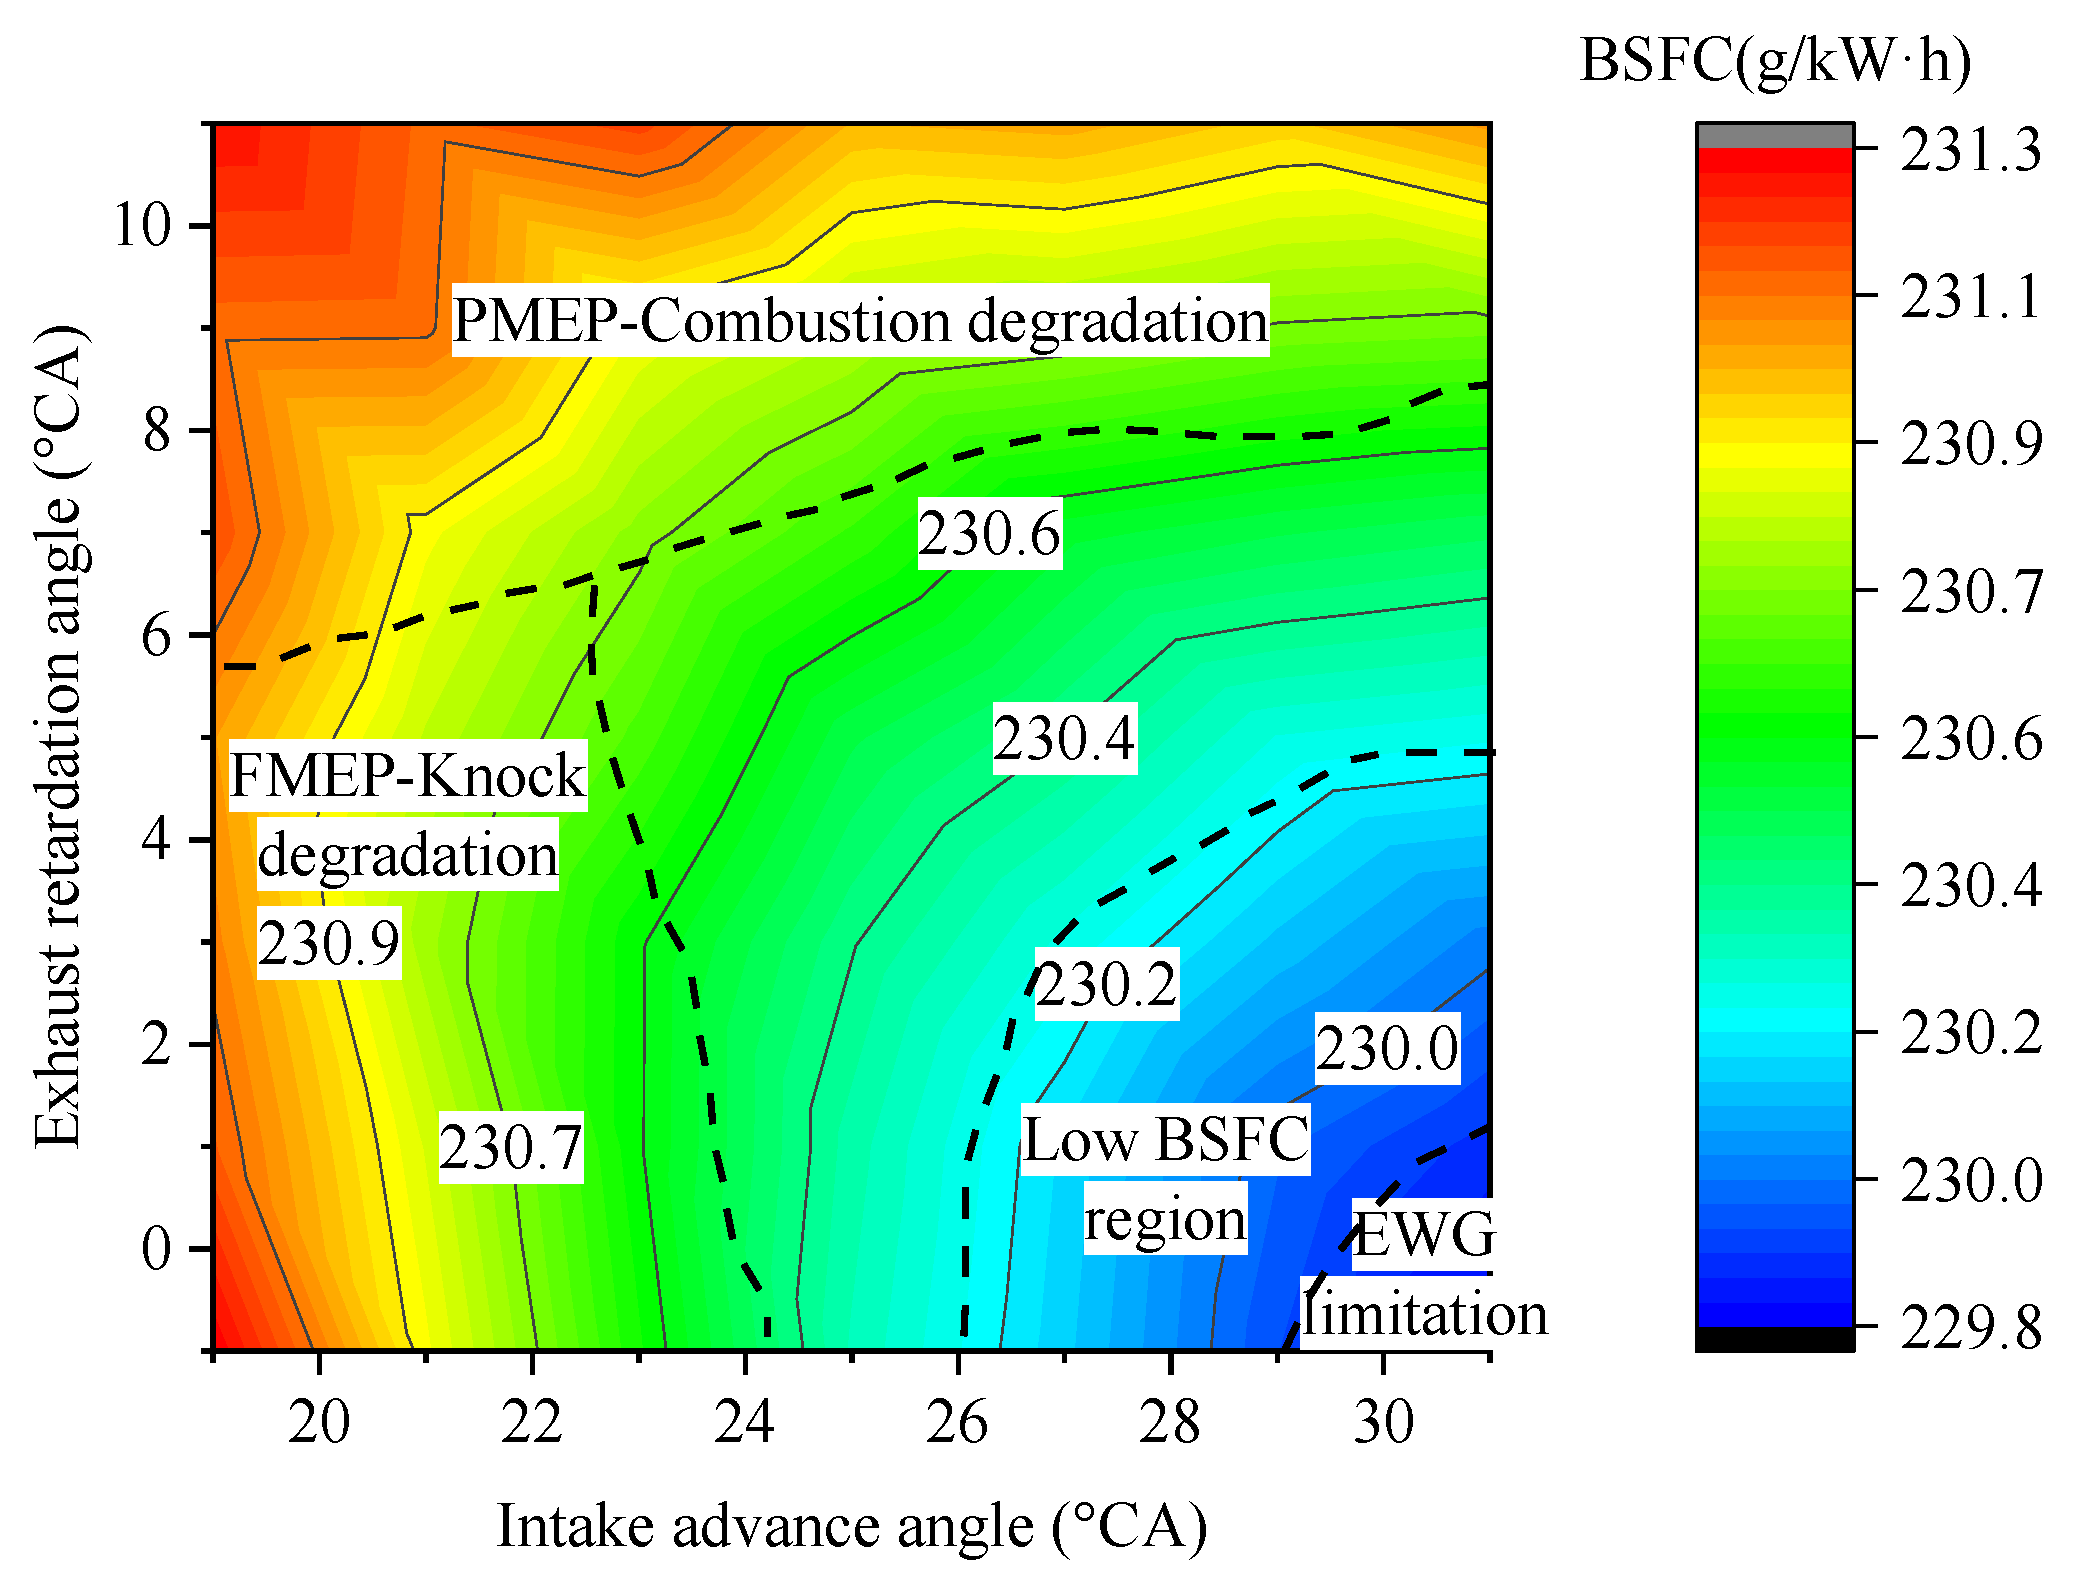
At the point of operation at 3000 rpm and 15 bar, the BSFC has an obvious minimum value in Figure 10. To explain it clearly, Figure 13 shows BSFC and related effects relative to the intake advance angle under baseline EVC, and BSFC and related effects relative to the exhaust retardation angle under the Miller cycle at the point of operation 3000 rpm and 10 bar.
At the point of operation at 3000 rpm and 15 bar, as Miller cycle is deepened, the PMEP variation range is relatively small, and the optimal intake advance angle is about 10 to 15 °CA; the ignition timing and CA50 are significantly advanced, which results in a large improvement in combustion. However, due to the rise of in-cylinder peak pressure, the deteriorated friction loss offsets some of the improvement due to the benefit in combustion. As can be seen in Figure 6, the intake pressure after intercooler is also the maximum at the intake advance angle of 15 °CA. The relationship between the above three achieves the best overall effect when the intake advance angle is 15 °CA. Compared to 237.0 g/kW·h BSFC of the baseline engine, the deep Miller cycle can be used to reduce it to 230.9/kW·h, which is about 2.6%.
Similarly, the optimal BSFC at 15 °CA exhaust retardation angle is the consequence of the integrated effects of pumping loss, combustion and friction loss. As the exhaust retardation angle decreases, friction loss is well improved. At the same time, due to the knock limit, the CA50 deteriorates remarkably, and besides, when the exhaust retardation angle continues to decrease from 15 °CA, the in-cylinder maximum combustion temperature (not shown) also drops by only a small amount. Due to poor combustion, when the exhaust retardation angle is adjusted excessively, the BSFC saved by pumping loss and friction loss improvement is insufficient to overcome the loss caused by combustion deterioration, resulting in degradation of engine fuel economy. Therefore, the optimal exhaust retardation angle is set to 15 °CA, and the BSFC at this time is 229.2 g/kW·h.
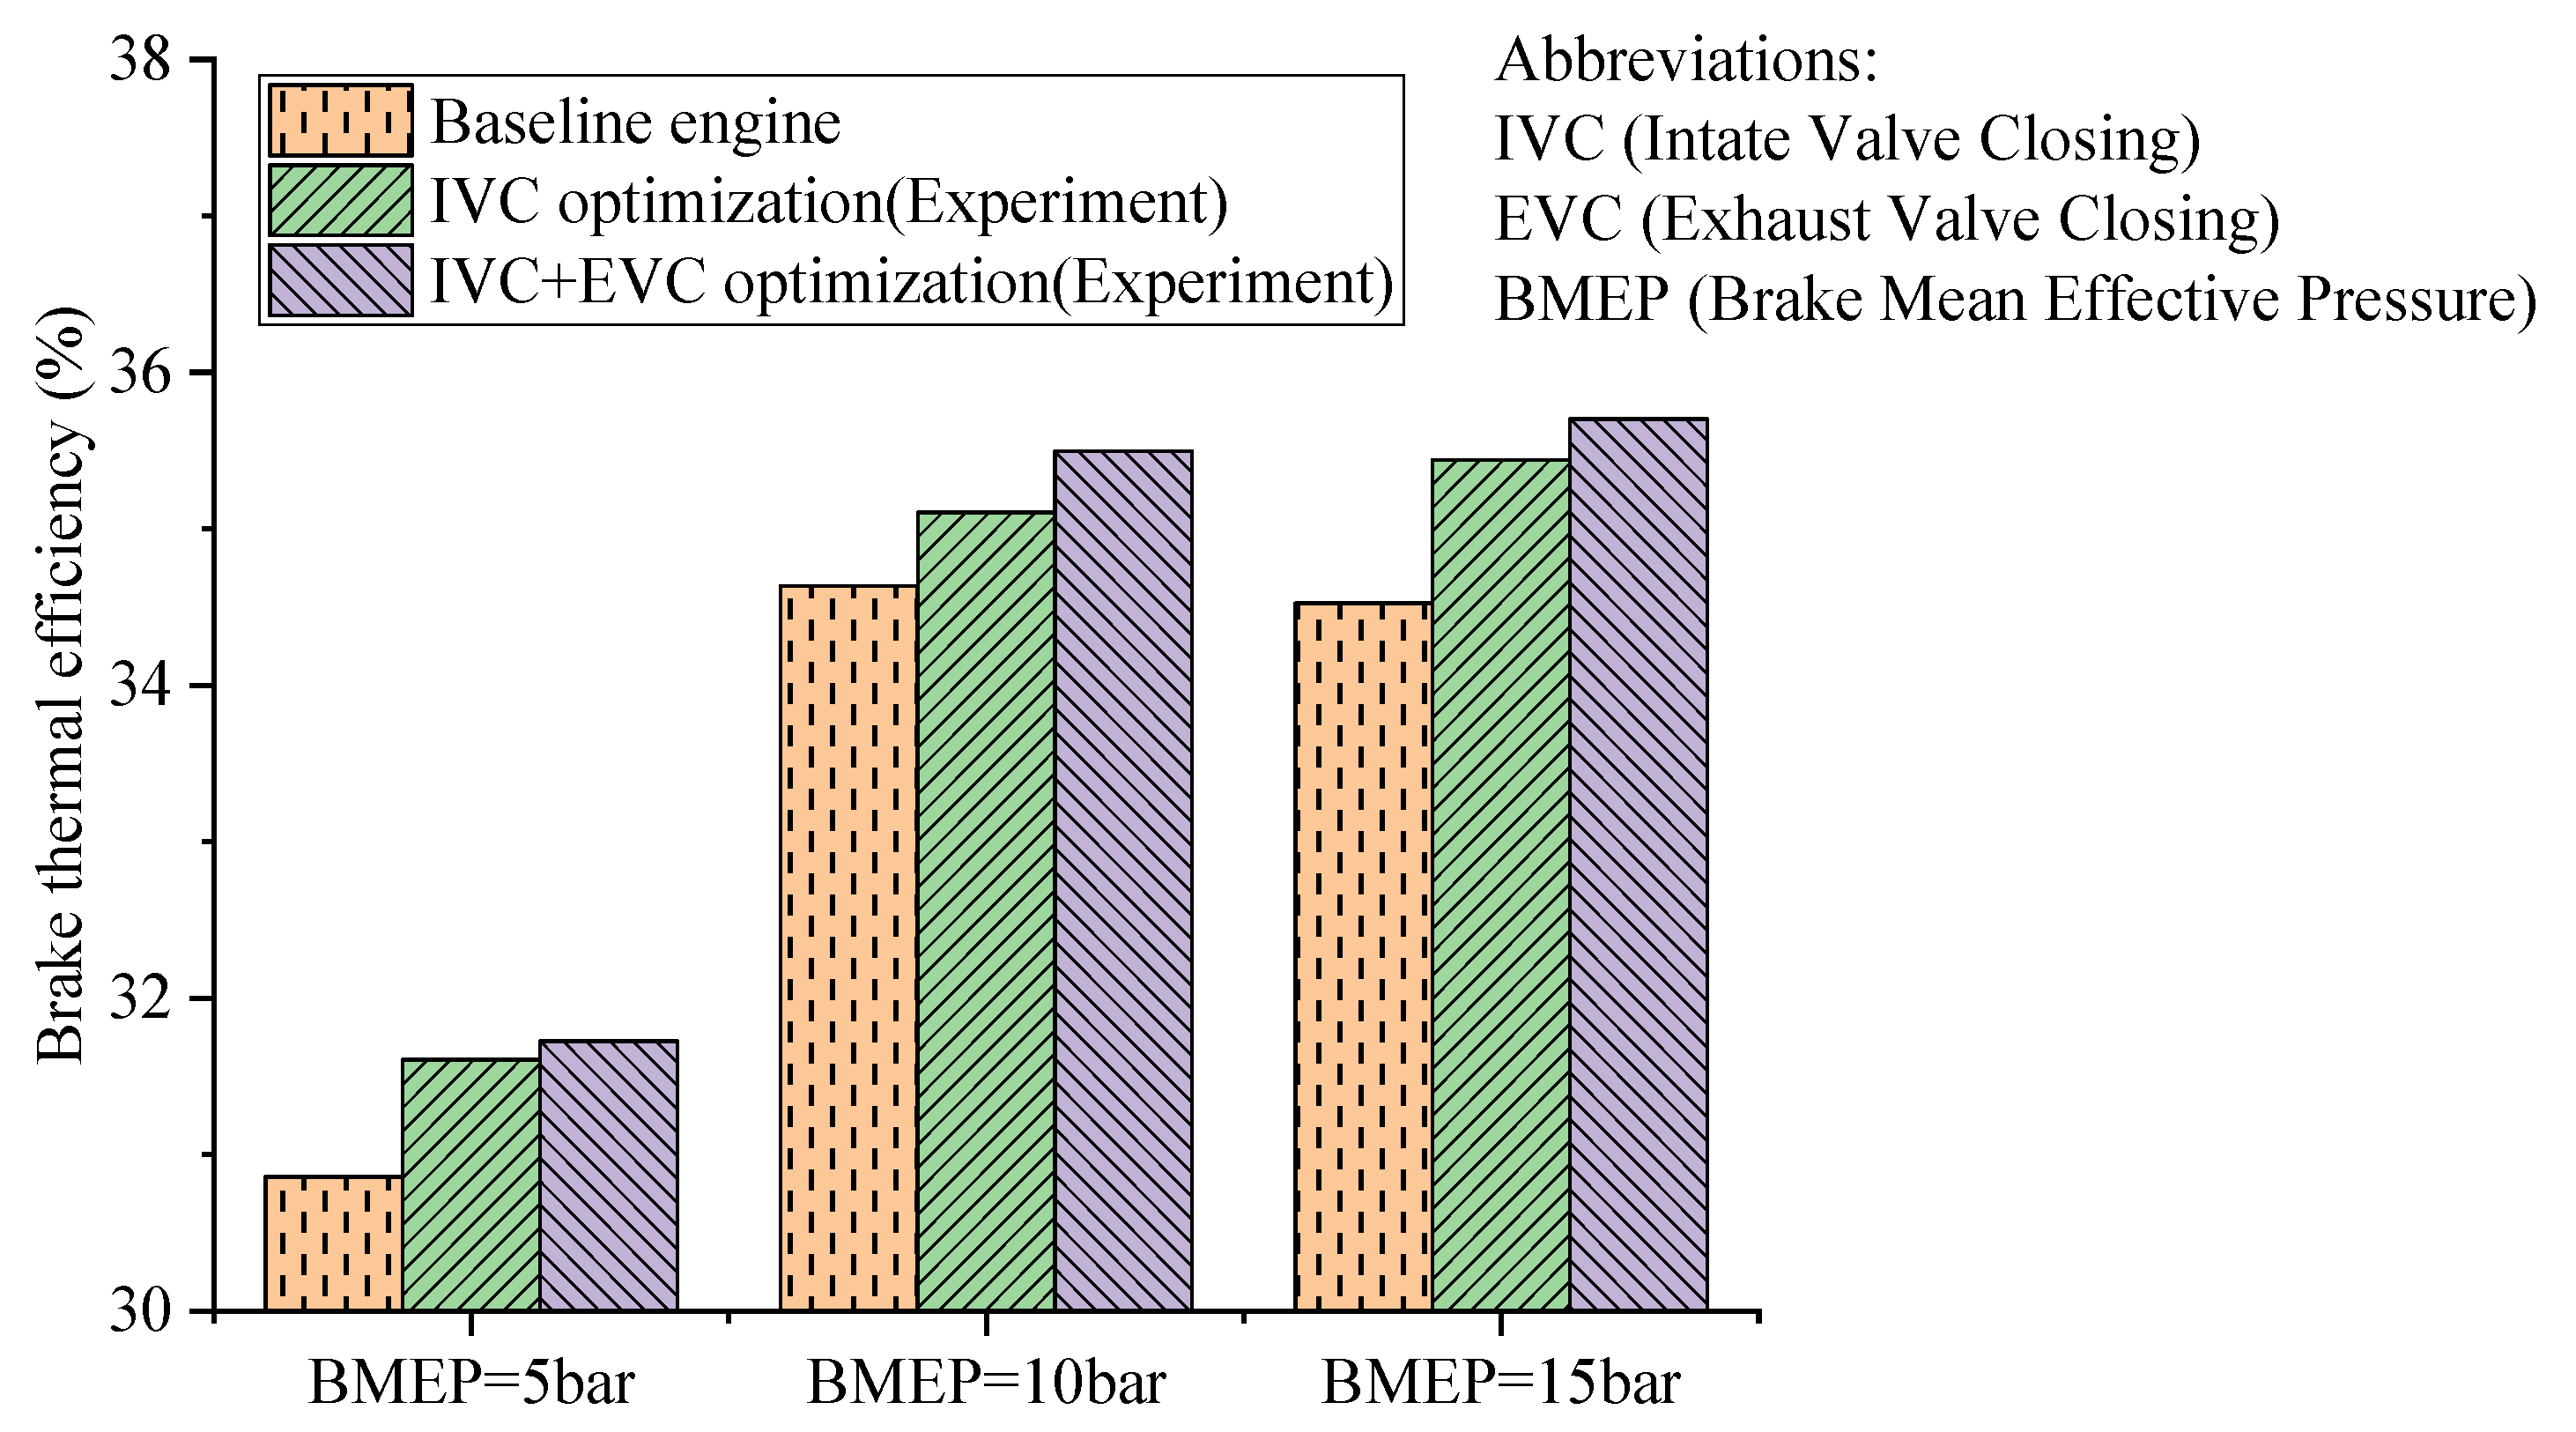
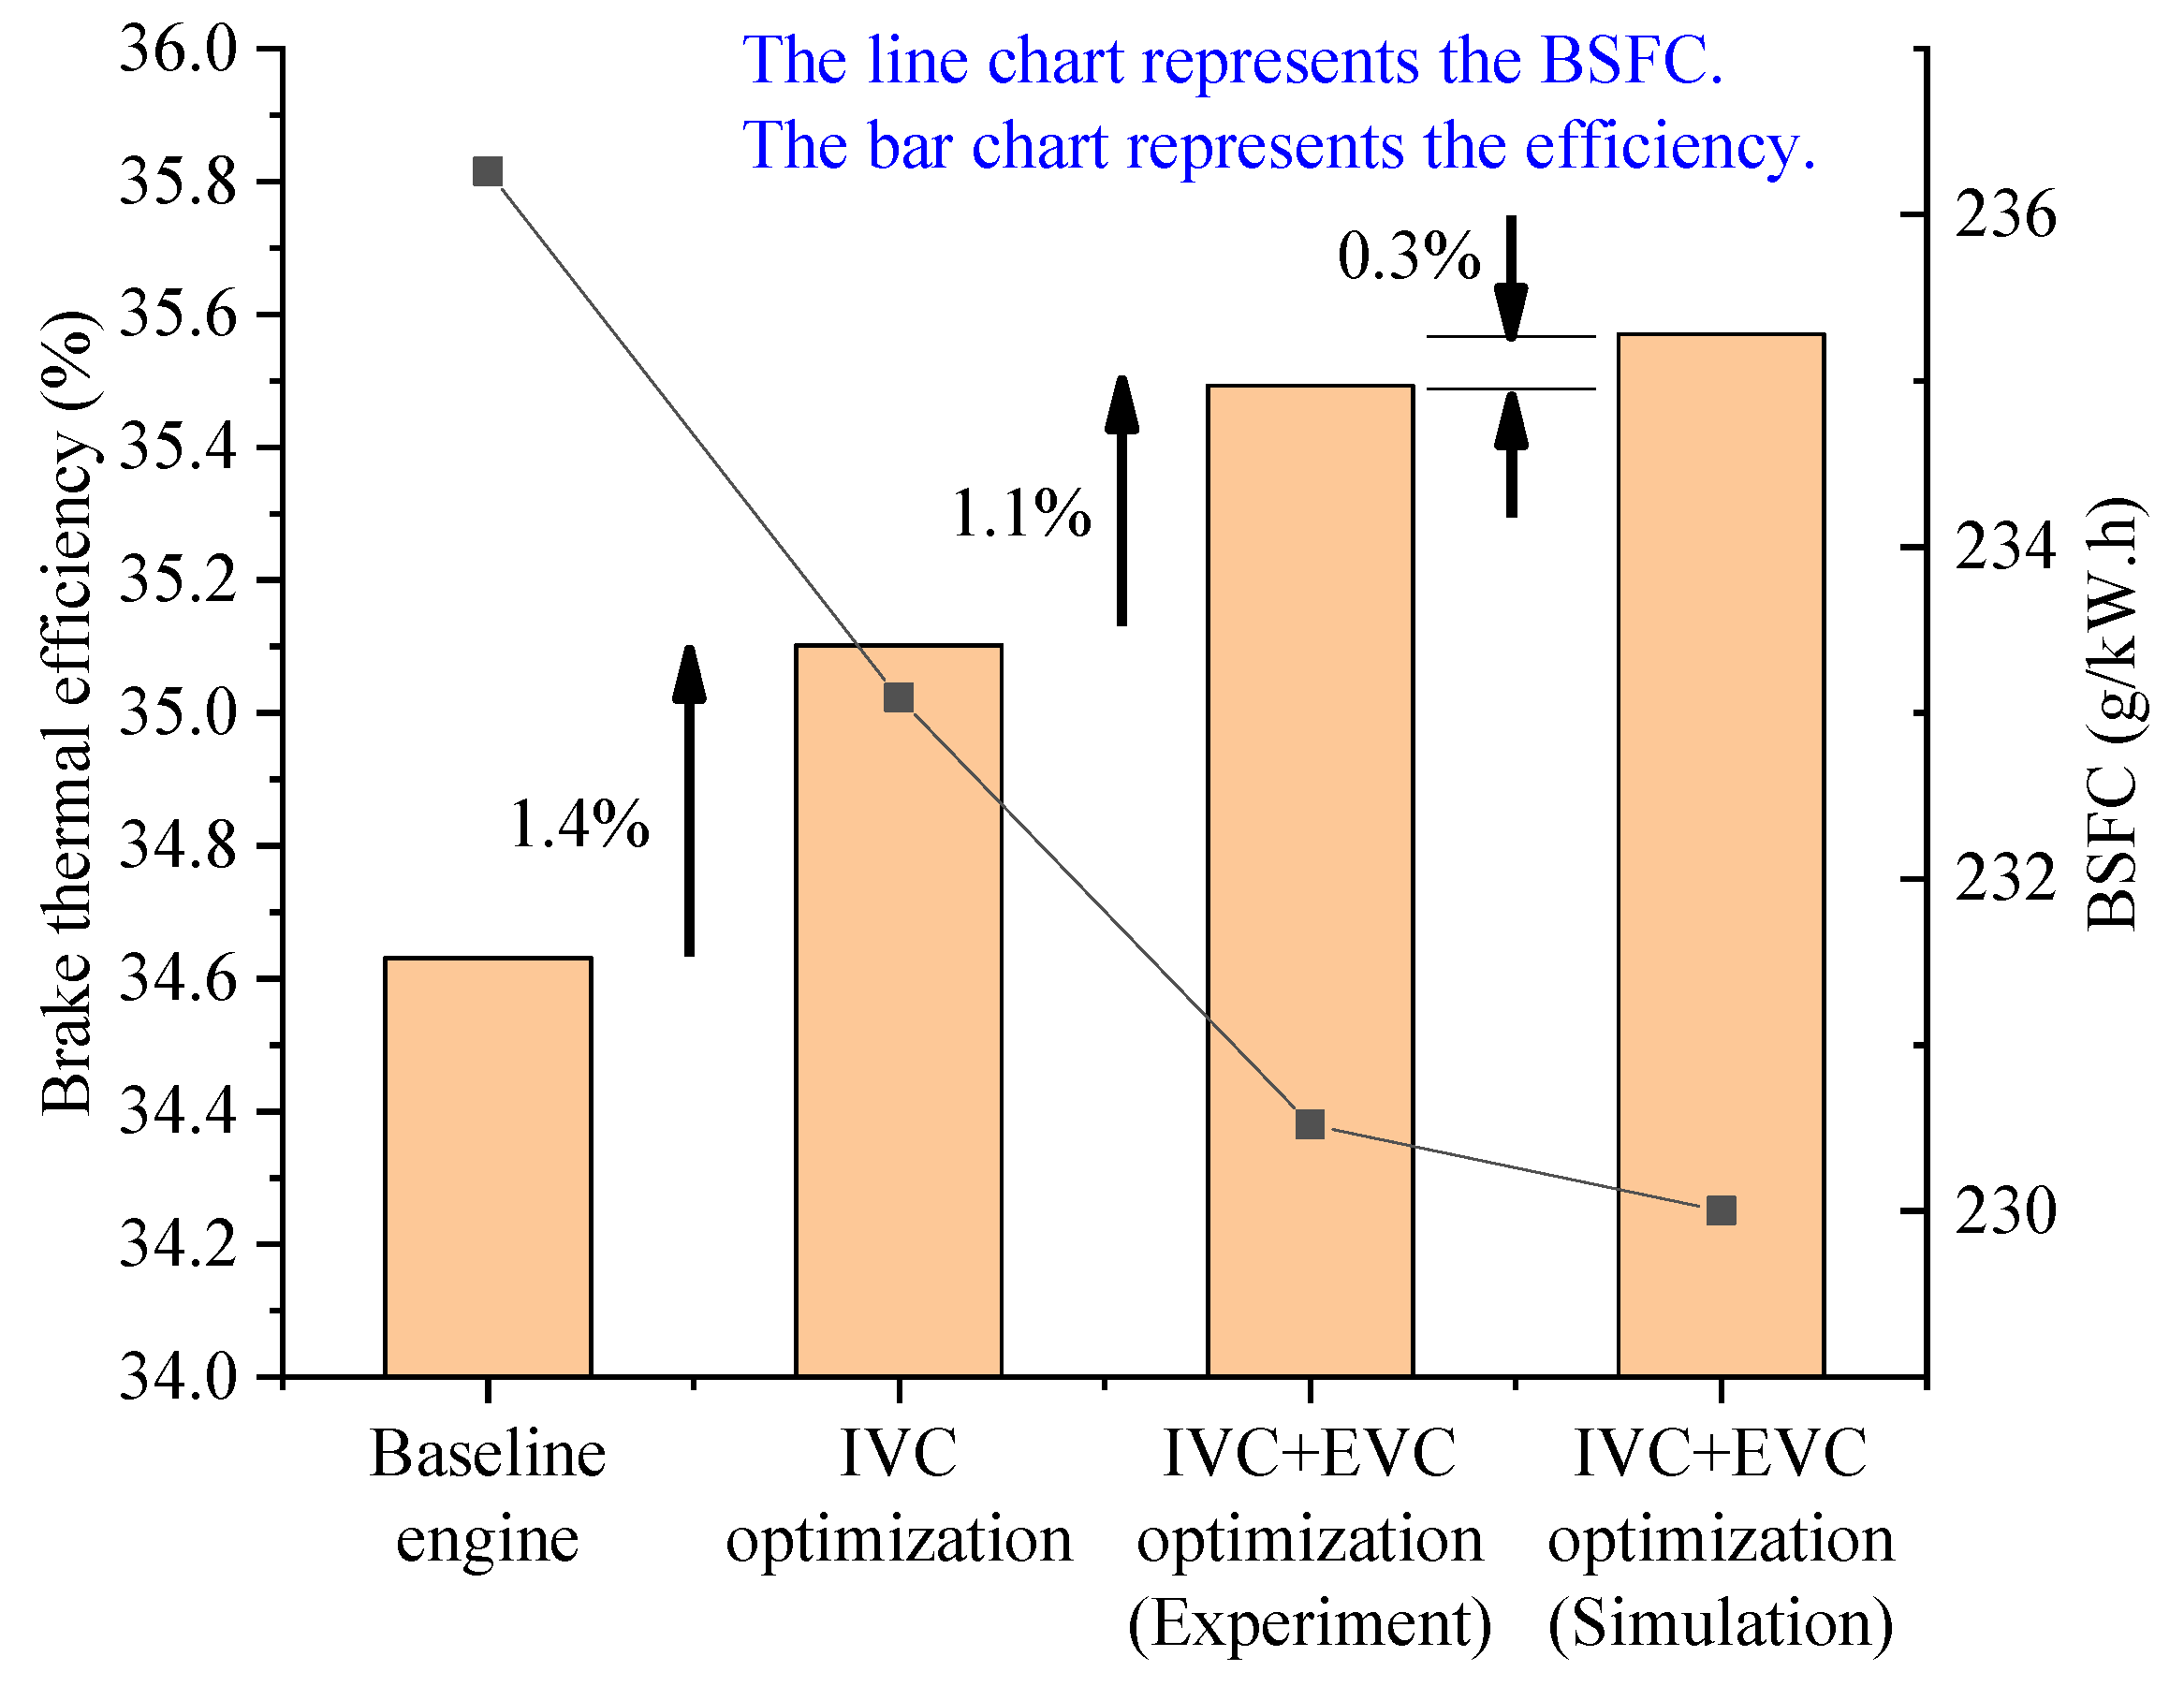
By calculating the brake thermal efficiency, the improvement of the brake thermal efficiency after the application of the Miller cycle can be obtained. When the brake thermal efficiency is calculated, 44000 J/kg is used as the low calorific value of gasoline. Figure 14 shows the comparison of brake thermal efficiency among the baseline engine and different Miller cycle optimization stages at different points of operation. The Miller cycle optimization is defined as the settings of IVC optimization and EVC optimization.
The brake thermal efficiency reaches 31.7%, 35.5%, and 35.7%, which has a 2.8%, 2.5%, and 2.6% improvement compared to the baseline engine, respectively, at three points of operation. Therefore, regardless of the load at 3000 rpm, the brake thermal efficiency is prominently improved after the Miller cycle application. The test shows that under the condition of 3000 rpm and 5 bar, due to slower airflow velocity and the higher pumping loss caused by smaller throttle opening, the brake thermal efficiency at low load is about 4% inferior to that at medium and high load, which can indicate that the optimal brake thermal efficiency of Miller cycle engine is achieved in the relatively high-load working range at 3000 rpm.

3. Numerical Study

Since the step size of the intake advance and exhaust retardation angle during the test is 5 °CA, it is still possible to obtain a higher brake thermal efficiency within the 5 °CA range. Moreover, further research on the combined change of intake and exhaust VVT is still relatively insufficient. Therefore, this paper will further study the point of operation 3000 rpm and 10 bar and the VVT settings at this point through numerical analysis.

3.1. 1D CFD Model

The 1D CFD model was established in GT-Power (v6.2, Gamma Technologies Inc., Westmont, IL, United States) [18]. The model contains the combustion chamber, intake and exhaust and turbocharger modules. During the simulation, the point of operation is maintained at 3000 rpm and 10 bar. After changing the intake and exhaust VVT, the EWG opening degree is automatically adjusted to the required load by PID (Proportion Integration Differentiation) control. The heat transfer is calculated by the Woshini model [19]. The completed 1D CFD model is shown in Figure 15.

3.2. Calibration

Since several parameters need to be controlled during the simulation process, this paper considers the predictive requirements of the model. In addition to the more commonly used SIWiebe model to analyze the thermal efficiency of the engine, a more accurate quasi-three-dimensional predictable model SITurb is also introduced to study the performance of Miller cycle, which can consider factors such as the geometry inside the cylinder, ignition timing, airflow and fuel properties more precisely. Compared with the commonly used SIWiebe model, the SITurb model can more accurately predict the influence of heat release rate of the in-cylinder combustion related to geometrical compression ratio, VVT operation, air:fuel ratio and ignition timing, which help analyze the suppression of knock versus Miller cycle parameters [20].
According to the results of the Miller cycle optimization during the test, the SIWiebe model and the SITurb model are calibrated by the measured in-cylinder pressure data. Figure 16 and Figure 17 show the heat release rate and the in-cylinder pressure by simulation using SIWiebe and SITurb model and the test in-cylinder pressure.
As can be seen from Figure 16, the error between both simulation data and test data at the point of operation 3000 rpm and 10 bar is below 3% (the error of BSFC and torque is below 1%). Figure 17 also confirms the accuracy of the simulation models compared to the test engine. Therefore, the established GT-Power model has good consistency with the baseline engine after test optimization, which is a prerequisite for further analysis and optimization. In addition, the SIWiebe model was established for the baseline VVT at 3000 rpm and 10 bar to compare the intake and exhaust flow of the baseline engine and Miller cycle optimization results during the test.

3.3. Results and Discussion

3.3.1. Mass Flow

Figure 18 is the logP versus logV diagram of the baseline VVT and Miller cycle VVT at the point of operation 3000 rpm and 10 bar. After Miller cycle application, the engine gains a smaller compression ratio than that of the baseline VVT, while the expansion ratio remains the same owing to the same geometric compression ratio. The over expansion in the Miller cycle can also be clearly observed, as shown in Figure 18.
The research [20] shows that with the increase of the intake advance angle (which means the deepening of the Miller cycle), the in-cylinder volumetric efficiency of the engine decreases. In the simulation study of this paper, the in-cylinder volumetric efficiency of the baseline engine (whose VVT is close to Otto cycle) is 81.5% at the point of operation 3000 rpm and 10 bar, and the in-cylinder volumetric efficiency of deep Miller cycle engine, which is optimized by test procedure, approaches to 80.5%. Figure 19 is a comparison of the mass flow rate of the baseline VVT and Miller cycle VVT at the point of operation 3000 rpm and 10 bar.
It is found from Figure 19 that the exhaust process is clearly advanced due to the decrease of the exhaust retardation angle. The change of the intake mass flow after the Miller cycle application is more significant than that of the exhaust mass flow. Therefore, this paper mainly analyzes the influence of the Miller cycle on the intake mass flow, and determines the reason for the slight decrease in in-cylinder volumetric efficiency at the point of operation 3000 rpm and 10 bar.
After the Miller cycle application, as the intake advance angle becomes larger, the IVO is also advanced, so the engine is still at the end of the exhaust stroke when the intake valve is opened. The in-cylinder pressure is much larger than that at the baseline IVO. At the same time, the EVC is also advanced relative to the baseline engine. The earlier EVC timing causes a part of the residual exhaust gas in the cylinder to flow back into the intake valve, resulting in the reverse flow effect shown in Figure 19. This reverse flow phase hinders the engine to properly intake as expected during the initial IVO timing, which reduces the in-cylinder volumetric efficiency of the Miller cycle.
Meanwhile, as mentioned above, when the baseline engine is optimized to the deep Miller cycle, the throttle opening is boosted from 46.7% to 100% at 3000 rpm and 10 bar; consequently, the intake pressure is also enlarged from 12 to about 30 kPa. The impact in throttle opening and intake pressure change on intake mass flow can also be seen in Figure 19. When the intake valve is fully opened, the maximum intake mass flow of the Miller cycle is notably larger than that of the baseline engine, which is about 0.05 kg/s and 0.03 kg/s respectively. This improvement compensates for the adverse effect due to the deterioration in the in-cylinder volumetric efficiency caused by the reverse flow effect. In the case where both of them act simultaneously, the Miller cycle has an in-cylinder volumetric efficiency of 80.5% at 3000 rpm and 10 bar, which is only 1% lower than that of the baseline engine.

3.3.2. The Analysis of Two Parameters

After experimental research and optimization, to go a step further, the simulation studied several effects based on the variation of two parameters. Figure 20 shows the volumetric efficiency, PMEP, in-cylinder maximum combustion temperature and in-cylinder peak pressure relative to the combined change of intake advance angle and exhaust retardation angle in the vicinity of the VVT settings by experimental optimization at 3000 rpm and 10 bar.
From Figure 20a, at the point of operation 3000 rpm and 10 bar, the in-cylinder volumetric efficiency relative to the combined change of intake advance angle and exhaust retardation angle shows a similar trend to that of the analysis discussed above. At the same time, as the Miller cycle is deepened, when the intake valve is opened, more intake air is pushed back to the intake port by the piston, which causes a higher reverse flow loss and lower volumetric efficiency. In addition, it can be seen from Figure 20a that a suitable valve overlap angle also has a certain positive influence on the in-cylinder volumetric efficiency.
Figure 20b indicates that the simulation results are consistent with the experimental results obtained above, that is, at the point of operation at 3000 rpm and 10 bar, the larger the intake advance angle with an appropriate valve overlap angle, the lower the pumping loss that can be achieved. The lower-right corner area in Figure 20b is an area where the pumping loss is relatively optimal, whose PMEP is about 0.04 bar higher than that in the upper-left corner area. It can be seen from Figure 20c that the combustion effect of the Miller cycle at 3000 rpm and 10 bar is mainly determined by the exhaust retardation angle. Decreasing the exhaust retardation angle greatly reduces the in-cylinder maximum combustion temperature, thus reducing the heat load loss of the Miller cycle engine and also improving the lubrication and emission characteristics of the Miller cycle engine to some extent; the trend of the in-cylinder maximum combustion temperature relative to the intake advance angle deviates from the test result, which may be due to the lack of consideration of vortex and tumble flow in 1D CFD model. Overall, the combustion situation is relatively better for the lower part of the distribution map (about 35 °C lower than the upper part), so it is expected to contribute to the fuel economy of the Miller cycle engine.
It can be concluded from Figure 20d that the in-cylinder peak pressure is mainly affected by the exhaust retardation angle. At the point of operation 3000 rpm and 10 bar, as the exhaust retardation angle decreases by 10 °CA, the in-cylinder peak pressure shows an increase of about 1.5bar, which also has the same trend as the test results above. Meanwhile, when the exhaust retardation angle is relatively small, increasing the intake advance angle can slightly reduce the in-cylinder peak pressure. The FMEP is calculated by the Chen-Flynn formula [21], which shows that the distribution law of FMEP is exactly the same as the distribution law of the in-cylinder peak pressure relative to the combined change of intake advance angle and exhaust retardation angle in Figure 20d. So we can conclude that the lower-left corner area in Figure 20d is the high friction loss zone during the Miller cycle operation.
Knock is a limitation of the engine’s work and is one of the keys to the Miller cycle to improve the fuel economy of the engine. The predictable knock phenomenological model of the gasoline engine [20] and the output parameter Knock index can be used to analyze knock. When the Knock index is greater than 200, it is considered that knock has occurred. Figure 21 shows the Knock index relative to the combined change of intake advance angle and exhaust retardation angle in the vicinity of the VVT settings by experimental optimization at 3000rpm and 10bar. The result is based on fixed ignition timing.
It can be seen from Figure 21 that when the intake advance angle is reduced from 25 °CA, the engine will knock at the same ignition timing (indicating that the Knock index is over 200). Therefore, to ensure the normal operation of the engine, the ignition timing can only be delayed. On the other hand, as the Miller cycle continues to deepen, knock is suppressed, so that the optimal ignition timing can be further advanced, thereby improving BSFC. This result is consistent with the experimental results above. The reason is that the intake advance angle greatly affects the effective compression ratio of the Miller cycle, which is, a larger intake advance angle produces a smaller effective compression ratio. Therefore, the occurrence of knock is well suppressed. The exhaust retardation angle also has a certain impact on knocking. As the exhaust retardation angle becomes larger, knock is suppressed. This is because the exhaust gas is discharged more completely as the exhaust valve is closed later. Therefore, the temperature in the cylinder is lower during the subsequent intake stroke.
In addition, the EWG opening at the point of operation at 3000 rpm and 10 bar is analyzed in the simulation procedure. Figure 22 shows the back pressure relative to the combined change of intake advance angle and exhaust retardation angle in the vicinity of the VVT settings by experimental optimization at 3000 rpm and 10 bar; Figure 23 shows the EWG opening relative to the combined change of intake advance angle and exhaust retardation angle in the vicinity of the VVT settings by experimental optimization at 3000 rpm and 10 bar. Note that when the Miller cycle is applied in this condition, the throttle opening has reached 100%.
As shown in Figure 22, the back pressure at the lower-right corner is lower than that at the upper-left corner. After the application of the Miller cycle, a lower back pressure reduces the resistance during exhausting, which reduces the total loss.
When the throttle is fully open, the load is completely satisfied by a turbocharger. Therefore, after the Miller cycle application at 3000 rpm and 10 bar, a relatively small valve timing change can cause a dramatic EWG position change. The result is consistent with the conclusions from the test results above. It is worth noting that when the Miller cycle is deepened to an intake advance angle of 30 °CA and an exhaust retardation angle of around 0 °CA, the EWG opening is less than 7%. During the test, it was found that the EWG opening will also generate about 5% fluctuation under fixed working conditions, which is due to the output fluctuation caused by the engine’s working cycle and the normal influence caused by PID control, etc., but it also means if the throttle and EWG remain fully open during the actual operation of the engine, their fluctuations will have certain adverse effects on the output characteristics. Therefore, in this paper, the EWG position after the Miller cycle application is regarded as one of the limitations for optimizing VVT under 3000rpm and 10bar condition. When the deep Miller cycle is applied to improve thermal efficiency, the EWG opening must be kept above 7% to ensure the stability of the engine under this condition.
The BSFC of the Miller cycle engine is the main research object of this paper. From the above analysis, it can be concluded that a deeper Miller cycle suppresses the occurrence of knock, and accordingly, the ignition timing can be further advanced. Therefore, in the simulation research, combined with the above experimental experience and simulation results above, based on the test optimized VVT settings and the ignition timing of the optimization result, the ignition timing is appropriately adjusted under different VVT settings to ensure that the CA50 reaches 8 °CA. Under this condition, the combustion of the Miller cycle engine is nearly optimized. After the CA50 is controlled, the BSFC relative to the combined change of intake advance angle and exhaust retardation angle. At the same time, similar to the simulation hypothesis made in the above analysis of combustion, to simplify the simulation process, CA10-90 remains unchanged. Figure 24 shows the BSFC relative to the combined change of intake advance angle and exhaust retardation angle in the vicinity of the VVT settings by experimental optimization at 3000 rpm and 10 bar.
It can be seen from Figure 24 that, based on the test optimization results, there is still potential for improvement in further enhancing the brake thermal efficiency of the Miller cycle engine. For the convenience of description, four regions are marked from Figure 24. The brake thermal efficiency of the upper PMEP-combustion degradation zone (with large exhaust retardation angle) is lower than the test optimization result, and the results can be explained by the above simulation analysis: As can be inferred from Figure 20b, the upper area of the PMEP distribution is the area where the pumping loss is larger, and the pumping loss of the upper area is about 15% larger than that of the lower right corner. In addition, as shown in Figure 20c, the in-cylinder maximum combustion temperature in this region is higher, thereby increasing the heat load. In summary, poor combustion and large pumping losses result in a decrease in the brake thermal efficiency of the PMEP-Combustion degradation zone. The brake thermal efficiency of the FMEP-Knock degradation zone (with small intake advance angle and exhaust retardation angle) at the lower-left corner is also lower than the test optimization result but different from the upper area, this area is mainly affected by FMEP and Knock limitation: The lower-left corner of Figure 20d and Figure 21 are the areas of larger in-cylinder peak pressure and Knock index. The larger in-cylinder peak pressure leads to an increase in FMEP during the operation of the Miller cycle engine; in addition, the Knock index obtained through the fixed ignition timing is much larger than 200. If the ignition timing by test optimization is maintained, the engine will knock and fail to operate normally while working in this area. Therefore, when the CA50 is determined to be 8 °CA to avoid knock during the use of the SIWiebe model, the ignition timing has been already delayed. In summary, greater friction loss and delayed ignition timing deteriorate the brake thermal efficiency of the FMEP-Knock degradation zone.
The BSFC at the low BSFC region in Figure 24 (with large intake advance angle and small exhaust retardation angle) is further reduced than that of test optimization result, owing to an integrated consequence of pumping loss, combustion, friction loss and knock. It is obvious that the pumping loss in this area is relatively small from the PMEP distribution, and the Knock index is also optimal in this area. Therefore, the ignition timing can be further advanced when the Miller cycle engine works in this area. Secondly, from the in-cylinder peak pressure distribution, increasing the intake advance angle can compensate for the increase in FMEP caused by faster combustion. Low pumping losses, advanced ignition timing and low friction loss act comprehensively to improve the brake thermal efficiency in this region. The brake thermal efficiency in the EWG limitation zone is even higher, but as mentioned above, since the EWG in this region is almost fully open, load fluctuation affects the normal operation of the engine. As a result, Miller cycle engines should avoid operating in this region.
As the intake advance angle is further increased compared with the test optimization result and the corresponding exhaust retardation angle is further reduced by 1–4 °CA, the brake thermal efficiency continues to improve. Meanwhile, the EWG opening can be guaranteed to be greater than 7%. Therefore, after considering the thermal efficiency and working stability of the Miller cycle engine, the intake advance angle and exhaust retardation angle are finally optimized to 28 and 2 °CA. Figure 25 shows the results of BSFC and brake thermal efficiency improvement after the baseline engine accomplishes each optimization stage at 3000 rpm and 10 bar.
Through the research of experiments and simulations, the final optimization results ensure that the engine’s stable work at 3000rpm and 10bar, and the brake thermal efficiency is improved from the baseline engine of 34.6% to 35.6% (a relative improvement of 2.9%), which greatly enhances the fuel economy. In addition, the final optimization result was confirmed by a final experiment. The BSFC of the experimental result is 226.8 g/kW·h, which is 1.3% lower than the final optimization result.

4. Conclusions

This paper proposes the idea of Miller cycle application on conventional engines to improve the thermal efficiency and thus reduce fuel consumption. Miller cycle can decouple the expansion ratio of the engine from the compression ratio. For the common operating conditions of the gasoline engine, the intake valve can be closed early with the appropriate valve overlap angle, combined with a larger throttle opening and turbocharger application and the appropriate ignition timing, thereby reducing the BSFC of the engine. The main conclusions of this paper are as follows:
For the engine’s common speed of 3000 rpm, based on the engine bench test data, the Miller cycle of the baseline engine under different loads at 3000 rpm was first studied. The pumping loss, combustion and friction loss were compared and analyzed. The results show that after Miller cycle application, the pumping loss is improved due to the increase of the throttle opening under constant load; the Miller cycle under medium and low load can reduce the combustion duration. The in-cylinder maximum combustion temperature is lower than that of the baseline engine after Miller cycle application with the appropriate valve overlap angle. The friction loss increases with the rise of the load; when the Miller cycle deepens, the friction loss increases at high loads, but as the exhaust valve closes earlier, the friction loss decreases significantly, which also demonstrates the importance of matching exhaust valve timing.
According to the improvement effect of the Miller cycle on the BSFC under different loads at 3000 rpm during the test, the VVT angle was adjusted based on the baseline engine. The test optimization was completed after adjusting the intake advance angle to 25, 25 and 15 °CA, and, correspondingly, the exhaust retardation angle to 5, 5 and 15 °CA at the point of operation of 3000 rpm and 5, 10 and 15 bar, respectively.
To further study the point of operation at 3000 rpm and 10 bar, which is quite commonly used by gasoline engines, based on the test optimized VVT results, the 1D CFD analysis of the Miller cycle was carried out. On the one hand, combined with the results obtained during the test, the influence of the combined change of intake advance angle and exhaust retardation angle on the Miller cycle is studied by simulation. On the other hand, based on the test optimization results, a higher brake thermal efficiency is found to achieve better fuel economy. For the results that have been obtained in the test, 1D simulation is consistent with the experimental results, and the simulation results further illustrate the influence intensity and coupling relationship on each parameter. The simulation also analyzed the effect of the Miller cycle on knocking. The engine has better brake thermal efficiency as the Miller cycle deepens. The main reason is that the engine’s knock tendency decreases as the intake advance angle increases, so the ignition timing can be further advanced.
At the point of operation 3000 rpm and 10 bar, further increasing the intake advance angle and appropriately reducing the exhaust retardation angle compared to the test optimization result make the Miller cycle engine work in the low BSFC region mentioned in the paper, which can achieve the optimal fuel economy while ensuring stable engine operation. The maximum brake thermal efficiency is increased by 0.23% relative to the test optimization result, and 2.71% relative to the baseline engine.

Author Contributions

Conceptualization, D.L.; Data curation, X.P.; Formal analysis, X.P. and Y.Z.; Funding acquisition, D.L.; Methodology, L.F.; Project administration, L.F.; Resources, D.L.; Software, Y.Z.; Supervision, D.L.; Validation, Y.Z.; Writing—original draft, X.P. and Y.Z. All authors have read and agreed to the published version of the manuscript.

Funding

This project was supported by the National Key R&D Program of China (2018YFB0105802).

Conflicts of Interest

The authors declare no conflict of interest.

References

  1. Zhou, R. Application of Miller Cycle in Conventional Gasoline Engine. Master’s Thesis, Tianjin University, Tianjin, China, 2016. [Google Scholar]
  2. Wang, Y.; Zu, B.; Xu, Y.; Wang, Z.; Liu, J. Performance analysis of a Miller cycle engine by an indirect analysis method with sparking and knock in consideration. Energy Convers. Manag. 2016, 119, 316–326. [Google Scholar] [CrossRef]
  3. Zhao, J. Research and application of over-expansion cycle (Atkinson and Miller) engines—A review. Appl. Energy 2017, 185 Pt 1, 300–319. [Google Scholar] [CrossRef]
  4. Brüstle, C.; Schwarzenthal, D. The “Two in One” Engine—Porsche’s Variable Valve System (VVS); SAE Technical Paper 980766; SAE International in United States: Warrendale, PA, USA, 1998. [Google Scholar]
  5. Borgmann, K.; Liebl, J.; Hofmann, R.; Schausberger, C.; Schwarzbauer, G. The Innovative V12 Powertrain for the New 7 Series; SAE Technical Paper 2003-08-0202; Society of Automotive Engineers of Japan: Goban-cho, Japan, 2003. [Google Scholar]
  6. Martins, J.; Baptista, A.; Pinto, R.; Brito, F.P.; Costa, T.J. Analysis of a New VVT Trapezoidal Rotary Valve; SAE Technical Paper 2019-01-1202; SAE International in United States: Warrendale, PA, USA, 2019. [Google Scholar] [CrossRef]
  7. Flierl, R.; Paulov, M.; Knecht, A.; Hannibal, W. Investigations with a Mechanically Fully Variable Valve Train on a 2.0l Turbo Charged Four Cylinder Engine; SAE Technical Paper 2008-01-1352; SAE International in United States: Warrendale, PA, USA, 2008. [Google Scholar] [CrossRef]
  8. Mork, A.; Heimermann, C.; Schüttenhelm, M.; Frambourg, M. CO2-Lighthouse Diesel Engine from Volkswagen Group Research. In Proceedings of the 27th Aachen Colloquium Automobile and Engine Technology, Aachen, Germany, 8–10 October 2018. [Google Scholar]
  9. Siczek, K.J. Tribological Processes in the Valve Train Systems with Lightweight Valves; New Research and Modelling; Elsevier Inc.: Amsterdam, The Netherlands, 2016; pp. 193–203. [Google Scholar]
  10. Kovács, D.; Eilts, P. Potentials of the Miller Cycle on HD Diesel Engines Regarding Performance Increase and Reduction of Emissions; SAE Technical Paper 2015-24-2440; SAE International in United States: Warrendale, PA, USA, 2015. [Google Scholar] [CrossRef]
  11. Neher, D.; Kettner, M.; Scholl, F.; Klaissle, M.; Schwarz, D.; Gimenez, B. Numerical Investigations of a Naturally Aspirated Cogeneration Engine Operating with Overexpanded Cycle and Optimised Intake System; SAE Technical Paper 2014-32-0109; SAE International in United States: Warrendale, PA, USA, 2014. [Google Scholar] [CrossRef]
  12. Neher, D.; Kettner, M.; Scholl, F.; Klaissle, M.; Schwarz, D.; Olavarría, B.G. Numerical Investigations of Overexpanded Cycle and Exhaust Gas Recirculation for a Naturally Aspirated Lean Burn Engine; SAE Technical Paper 2013-32-9081; SAE International in United States: Warrendale, PA, USA, 2013. [Google Scholar] [CrossRef]
  13. Miklanek, L.; Vitek, O.; Gotfryd, O.; Klir, V. Study of Unconventional Cycles (Atkinson and Miller) with Mixture Heating as a Means for the Fuel Economy Improvement of a Throttled SI Engine at Part Load; SAE Technical Paper 2012-01-1678; SAE International in United States: Warrendale, PA, USA, 2012. [Google Scholar] [CrossRef]
  14. Gottschalk, W.; Lezius, U.; Mathusall, L. Investigations on the Potential of a Variable Miller Cycle for SI Knock Control; SAE Technical Paper 2013-01-1122; SAE International in United States: Warrendale, PA, USA, 2013. [Google Scholar] [CrossRef]
  15. Heinrich, C.; Scharrer, O.; Gebhard, P.; Pucher, H. Investigation of a 2-Step Valve Train and Its Influence on Combustion by Means of Coupled CFD Simulation; SAE Technical Paper 2005-01-0690; SAE International in United States: Warrendale, PA, USA, 2005. [Google Scholar]
  16. Ferrey, P.; Miehe, Y.; Constensou, C.; Collee, V. Potential of a Variable Compression Ratio Gasoline SI Engine with Very High Expansion Ratio and Variable Valve Actuation. SAE Int. J. Eng. 2014, 7, 468–487. [Google Scholar] [CrossRef]
  17. Wan, Y.; Du, A. Reducing Part Load Pumping Loss and Improving Thermal Effificiency Through High Compression Ratio over-Expanded Cycle; SAE Paper 2013-01-1744; SAE International in United States: Warrendale, PA, USA, 2013. [Google Scholar] [CrossRef]
  18. Gamma Technologies Inc. GT-POWER, User’s Manual And Tutorial; GT-Suite TM Version 6.2; Gamma Technologies Inc.: Westmont, IL, USA, 2006. [Google Scholar]
  19. Woschni, G. Einfluss von Rußablagerungen auf den Wärmeübergang zwischen Arbeitsgas und Wand im Dieselmotor. In Der Arbeitsprozess Des Verbrennungsmotors; Institut fuer Verbrennungskraftmaschinen und Thermodynamik: Graz, Austria, 1991. [Google Scholar]
  20. Zhao, J. Study on Performance Optimization in the Entire Load Range of an Atkinson Cycle Engine Based on Artificial Neural Network and Genetic Algorithm. Ph.D. Thesis, Shanghai Jiao tong University, Shanghai, China, 2013. [Google Scholar]
  21. Chen, S.; Flynn, P. Development of a Single Cylinder Compression Ignition Research Engine; SAE Technical Paper 650733; SAE International in United States: Warrendale, PA, USA, 1965. [Google Scholar] [CrossRef]
Figure 1. The layout of the engine bench test (The EWG in the figure is the abbreviation of the electrical waste gate).
Energies 13 01500 g001
Figure 2. Valve lifts and realization of the Miller cycle (by advancing IVC (Intake Valve Closing) timing).
Energies 13 01500 g002
Figure 3. Method of analyzing the influence of exhaust retardation angle on the engine characteristics under the Miller cycle (by advancing EVC (Exhaust Valve closing) timing).
Energies 13 01500 g003
Figure 4. EWG (Electrical waste gate) position and intake pressure before intercooler versus intake advance angle (point of operation: n = 3000 rpm, BMEP = 10 bar, exhaust retardation angle = 25 °CA, CA50 = 8 °CA).
Energies 13 01500 g004
Figure 5. PMEP (Pumping Mean Effective Pressure) versus intake advance angle under baseline EVC, and PMEP versus exhaust retardation angle under the Miller cycle at different points of operation during the test.
Energies 13 01500 g005
Figure 6. Intake pressure after intercooler versus intake advance angle under baseline EVC, and PMEP versus exhaust retardation angle under the Miller cycle at different points of operation during the test.
Energies 13 01500 g006
Figure 7. The logP versus logV diagram relative to intake advance angle under baseline EVC at different points of operation.
Energies 13 01500 g007
Figure 8. Optimal ignition timing, CA50, and CA10-90 versus intake advance angle under baseline EVC.
Energies 13 01500 g008
Figure 9. Maximum combustion temperature versus intake advance angle under baseline EVC, and maximum combustion temperature versus exhaust retardation angle under the Miller cycle at different points of operation during the test.
Energies 13 01500 g009
Figure 10. In-cylinder peak pressure versus intake advance angle under baseline EVC, and in-cylinder peak pressure versus exhaust retardation angle under the Miller cycle at different points of operation during the test.
Energies 13 01500 g010
Figure 11. FMEP (Friction Mean Effective Pressure) versus intake advance angle under baseline EVC, and FMEP versus exhaust retardation angle under the Miller cycle at different points of operation during the test.
Energies 13 01500 g011
Figure 12. BSFC (Brake Specific Fuel Consumption) versus intake advance angle under baseline EVC, and BSFC versus exhaust retardation angle under the Miller cycle at different points of operation during the test.
Energies 13 01500 g012
Figure 13. BSFC and related effects versus intake advance angle under baseline EVC, and BSFC and related effects versus exhaust retardation angle under the Miller cycle (point of operation: n = 3000 rpm, BMEP = 15 bar, exhaust retardation angle = 25 °CA, CA50 = 8 °CA).
Energies 13 01500 g013
Figure 14. Comparison of brake thermal efficiency.
Energies 13 01500 g014
Figure 15. 1D CFD (Computational Fluid Dynamics) model of the engine.
Energies 13 01500 g015
Figure 16. Heat release rate by simulation using SIWiebe and SITurb models in comparison of measured data by experiment (point of operation: n = 3000 rpm, BMEP = 10 bar, CA50 = 8 °CA, intake advance angle = 25 °CA, exhaust retardation angle = 5 °CA).
Energies 13 01500 g016
Figure 17. In-cylinder pressure by simulation using SIWiebe and SITurb model in comparison of measured data by experiment (point of operation: n = 3000 rpm, BMEP = 10 bar, CA50 = 8 °CA, intake advance angle = 25 °CA, exhaust retardation angle = 5 °CA).
Energies 13 01500 g017
Figure 18. The logP versus logV diagram of the baseline VVT (Variable Valve Timing) and Miller cycle VVT (point of operation: n = 3000 rpm, BMEP = 10 bar, CA50 = 8 °CA).
Energies 13 01500 g018
Figure 19. The timing diagram and mass flow rate of the baseline VVT and Miller cycle VVT (point of operation: n = 3000 rpm, BMEP = 10 bar, CA50 = 8 °CA).
Energies 13 01500 g019
Figure 20. Volumetric efficiency, PMEP (Pumping Mean Effective Pressure), in-cylinder maximum combustion temperature and in-cylinder peak pressure versus the combined change of intake advance angle and exhaust retardation angle (point of operation: n = 3000 rpm, BMEP = 10 bar, CA50 = 8 °CA).
Energies 13 01500 g020
Figure 21. Knock index versus the combined change of intake advance angle and exhaust retardation angle (point of operation: n = 3000 rpm, BMEP = 10 bar, ignition timing = 18.75 °CA BTDC (Before Top Dead Center)).
Energies 13 01500 g021
Figure 22. Back pressure versus the combined change of intake advance angle and exhaust retardation angle (point of operation: n = 3000 rpm, BMEP = 10 bar, CA50 = 8 °CA, throttle opening = 100%).
Energies 13 01500 g022
Figure 23. EWG opening versus the combined change of intake advance angle and exhaust retardation angle (point of operation: n = 3000 rpm, BMEP = 10 bar, CA50 = 8 °CA, throttle opening = 100%).
Energies 13 01500 g023
Figure 24. BSFC versus the combined change of intake advance angle and exhaust retardation angle (point of operation: n = 3000 rpm, BMEP = 10 bar, CA50 = 8 °CA).
Energies 13 01500 g024
Figure 25. BSFC and brake thermal efficiency improvement after the baseline engine accomplishes each optimization stage (point of operation: n = 3000 rpm, BMEP = 10 bar, CA50 = 8 °CA).
Energies 13 01500 g025
Table 1. Specifications of the research engine.
Displacement1.5L
Stroke86.6 mm
Bore74 mm
Number of cylinders4
Rated power124 kW
Rated speed6000 rpm
Maximum torque250 N·m
Speed at maximum torque1700–4300 rpm
BSFC (Brake Specific Fuel Consumption) under rated condition240 g/kWh
Compression ratio11.5:1
Table 2. Equipment of the test bench.
EquipmentPurposeError
AVL Dynamometer (AVL List GmbH, Graz, Austria)Torque<±0.3N·m
Speed<±1r/min
AVL 735s (AVL List GmbH, Graz, Austria)Fuel flow<0.1kg/h
Table 3. Values of intake advance angle at different points of operation when exhaust retardation angle is analyzed under Miller cycle.
Point of OperationBaseline Intake Advance Angle/°CAIntake Advance Angle Under Miller Cycle MMiMiller Cycle/°CA
3000 rpm 5 bar
86.6 mm
025
3000 rpm 10 bar
74 mm
025
3000 rpm 15 bar
5
015

