Article

Sensitivity Analysis of the Impact of the Sub- Hourly Stochastic Unit Commitment on Power System Dynamics

1
School of Electrical and Electronic Engineering, University College Dublin, Belfield, Dublin 4, Ireland
2
Electrical Energy Systems, Department of Electrical Engineering, Eindhoven University of Technology, 5600 Eindhoven, The Netherlands
*
Author to whom correspondence should be addressed.
Energies 2020, 13(6), 1468; https://doi.org/10.3390/en13061468
Submission received: 17 February 2020 / Revised: 15 March 2020 / Accepted: 17 March 2020 / Published: 20 March 2020
(This article belongs to the Special Issue Power System Simulation, Control and Optimization)

Abstract

:
Subhourly modeling of power systems and the use of the stochastic optimization are two relevant solutions proposed in the literature to address the integration of stochastic renewable energy sources. With this aim, this paper deals with the effect of different formulations of the subhourly stochastic unit commitment (SUC) problem on power system dynamics. Different SUC models are presented and embedded into time domain simulations (TDS) through a cosimulation platform. The objective of the paper is to study the combined impact of different frequency control/machine parameters and different SUC formulations on the long-term dynamic behaviour of power systems. The analysis is based on extensive Monte Carlo TDS (MC-TDS) and a variety of scenarios based on the New England 39-bus system.

1. Introduction

1.1. Motivation

Subhourly modeling of power systems is seen as a solution to different problems in power systems. For example, ENTSO-E has recommended that in order to tackle the phenomena of deterministic frequency deviation (DFD) in the European power systems the following measures have to be taken: Introduction of 15-min market schedules and balancing; Introduction of 15-min period imbalance settlement in each balancing area [1]. Subhourly modeling is thus to be preferred compared to the conventional hourly dispatch. Given its short time scale, it makes sense to embed the subhourly unit commitment (UC) into a time domain simulator as it can overlap with relevant long-term power system dynamics [2], and analyse its impact on power system dynamic behaviour [3]. On the other hand, while it is well-known that inertia of synchronous machines is the parameter on which system stability mostly depends in the first seconds after a major contingency, other frequency control parameters help keeping the frequency within certain limits most of the time (which is another major task of system operators). To study the effect of these parameters on long-term frequency deviations, one would need to use dynamic equations with stochastic terms and perform long-term dynamic simulations [4].
The objective of the paper is to assess the impact of different implementations of stochastic UC problem formulations on power system dynamics and their sensitivity with respect to the parameters of primary and secondary controllers of conventional power plants.

1.2. Literature Review

Subhourly variability of renewable energy sources (RES) is not the only challenge that system operators have to deal with. The inherent uncertainty related to RES forecast, in particular wind and solar power, has also to be considered when scheduling the system [5]. A way to address this problem proposed in the literature is by making use of subhourly stochastic UC formulations (SUC) [6]. For instance, in [7] the authors propose a stochastic real-time market with 15-min dispatch intervals and show that it outperforms the relevant deterministic approach. In [8], a stochastic economic dispatch (15 min dispatch interval) is proposed where the authors conclude that the stochastic approach leads to lower operating costs compared to that of the deterministic approach. Nevertheless, they acknowledge the computational burden of the stochastic approach as the main limitation for practical applications.
There is a concern about the impact of low level of inertia and reduced frequency regulation on the long-term dynamic behaviour of power systems as the RES penetration increases [9]. Regarding UC models, this issue has been tackled so far by proposing some linear frequency constraints [10]. The major limitation of these approaches is that the dynamics of the system are oversimplified. The recently proposed cosimulation framework proposed in [3] solves this issue and is further developed in this work.
There are currently very few works that focus on the effect of frequency control parameters on the frequency deviations of the system. In [11], the authors propose a feedback controller method for frequency control and perform a sensitivity analysis of the effect of varying governor droop parameter (R). This reference shows that a value of R between 3% and 4% leads to a better dynamic behaviour of the system after a disturbance. However, only short-term dynamic simulations are considered. In a recent work [4], the authors propose a method that allows finding the frequency probability density function of power systems, and conclude that the dead-band width of turbine governors (TGs) and the aggregate droop are the only parameters that have great impact on the long-term frequency deviations, while inertia has little impact.
In this work, we use as starting point [12,13]. Reference [12] discusses the impact of a subhourly deterministic UC problem power system dynamics. Whereas the focus of [13] is on the effect of different SUC strategies and different wind power uncertainty and volatility within SUC on power system dynamics. Based on these works, we present here a thorough sensitivity analysis related to different control parameters as well as a comparison on the effect of different SUC models on the long-term dynamic behaviour of power systems.

1.3. Contributions

This paper provides the following original contributions.
  • A cosimulation framework that allows to assess the effect that different subhourly SUC models have on the long-term dynamic behaviour of power systems.
  • A thorough sensitivity analysis with respect to the interaction between different subhourly SUC models, different frequency control/machine parameters and power system dynamics.
  • Show through the aforementioned analysis that synchronous machine inertia has little effect on the standard deviation of the frequency. This result is in accordance with the discussion provided in [4].
  • Show that the gain of automatic generation control (AGC) is (most of the time) the main parameter affecting the standard deviation of the frequency.

1.4. Organization

The rest of the paper is organised as follows. Section 2 starts by presenting the long-term dynamic model of power systems. Then, it describes the modeling of wind power based on stochastic differential equations (SDEs). Furthermore, it provides the models of primary and secondary frequency controllers as well as the mathematical formulation of the standard mixed-integer linear programming (MILP), SUC. Section 2 also presents the formulation of a simplified and an alternative model of subhourly SUC. Lastly, Section 2 also describes the cosimulation platform that combines the solution of the SUC problem and the time integration of the SDAEs and explain the interactions between the two tools. Section 3 discusses the results of the case study based on the New England IEEE 39-bus system. Finally, Section 4 provides the relevant conclusions and future work.

2. Modeling

2.1. Stochastic Long-Term Power System Model

The large-scale deployment of stochastic renewable energy sources, e.g., wind, significantly increases the random perturbations and inevitably affects the safe and stable operation of power systems [14]. As a result, the adoption of SDEs to model this randomness in power systems has gained significant interest in recent years. However, most of the literature focus on the impact of wind power variability (modeled as SDEs) on transient and small-signal stability, respectively [15]. On the other hand, stochastic long-term stability analysis of power systems has received little attention. This is of particular importance considering the expected trends regarding the integration of RES into modern power systems.
The stochastic long-term dynamic model of power systems can be represented as a set of hybrid nonlinear SDAEs [16], as follows:
x ˙ = f ( x , y , u , z , η ˙ ) , 0 = g ( x , y , u , z , η ) , η ˙ = a ( x , y , η ) + b ( x , y , η ) ζ ,
where f and g represent the differential and algebraic equations, respectively; x and y represent the state and algebraic variables, such as generator rotor speeds and bus voltage angles, respectively; u represents the inputs, such as the schedules of synchronous generators; z represents discrete variables; η represents the stochastic characterization of wind speed; a and b are the drift and diffusion of the SDEs, respectively; and ζ is the white noise. It is worth mentioning that (1) is solved using numerical integration techniques. This is possible as the algebraic equations g , in (1), do not explicitly depend on white noises ζ , or on η ˙ [16]. In this work, an implicit trapezoidal integration method is used for functions, f and a , while the Euler–Maruyama method is used to integrate the stochastic term b . Further details related to the numerical integration of the SDAEs can be found in [16].
It is necessary to consider both electromechanical and long-term dynamic models, when one performs stochastic long-term dynamic simulations [17]. With this regard, (1) includes the dynamic models of conventional machines (4th order models) and their primary controllers; AGC; wind power plants (5th order Doubly-Fed Induction Generator) [18]; the model of subhourly SUC.

2.2. Wind Power Modeling

Modeling wind power as a stochastic source is crucial in long-term dynamic studies [19]. With this aim, Equation (1) model wind power variations as a stochastic perturbation with respect to the wind generation forecast. More specifically, we use Ornstein–Uhlenbeck processes (modeled as SDEs) to represent the volatile nature of the wind speed variations v s , that feeds the wind turbines, as follows:
v s ( t ) = v s 0 + η v ( t ) , η ˙ v ( t ) = α v ( μ v η v ( t ) ) + b v ζ v ,
where v s 0 represents the initial value of the wind speed; η v represents the stochastic variable which depends on the drift α v ( μ v η v ) , and the diffusion term b v of the SDEs; α v represents the mean reversion speed, and shows how quickly η v tends towards its mean μ v ; finally, the white noise is represented by ζ v .

2.3. Primary and Secondary Frequency Controllers of Conventional Power Plants

The displacement of conventional synchronous generators and their replacement with non-synchronous stochastic sources leads to a decrease in the overall inertia of the system, reduction of secondary frequency regulation and an increase of the aggregated system droop [4]. In general, this can lead to large frequency deviations and therefore it is crucial to study such an impact on the dynamic behaviour of power systems. Motivated by the above, the paper make use of a recent cosimulation platform proposed by the authors to perform a sensitivity analysis where the parameters of primary and secondary controllers are varied and their effect on the long-term dynamic behaviour of power systems is observed. In this work, the frequency of the center of inertia of the system, ω COI , is utilised to monitor the overall long-term dynamic behaviour of power systems. Its expression is [18]:
ω COI = g G M g ω g g G M g ,
where ω g and M g are the rotor speed and the starting time (which is twice the inertia constant) of the gth synchronous machine, respectively. M g is an intrinsic part of the machine and as such deeply impacts on the dynamic behaviour of the machine and of the system. It appears in the electromechanical swing equations of the machine, as follows [17]:
d δ g d t = ω g ω COI , M g d ω g d t = p m , g p e , g ( δ g ) ,
where δ g , p m , g and p e , g are the rotor angle, the mechanical power and the electrical power of the gth synchronous machine, respectively.
A standard control scheme of a primary frequency control of a synchronous power plant is depicted in Figure 1 [18]. The model of the primary frequency control of synchronous machines includes an ensemble of the models of the turbine, the valve and the turbine governor. These regulate the mechanical power of the machine ( p m , g ) through the measurement of the rotor speed ω g . The conventional primary frequency regulator consists of a droop ( R g ) and a lead-lag transfer function that models regulator and turbine combined dynamics. Finally p ord , g is the active power order set-point as obtained by the solution of the SUC problem ( p g , t , ξ )—as thoroughly discussed in Section 2.4—and the signal sent by the secondary frequency control ( Δ p g )—discussed at the end of this section. Specifically, p ord , g is given by:
p ord , g = p g , t , ξ + Δ p g .
The main purpose of the primary frequency control is to restore the power system frequency at a quasi-steady state value following a disturbance into the power system. This control is locally implemented and takes place on time scales of tens of seconds.
A simple control scheme of a secondary frequency control or automatic generation control (AGC) is shown in Figure 2. In its simplest implementation, the AGC consists of an integrator block with gain K 0 that coordinates the TGs of synchronous machines to nullify the frequency steady-state error originated by the primary frequency control by sending the active power corrections set-points Δ p g . These signals are proportional to the capacity of the machines and the TG droops R g . The AGC is a centralised control and takes place on the time scales of tens of minutes.
An in-depth discussion of power system dynamics and frequency control is beyond the scope of this paper. The interested reader can find further information regarding the relevant relationship between the above variables, namely, inertia M, droop R, and gain K, in dedicated monographs, e.g., [17,18].

2.4. Stochastic Unit Commitment

Over the last decade, there has been a significant interest to better represent uncertainty in the UC models due to the integration of highly variable RES. Traditionally, the uncertainty in these models have been managed by scheduling some specific amount of reserves (e.g., as a percentage of the total demand). However, this may lead to suboptimal solution of the UC problem and thus impact system security. A common solution to this problem is to use stochastic optimization, in particular, two-stage stochastic programming [20]. A two-stage SUC model uses a probabilistic description of uncertain nature of parameters, e.g., wind power generation, in the form of scenarios, [21], as follows:
min H , W t T g G ( C g F z g , t F + C g S U z g , t S U + C g S D z g , t S D ) + ξ Ξ π ξ t T l L C g V p g , t , ξ + t T l L C L L l , t , ξ S H
such that
z g , t S U z g , t S D = z g , t F z g , t 1 F , g G , t { 2 , T }
z g , t S U z g , t S D = z g , t F I S g , g , t { 1 }
z g , t S U + z g , t S D 1 , g , t { 1 , T }
z g , t F = I S g , L g U P + L g D W > 0 , g , t L g U P + L g D W
τ = t U T g + 1 t z g , τ S U z g , t F , g , t > L g U P + L g D W
τ = t D T g + 1 t z g , τ S D 1 z g , t F , g , t > L g U P + L g D W
g G n p g , t , ξ l L n L l , t + l L n L l , t , ξ S H + f F n W f , t , ξ f F n W f , t , ξ S P = m M n ( θ n , t , ξ θ m , t , ξ ) X n , m , n , t , ξ Ξ
p g , t , ξ P g max z g , t F , g , t , ξ Ξ
p g , t , ξ P g m i n z g , t F , g , t , ξ Ξ
p g , t , ξ ( P g I S + R U g ) z g , t F , g , t { 1 } , ξ Ξ
p g , t , ξ ( P g I S R D g ) z g , t F , g , t { 1 } , ξ Ξ
p g , t , ξ p g , t 1 , ξ ( 2 z g , t 1 F z g , t F ) P g S U + ( 1 + z g , t 1 F z g , t F ) R U g ) , g , t { 2 , , T } , ξ Ξ
p g , t 1 , ξ p g , t , ξ ( 2 z g , t 1 F z g , t F ) P g S D + ( 1 z g , t 1 F + z g , t F ) R D g ) , g , t { 2 , , T } , ξ Ξ
L l , t , ξ S H L l , t , l , t , ξ Ξ
W f , t , ξ S P W f , t , ξ , f , t , ξ Ξ
P n , m max ( θ n , t , ξ θ m , t , ξ ) X n , m P n , m max , n , m M n , t , ξ Ξ
p g , t , ξ , L l , t , ξ S H , W f , t , ξ S P 0 , g , l , f , t , ξ Ξ
z g , t F , z g , t S U , z g , t S D { 0 , 1 } , g , t
with initial state conditions:
I S g = 1 if O N g > 0 0 if O N g = 0 L g U P = m i n { T , ( U T g O N g ) I S g } L g D W = m i n { T , ( D T g O F F g ) ( 1 I S g ) }
The SUC problem (6)–(24) is a standard model proposed in the literature. Its objective is to minimise the fixed cost ( C g F ), start-up cost ( C g S U ), shut-down cost ( C g S D ), and variable cost ( C g V ) of the synchronous generators, as well as the cost of involuntarily demand curtailment, (6). Equations (7)–(9) represent the logical expression between different binary variables (ON/OFF commitment status). Equations (10)–(12) represent the minimum and maximum up- and down-time constraints of the synchronous generators. Equation (13) model the power balance constraint. Equations (14) and (15) model the capacity limits of synchronous generators, while their respective ramping limits are modeled through (16)–(19). The limits of the demand and wind power curtailment are modeled through (20) and (21). Equation (22) represent the transmission capacity limits. Last, Equations (23) and (24) represent variable declarations.
The SUC problem (6)–(24) includes first-stage variables z g , t F , z g , t S U , z g , t S D that model the status of the machines g in time period t (e.g., start-up/shut-down status) and second-stage variables p g , t , ξ , L l , t , ξ S H , W f , t , ξ S P , θ n , t , ξ that model the active power of the synchronous machines g, the power curtailment from load l, wind power curtailment from wind production unit f, and voltage angle at node n, in time period t and scenario ξ , respectively. The interested reader can find further details of the SUC in [22] and references therein.
The problem (6)–(24) is based on [22] and is the reference complete SUC formulation considered in the case study. Note that the cosimulation framework is general and allows to assess the impact of any other model of SUC on power system dynamics.
If one considers only one scenario, the set of Equations (6)–(24) reduces to a deterministic UC problem. In the following we use the notation “SUC” to indicate a stochastic formulation, i.e., the set Ξ consists of more than one scenario, and the notation “DUC” for the deterministic case.

2.5. Simplified SUC Formulation

The level of complexity of SUC formulations proposed so far in the literature vary significantly [23]. For example, a well-assessed MILP SUC formulation is provided in [22]. Such a model takes into consideration several technical constraints, e.g., ramping limits of generators and capacity limits of transmission lines, just to mention some. These constraints improve the performance of the schedules but are not crucial in this paper, which focuses on the impact on long-term power system dynamics. Hence, a simplified model of SUC is considered, as follows:
minimize z g , t F , p g , t , ξ t Ξ T g G C g F z g , t F + ξ Ξ π ξ t Ξ T g Ξ G C g V p g , t , ξ
such that
p g , t , ξ P g max z g , t F , g , t , ξ Ξ
p g , t , ξ P g m i n z g , t F , g , t , ξ Ξ
g Ξ G n p g , t , ξ l Ξ L n L l , t + k Ξ K n W k , t , ξ = m Ξ M n ( θ n , t , ξ θ m , t , ξ ) X n , m , n , t , ξ Ξ
z g , t F { 0 , 1 } , g Ξ G , t Ξ T
where z g , t F is a first-stage decision variable that models the status (ON/OFF) of the conventional machines in time period t; C g F and C g V represents the fixed and variable production cost of generation unit g, respectively; π ξ is the probability of wind power scenario ξ ; p g , t , ξ is a variable that represents the active power of the machine g in scenario ξ and time period t; P g max and P g min represents the maximum and minimum active power limits of generation unit g, respectively; L l , t represents the demand for load l at time period t; W k , t , ξ is the wind power production of wind generation unit k, θ n , t , ξ are the voltage angles at node n and at time period t in scenario ξ , respectively; X n , m is the reactance of the transmission line n m ; and Ξ K n , Ξ M n represents the sets of wind power generation connected at node n, and nodes m N connected to node n through a line, respectively. Finally, constraints (25) to (29) model the objective function, maximum and minimum power output of generators, nodal power balance equation (DC power flow), and variable declarations, respectively.

2.6. Alternative SUC Formulation

The literature provides several different formulations of the SUC problem [24]. Therefore it is relevant to compare and study the impact that these models have on the power system dynamic behaviour. In this context, an alternative subhourly SUC model with respect to the one discussed in the previous section has been adapted based on [25], as follows:
minimize z g , t F , p g , t , r g , t , ξ U , r g , t , ξ D , W k , t t Ξ T g Ξ G C g , t S U + C g V p g , t + ξ Ξ π ξ t Ξ T g Ξ G C g V ( r g , t , ξ U r g , t , ξ D )
such that
C g , t S U C g S U ( z g , t F z g , t 1 F ) , g , t
C g , t S U 0 , g , t
z g , t F P g m i n p g , t z g , t F P g max , g , t
g Ξ G p g , t + k Ξ K W k , t = L t , t
z g , t F P g m i n ( p g , t + r g , t , ξ U r g , t , ξ D ) z g , t F P g max , g , t , ξ
g Ξ G ( p g , t + r g , t , ξ U r g , t , ξ D ) + k Ξ K W k , t , w = L t , t , ξ
0 r g , t , ξ U R g , t U max , g , t , ξ
0 r g , t , ξ D R g , t D max , g , t , ξ
z g , t F { 0 , 1 } , g , t
where, apart from the variables and parameters already defined above, C g , t S U models the start-up cost of generation unit g incurred at the beginning of time period t; r g , t , ξ U and r g , t , ξ D are decision variables and represents the increase and decrease in the active power output of generation unit g at time period t, respectively, say, during real-time operation (e.g. to compensate wind power fluctuations); while all other parameters and variables have analogous meanings as in the previous SUC formulation.
The main difference between problem (30)–(39) and problem (25)–(29) is that in the former the active power of generation units, p g , t , is a first-stage variable and does not adapt to the uncertainty realization. Note that model (25)–(29) has a slightly different objective function, namely, it does not include the start-up cost ( C g , t S U ) as compared to that of model (30)–(39).

2.7. Cosimulation Framework

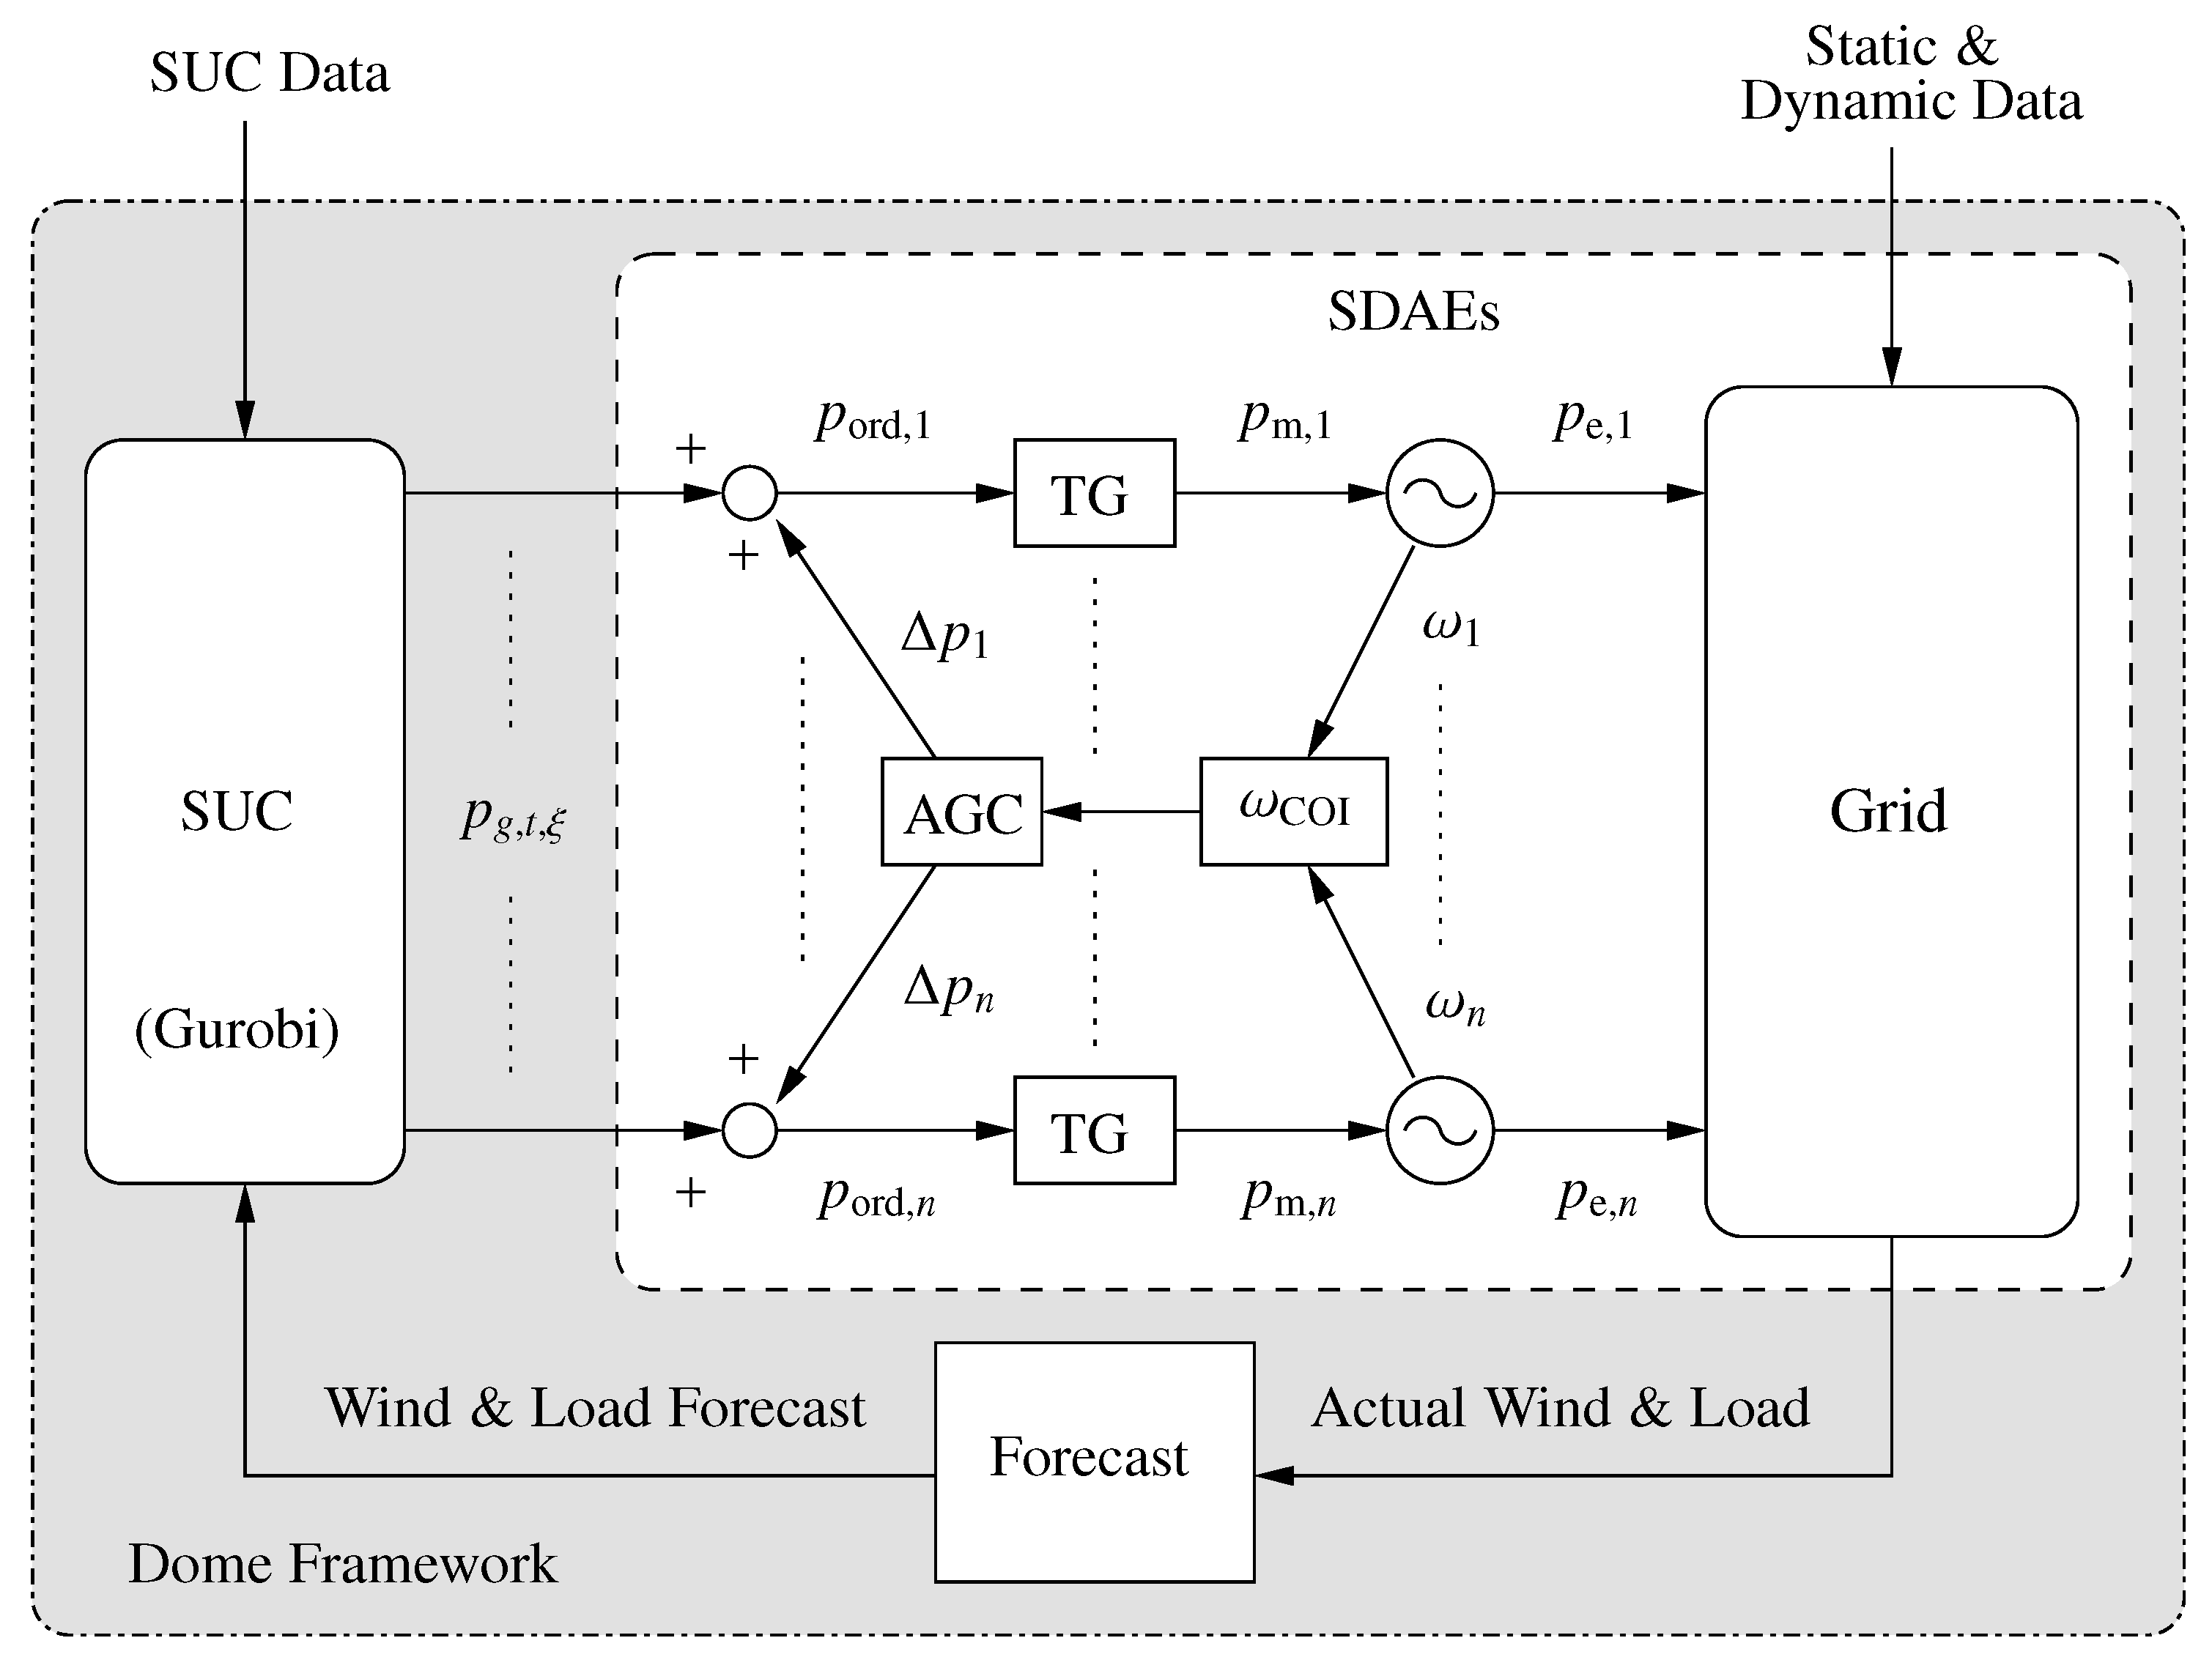
The cosimulation method allows coupling different subdomain models, like, for example, power systems and electricity markets, and is currently one of the most used to study the behaviour of modern power grids [26]. Figure 3 depicts the structure of the cosimulation framework, and shows the interaction between the discrete model of the SUC and dynamic model of SDAEs. The software tool dome [27] takes care of the entire cosimulation, in particular, the exchange of information from one model to the other. Note that each model is solved independently, i.e., the subhourly SUC in Gurobi [28], and SDAEs in the dynamic software tool dome. Both models communicate together in every time period t, e.g., 5 min, by exchanging their outputs as indicated in Equation (5).
On the other hand, the subhourly SUC models uses as an input the forecast of wind and loads, which are obtained based on the realizations of the stochastic processes (utilizing a Monte Carlo method). These realizations (output of SDAEs) define the “reality” that has to be updated to solve the next SUC problem (see Figure 3).

3. Case Study

This Section is organised as follows. Section 3.1 provides a sensitivity analysis of the impact of different frequency controllers/machine parameters using a complete SUC, a DUC, a simplified SUC and an alternative SUC model, and different scheduling time periods. This analysis allows comparing and drawing conclusions on the effect of these parameters on the dynamic performance of the system. Section 3.2 compares the impact that different models of SUC have on the dynamic performance of power systems.
A modified New England IEEE 39-bus system [29] is used in all simulations, where the data of the SUC are taken from [30]. In particular, the value of load curtailment (present in the reference model of SUC) is taken equal to $1000/MWh [21]; the cost of wind is assumed zero; the value of the fixed ( C g F ) and variable ( C g V ) cost coefficients is taken equal to the fixed and proportional cost coefficients a ($/h) and b ($/MWh), respectively, in [30]. The focus of this work is on the first 4 h of the planning horizon. Furthermore, the wind profile is modeled as in [13].
Wind power uncertainty, volatility and rolling planning horizon within the SUC are modeled as in [13]. In particular, three wind power scenarios are considered, namely, low, medium, and high. The medium scenario considers a 25% wind penetration level, while the low and high scenario are built according to the maximum variation width. Moreover, three wind power plants are considered and connected at bus 20, 21 and 23, respectively, with a nominal capacity of 300 MW each. It should be noted that this number of scenarios is considered sufficient as it was shown in [13] that increasing the number of scenarios leads to similar effect on the dynamic performance of the system.
The results of the case study are based on a Monte Carlo method, where 50 simulations are considered for each scenario. Moreover, the standard deviation of the frequency of the COI, σ COI , is computed as the average of the standard deviation obtained for each trajectory. The SUC models (6)–(24), (25)–(29) and (30)–(39) are modeled using the Gurobi Python interface [28], whereas all simulations are obtained using a Python-based software tool for power system analysis, called dome [27].

3.1. Sensitivity Analysis of the Impact of Different Frequency Controllers/Machine Parameters

In this Section, we vary (one at a time) three relevant frequency control/machine parameters and observe their impact on the standard deviation of the frequency.
The following base-case scenario is considered: the value of the gain of the AGC is taken equal to K 0 = 50 , the value of the droop of the TGs is taken equal to R = 0.05 , and the value of inertia of the machines is taken equal to the original values. In the scenarios below, the total inertia of the system and the gain of AGC is decreased up to 45% from the base case. Similarly, the aggregated system droop is increased up to 45% from the base case. Finally, as system operators still rely on deterministic UC and different subhourly scheduling time periods [31], this sensitivity is performed using 15- and 5-min time periods and different SUC formulations.
In the following, the subindexes S and D indicate control parameters for stochastic and deterministic scenarios, respectively.

3.1.1. SUC with 15-min Time Period

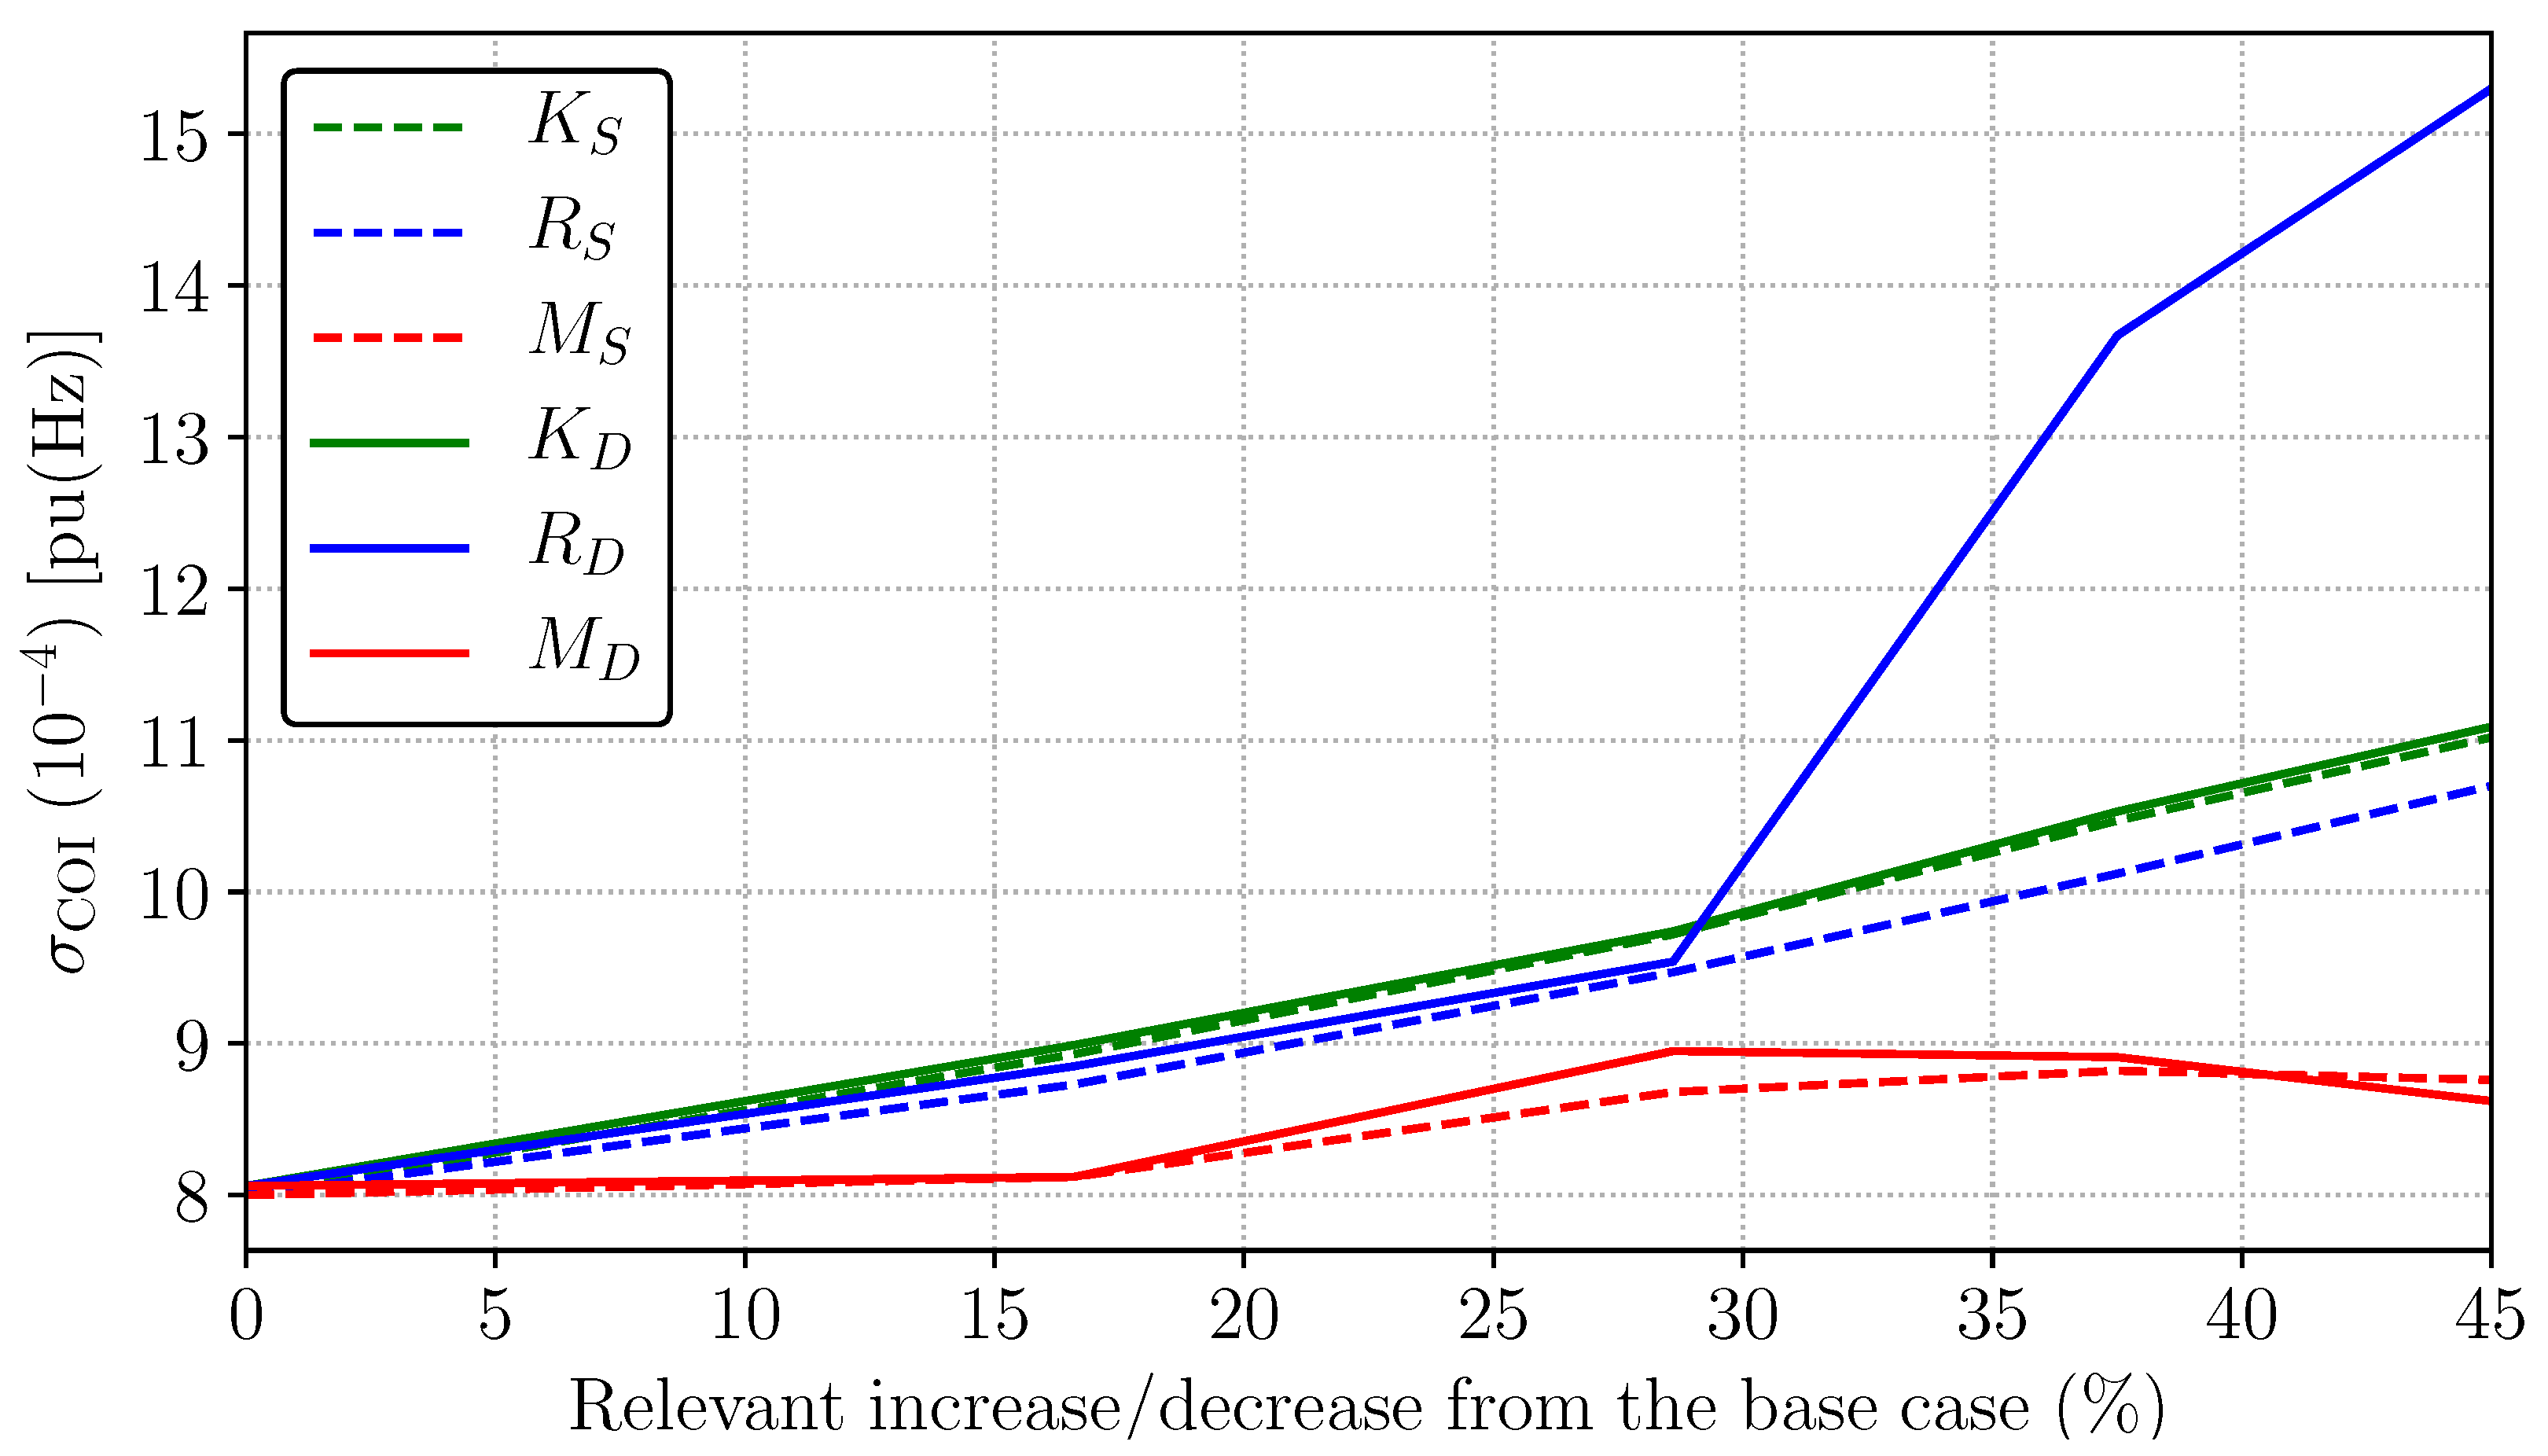
In this scenario, we use a 15-min scheduling time period and set the SUC probabilities for the low, medium and high wind power scenario equal to 20%, 60%, 20%, respectively. Same probabilities are used when solving the MC-TDS. Next, the relevant frequency control/machine parameters are varied accordingly up to 45% of their base case value. Figure 4 shows the effect of the variation of these parameters on σ COI .
The gain of AGC, K S , has the highest impact on σ COI . The relationship between the gain K S , the droop R S , and σ COI is almost linear within the used range. This indicates larger frequency deviations as synchronous generators are replaced with RES (assuming that RES will not provide frequency regulation). On the other hand, the inertia M S appears to have a small impact on long-term frequency deviation. This result indicates that while the inertia is the main parameter impacting on the frequency dynamics following a major contingency, this is not the case on its impact on the σ COI (see also [4], which draws a similar conclusion).

3.1.2. DUC with 15-min Time Period

As discussed above, system operators still rely on a DUC formulation when scheduling the system. Therefore it is important to compare the impact of the variation of the relevant control/machine parameters on σ COI , using a SUC and a DUC. With this aim, we set the DUC probabilities for the low, medium and high wind power scenarios equal to 0%, 100%, 0%, respectively. Thus, perfect forecast, which corresponds to the medium scenario, is assumed. However, when solving the MC-TDS, 20%, 60%, 20% probabilities are used to generate the three wind power scenarios. This creates a mismatch between forecast and actual wind variations and allows evaluating the robustness of the SUC and DUC formulations.
Figure 4 shows the impact on σ COI of varying control/machine parameters. A relevant difference with respect to the scenario above is that the droop R D has the highest impact on σ COI when its value is 30 % with respect to the base case. On the other hand, the gain of the AGC, K D and the inertia M D have similar impact on σ COI as in the previous scenario. It appears that, the impact of different control parameters on σ COI depends on the UC formulation (deterministic or stochastic). It is thus not obvious which one (i.e., R or K) has the highest impact on σ COI . Figure 4 compares the results of scenario 1 and 2 and shows that using a SUC leads to lower variations of the frequency. Furthermore, it should be noted that the differences between scenarios in Figure 4, for example, R S and R D after 28 % , are due to the fact that both models, namely, SUC and DUC, produce different schedules for generators.
Finally, although the focus of this paper is on the impact of different SUC models on the dynamic behaviour of the system, it is relevant to show the total operating cost for each model. With this aim, Table 1 shows the total operating cost for each subhourly UC model. For the considered case, the complete SUC and DUC produce very similar operating costs, namely, 412 , 000 $ and 411 , 580 $ , respectively. While the simplified SUC model provides a lower estimate of the operating costs, namely, 398 , 000 $ , as it is less constrained. The alternative SUC model results in lower operating costs compared to others models (complete SUC, simplified SUC and DUC), namely, 339 , 470 $ , mainly due to the fact that it has a slightly different objective function, e.g., it does not include the fixed cost.

3.1.3. Sensitivity Analysis Using the Simplified and Alternative SUC, and 15-min Time Period

Here, we perform the same sensitivity analysis as above, but this time using the simplified and alternative SUC models, respectively. Such an analysis allows comparing and drawing conclusions on the impact of different frequency control/machine parameters on σ COI , using different subhourly SUC models. With this aim, Figure 5 shows the relevant results of the sensitivity analysis. Note that the subindexes S i m and A l t indicate control parameters for simplified and alternative SUC scenarios, respectively. As expected, results are, in general, very similar to the ones discussed in previous sections. The gain of the AGC, in this case, K S i m and K A l t , has most of the time the highest impact on σ COI , as well as the inertia of the machines appears to have a small impact. Moreover, using an alternative SUC model and varying its relevant parameters leads to lower variations of the frequency. This is due to the fact that the alternative SUC model schedules more generators to be online compare to the other three UC models. Thus, depending on the SUC model, different control parameters (e.g., K or R) can have different impact on σ COI .

3.1.4. SUC with 5-min Time Period

This scenario investigates whether a shorter scheduling time period of SUC, namely, 5 min, changes the results and conclusions drawn for the 15-min time period. Due to the shorter time period, the wind power uncertainty level within SUC is lower compared to the previous section. Both SUC and MC-TDS probabilities for the low, medium and high scenarios are set equal to 20%, 60% and 20%, respectively.
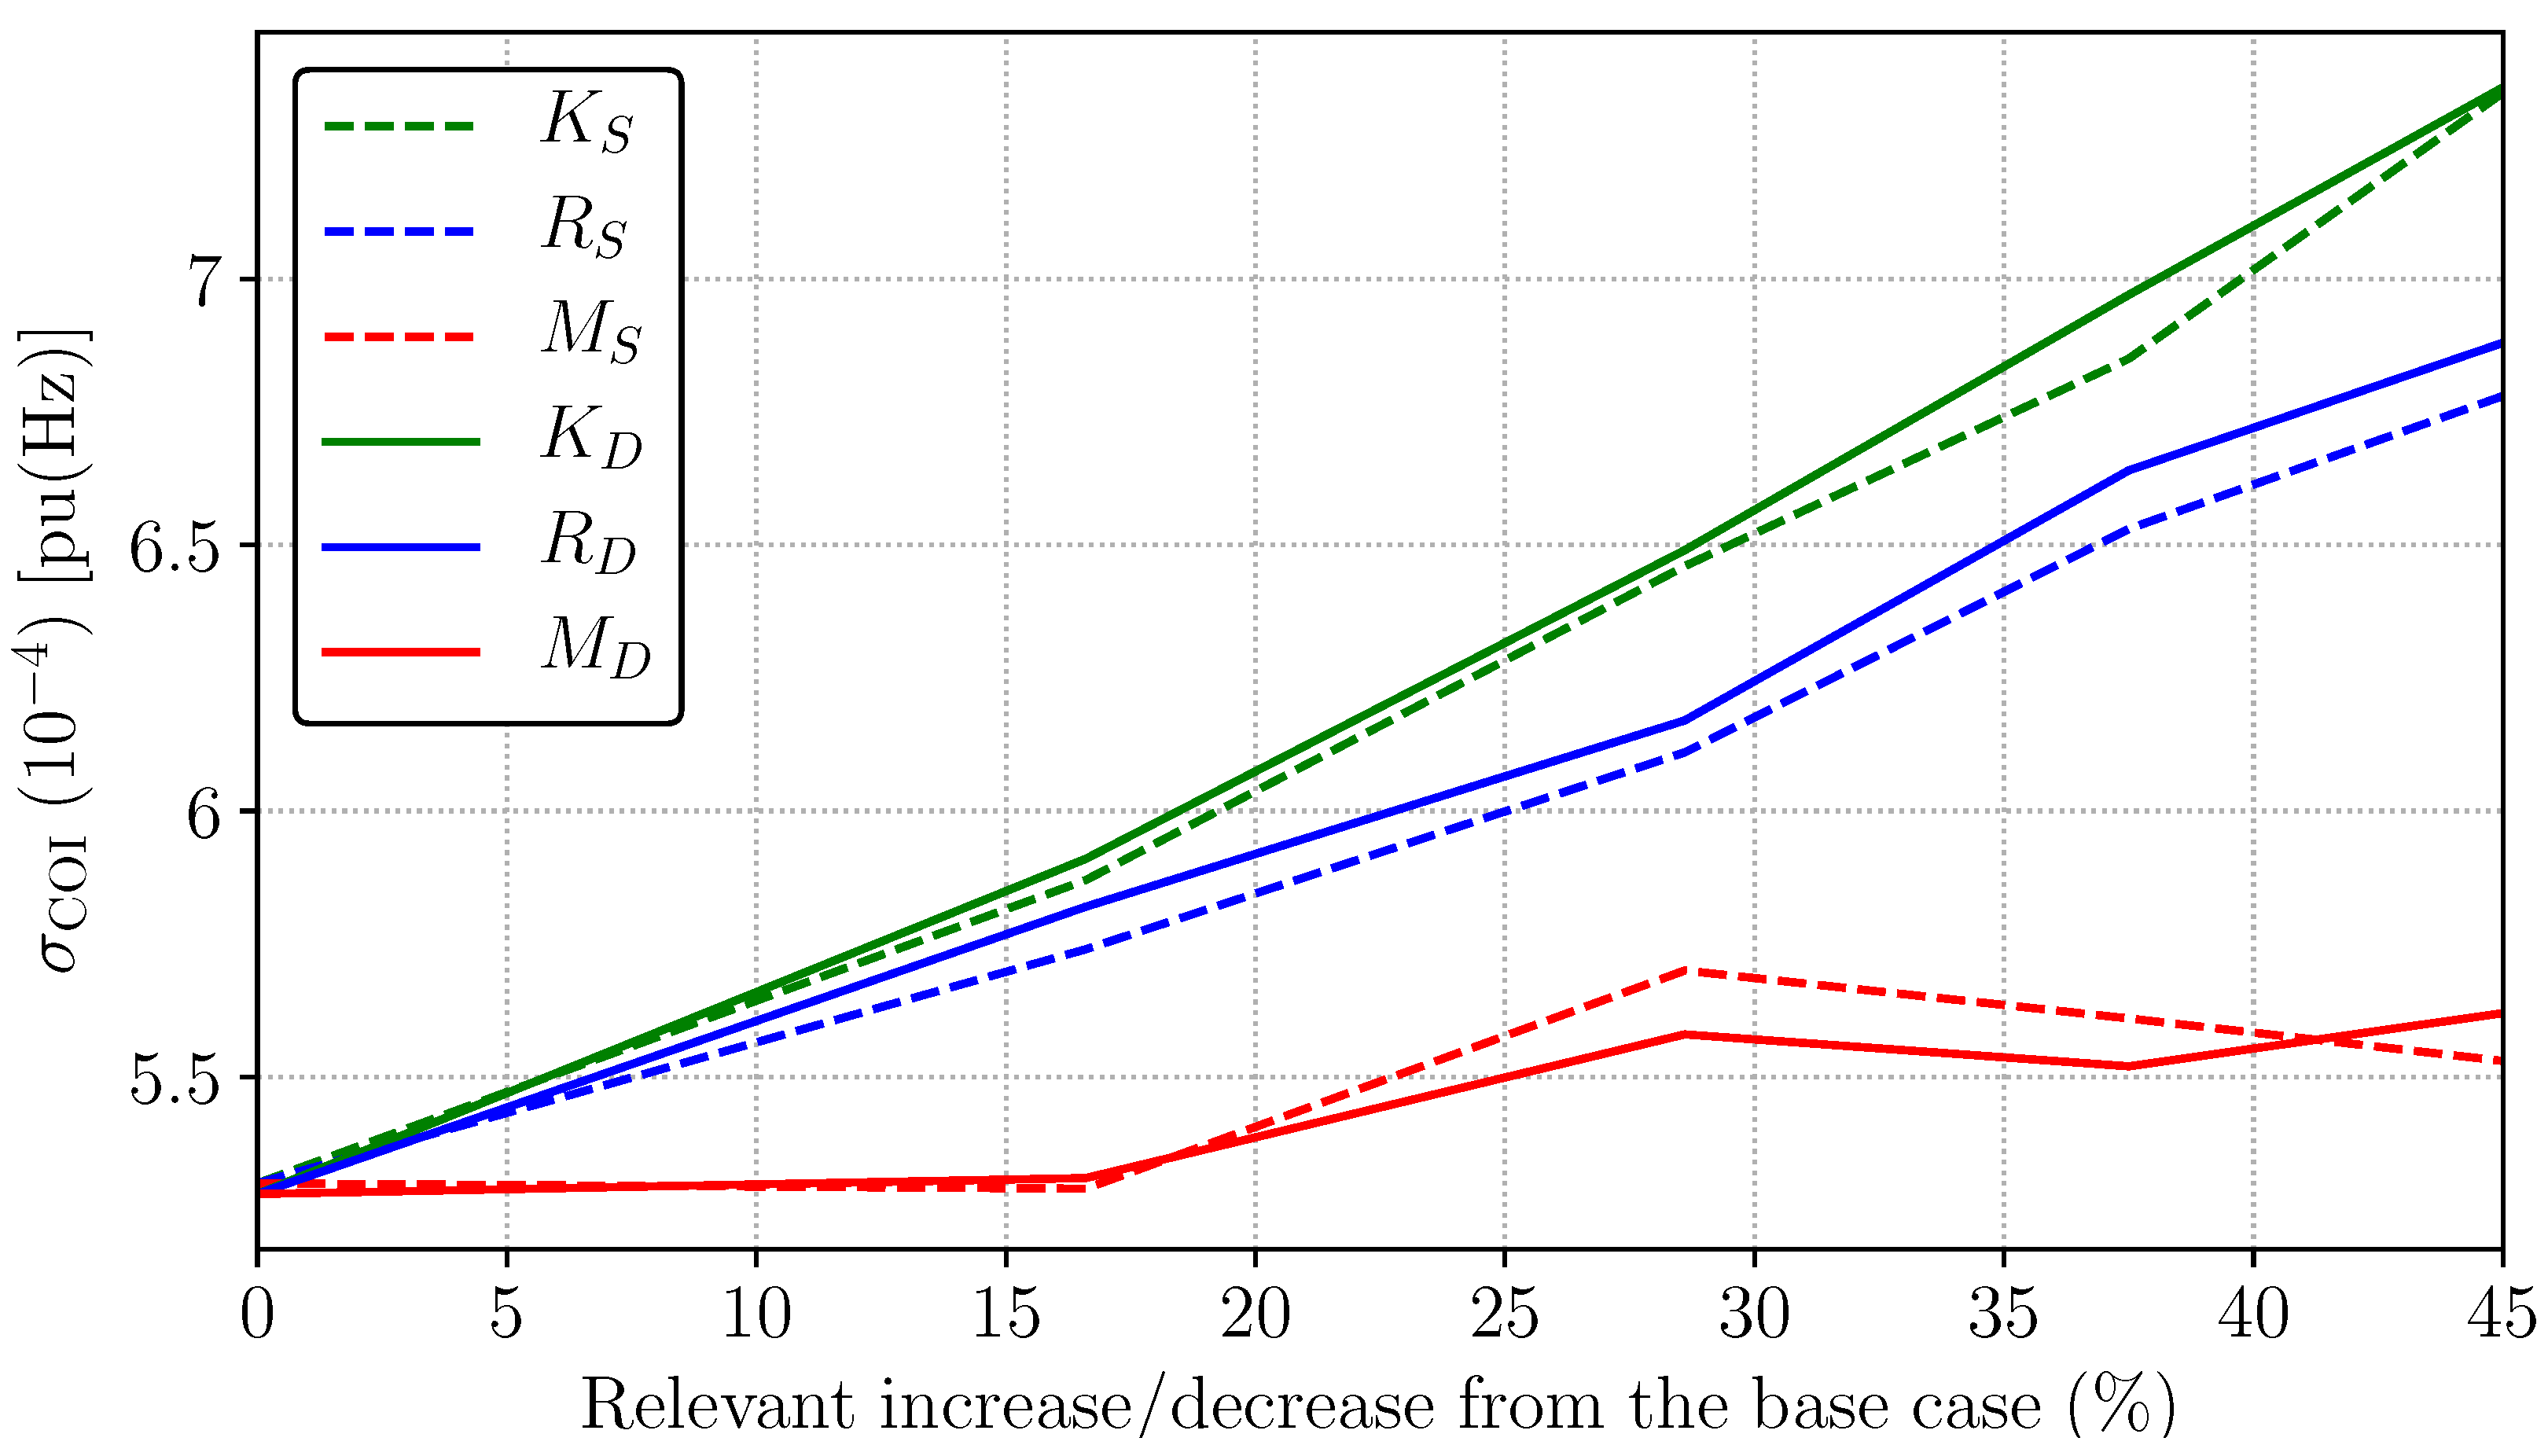
Figure 6 shows the effect of the variation of the relevant control parameters on σ COI . The most visible effect of reducing the time period to 5 min is that the value of σ COI decreases in all scenarios due to a lower wind power uncertainty. In this case, the gain of the AGC, K S , has the highest impact on σ COI . The relationship is linear in the considered range, which indicates the need to increase the frequency regulation to keep long-term frequency deviations within certain limits. Finally, the inertia has little effect on σ COI , supporting the conclusions above.

3.1.5. DUC with 5-min Time Period

Figure 6 shows the effect of the variation of control/machine parameters using a 5-min scheduling and DUC. Results are very similar to the 5-min scheduling SUC. To better show the differences, Figure 6 compares the results of both scenarios, where it can be observed that the SUC leads, in general, to lower frequency variations. In both scenarios, the gain of the AGC has the highest impact on σ COI , whereas the inertia has a small impact.

3.2. Comparison of Different SUC Models

Even though system operators are skeptical regarding the use of SUC approaches due to their complexity and transparency, they acknowledge the need to better represent uncertainty when scheduling the system [24].
For this reason, the objective of this section is to compare the impact that these models have on long-term power system dynamics. Such a comparison is made using a 15-min time period.
We first compare the impact on the dynamic response of the New England 39-bus system of the SUC formulations (6)–(24) (complete SUC) and (25)–(29) (simplified SUC).
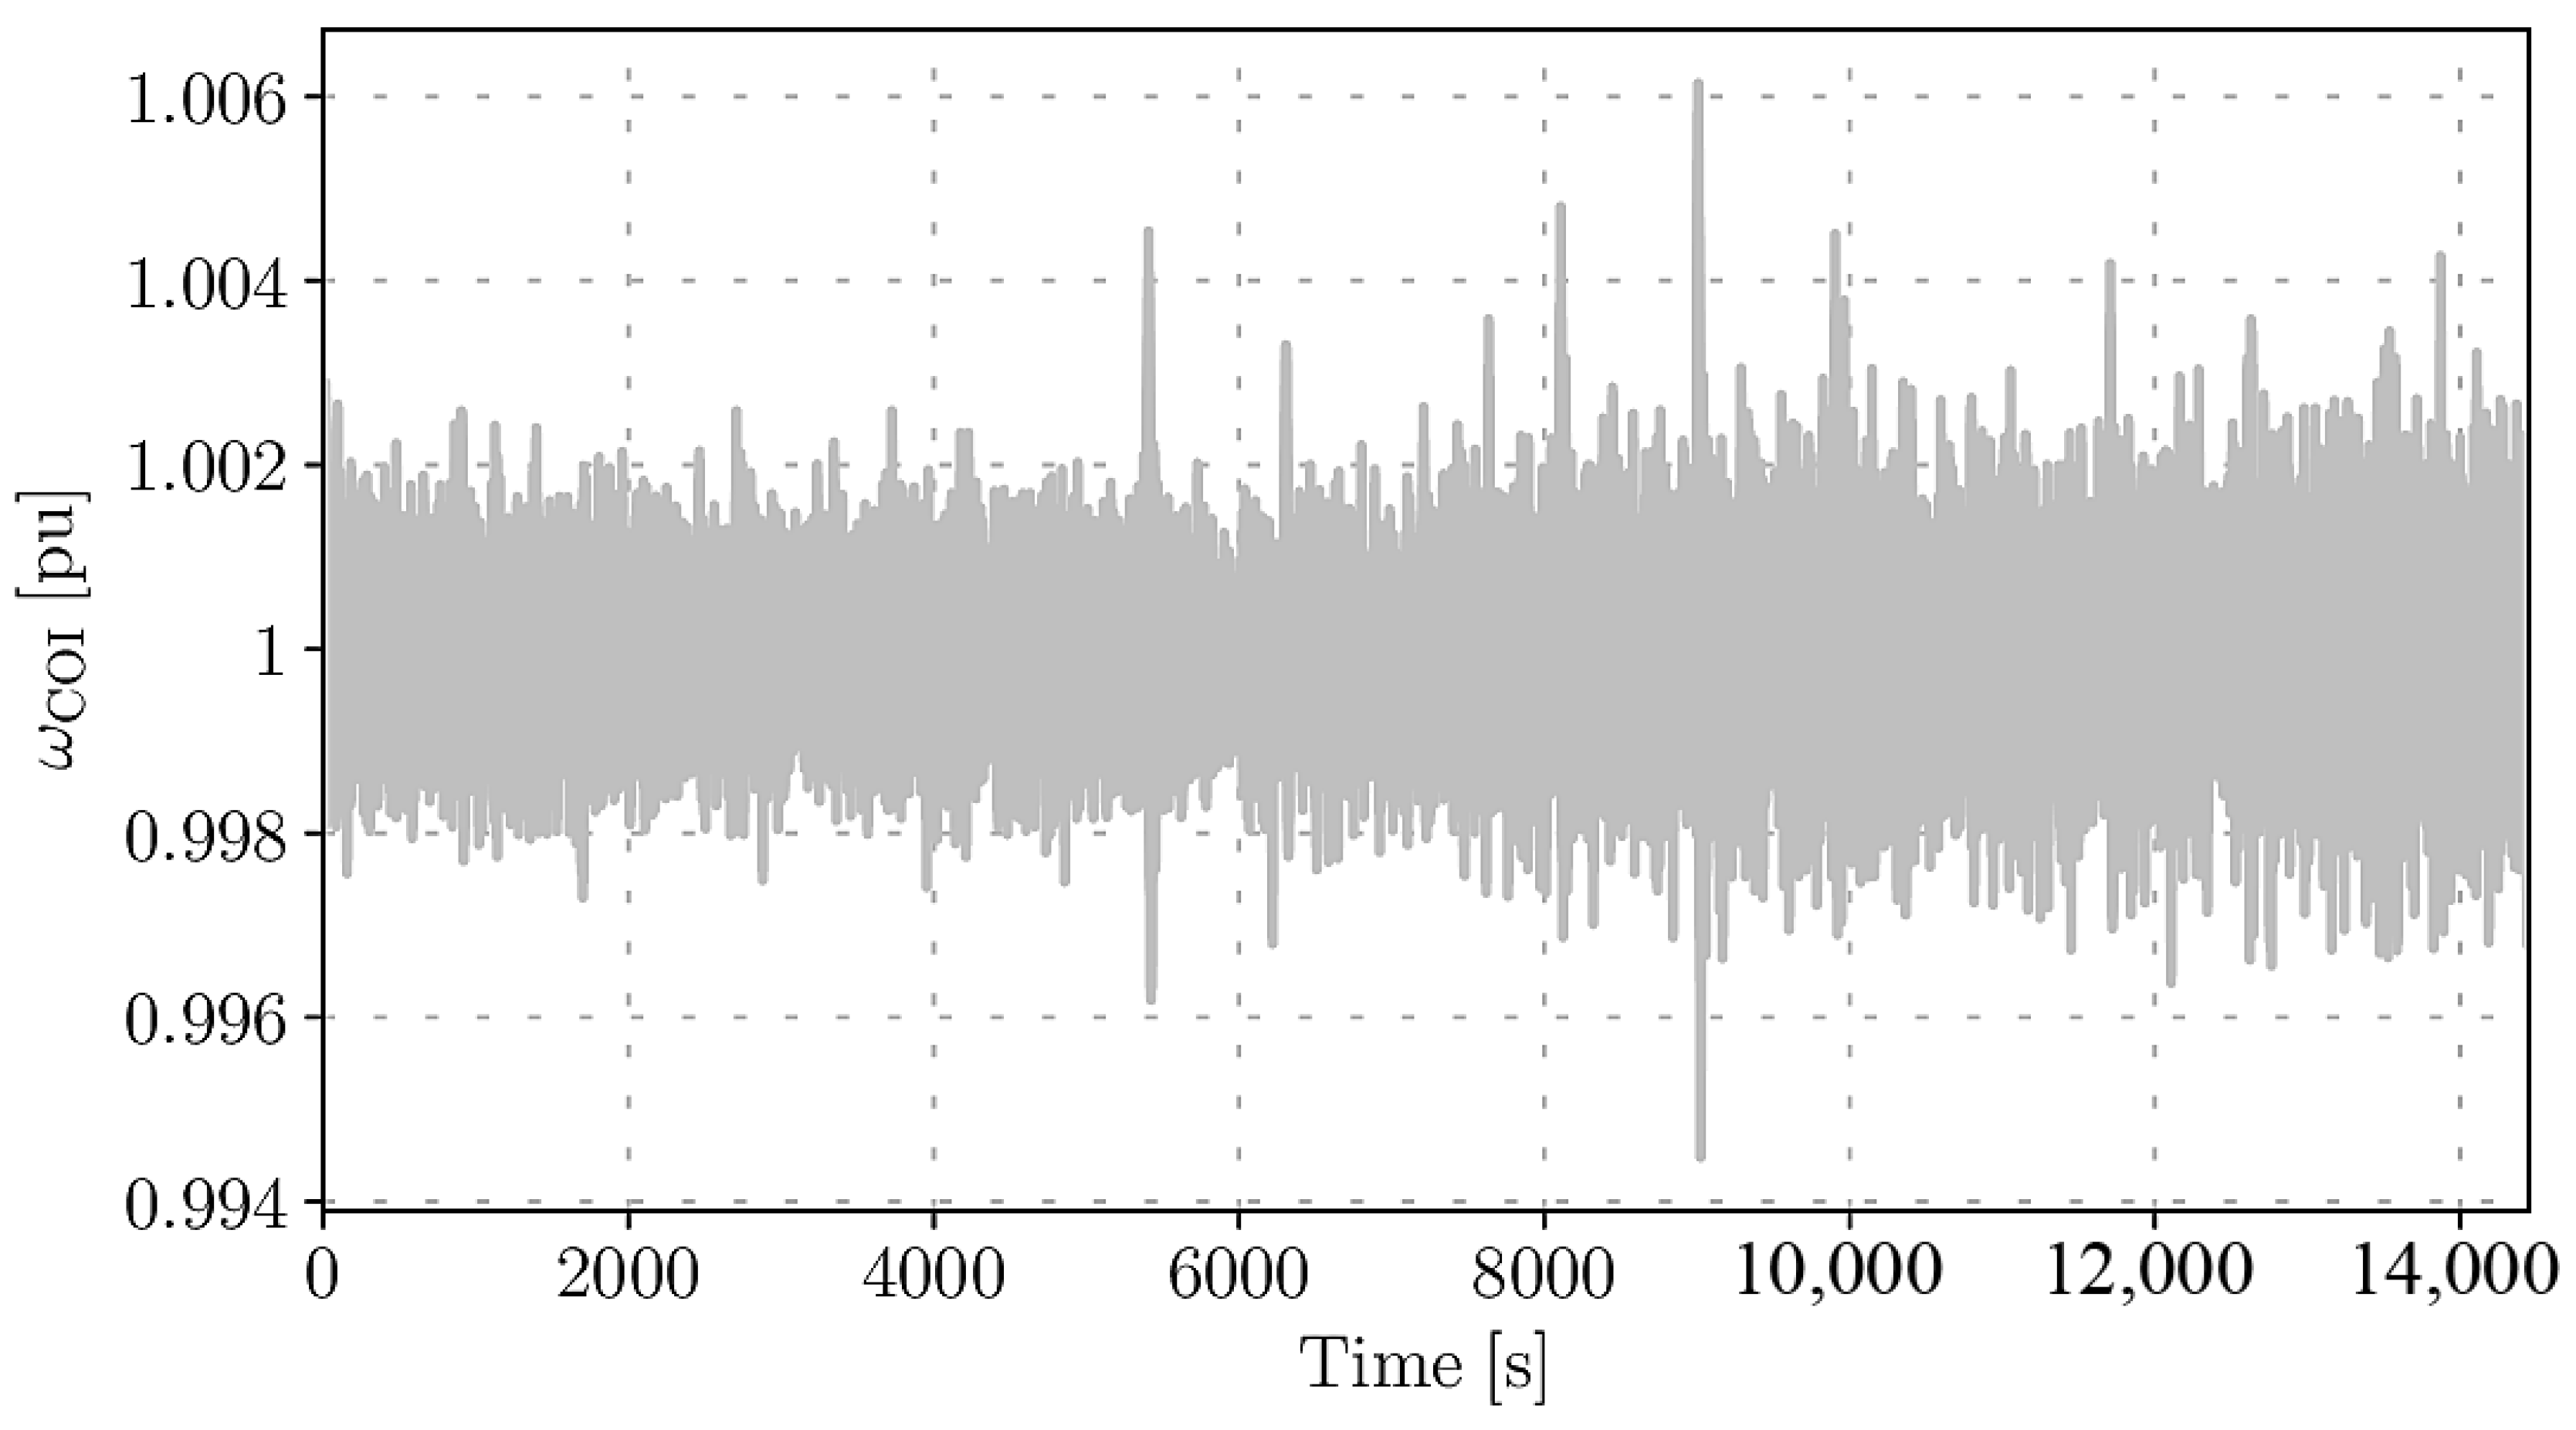
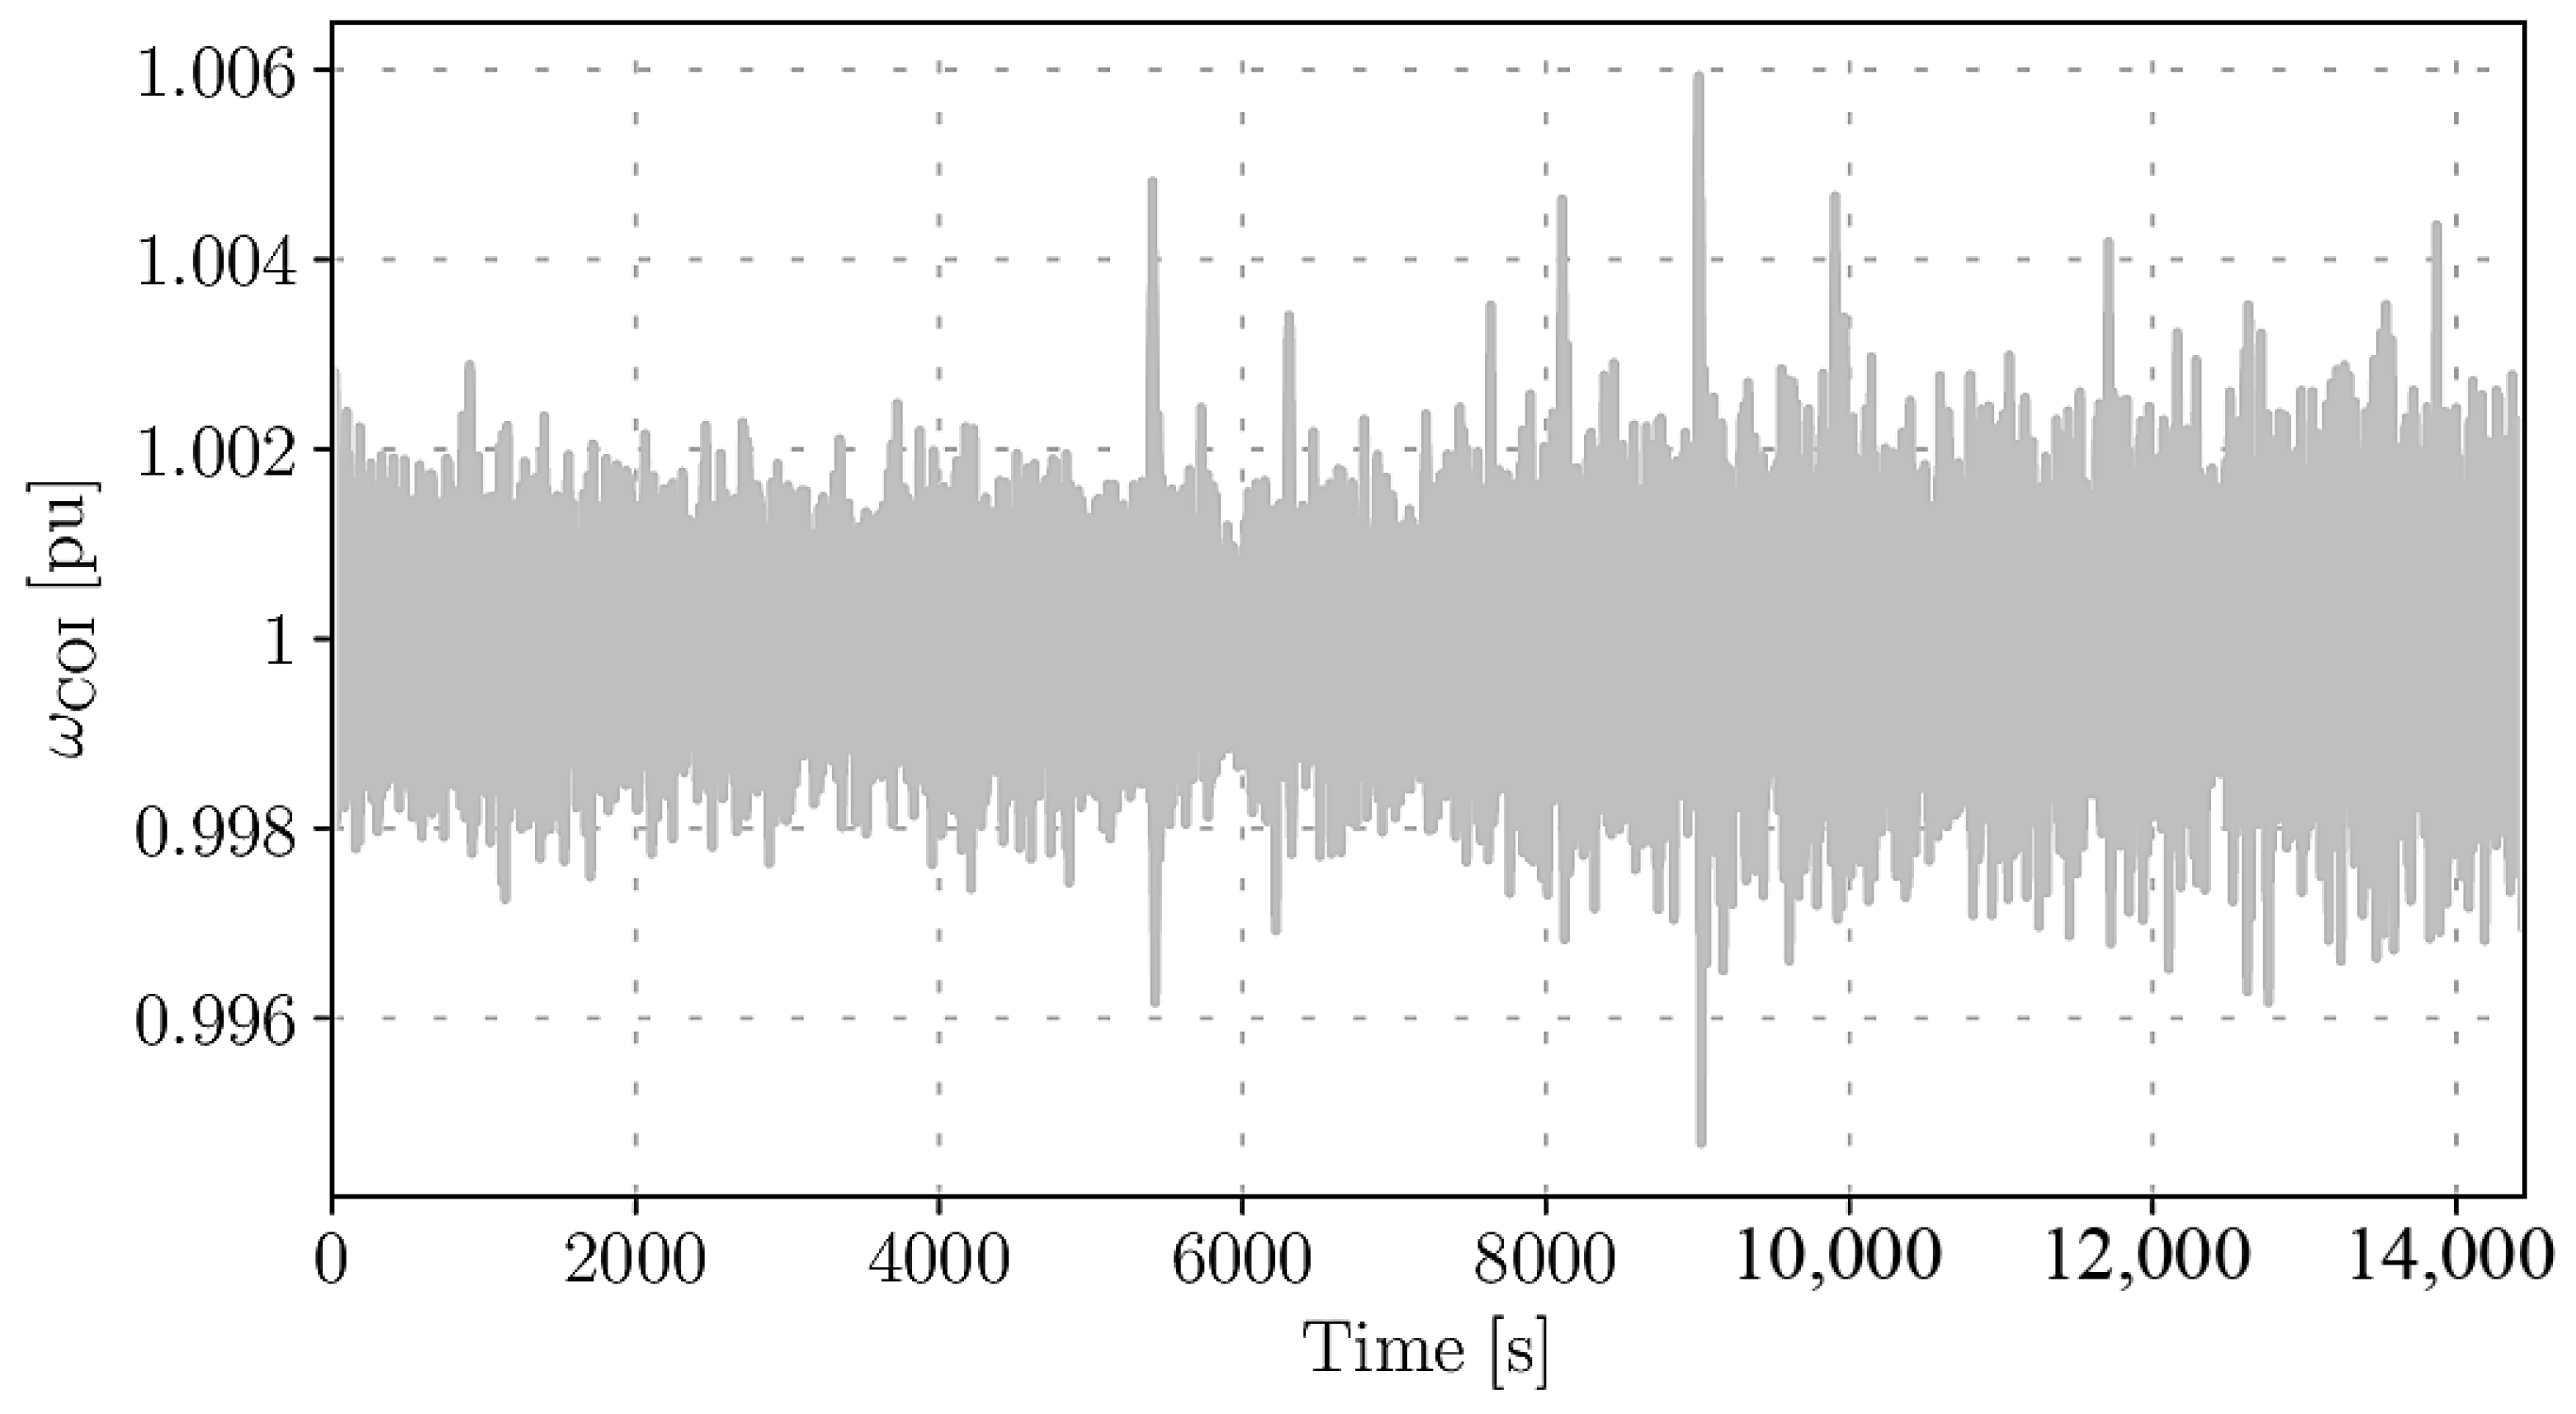
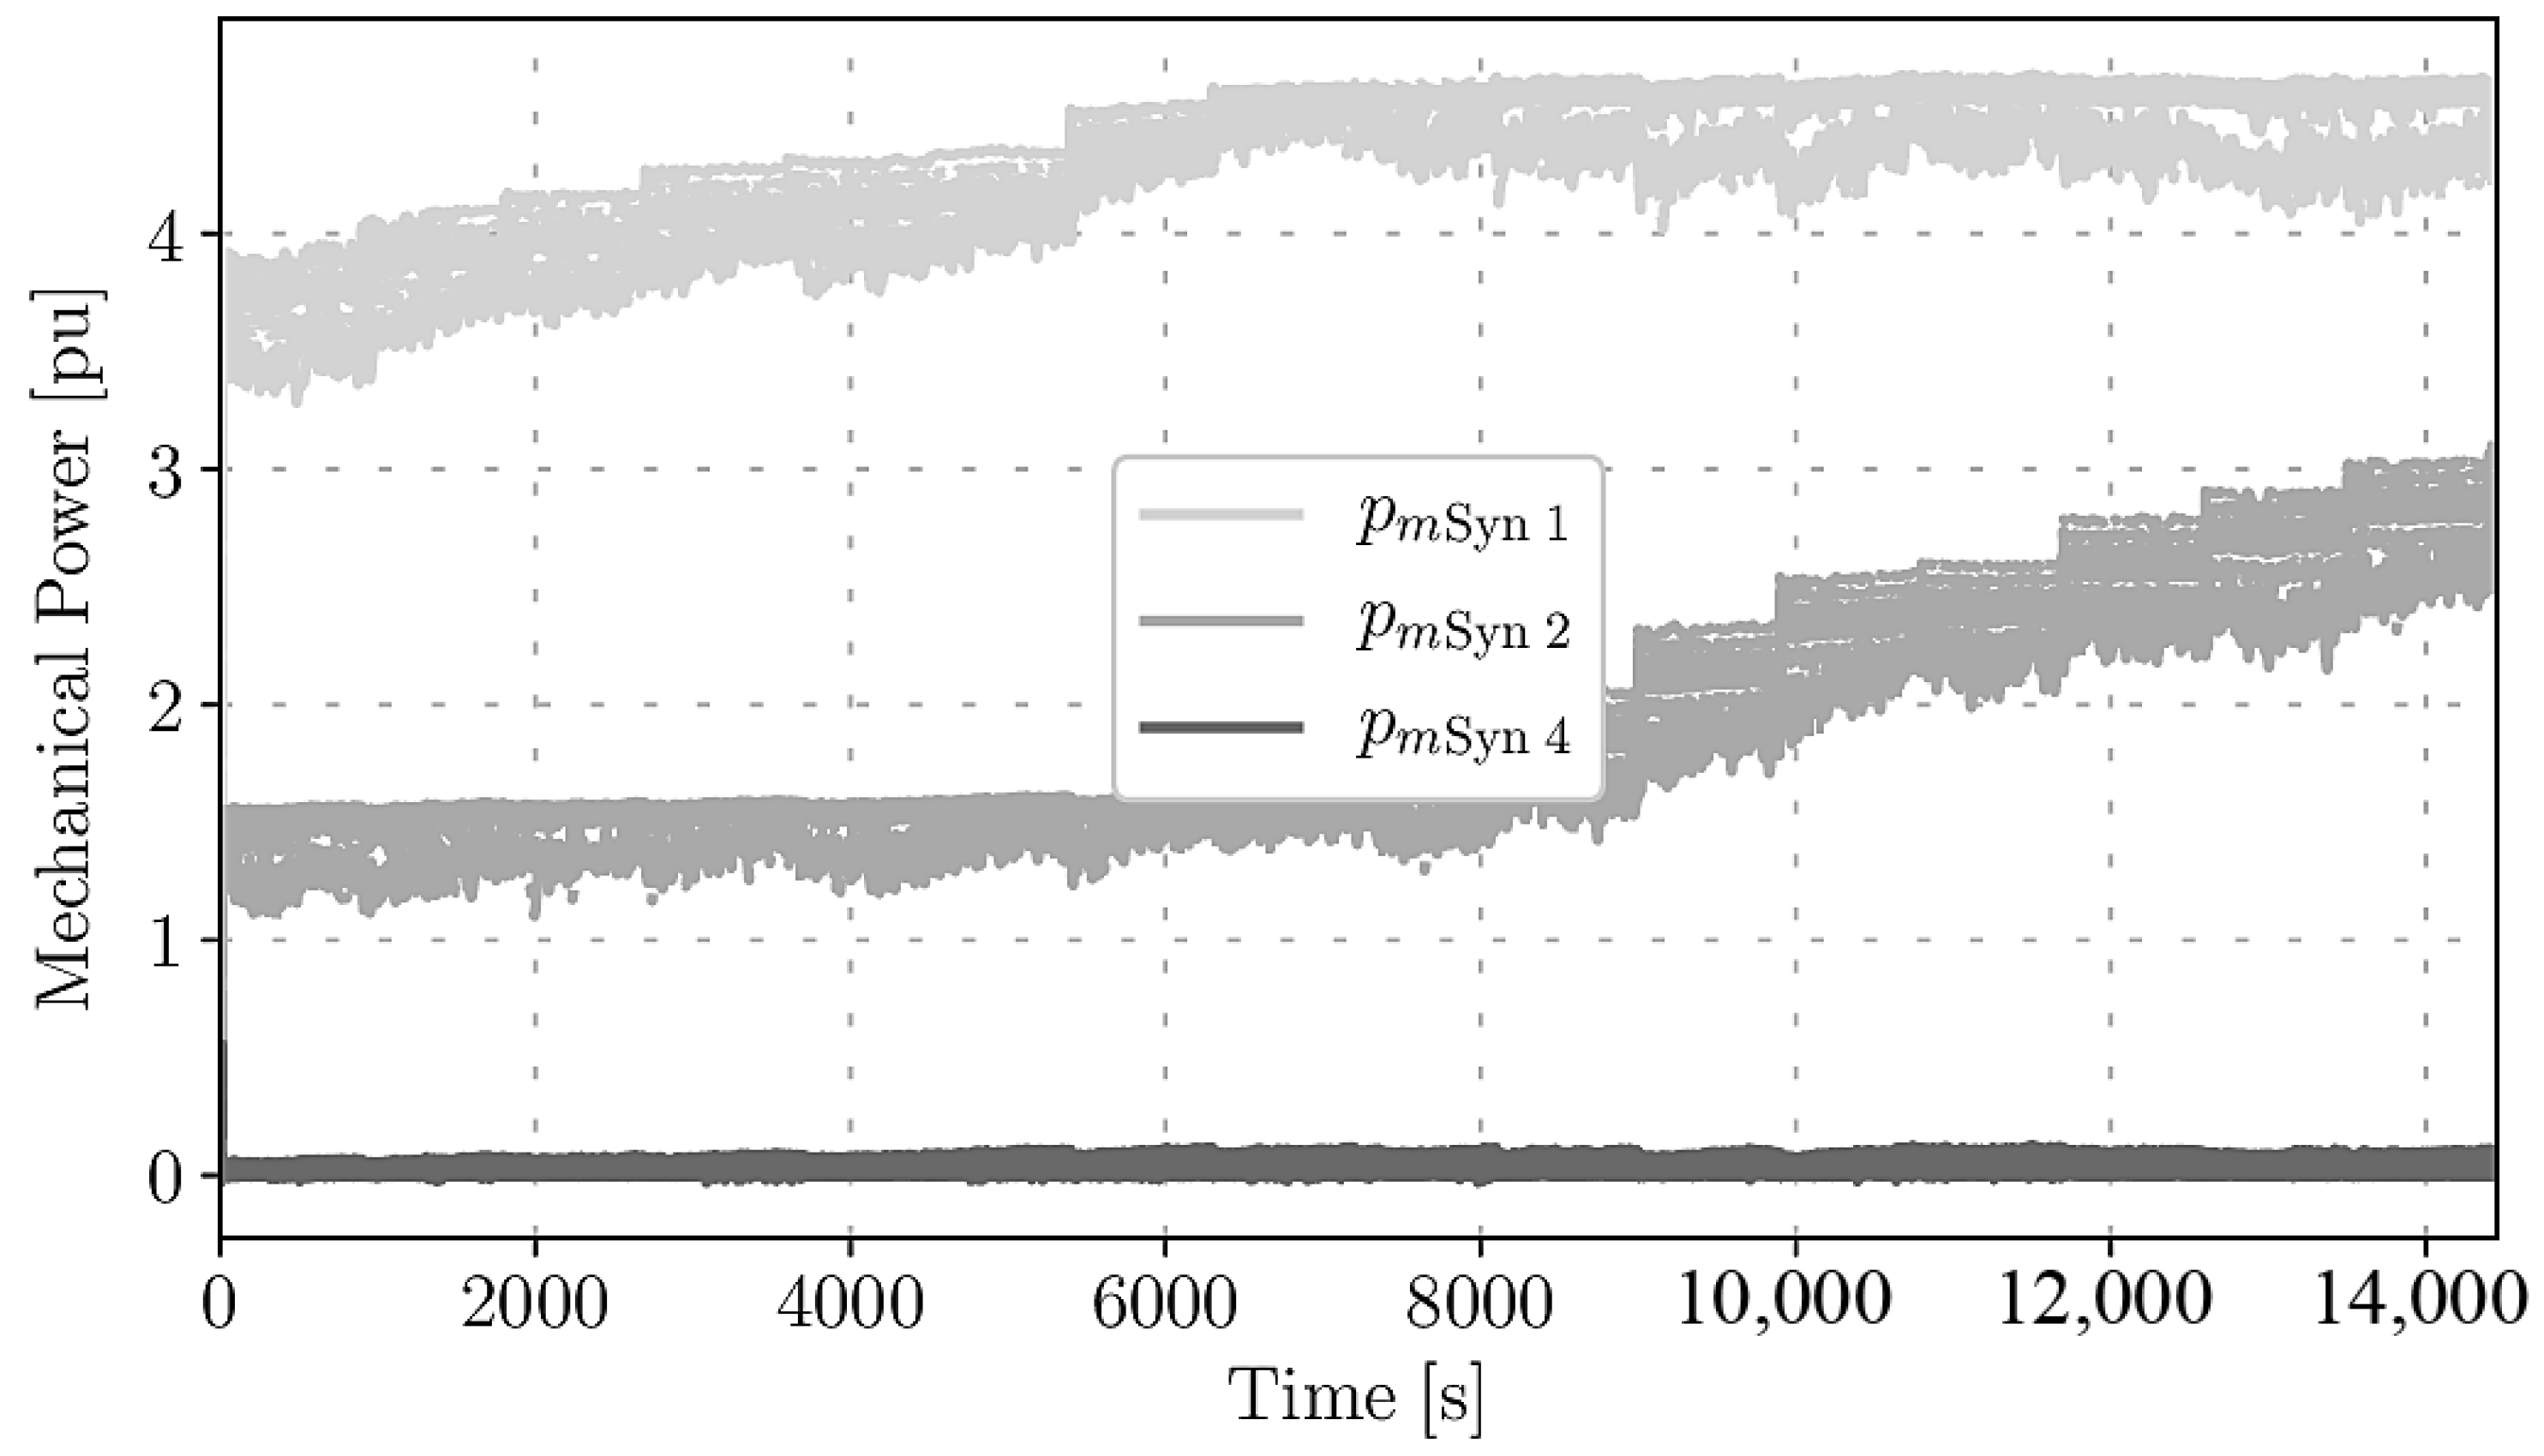
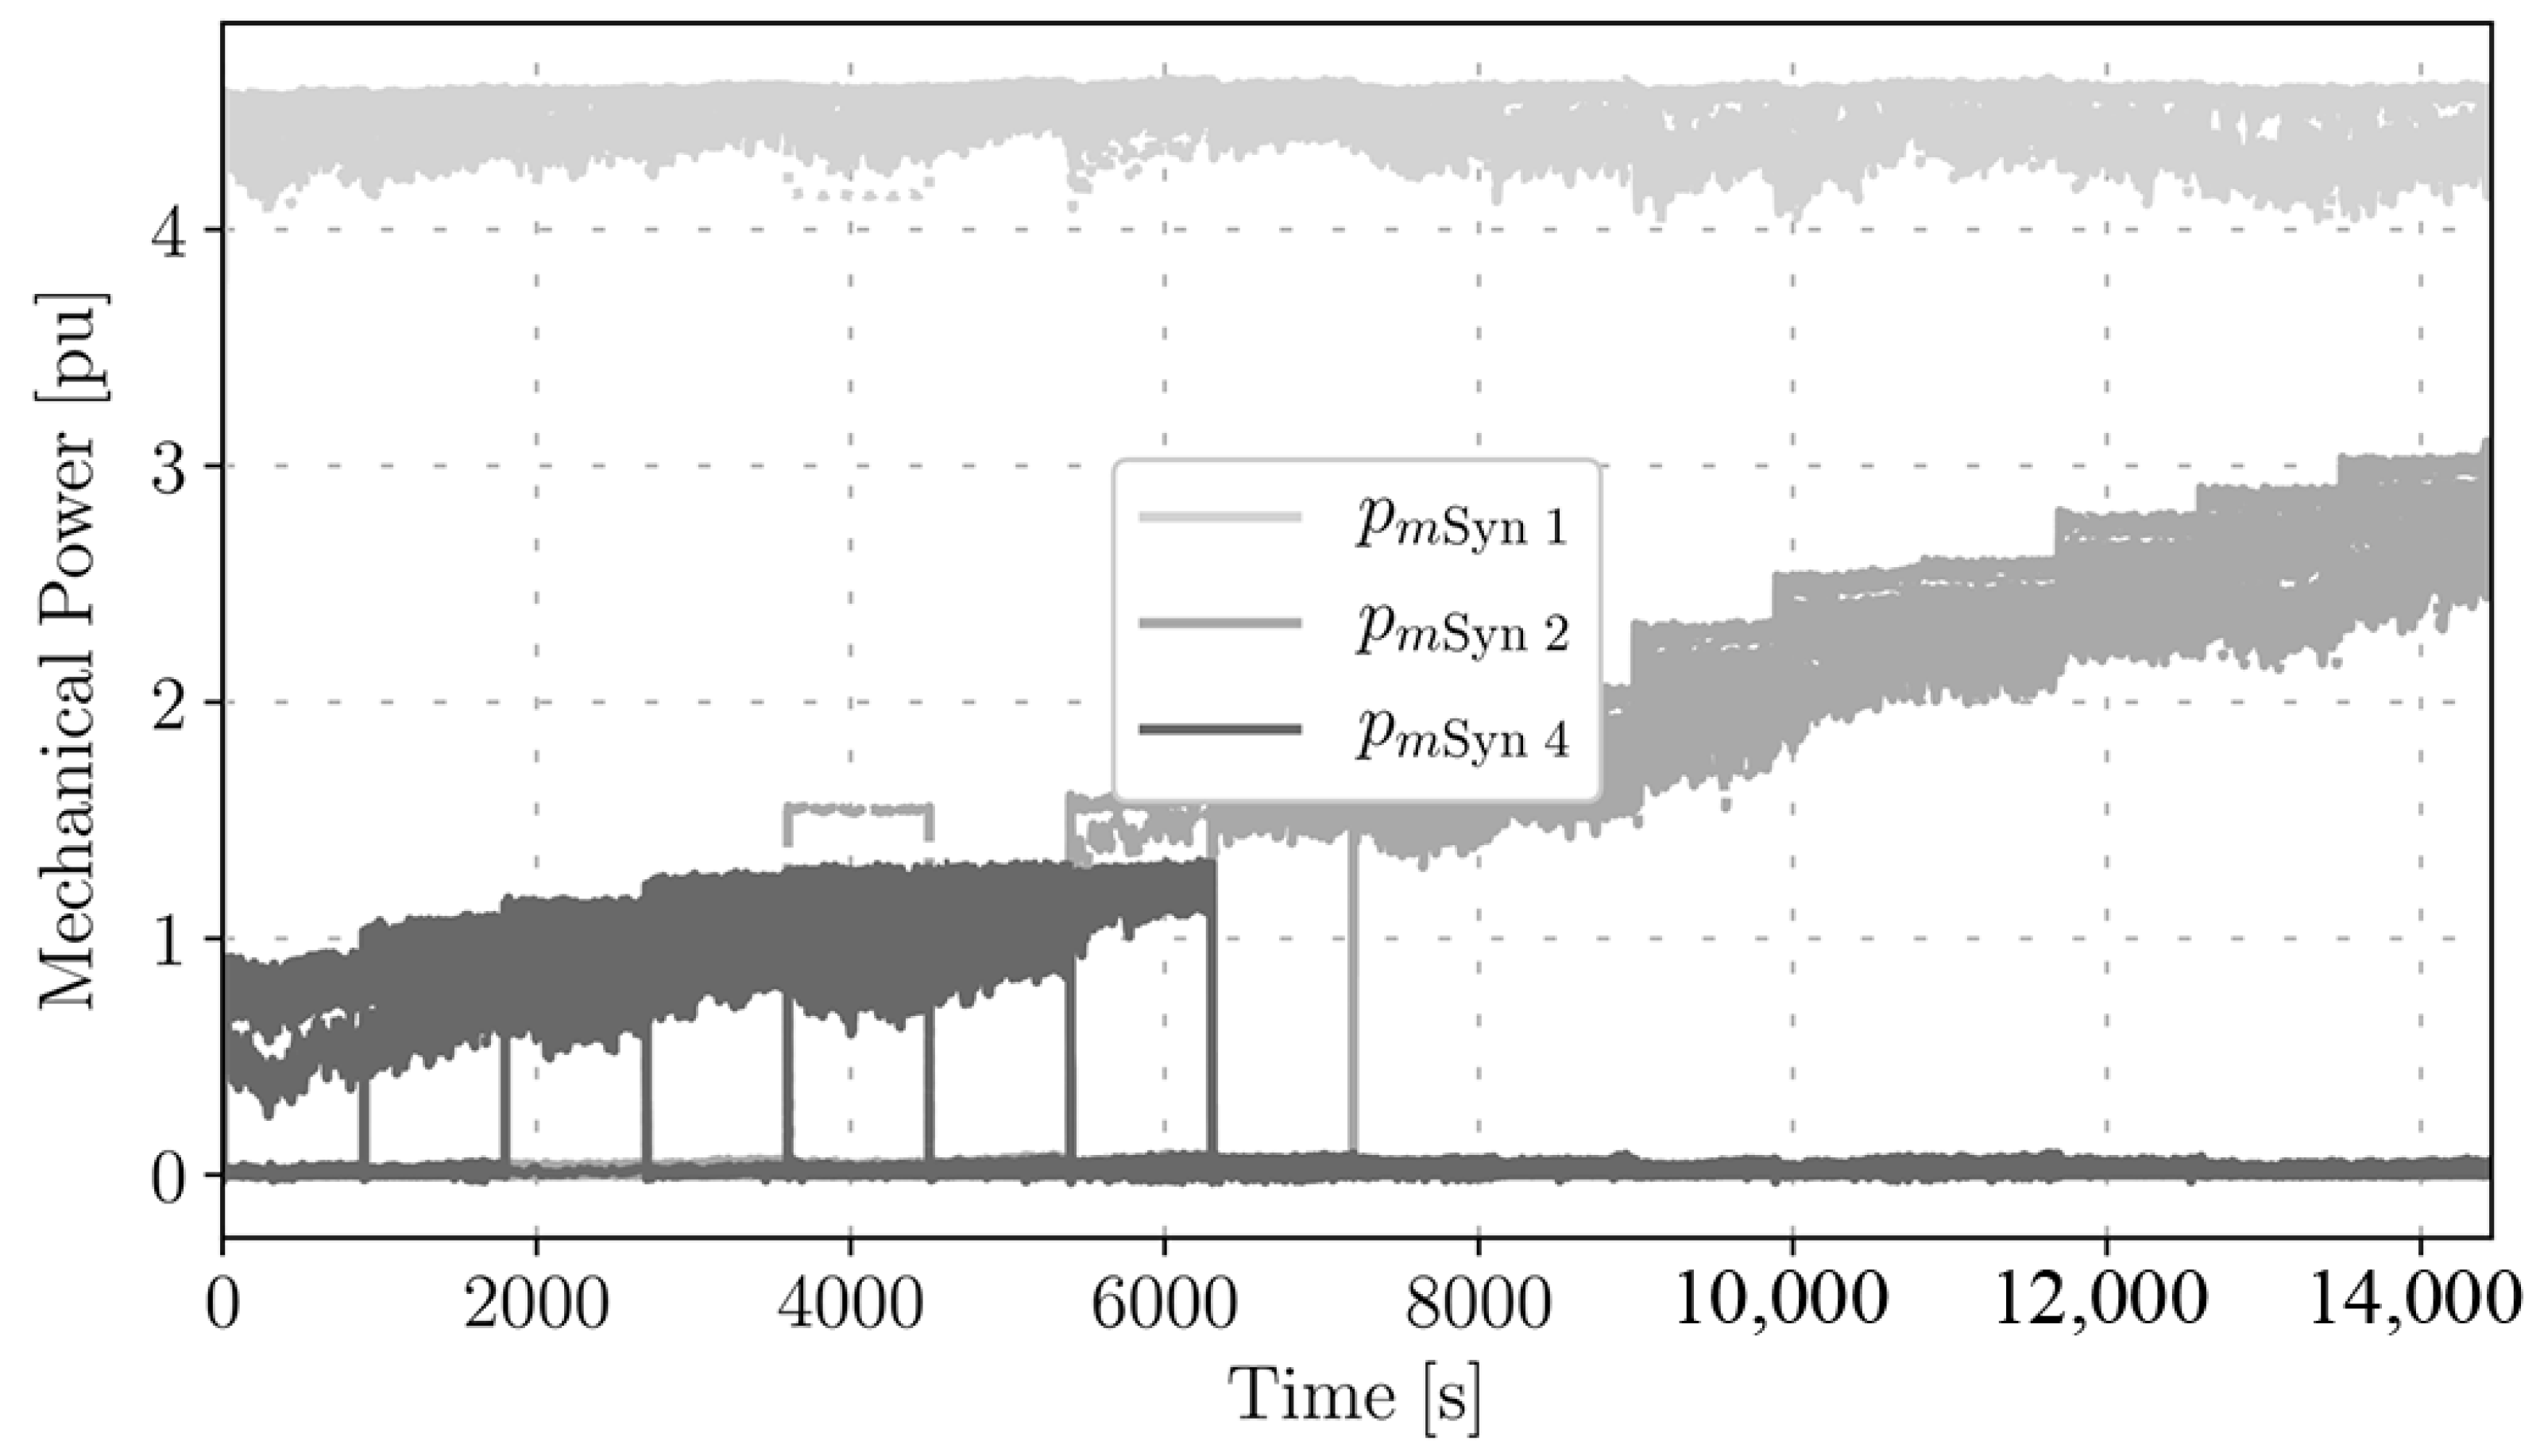
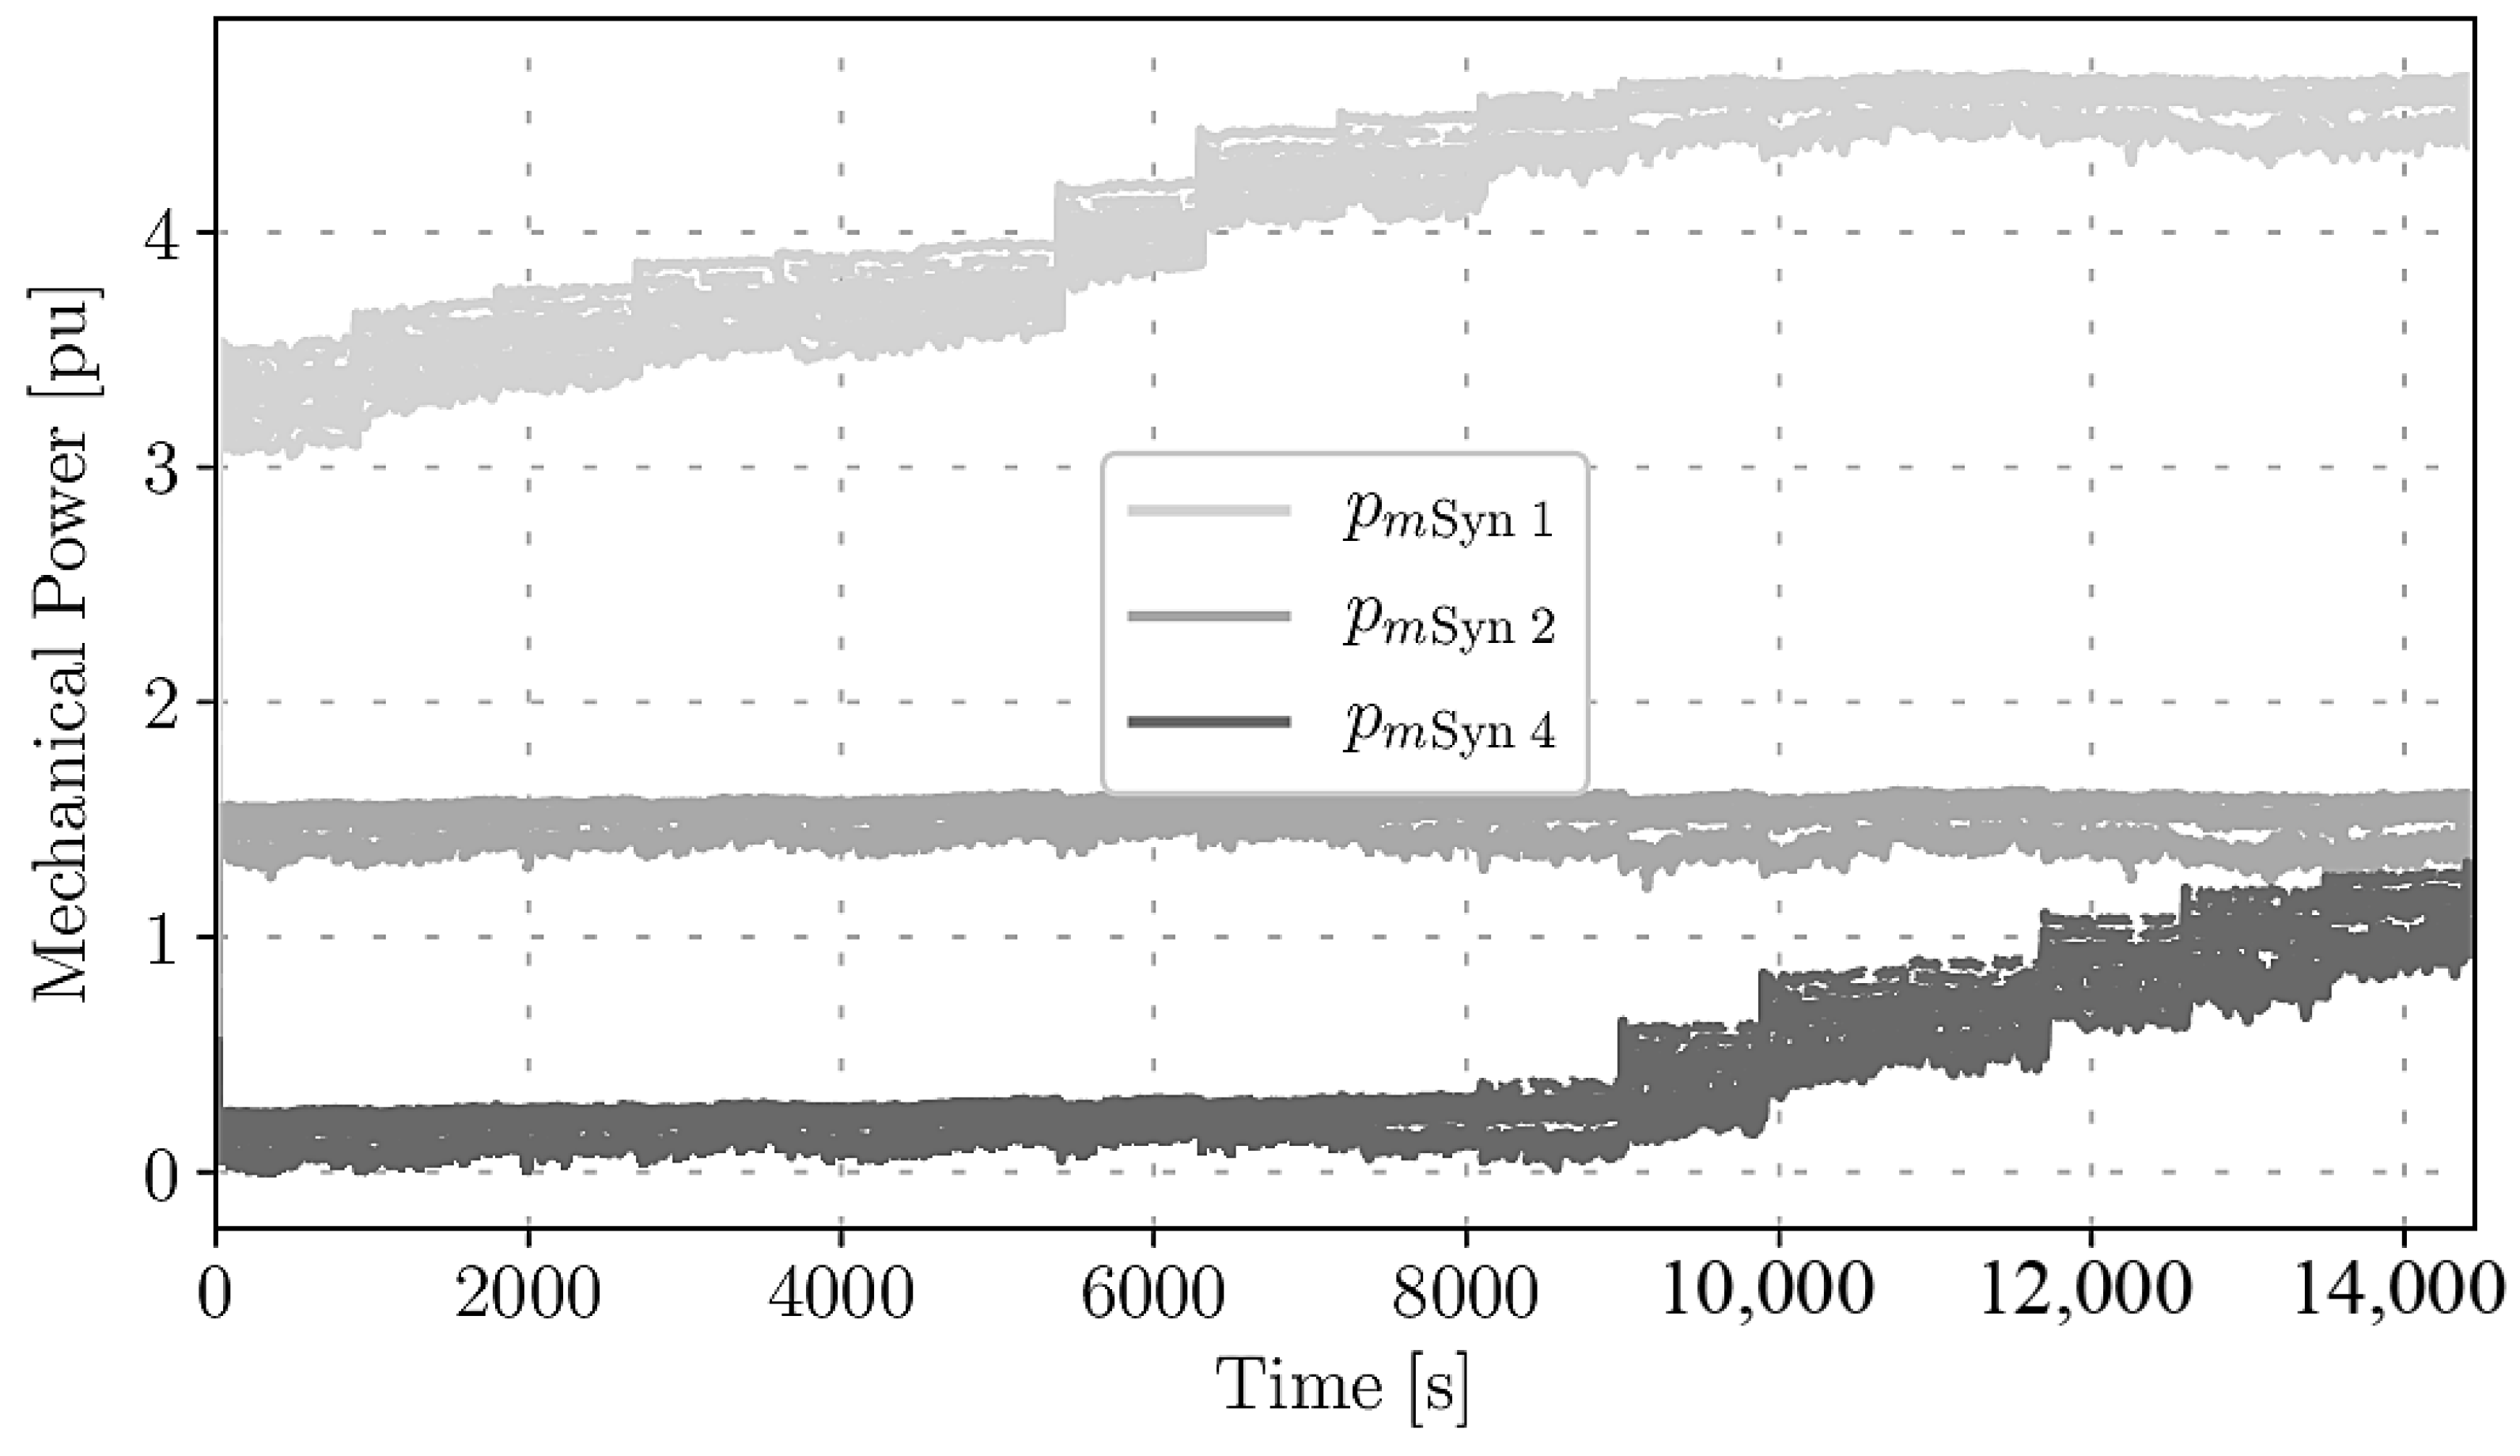
Figure 7 and Figure 8 show the ω COI , of the complete and simplified SUC models, respectively. The two formulations returns an almost identical ω COI , namely σ COI = 0.000800 pu(Hz) for the complete SUC and, while that of the simplified SUC is σ COI = 0.000794 . Specifically, the difference is about 1 % . Figure 9 and Figure 10 show the mechanical power of the conventional synchronous generators 1, 2 and 4, of the complete and simplified SUC model, respectively. The two models produce similar schedules. In fact, at the beginning of the planning horizon, the simplified SUC model alternates the schedules for generators 2 and 4, and after some time (i.e., after 6000 s) it produces the same schedules as the complete SUC model. It appears, thus, that for this particular system and for normal operation conditions, the differences between using a complete SUC model and a simplified one are negligible. These results suggest thus that an involved UC formulation is not necessarily the best in normal operating conditions of the system.
Next, we compare the impact on system dynamics of the problem (6)–(24) (complete SUC) and the problem (30)–(39) (alternative SUC) described in Section 2.6. With this aim, a MC-TDS per each SUC formulation is carried out.
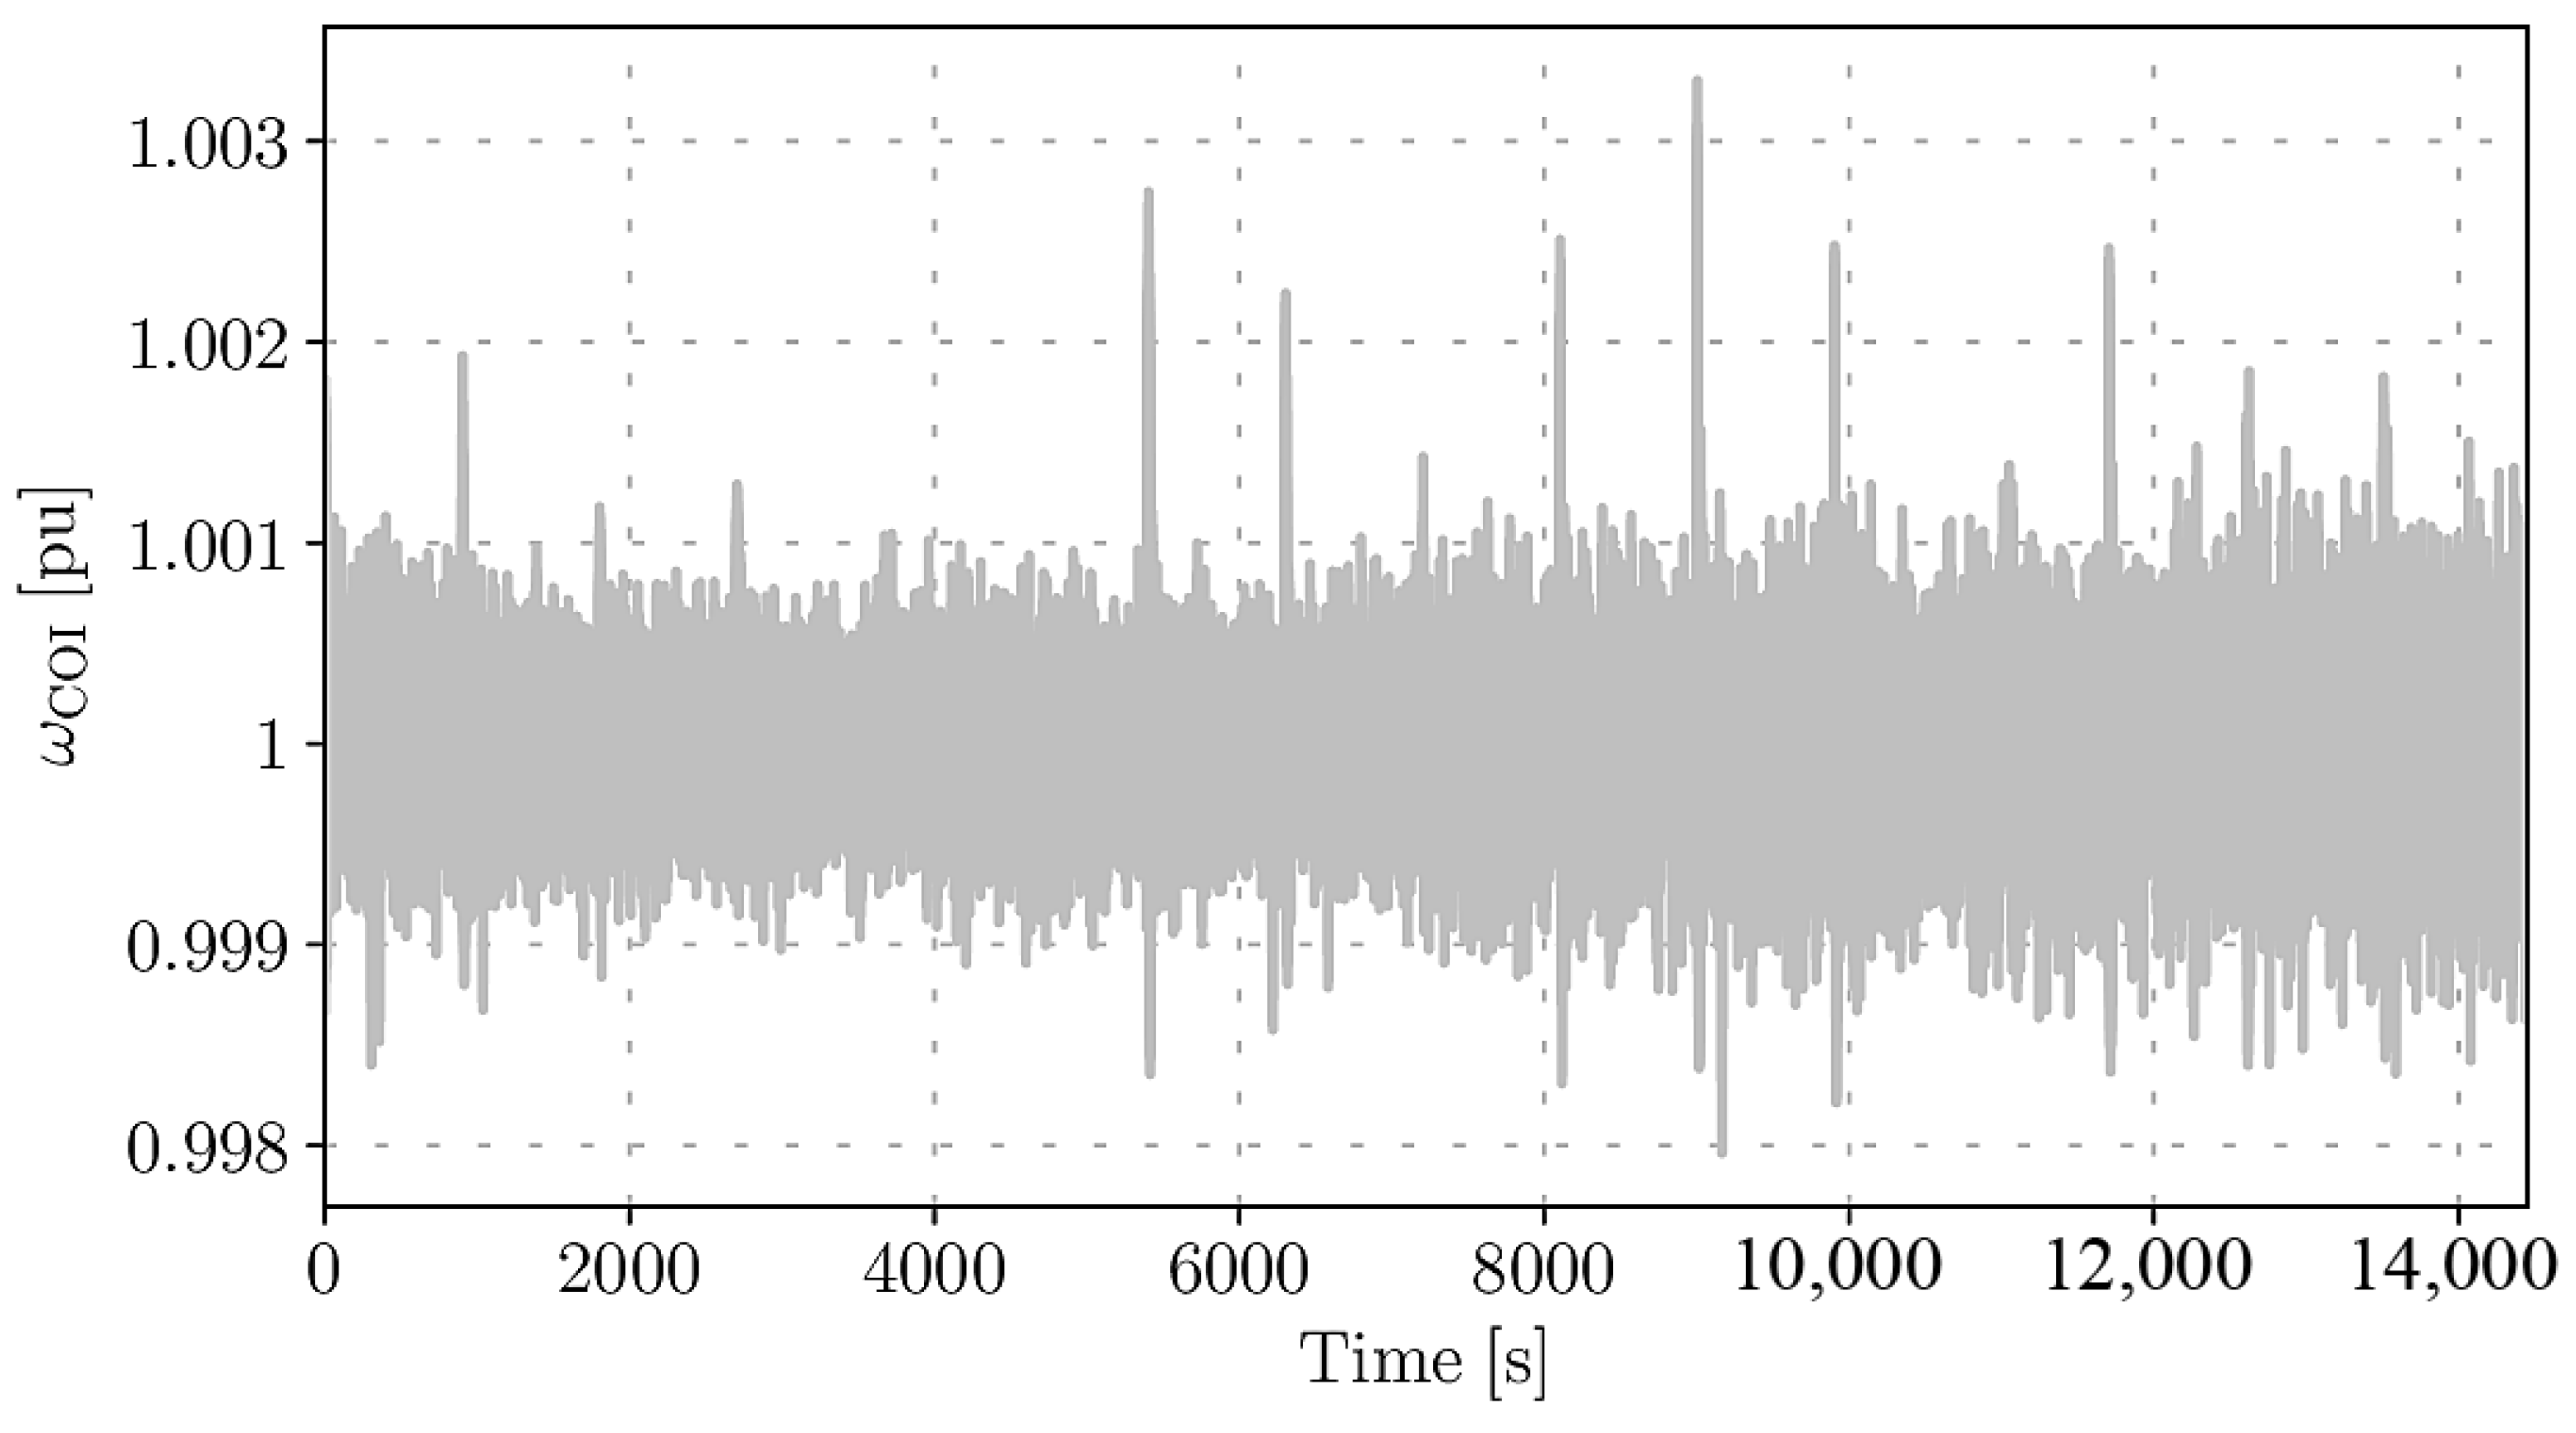
Figure 11 shows ω COI for the alternative SUC model. Compared to the complete SUC model (see Figure 7), the alternative formulation leads to lower frequency variations, i.e., σ COI = 0.000390 . In other words, the differences between the models is about 48 % . This is due to fact that the two SUC formulations produce slightly different schedule for generators. Specifically, the alternative SUC model schedules a few more generators (Figure 12) compared to the complete SUC model (Figure 9). This, in turn, implies more regulation, which helps better manage wind uncertainty. This can be observed in Figure 11 where, in the time between two scheduling events—i.e., 15 min—frequency variations are lower due to the increased frequency regulation available in the system.
This result had to be expected. From the dynamic point of view, in fact, it is better to schedule more conventional synchronous generators, which provide both primary and secondary frequency regulations, rather than wind generation.

4. Conclusions

In this paper we have performed a thorough sensitivity analysis in order to assess the impact on long-term power system dynamics of different frequency control/machine parameters and different subhourly SUC formulations.
Simulation results show that the gain of the AGC is the main parameter impacting the long-term frequency deviation. On the other hand, synchronous machine inertia has a small effect on the standard deviation of the frequency. Moreover, results suggest that the difference on the dynamic behaviour of the power system are marginal when using a complete or a simplified SUC model. Furthermore, a SUC leads to lower variations of the frequency compared to a DUC.
An interesting result is also that different formulations of the SUC problem can lead to schedule conventional power plants in different locations and/or number. These differences can have a significant impact on long-term power system dynamics and hence the formulation of the SUC has to be carefully chosen.
Regarding future work, we will consider closing the loop of the proposed cosimulation framework, i.e. using relevant output of SDAEs for adjustment of SUC, and perform a similar sensitivity analysis in order to illustrate the effectiveness and impact on electricity market of such a feedback.

Author Contributions

All authors equally contributed to this work. All authors have read and agreed to the published version of the manuscript.

Funding

This work was supported by Science Foundation Ireland, by funding T. Kërçi and F. Milano under project ESIPP, Grant No. SFI/15/SPP/E3125; and F. Milano under project AMPSAS, Grant No. SFI/15/IA/3074.

Conflicts of Interest

The authors declare no conflict of interest.

References

  1. ENTSO-E. Continental Europe Significant Frequency Deviations January 2019. Available online: https://www.entsoe.eu (accessed on 17 February 2020).
  2. Kundur, P.; Paserba, J.; Ajjarapu, V.; Andersson, G.; Bose, A.; Cañizares, C.; Hatziargyriou, N.; Hill, D.; Stankovic, A.; Taylor, C.; et al. Definition and classification of power system stability IEEE/CIGRE joint task force on stability terms and definitions. IEEE Trans. Power Syst. 2004, 19, 1387–1401. [Google Scholar]
  3. Kërçi, T.; Milano, F. A framework to embed the unit commitment problem into time domain simulations. In Proceedings of the 2019 IEEE International Conference on Environment and Electrical Engineering, Genova, Italy, 11–14 June 2019. [Google Scholar]
  4. Vorobev, P.; Greenwood, D.M.; Bell, J.H.; Bialek, J.W.; Taylor, P.C.; Turitsyn, K. Deadbands, droop, and inertia impact on power system frequency distribution. IEEE Trans. Power Syst. 2019, 34, 3098–3108. [Google Scholar] [CrossRef] [Green Version]
  5. Wang, J.; Wang, J.; Liu, C.; Ruiz, J.P. Stochastic unit commitment with sub-hourly dispatch constraints. Appl. Energy 2013, 105, 418–422. [Google Scholar] [CrossRef]
  6. Gangammanavar, H.; Sen, S.; Zavala, V.M. Stochastic optimization of sub-hourly economic dispatch with wind energy. IEEE Trans. Power Syst. 2016, 31, 949–959. [Google Scholar] [CrossRef]
  7. Wang, B.; Hobbs, B.F. Real-time markets for flexiramp: A stochastic unit commitment-based analysis. IEEE Trans. Power Syst. 2016, 31, 846–860. [Google Scholar] [CrossRef]
  8. Gu, Y.; Xie, L. Stochastic look-ahead economic dispatch with variable generation resources. IEEE Trans. Power Syst. 2017, 32, 17–29. [Google Scholar] [CrossRef]
  9. Milano, F.; Dörfler, F.; Hug, G.; Hill, D.J.; Verbič, G. Foundations and challenges of low-inertia systems (invited paper). In Proceedings of the 2018 Power Systems Computation Conference (PSCC), Dublin, Ireland, 11–15 June 2018. [Google Scholar]
  10. Ahmadi, H.; Ghasemi, H. Security-Constrained Unit Commitment With Linearized System Frequency Limit Constraints. IEEE Trans. Power Syst. 2014, 29, 1536–1545. [Google Scholar] [CrossRef]
  11. Singh Parmar, K.P.; Majhi, S.; Kothari, D.P. Load frequency control of a realistic power system with multi-source power generation. Int. J. Electr. Power Energy Syst. 2012, 42, 426–433. [Google Scholar] [CrossRef]
  12. Kërçi, T.; Milano, F. Sensitivity Analysis of the Interaction between Power System Dynamics and Unit Commitment. In Proceedings of the 2019 IEEE Milan PowerTech, Milan, Italy, 23–27 June 2019. [Google Scholar]
  13. Kërçi, T.; Giraldo, J.; Milano, F. Analysis of the impact of sub-hourly unit commitment on power system dynamics. Int. J. Electr. Power Energy Syst. 2020, 119, 105819. [Google Scholar] [CrossRef]
  14. Yuan, B.; Zhou, M.; Li, G.; Zhang, X. Stochastic Small-Signal Stability of Power Systems With Wind Power Generation. IEEE Trans. Power Syst. 2015, 30, 1680–1689. [Google Scholar] [CrossRef]
  15. Wang, X.; Chiang, H.; Wang, J.; Liu, H.; Wang, T. Long-Term Stability Analysis of Power Systems With Wind Power Based on Stochastic Differential Equations: Model Development and Foundations. IEEE Trans. Power Syst. 2015, 30, 1534–1542. [Google Scholar] [CrossRef] [Green Version]
  16. Milano, F.; Zárate-Miñano, R. A Systematic Method to Model Power Systems as Stochastic Differential Algebraic Equations. IEEE Trans. Power Syst. 2013, 28, 4537–4544. [Google Scholar] [CrossRef]
  17. Kundur, P. Power System Stability and Control; McGraw-Hill: New York, NY, USA, 1994. [Google Scholar]
  18. Milano, F. Power System Modeling and Scripting; Springer: London, UK, 2010. [Google Scholar]
  19. IEA-WIND. Design and Operation of Power Systems with Large Amounts of Wind Power. Available online: https://community.ieawind.org (accessed on 17 February 2020).
  20. Morales, J.; Conejo, A.; Madsen, H.; Pinson, P.; Zugno, M. Integrating Renewables in Electricity Markets: Operational Problems; Springer: Berlin, Germany, 2013. [Google Scholar]
  21. Conejo, A.; Carrión, M.; Morales, J. Decision Making Under Uncertainty in Electricity Markets; Springer: Berlin, Germany, 2010. [Google Scholar]
  22. Blanco, I.; Morales, J.M. An Efficient Robust Solution to the Two-Stage Stochastic Unit Commitment Problem. IEEE Trans. Power Syst. 2017, 32, 4477–4488. [Google Scholar] [CrossRef] [Green Version]
  23. Håberg, M. Fundamentals and recent developments in stochastic unit commitment. Int. J. Electr. Power Energy Syst. 2019, 109, 38–48. [Google Scholar] [CrossRef]
  24. Zheng, Q.P.; Wang, J.; Liu, A.L. Stochastic Optimization for Unit Commitment—A Review. IEEE Trans. Power Syst. 2015, 30, 1913–1924. [Google Scholar] [CrossRef]
  25. Gómez Expósito, A.; Conejo, A.; Cañizares, C. Electric Energy Systems: Analysis and Operation; CRC Press: Boca Raton, FL, USA, 2018. [Google Scholar]
  26. Palensky, P.; Van Der Meer, A.A.; Lopez, C.D.; Joseph, A.; Pan, K. Cosimulation of Intelligent Power Systems: Fundamentals, Software Architecture, Numerics, and Coupling. IEEE Ind. Electron. Mag. 2017, 11, 34–50. [Google Scholar] [CrossRef]
  27. Milano, F. A Python-based software tool for power system analysis. In Proceedings of the IEEE PES General Meeting, Vancouver, BC, Canada, 21–25 July 2013; pp. 1–5. [Google Scholar]
  28. Gurobi Optimization, LLC. Gurobi Optimizer Reference Manual; Gurobi Optimization, LLC: Houston, TX, USA, 2018. [Google Scholar]
  29. Illinois Center for a Smarter Electric Grid (ICSEG). IEEE 39-Bus System. Available online: https://icseg.iti.illinois.edu/ieee-39-bus-system/ (accessed on 17 February 2020).
  30. Carrión, M.; Arroyo, J.M. A computationally efficient mixed-integer linear formulation for the thermal unit commitment problem. IEEE Trans. Power Syst. 2006, 21, 1371–1378. [Google Scholar] [CrossRef]
  31. Costley, M.; Feizollahi, M.J.; Ahmed, S.; Grijalva, S. A rolling-horizon unit commitment framework with flexible periodicity. Int. J. Electr. Power Energy Syst. 2017, 90, 280–291. [Google Scholar] [CrossRef]
Figure 1. Standard turbine governor control scheme.
Energies 13 01468 g001
Figure 2. Simple automatic generation control (AGC) control scheme.
Energies 13 01468 g002
Figure 3. Structure of the interaction between the discrete model of the stochastic unit commitment (SUC) and dynamic model of SDAEs.
Energies 13 01468 g003
Figure 4. 15-min time period— σ COI as a function of different frequency controllers/machine parameters using the complete SUC and DUC models.
Energies 13 01468 g004
Figure 5. 15-min time period— σ COI as a function of different frequency controllers/machine parameters using the simplified and alternative SUC models.
Energies 13 01468 g005
Figure 6. 5-min time period— σ COI as a function of different frequency controllers/machine parameters.
Energies 13 01468 g006
Figure 7. Trajectories of ω COI for 15-min time period and complete SUC.
Energies 13 01468 g007
Figure 8. Trajectories of ω COI for 15-min time period and simplified SUC.
Energies 13 01468 g008
Figure 9. Mechanical power of synchronous generators 1, 2 and 4, for 15-min time period and complete SUC model.
Energies 13 01468 g009
Figure 10. Mechanical power of synchronous generators 1, 2 and 4, for 15-min time period and simplified SUC model.
Energies 13 01468 g010
Figure 11. Trajectories of ω COI for 15-min time period and alternative SUC model.
Energies 13 01468 g011
Figure 12. Mechanical power synchronous generators 1, 2 and 4, for 15-min time period and alternative SUC model.
Energies 13 01468 g012
Table 1. 15-min time period—total operating costs for different UC models.
ModelTotal Operation Cost ($)
SUC (Complete)412,000
SUC (Simplified)398,000
SUC (Alternative)339,470
DUC411,580