Article

Impact of Boundary Conditions on the Performance Enhancement of Advanced Control Strategies for a Residential Building with a Heat Pump and PV System with Energy Storage

1
Energy Technology, Dalarna University, 78170 Borlänge, Sweden
2
Department of Engineering Sciences, Uppsala University, 751 21 Uppsala, Sweden
*
Author to whom correspondence should be addressed.
Energies 2020, 13(6), 1413; https://doi.org/10.3390/en13061413
Submission received: 13 February 2020 / Revised: 6 March 2020 / Accepted: 10 March 2020 / Published: 18 March 2020

Abstract

:
Operational control strategies for the heating system of a single-family house with exhaust air heat pump and photovoltaic system and “smart” utilization of energy storage have been developed and evaluated in a simulation study. The main aim and novelty of this study is to evaluate the impact on the benefit of these advanced control strategies in terms of performance (energy use and economic) for a wide range of boundary conditions (country/climate, occupancy and appliance loads). Short-term weather data and historic price data for the same year as well as stochastic occupancy profiles that include the domestic hot water load are used as boundary for a parametric simulation study for the system modeled in detail in TRNSYS 17. Results show that the control using a forecast of dynamic electricity price leads to greater final energy savings than those due to the control using thermal storage for excess PV production in all of the examined locations except Sweden. The impact on self-consumption using thermal storage of heat produced by the heat pump using excess PV production is found to decrease linearly with increasing household electricity for all locations. A reduction in final energy of up to 842 kWh year−1 can be achieved just by the use of these algorithms. The net energy cost for the end-user follows the same trend as for final energy and can result in cost savings up to 175 € year−1 in Germany and Spain due to the use of the advanced control.

1. Introduction

The European Union (EU) has set specific targets for the share of renewables and for energy efficiency by 2030 [1]. One goal is that the share of renewable electricity in the European power system should increase by 57%. According to the latest report in 2016 for the 28 EU members [2], the demand for heating (SH) and hot water accounts for 79% of the final energy consumed by households, while 26% of all electricity is delivered for the aforementioned demand. Heat pump (HP) systems can contribute to energy efficiency and reduce greenhouse gas emissions. In the EU, heat pump sales show that during the last 4 years, there has been an annual market growth of more than 10% [3], and this growth is leading to an accelerated contribution to reducing CO2 emissions.

1.1. Previous Work

In recent years, there has been a growing interest in optimally combining heat pumps with photovoltaic systems for single- and multi-family houses. One objective, at a system level, is to increase the renewable share of the heating system by means of increasing the self-consumption (SC) of electricity produced by photovoltaics (PV), and by reducing the final energy (FE) purchased from the grid. Moreover, another objective is to reduce the net cost of the final energy using smart control based on forecasts of dynamic electricity price and short-time horizon weather data. In a larger context, at the grid level, the main objective is to match the electricity load of the heating system with the electricity production from renewable sources in order to limit power exchange and reduce the stress to the grid.
A number of studies have been conducted in order to propose technical solutions about how to utilize the renewable electricity production in a smart way and how to control the heating or cooling demand. Psimopoulos et al. [4] developed predictive rule-based controls for smart utilization of thermal and electrical storages and analyzed the results for a case study in Sweden. Arteconi et al. [5] utilized the thermal energy storage (TES) of hot water tank, in particular, with heating distribution systems that have a low thermal inertia as radiators, and implemented demand response algorithms based on real-time electricity prices to improve the system operation. However, despite their achievements in load curtailment, higher use of energy and accordingly higher cost of electricity resulted. Thur et al. [6] showed the potential of overheating control using the thermal mass of the building with radiant floor heating together with storage tanks of various sizes. This study demonstrated a great increase in self-consumption and solar-fraction (SF) of the system, which leads to lower costs of electricity, particularly when feed-in tariffs are low. A few other studies included operational strategies based on the dynamic electricity price and TES with rule-based control, such as Dar et al. [7], which found that the price-based control and the self-consumption control exhibit completely opposite behavior to each other. Schibuola et al. [8] showed that with the real-time pricing control of heat pumps, cost savings of up to 30% and self-consumption increases of up to 22% for imported electricity are possible. Alimohammadisagvand et al. [9] aimed to increase self-consumption and decrease the impact on the grid, and their findings show that, accordingly, the final energy can be reduced up to 10% and the cost of the heating system up to 15%. Studies with more sophisticated model predictive control (MPC) and with greater computational complexity can be found. For example, Fischer et al. [10] showed that MPC approaches result in greater cost savings than rule-based ones. Similarly, Beck et al. [11] examined possible future scenarios in regulatory boundary conditions (such as electricity price variations) and the impact on the optimal storage size between thermal and electrical. Some studies utilize electrical storage and dynamic price of electricity such as Rodríguez et al. [12], which evaluated the increase in temperature band up to ±1 °C to achieve around 12% of cost savings while savings up to 25% were effected by using the setpoint scenario of 20 ± 2 °C. Salpakari and Lund [13] proposed cost optimal control using hourly electricity prices, which can achieve cost savings between 13% and 25%. Schopher et al. [14] conducted a sensitivity analysis to assess the impact of heterogeneity on realistic/measured load data and optimal system configuration. It was found that the profitability of PV systems with electrical storage varies greatly for both current and future cost scenarios.
While most of these studies focused on system improvements under certain boundary conditions, only a few conducted sensitivity analysis for some of the variables, e.g., component sizes, building types and insulation standards, load profiles, and electricity price variations. Furthermore, due to the importance of climatic conditions on the performance of the systems and controls, some of the other studies also considered climate variations. For instance, Quoilin et al. [15] studied the self-consumption and self-sufficiency potential rates for PV systems with and without electrical storage for various household profiles and for three EU climates. Fredrizzi et al. [16] simulated PV and solar thermal and heat pump systems for single-family houses for a range of climates and building insulation standards, albeit without any advanced controls. Bee et al. [17] investigated the performance of an air source heat pump with a photovoltaic system for nine European climates with and without electrical storage and with different water storage sizes for the annual heating and cooling demand. In addition, the study here was conducted for default heat pump control.
Felten and Weber [18] reviewed several control strategies for an air to water HP and identified, in detail, system configuration similarities and assumptions between studies. One of the conclusions is that the boundary conditions are quite diverse among the existing literature.
The literature survey shows a great potential for application of HP with PV and storages combined with different control strategies. However, there is still a gap in research for more comprehensive studies that analyze the developed system and control not only in the reference conditions but also in a broader range of boundary conditions. As the market for heat pumps is international and growing, it is both practically and scientifically important to fill this gap and show whether the benefits of a compact exhaust air heat pump system with advanced control strategies can be internationally applicable. Therefore, this study makes a systematic evaluation of the impact on the benefit of using advanced control algorithms for a broad range of boundary conditions as well as PV system sizes, using the rule-based and predictive rule-based control algorithms. Climate, occupancy, lighting and appliance use, hot water usage as well as indoor set temperature are the boundary conditions that are varied in this study. To be as close to practice as possible, a catalogue single-family house is chosen. This is a typical newly built Scandinavian building with a low temperature floor heating, supplied by a compact exhaust air heat pump system together with a PV system. The insulation standard is varied in countries to be consistent with the building regulations in that country. Additionally, the algorithms that have been developed are rule-based and designed to be easily integrated and with no additional cost into modern heat pump controllers that already have internet connectivity. These algorithms aim to maximize PV self-consumption and minimize final energy (FE), and include detailed control of the backup electric heater as well as speed control of the heat pump compressor.
PV micro producers in Europe have the option of choosing between different tariff schemes, the most common of which is an annual fixed price and, secondly, a monthly price that is seasonally dependent on the expected demand and the resources for electricity production. A dynamic electricity tariff (spot market price) is currently accessible to a relatively small segment of end-users but has a growing interest and can be derived from the exchange electricity markets which cover a multinational area, such as [19,20]. Although this is not available for owners of single-family houses in all countries, this study evaluates the benefits assuming it is available and used in all locations. According to [21], in order to accelerate the deployment of small-scale distributed PV systems, such distributed energy resources should be permitted to participate in established markets, for example, wholesale electricity markets, ancillary service markets, as well as in capacity markets. This way, market price signals can become accessible to distributed energy resources.
For this purpose, a detailed model of a detached house with the exhaust air heat pump system as well as a usual grid-connected rooftop PV system are modeled and simulated in TRNSYS 17 [22]. The heat pump model includes a model of the control of the compressor and auxiliary heater based on a commercially available product on the market. Apart from the basic control of the heat pump two developed control strategies are used. Short-time high-resolution stochastic load profiles for both domestic hot water (DHW) and electricity demand and sub hourly weather data are also used as [23,24] have shown that the use of hourly data causes inaccuracies in determining self-consumption and import/export from/to the grid. In the next section, the models and boundary conditions together with definitions of key figures are described, while the developed control strategies are described in Section 3.

1.2. Aim, Scope and Novelty of the Study

A survey of the literature suggests that there is no previous research with a broader comparative study of how various boundary conditions affect the performance for advanced control of heat pumps coupled with PV systems. Therefore, the main aim and novelty of this study is to evaluate the impact on the benefits of advanced control strategies in terms of performance (energetic and economic) for a wide range of boundary conditions (country/climate, occupancy, space heating setpoint temperature, and household loads).
The scope is for modern single-family houses with exhaust air heat pumps and different climates and conditions in Europe. Despite the fact that Italy and Spain are included, only the heating demand is considered. In addition to space heating, hot water and electricity use of appliances are also considered as they can considerably influence the system performance as well as the key figures that are used in the study. The economic analysis uses spot market prices for the same year as the weather data. In order to avoid influence of temporary and country dependent incentives, the study assumes that there are no financial incentives and that the cost of the bought energy is dependent on the current spot market price, which means that the value of sold electricity is much lower than the cost of bought electricity. Thus, the results are independent of the current financial incentives valid in the six countries, which is one of the aims of the study. In addition, the focus of the paper is on the benefit of adding advanced control and, thus, the financial analysis is limited to studying the change in the net cost of electricity when adding these controls and is not an analysis of the investment of the PV or battery system itself.

2. Methodology

This section provides an overview of the detailed system and building model as well as the control algorithms used in TRNSYS 17. The impact of temperature levels, thermal storage, and interactions between building and heat pump system are all modeled as they are important factors in the study. The boundary conditions used in the study are described in Section 3.3.

2.1. Reference Building Model

The reference building considered for this study is a typical Swedish single-family house (SFH) of one floor with a gabled roof. The house has an overall U-value of 0.2 W m−2 K−1, 143 m2 heated floor area using a radiant floor heating system. A detailed model of the house with six zones (see Figure 1), is developed in the simulation software TRNSYS by Persson and Heier [25]. TRNSYS type 56 is used for the house model. The two main zones (1 and 2, living room and kitchen respectively) have a setpoint temperature of 21 °C [26], which can be adjusted individually upon demand. The bedrooms and utility room (zones 3, 5, and 6) are set at 20 °C while the bathroom is 22 °C. The ventilation rate is 0.052 m3/s and infiltration is 0.033 m3/s. The mechanical ventilation system is comprised of a system of ducts and a fan integrated in the heat pump which delivers the exhaust air from the rooms to the evaporator of the heat pump. Fresh air enters the house through dedicated manually adjusted openings (trickle vents) above the windows due to the lower pressure in the house caused by the exhaust air fan. Internal window shading is applied with an 80% shading factor if the room temperature goes above 23 °C, and the infiltration is increased to above 24 °C to account for the opening of windows.
Internal gains come from the people determined by an occupancy profile, i.e., occupants’ presence and action, and other gains come from electricity use in lighting and appliances where 100% is assumed to be converted to heat. These profiles are produced using a Markov chain model for occupancy and energy use according to Widén et al. [23]. This model includes the DHW demand, the modeling of which has been thoroughly calibrated to comply with Bales et al. [27]. Domestic electricity and DHW loads have a one-minute resolution over the period of one year.

2.2. Compact Heat Pump System

A compact, variable speed, exhaust air heat pump is used in this study that delivers heat either for SH or for DHW. The heat pump is modeled with the type 581 in TNRSYS, which interpolates data in a performance map for the heat pump where the independent variables are inlet air temperature, inlet air flow rate, and compressor speed while the dependent variables are heat rate capacity and compressor power input. Detailed measured data under steady-state conditions for the full range of operation have been obtained from the manufacturer and then been used to make the performance map used by the model. The airflow rate to the exhaust air heat pump is the air exchange rate for the building according to building codes, and the temperature is that of the air in the building. As the heat pump can extract heat down to an outlet air temperature of about 10 °C, frosting of the evaporator can occur. The compressor speed is controlled so that this minimum outlet air temperature is respected, and the impact of defrosting is included in the data of the performance map. The 180 L DHW tank is modeled with the non-standard type 340, whereas the SH is supplied by the heat pump through a 25 L buffer store modeled by type 60. The geometric properties of these are taken from the specifications while the heat losses are calibrated against data from the manufacturer.
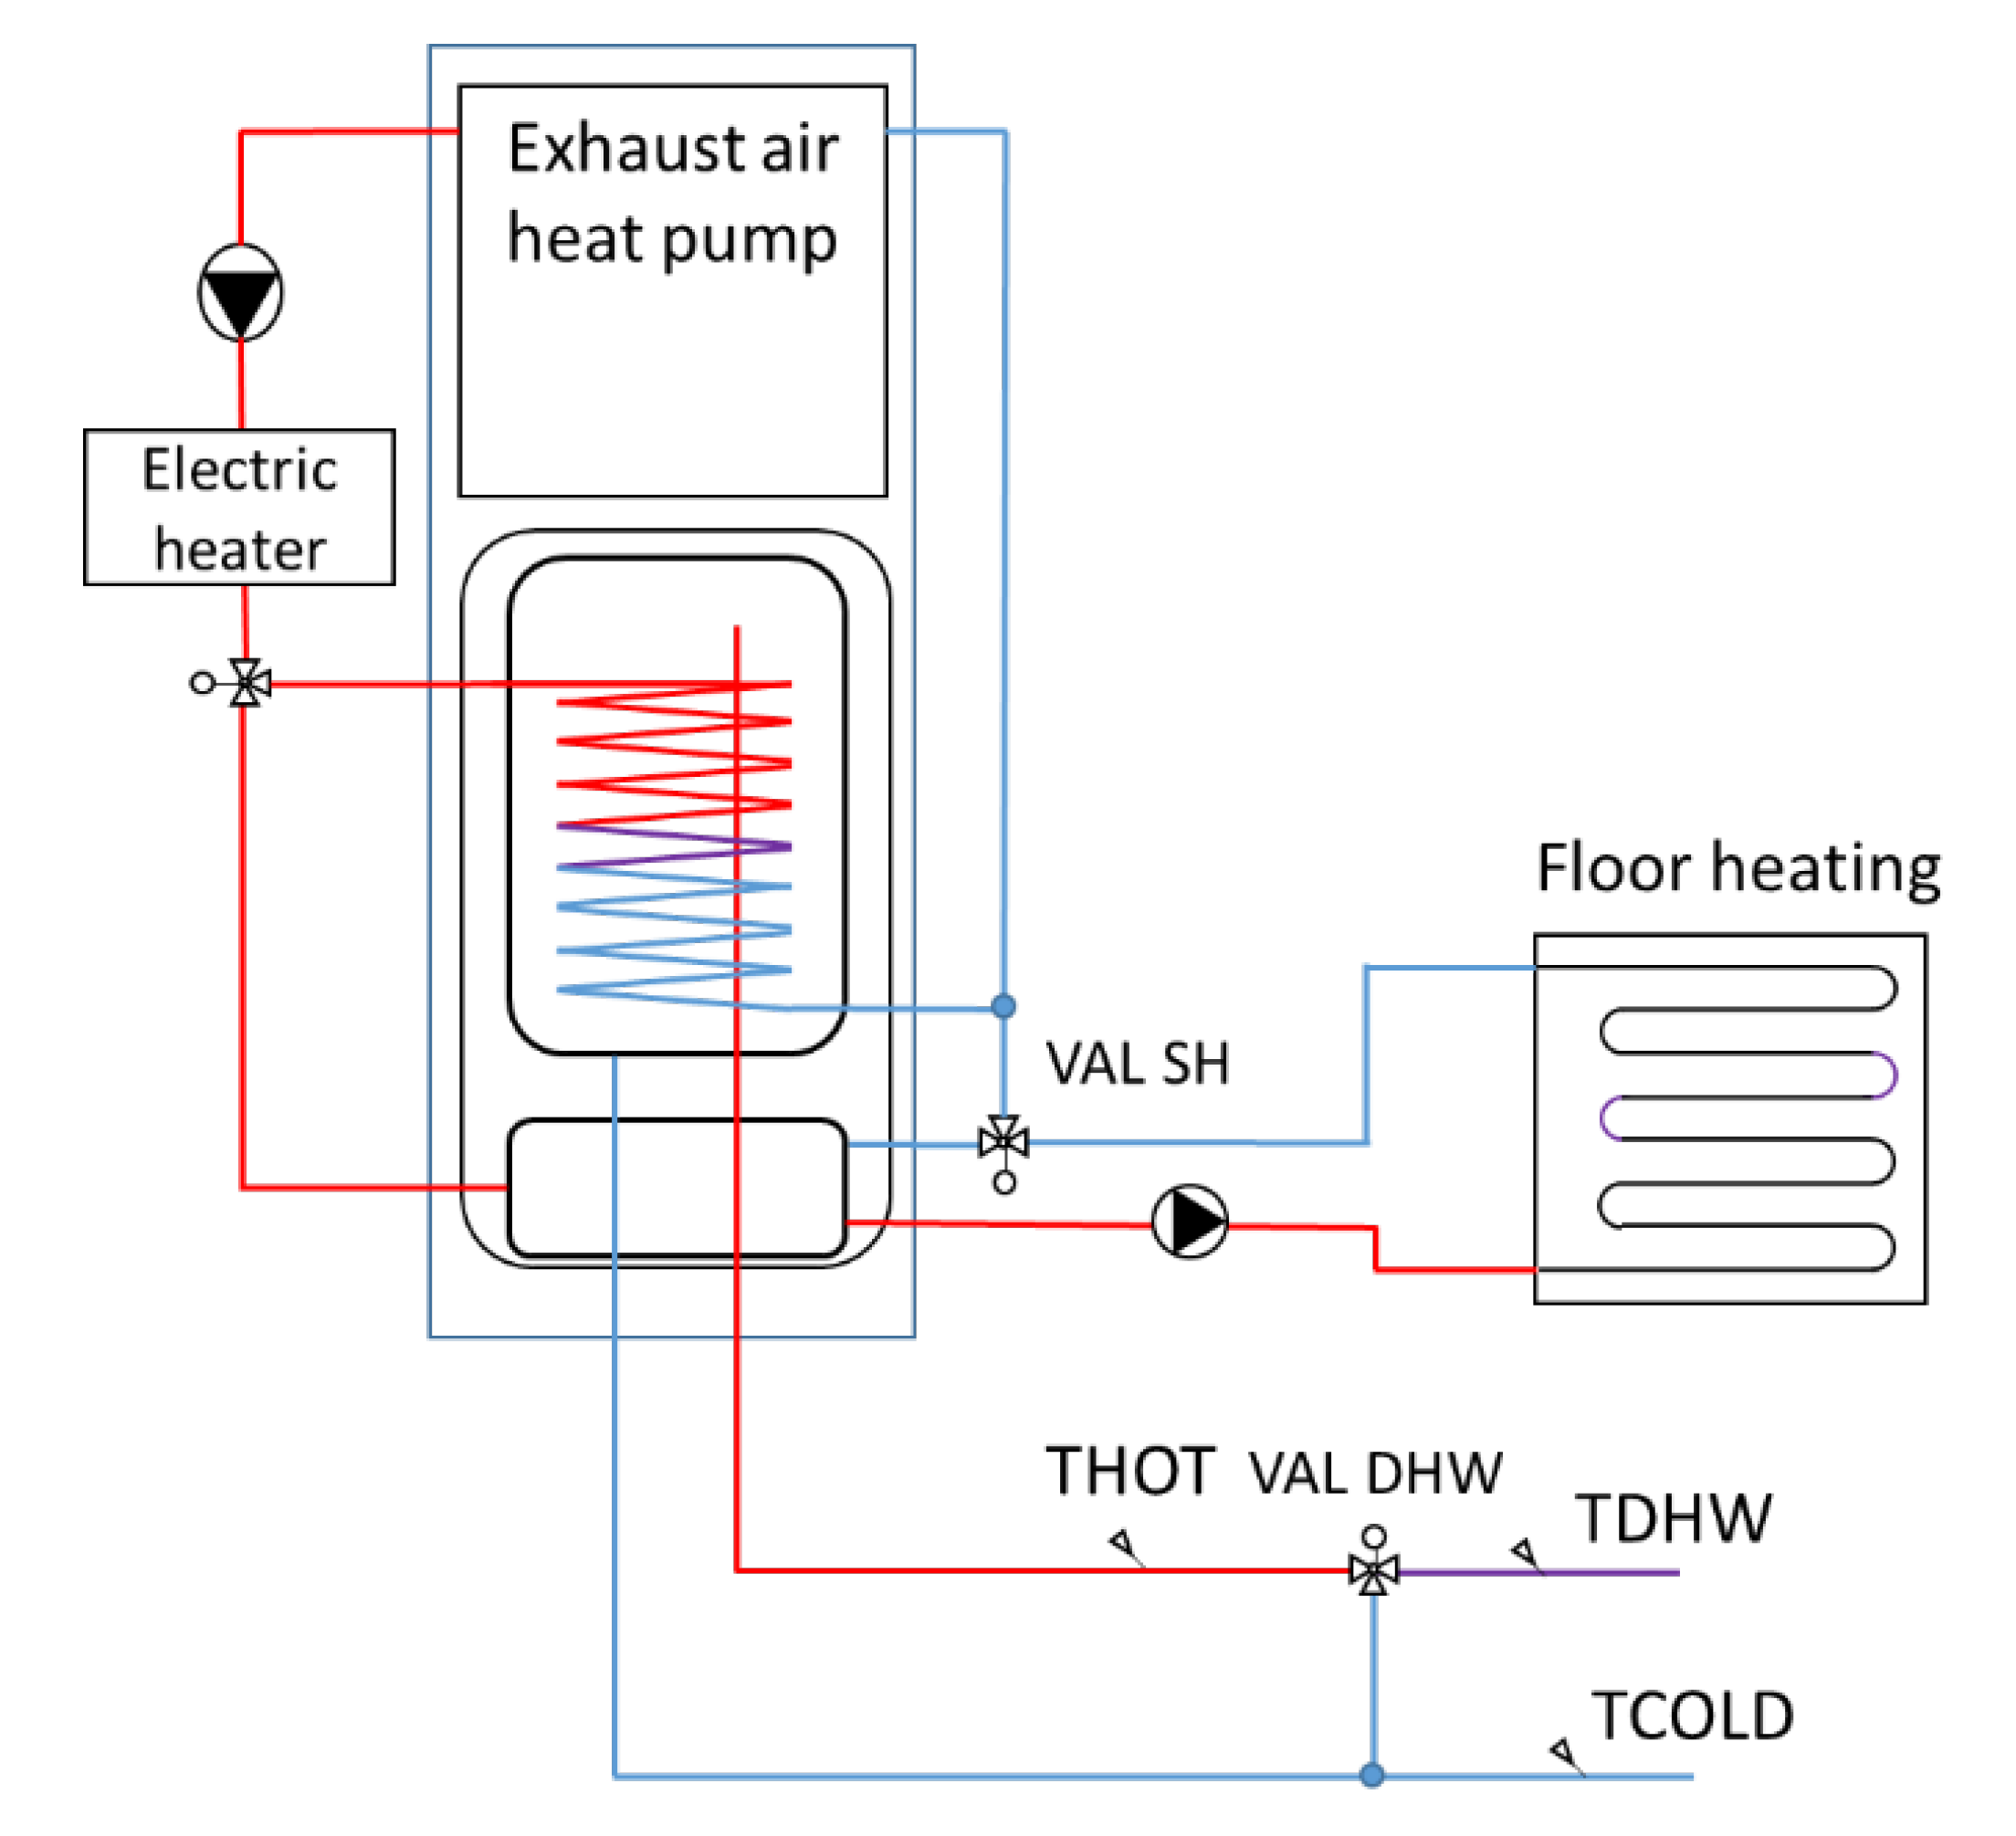
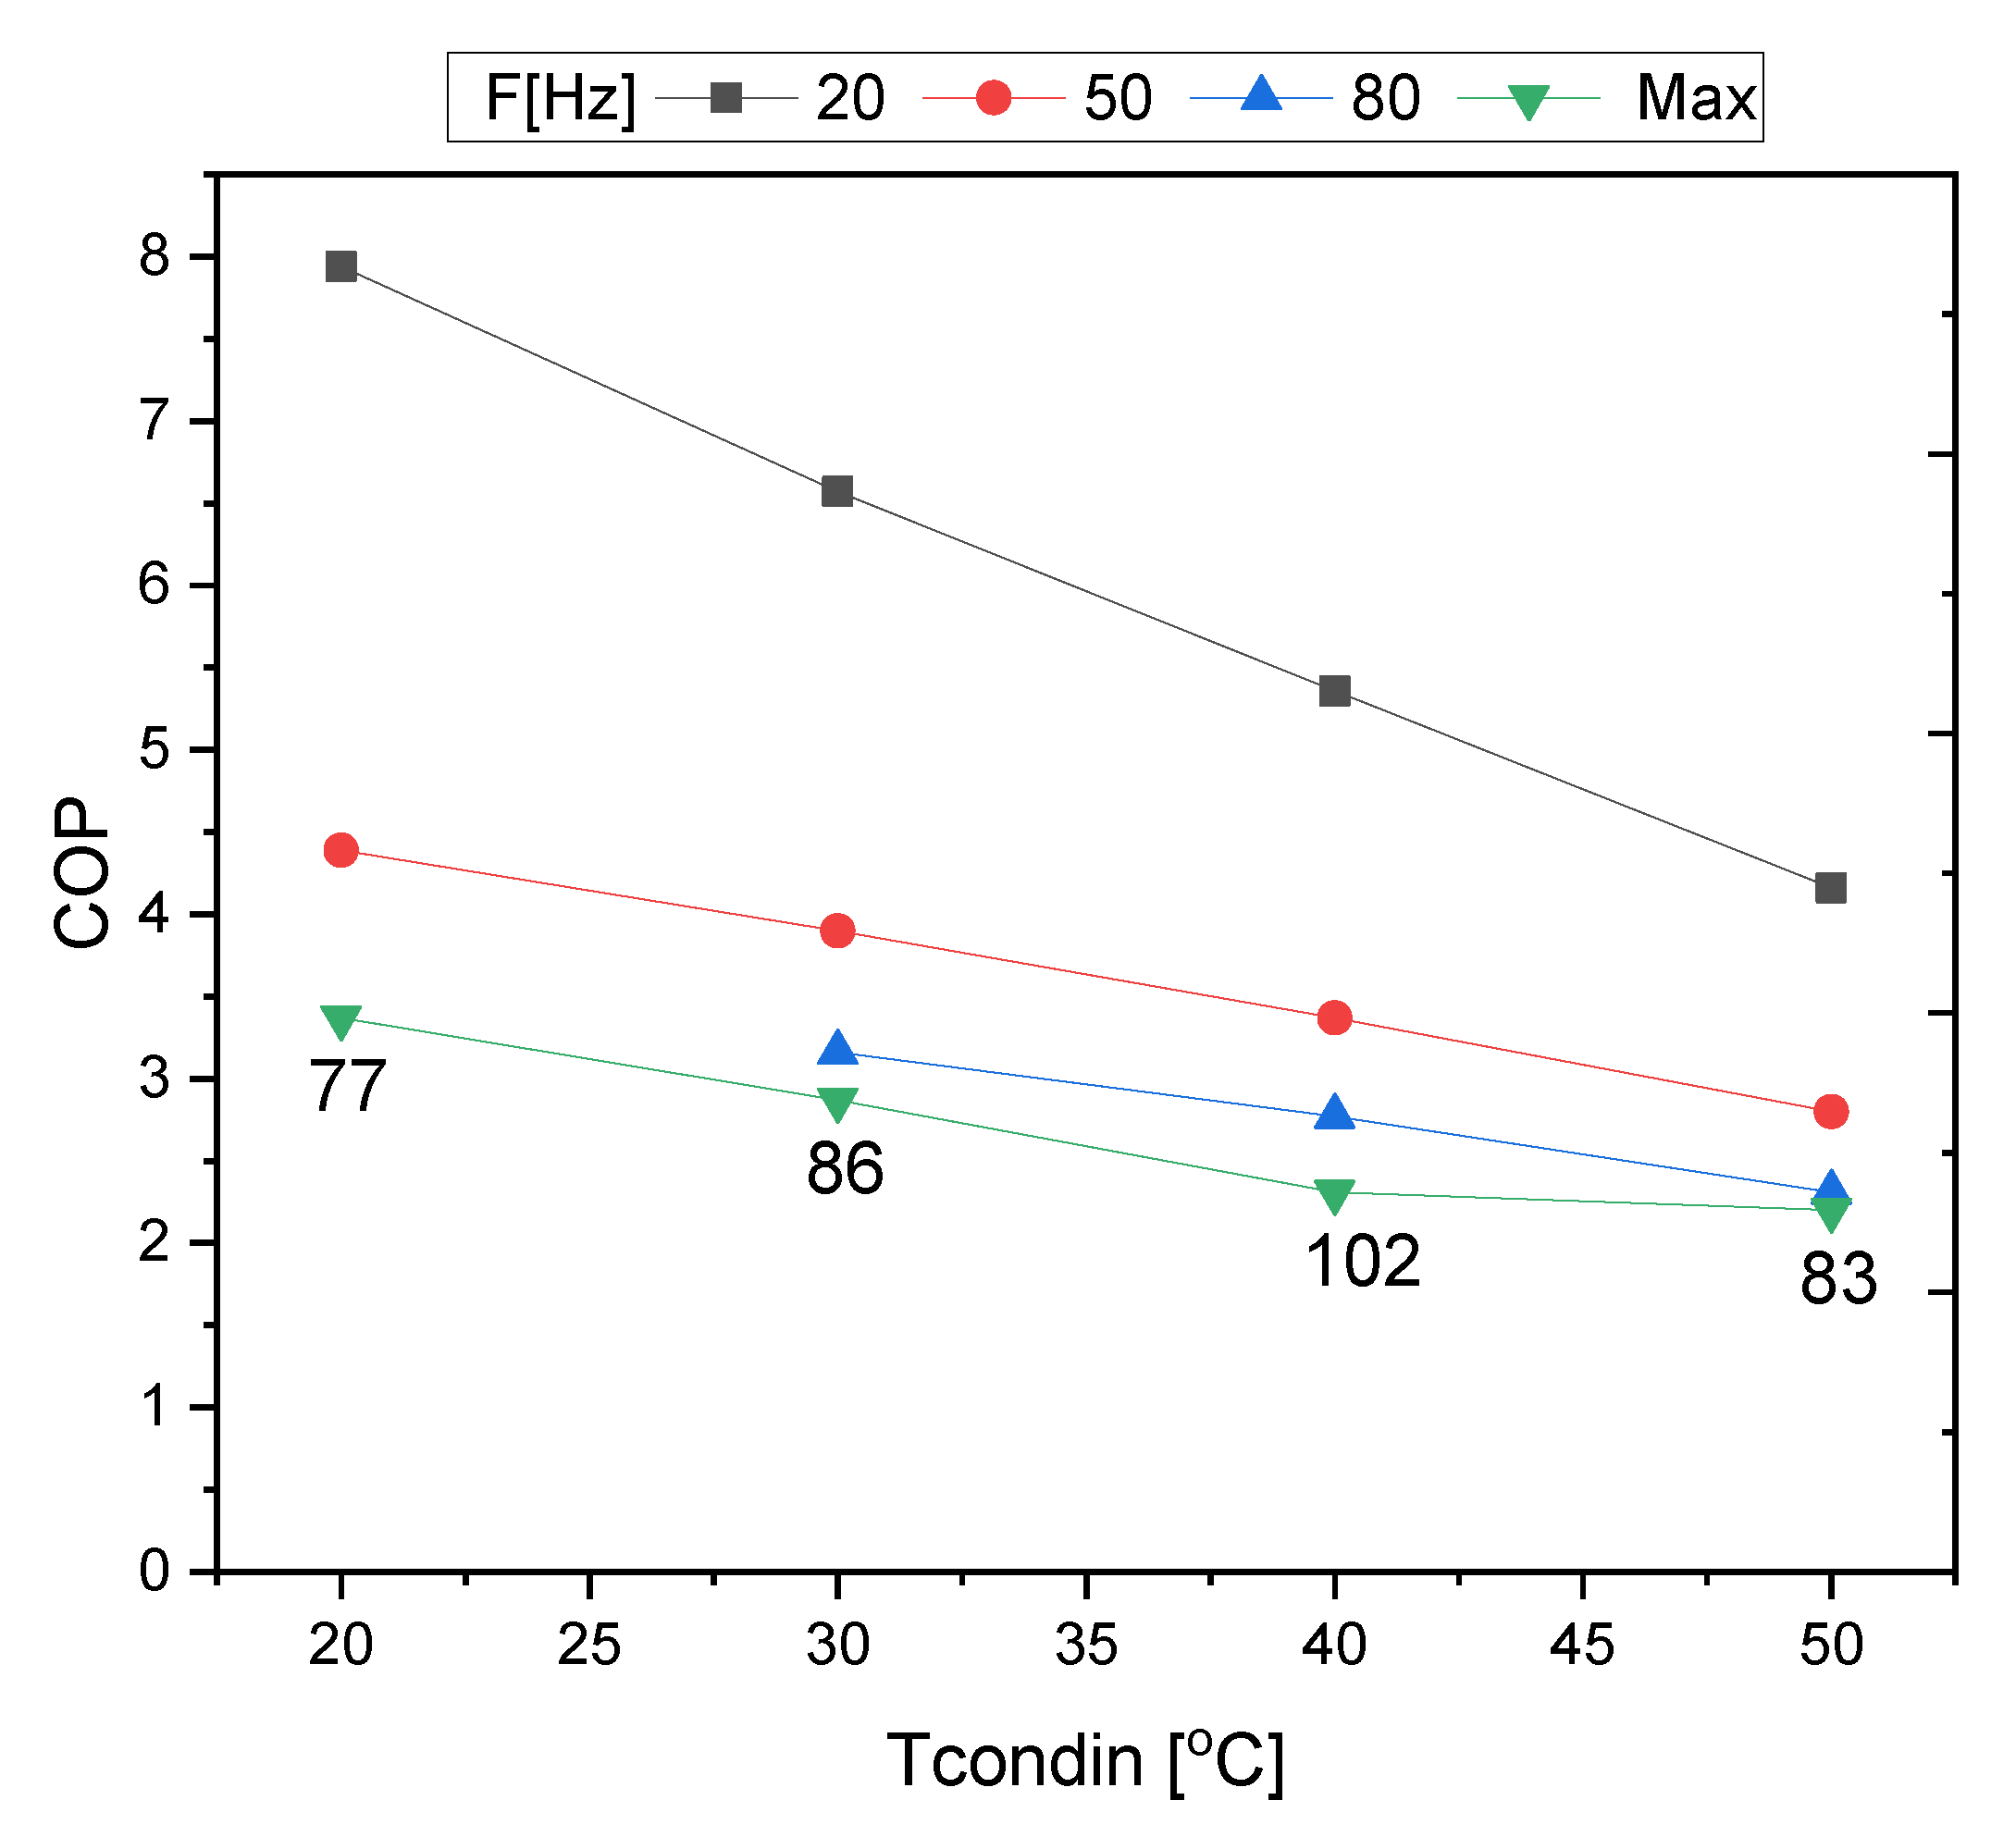
The basic control functions of the heat pump are those of the commercial heat pump. The heat pump in space heating mode is controlled by a heating curve and a compensatory control algorithm dependent on the SH supply temperature. When the thermal power, which is supplied by the heat pump, is not enough to provide the thermal load, an electric auxiliary heater is activated in steps. Each time a threshold of ambient temperature is exceeded, the auxiliary heater is constrained. Moreover, it becomes disabled during the predefined summer period. The values used in this study for the DHW storage, heat pump, and auxiliary heater are shown in Table 1. The models for the heat pump, DHW storage, and internal control algorithms are based on common commercial products on the market. Figure 2 shows the layout of the heating system which provides the SH and DHW load, while Figure 3 shows the plots of the coefficient of performance (COP) versus inlet condenser temperature for a range of compressor speeds (frequency) based on the measurement data. All curves are for an inlet air temperature of 21 °C. The maximum possible compressor speed is limited by the compressor envelope and varies dependent on the operating temperatures. These maximum compressor speeds as well as the COP at these conditions are also shown. The control algorithm in the model limits the compressor speed to these values.

2.3. PV System

In TRNSYS, type 194 mode b is used to model the PV array and the inverter of the grid-connected PV system, considering the inverter European-weighted efficiency [28]. For the parametric study, two array sizes are considered, and the PV inverter size is cascaded with one more unit for the medium-sized system. Details for the tilt angle and the azimuth angle can be found in Table 2.

2.4. Battery Storage

One battery unit of 3.6 kWh is used for the smaller PV size and two units which are cascaded for the medium size. The lithium-ion batteries are modeled with the types 48 and 47 in TRNSYS based on the specification of products available on the market. Type 48 corresponds to the battery management system (BMS) which includes the battery bank with the integrated battery inverter. The BMS is principally modeled as the black box which is connected between the battery bank and the electrical junction box of the building in order to control the charging and discharging of battery storage and the import or export electricity to the grid. Type 47 is used to control the state of charge levels of the battery and corresponds to a simple energy balance of the battery. Detailed charge/discharge characteristics are not considered in this type. Details are shown in Table 2.

2.5. Operational Control Strategies

Except for the conventional default control of the HP system (base case) that is described in Section 2.2, two more advanced strategies, are considered in this study—one rule-based and one predictive rule-based. These controls are based on the study conducted by Psimopoulos et al. [4] and aim to increase self-consumption and to reduce the final energy of the system. Table 3 summarizes the trigger thresholds and setpoints of the default control and control strategies.
In the thermal strategy (TH) the space heating setpoints for the living room and bathroom in the building are raised above their default setpoint values of 21 and 22 °C, respectively, and the DHW tank is heated above its default setpoint of 50 °C. This mode is triggered based on a minimum threshold of the excess PV electricity of 320 W. During overheating, auxiliary electrical heater is turned off, and the compressor speed of the heat pump is varied so that the compressor power roughly matches the available excess PV electricity. Penalty functions are used to assess whether the algorithm leads to significant thermal discomfort and the algorithm is trimmed to avoid this.
In the electrical strategy (EL), the batteries are used solely for storing excess PV electricity when domestic electricity load is met. The battery management system controls the state of charge between 10% and 90%. Whenever there is excess PV, charging will occur, and as the load exceeds the PV electricity production, the battery discharges until reaching the minimum state of charge rate. In the case where the combined use of thermal and electrical storage is realized, thermal storage is prioritized, and the battery is only charged after the overheating setpoint is achieved, or if the excess PV is adequate then the battery can be charged at the same time as the heat pump is operating.
In the predictive rule-based strategy for dynamic electricity price with the combined use of overheating (PRICE_TH) the next-day electricity price is accessed from the exchange electricity market and compared with the current price in order to define high or low price periods. Specifically, the average price (Priceavg) is determined in a near-future interval of time (from 4 to 7 h ahead) with a band (ΔP) of 5 €/MWh. When the price is low, the space heating setpoint is increased by 0.5 K, and on the contrary, when the price is high, the space heating setpoint is decreased by 0.5 K. In this mode, no change is enforced in the setpoint for DHW. If there is excess PV electricity (TH mode), when the PRICE mode is activated, the space heating set temperature is increased by 1.0 K beyond the PRICE mode setting, and the setpoint for DHW is lifted to 6 K above the reference value.

2.6. Energetic and Economic Performance Indicators

The key figures for this study in order to evaluate the energetic performance of the residential photovoltaic and heating system are the following: final energy use (FE), self-consumption (SC), solar fraction (SF) of the system. For the economic performance of the system, the annual net cost of electricity (NCOE) is calculated. Self-consumption is defined as PV electricity production that is directly consumed by the household—i.e., self-consumed electricity—relative to the total PV electricity production. If L(t) denotes the instantaneous electric load including appliances, heat pump, and auxiliary heater, and P(t) is the instantaneous power from the PV system, the directly consumed PV power M(t) if no electric storage is used can be defined as
M ( t ) = min { L ( t ) , P P V ( t ) } .
When adding battery storage to the system, this can be extended to
M ( t ) = min { L ( t ) , P P V ( t ) + S ( t ) }
where S(t) < 0 denotes power to storage (charging) and S(t) > 0 denotes power from storage (discharging).
SC = t 1 t 2 M ( t )   dt t 1 t 2 P PV ( t )   dt
Accordingly, solar fraction is the self-consumed electricity relative to the total load demand of electricity. A mathematical description of self-consumption can be found in Luthander et al. [29].
SF = t 1 t 2 M ( t )   dt t 1 t 2 L ( t )   dt
The seasonal performance factor of the heat pump system is equal to
SPFsys = t 1 t 2 QHP ( t )   dt t 1 t 2 ( PHP ( t ) + PAUX ( t ) ) dt .
The final energy for the simulation period is equal to the electric load that cannot be supplied by PV electricity:
FE = t 1 t 2 L ( t )   dt t 1 t 2 M ( t )   dt .
The net cost of energy is calculated based on the annual cost and revenue for the electricity bought and sold, and does not consider the investment cost for the PV or battery system.
NCOE = Cost Revenue
Cost = ( C sp + C energy   taxes +   network + fees + levies   ) P from   grid dt
Revenue = ( C sp   )   P to   grid   dt
The current chosen scenario for this study is a possible future scenario where the assumption is that no extra benefits would be given for the excess electricity production fed into the grid. This assumption is necessary for the revenue calculation to be comparable between countries since, in reality, there is a non-uniform revenue scheme among the examined locations for the electricity fed into the grid.

3. Examined Boundary Conditions

This section provides an overview of the boundary conditions used in this study.

3.1. Country

Six locations were examined in this simulation study, namely Norrköping, London, Stuttgart, Lyon, Madrid, and Rome. The choice of location affects the climate, insulation standard of the building, lighting, and electricity prices. More details about the characterization of the chosen climatic zones are listed in Table 4. The heating degree day values are retrieved from [30] from the mean daily temperatures for typical years and the balance temperature of 12 °C.

3.2. Meteorological Data

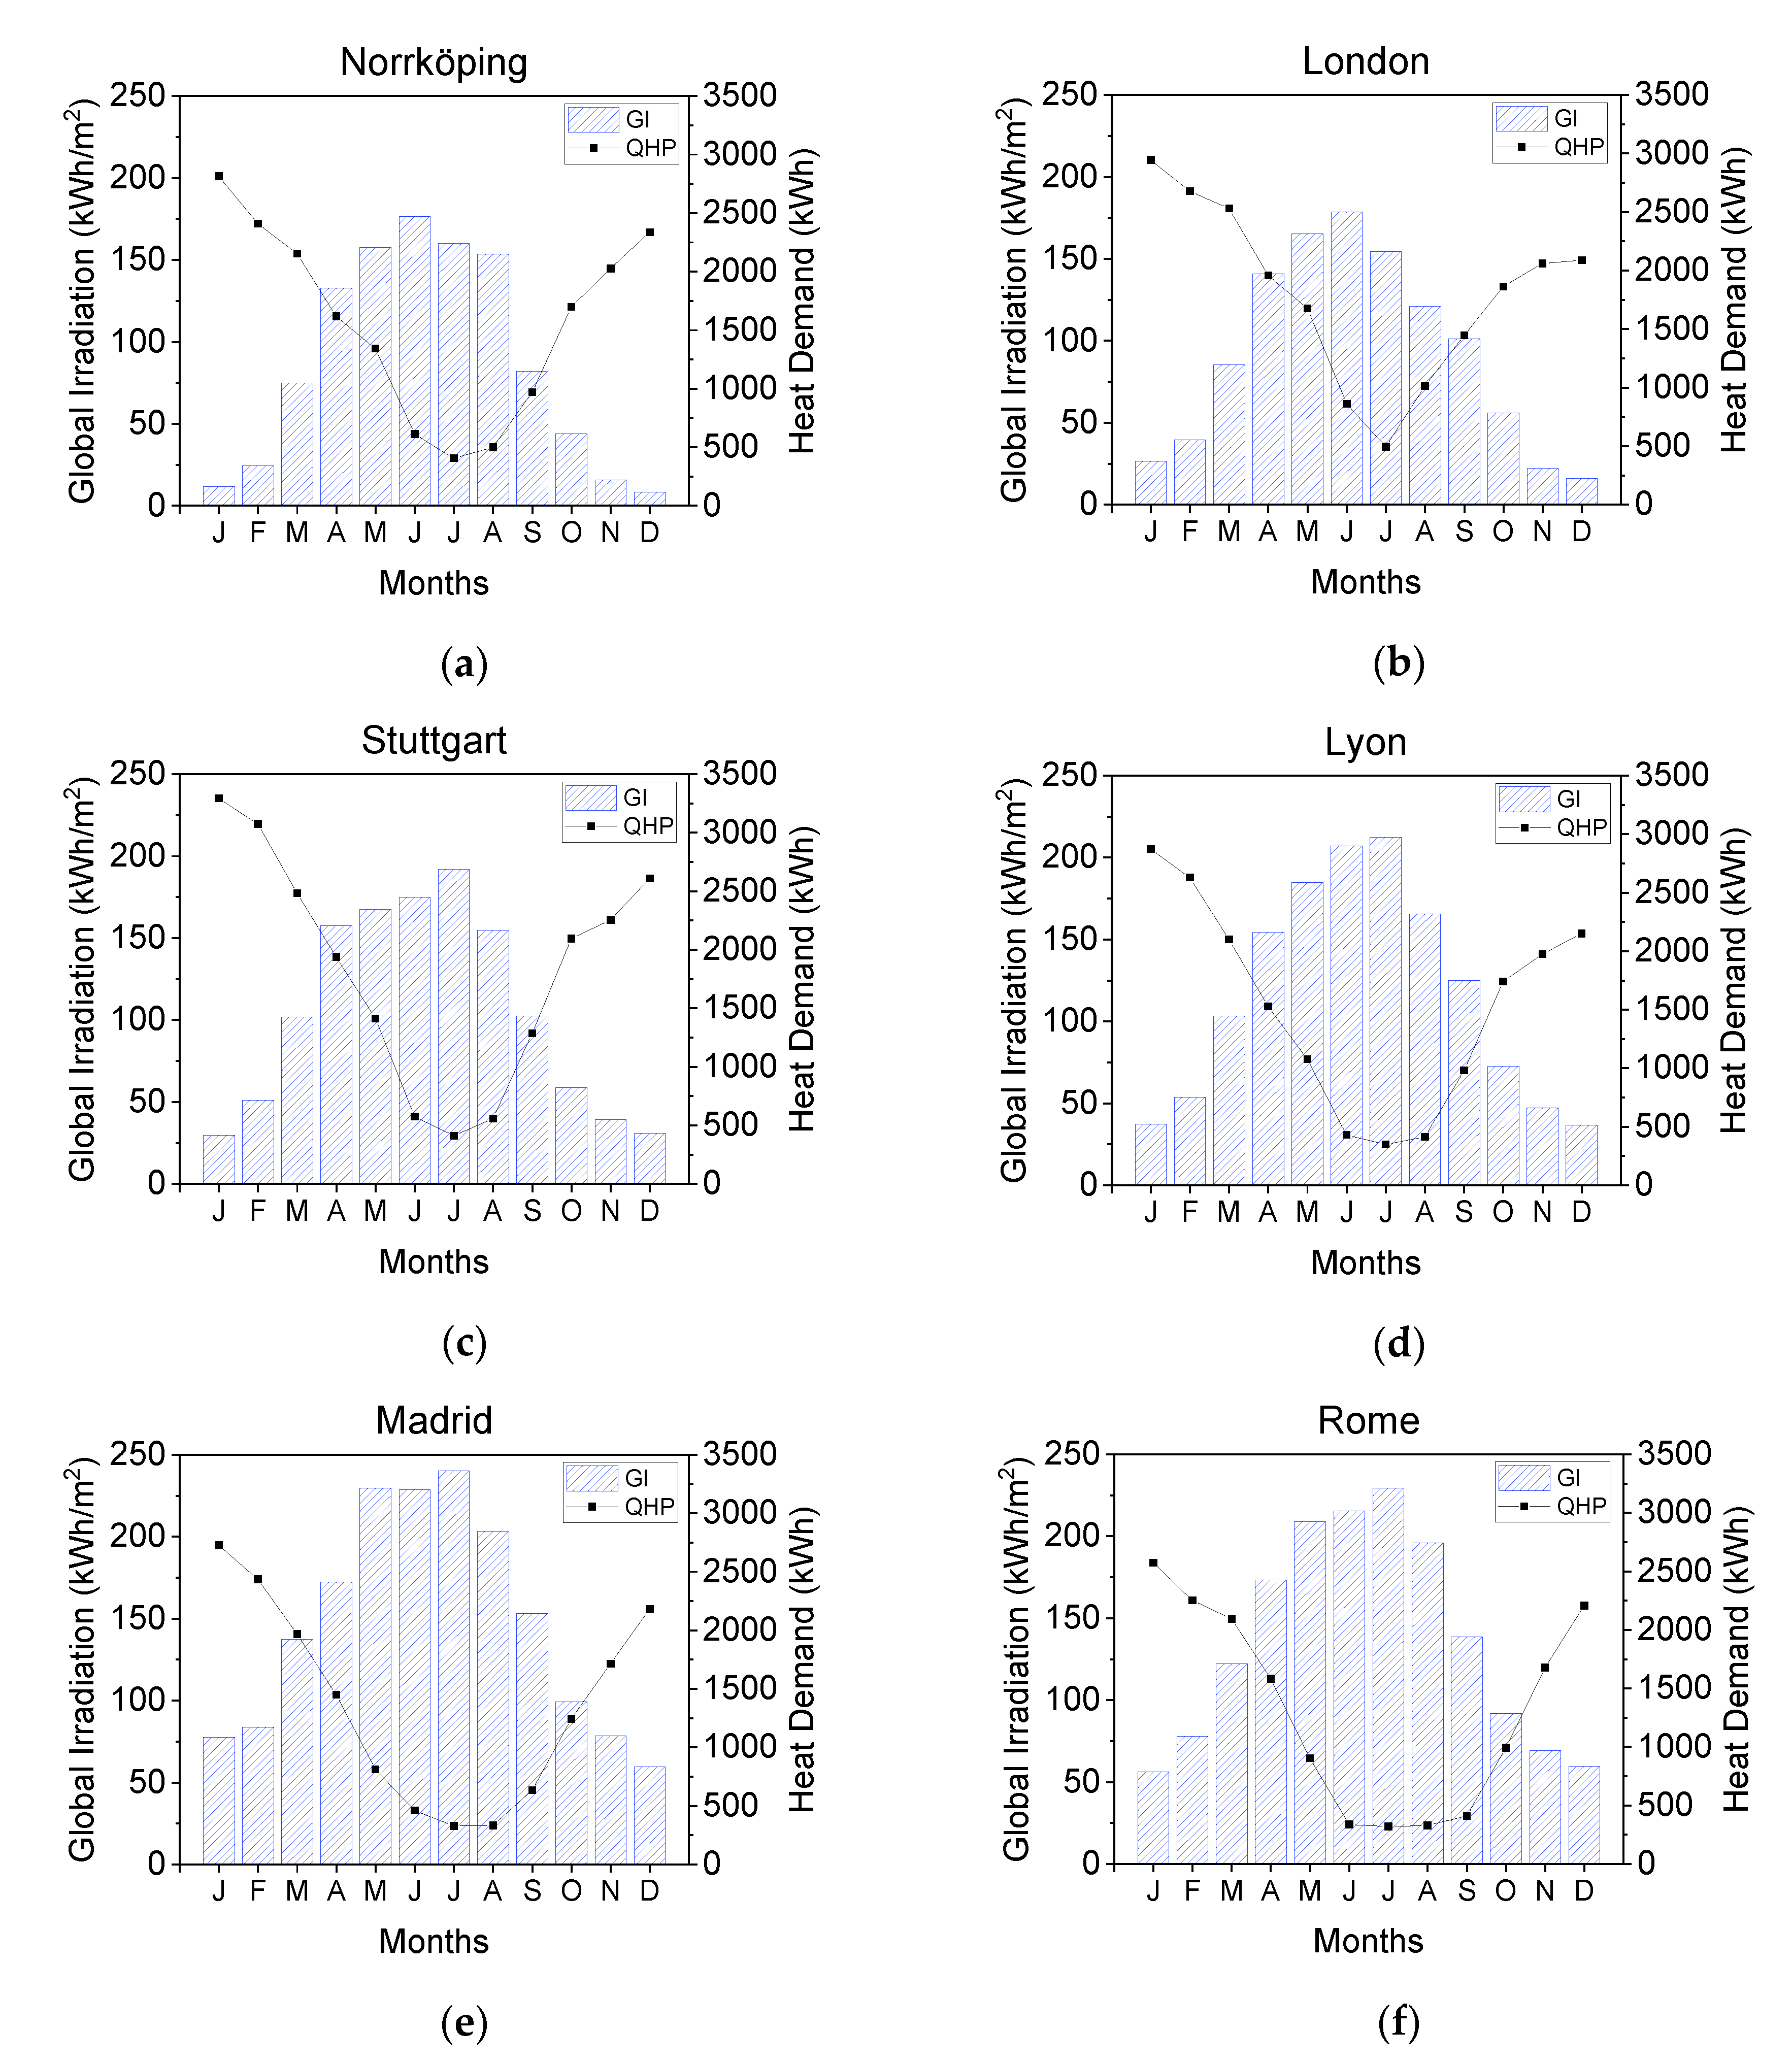
Solar radiation input data are derived from the Copernicus Atmosphere Monitoring Service (CAMS) [31] and meteorological input data such as ambient temperature and relative humidity are derived from the Modern-Era Retrospective analysis for Research and Applications, (MERRA-2) service [32]. For this study, data were chosen with a 15 min resolution. Figure 4 illustrates the simulated space heating demand of the base case system for the building insulation standards defined in Section 3.3 for the different locations as well as monthly global radiation for the example year of 2015.

3.3. Building Insulation Standards

The insulation standards (U-value) for buildings in the various locations were derived from the European project TABULA [33]. In the TABULA project, the building stock in 21 European countries was classified into different types and ages. Depending on the scale of the study that supplied data, the building classes can be representative of the national or regional building stock. In this study, the thermal characteristics of the generic building types were acquired from TABULA WebTool for single-family houses built in the year 2009. For the cases of Sweden, United Kingdom, Germany, and France, the given building information covers the national levels and can be used for chosen locations, i.e., specifically Norrköping, London, Stuttgart, and Lyon. However, for the cases of Spain and Italy, the information is given on the regional level. This means that the given values in TABULA might differ to those for the target locations and climates of this study, i.e., Rome and Madrid. To deal with this, further evaluation of the regulations and building codes for different cities and climate zones in Italy and Spain was conducted. The Italian Energy Performance of Buildings Directive (EPBD) implementation report [34] includes minimum requirements for buildings and their energy systems for diverse climate zones in Italy. From this source, overall U-value of the building for Rome is calculated as 0.43 W/m2K, which is close to the value from TABULA (0.42 W/m2K). Thus, considering the proximity of the U-values and consistency in importing the information from one source for all locations, it is assumed that the regional building codes from TABULA can be extended to Rome.
In Spain, according to national regulations (CTE-HE, 2006) [35] the overall U-value of the building in Madrid is calculated to be 0.8 W/m2K. For both this value and that from TABULA, initial modeling and simulation of the buildings with this poor insulation standard resulted in very high heating demand. However, as the size of the exhaust air heat pump is dependent on the ventilation rate, it cannot be resized for the highest loads, meaning that the excess heating demand should be covered by the auxiliary electrical heater. Excessive use of the auxiliary electrical heater leads to low seasonal performance factor (SPF) of the system as well as profitability of the system, and would, in practice, not be installed. To cope with this, the building insulation standards were altered to be the same as Germany. This choice was made based on the thermal properties of the building elements that needed to be slightly better that that of Spain. Italy, France, Germany, and United Kingdom were the possible options. The values for Italy were also too poor for the same reason as the Spanish and not suitable to use. France has relatively well insulated slabs and very small heat transmissions from the floor while it was not in line with that of Spain. Between Germany and United Kingdom, Germany was arbitrarily chosen. Table 5 summarizes the U-values for the building elements in the chosen locations used in this study.

3.4. Electricity, Occupancy, Room Set Temperature, and DHW Profiles

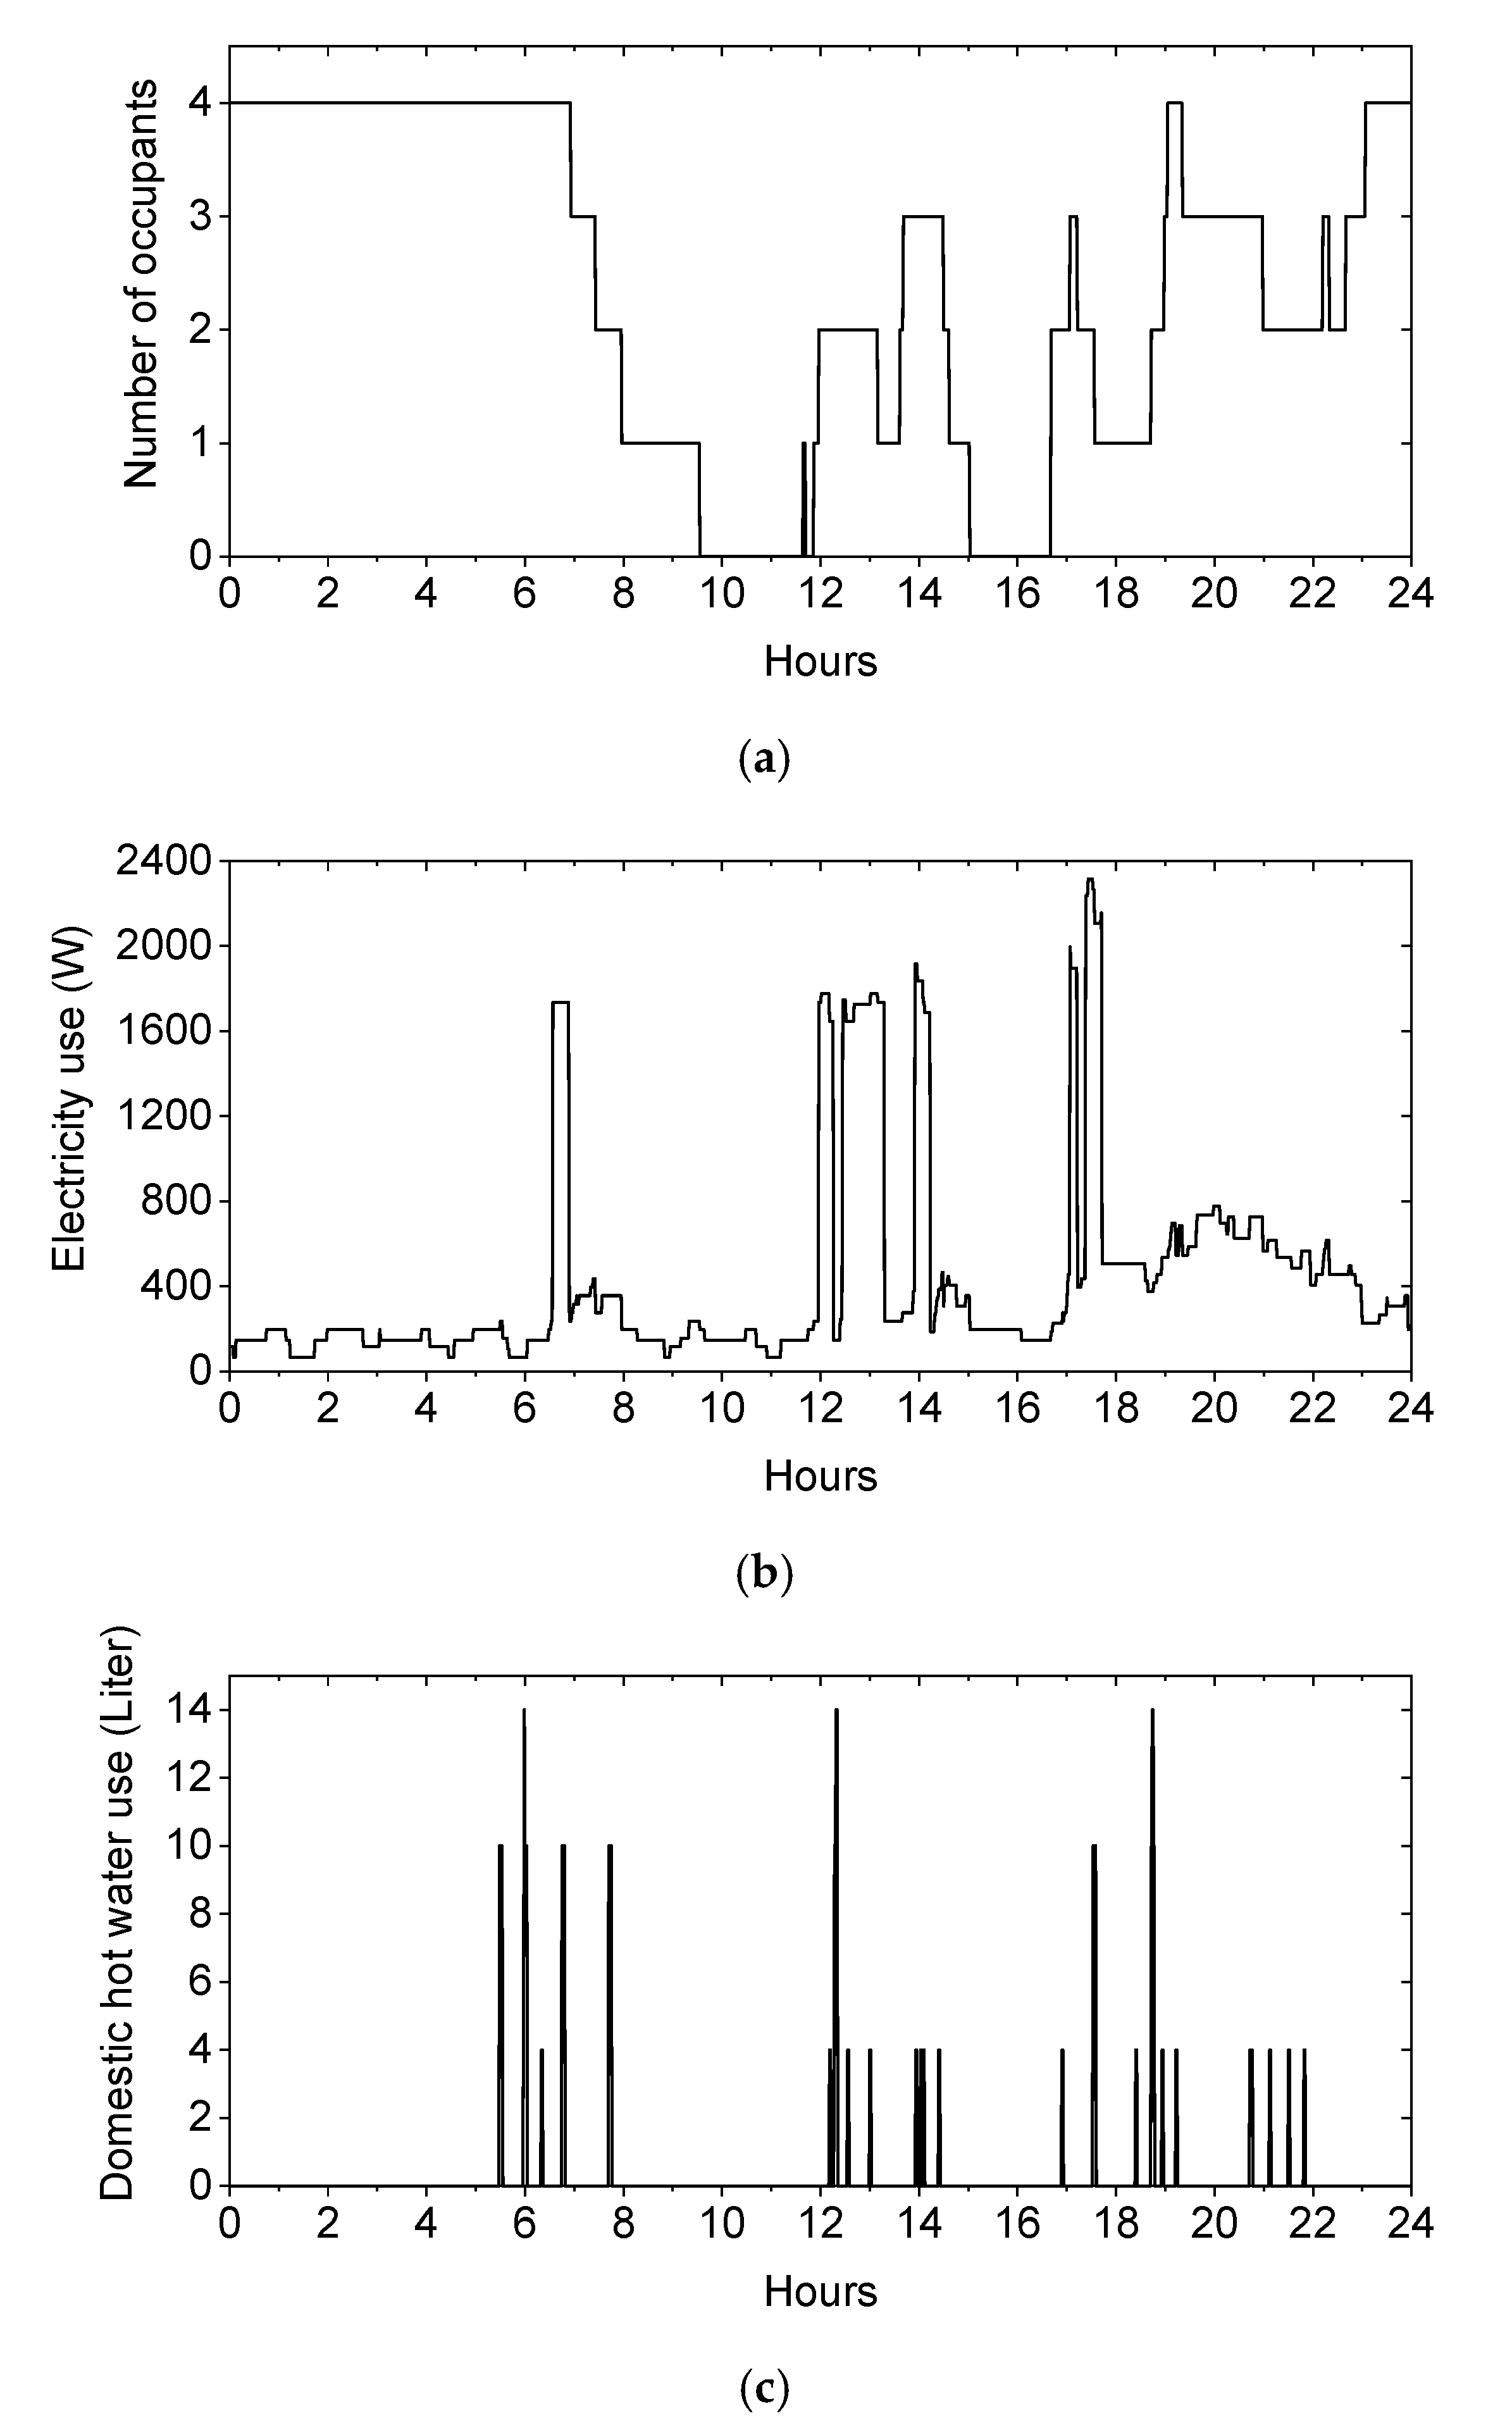
The inherent uncertainties in occupants’ behavior is considered as one of the constraints in the calculation of the energy demand in buildings. However, probabilistic studies of occupants’ presence and activities can facilitate the predictions of the occupants’ behavior in buildings. In this respect, the occupancy, household electricity, and DHW load profiles used in this study are derived from a high-resolution stochastic model developed by Widén and Wäckelgård [36]. This depends on the given number of occupants and climatic conditions of the location, i.e., daylighting, and the model generates one-minute load profiles of electrical appliances and lighting, DHW consumption, and occupants’ activities. For the sake of simplicity, the occupants’ activity profile was replaced by the occupants’ presence. The equivalent amount of energy for occupants’ presence is assumed to be at the activity level of 1 (seated and relaxed) [37]. It is assumed that the consumed electricity by electrical appliances and lightings is completely converted to heat as internal gain to the relevant zone in the building. Furthermore, three cases of room set temperature (20, 21, and 22 °C), are examined for all locations. Table 6 shows the electrical and DHW demand for the three different profiles used in the study for the case of Sweden. 2P is for two adults, 4P is for two adults and two children, while 4P+ indicates the same occupancy and DHW load profile as 4P but with greater use of appliances. Table 6 also gives the resulting electricity demand for the heat pump (including auxiliary electrical heater). Figure 5 also illustrates an example of generated profiles for occupancy, household electricity, as well as domestic hot water use obtained from the high-resolution stochastic model. This example is given for the case of 4P and for a random day of the year. The exact profiles vary from day to day, due to the stochastic model used in the profile generator [36].

3.5. Dynamic Electricity Tariffs

PV microproducers–consumers in countries within the EU have the option to choose among other common schemes, i.e., a dynamic electricity tariff derived from the national electricity exchange market with tariffs on an hourly basis.
Figure 6a, shows the difference between the locations with higher summer average monthly dynamic prices, such as Madrid (Spain) and Rome (Italy), from those with lower summer prices, such as Lyon (France) and especially Norrköping (Sweden). In London (UK) and Stuttgart (Germany) there is no obvious seasonal variation. The annual average variation during the day is shown in Figure 6b, and shows that Sweden has smaller price variations during the day, while the United Kingdom and Italy have relatively large variations.
The aggregated price for bought electricity is comprised of the following components/added values in addition to the spot market energy cost: the distribution (grid) cost, the energy taxes which include fees and levies, and the value-added tax (VAT) [38]. Details can be seen in Table 7. The dynamic price is only a fraction of the end-user price for bought electricity in most of the examined locations and markets respectively. This fraction ranges from 25% for Germany and Sweden to 60% in the United Kingdom. The total amount for taxes (VAT and energy tax) ranges from 17% in the United Kingdom to 53% in Germany, while the total price ranges from 0.28 €/kWh in Germany and 0.30 €/kWh in Italy to 0.15 and 0.16 €/kWh in Sweden and France respectively, which is much lower than for all other countries [38].
There are different regulations and tariff methods in the studied countries for export to the grid (PV feed-in). To be consistent, in this study we have assumed no subsidized feed-in tariffs or limitations, and simply assumed that the price the prosumer gets is the spot market price for all countries.

4. Results and Discussion

This section provides an overview of the results for the range of boundary conditions defined in Section 3, with the two different advanced control strategies together with one PV system size, with electrical storage. Table 8 shows the results for the two PV system sizes with and without electrical storage and without advanced control for the 4P load profiles and 21 °C as the set temperature for the main zones.
The only results without electrical storage shown in this section are those that are shown in Table 8 as the impact of (change due to) the control algorithms on the self-consumption (SC) and final energy (FE), which are very similar to those for the system with battery. Thus, the same trends are seen, and the same conclusions can be drawn for the system with and without batteries. The observed increase in SC due to the addition of a battery is 18% ± 1% for all countries, while the decrease in FE ranges from 1261 kWh year−1 in Norrköping to 1887 kWh year−1 in Madrid and largely follows the trend for PV production. The difference in SF is not similar for all locations and increases from 11% + 1% for Norrköping to 20% + 1% in Rome, which is due to the change in FE as well as the absolute size of the electrical demand.
For the medium PV size, the produced electricity in Madrid and Rome is more than the total used electricity, while it is less in all other cases. These two cases are, thus, plus-energy houses but, even with the battery, the solar fraction is (just) below 50%.
The space heating demand does not vary as much as the differences in climate would suggest, due to the different insulation standards in different countries. The fraction of the total annual electricity required for SH and DH, delivered by the auxiliary back up heater, is higher in the case of Stuttgart and significantly lower in the case of Rome in comparison to the other locations, and this is reflected in the SPF value. The high value for Stuttgart is due to the relatively high U-value for the climate, which means that the heat pump is undersized compared to the peak loads, whereas it is the opposite case for Rome.
PV production for the small PV system ranges from 3553 and 3679 kWh yr−1 in Norrköping and London, respectively, to 5286 and 5421 kWh year−1 in Madrid and Rome, respectively. The final energy is greatest in Stuttgart due to the high electricity demand and relatively low PV production, with Norrköping and London being slightly lower, while it is lowest in Madrid and especially Rome. Annual costs are, however, more dependent on the total price of electricity and the tariffs for feeding electricity into the grid, resulting in Norrköping having, by far, the lowest net cost of energy and Germany, by far, the highest.

4.1. Energy Use Analysis

In this and the following section, the changes in the values of key performance indicators due to the implementation of advanced control are presented. ΔFE, ΔSC, ΔSF, and ΔNCOE are all given as absolute changes compared to the value with default control (no advanced algorithms) for the same boundary conditions. For each key performance indicator, there is a group of three figures for each country—one for each of the appliance use profiles. For each figure, there are curves for each of the three combinations of algorithms versus the three default set temperatures for the main living areas in the house. The overheating implemented by the algorithms (see Table 3) is relative to these set temperatures. Only figures for the small PV system with electrical storage are shown due to space limitations and due to the fact that the trends are also similar for the medium PV system.
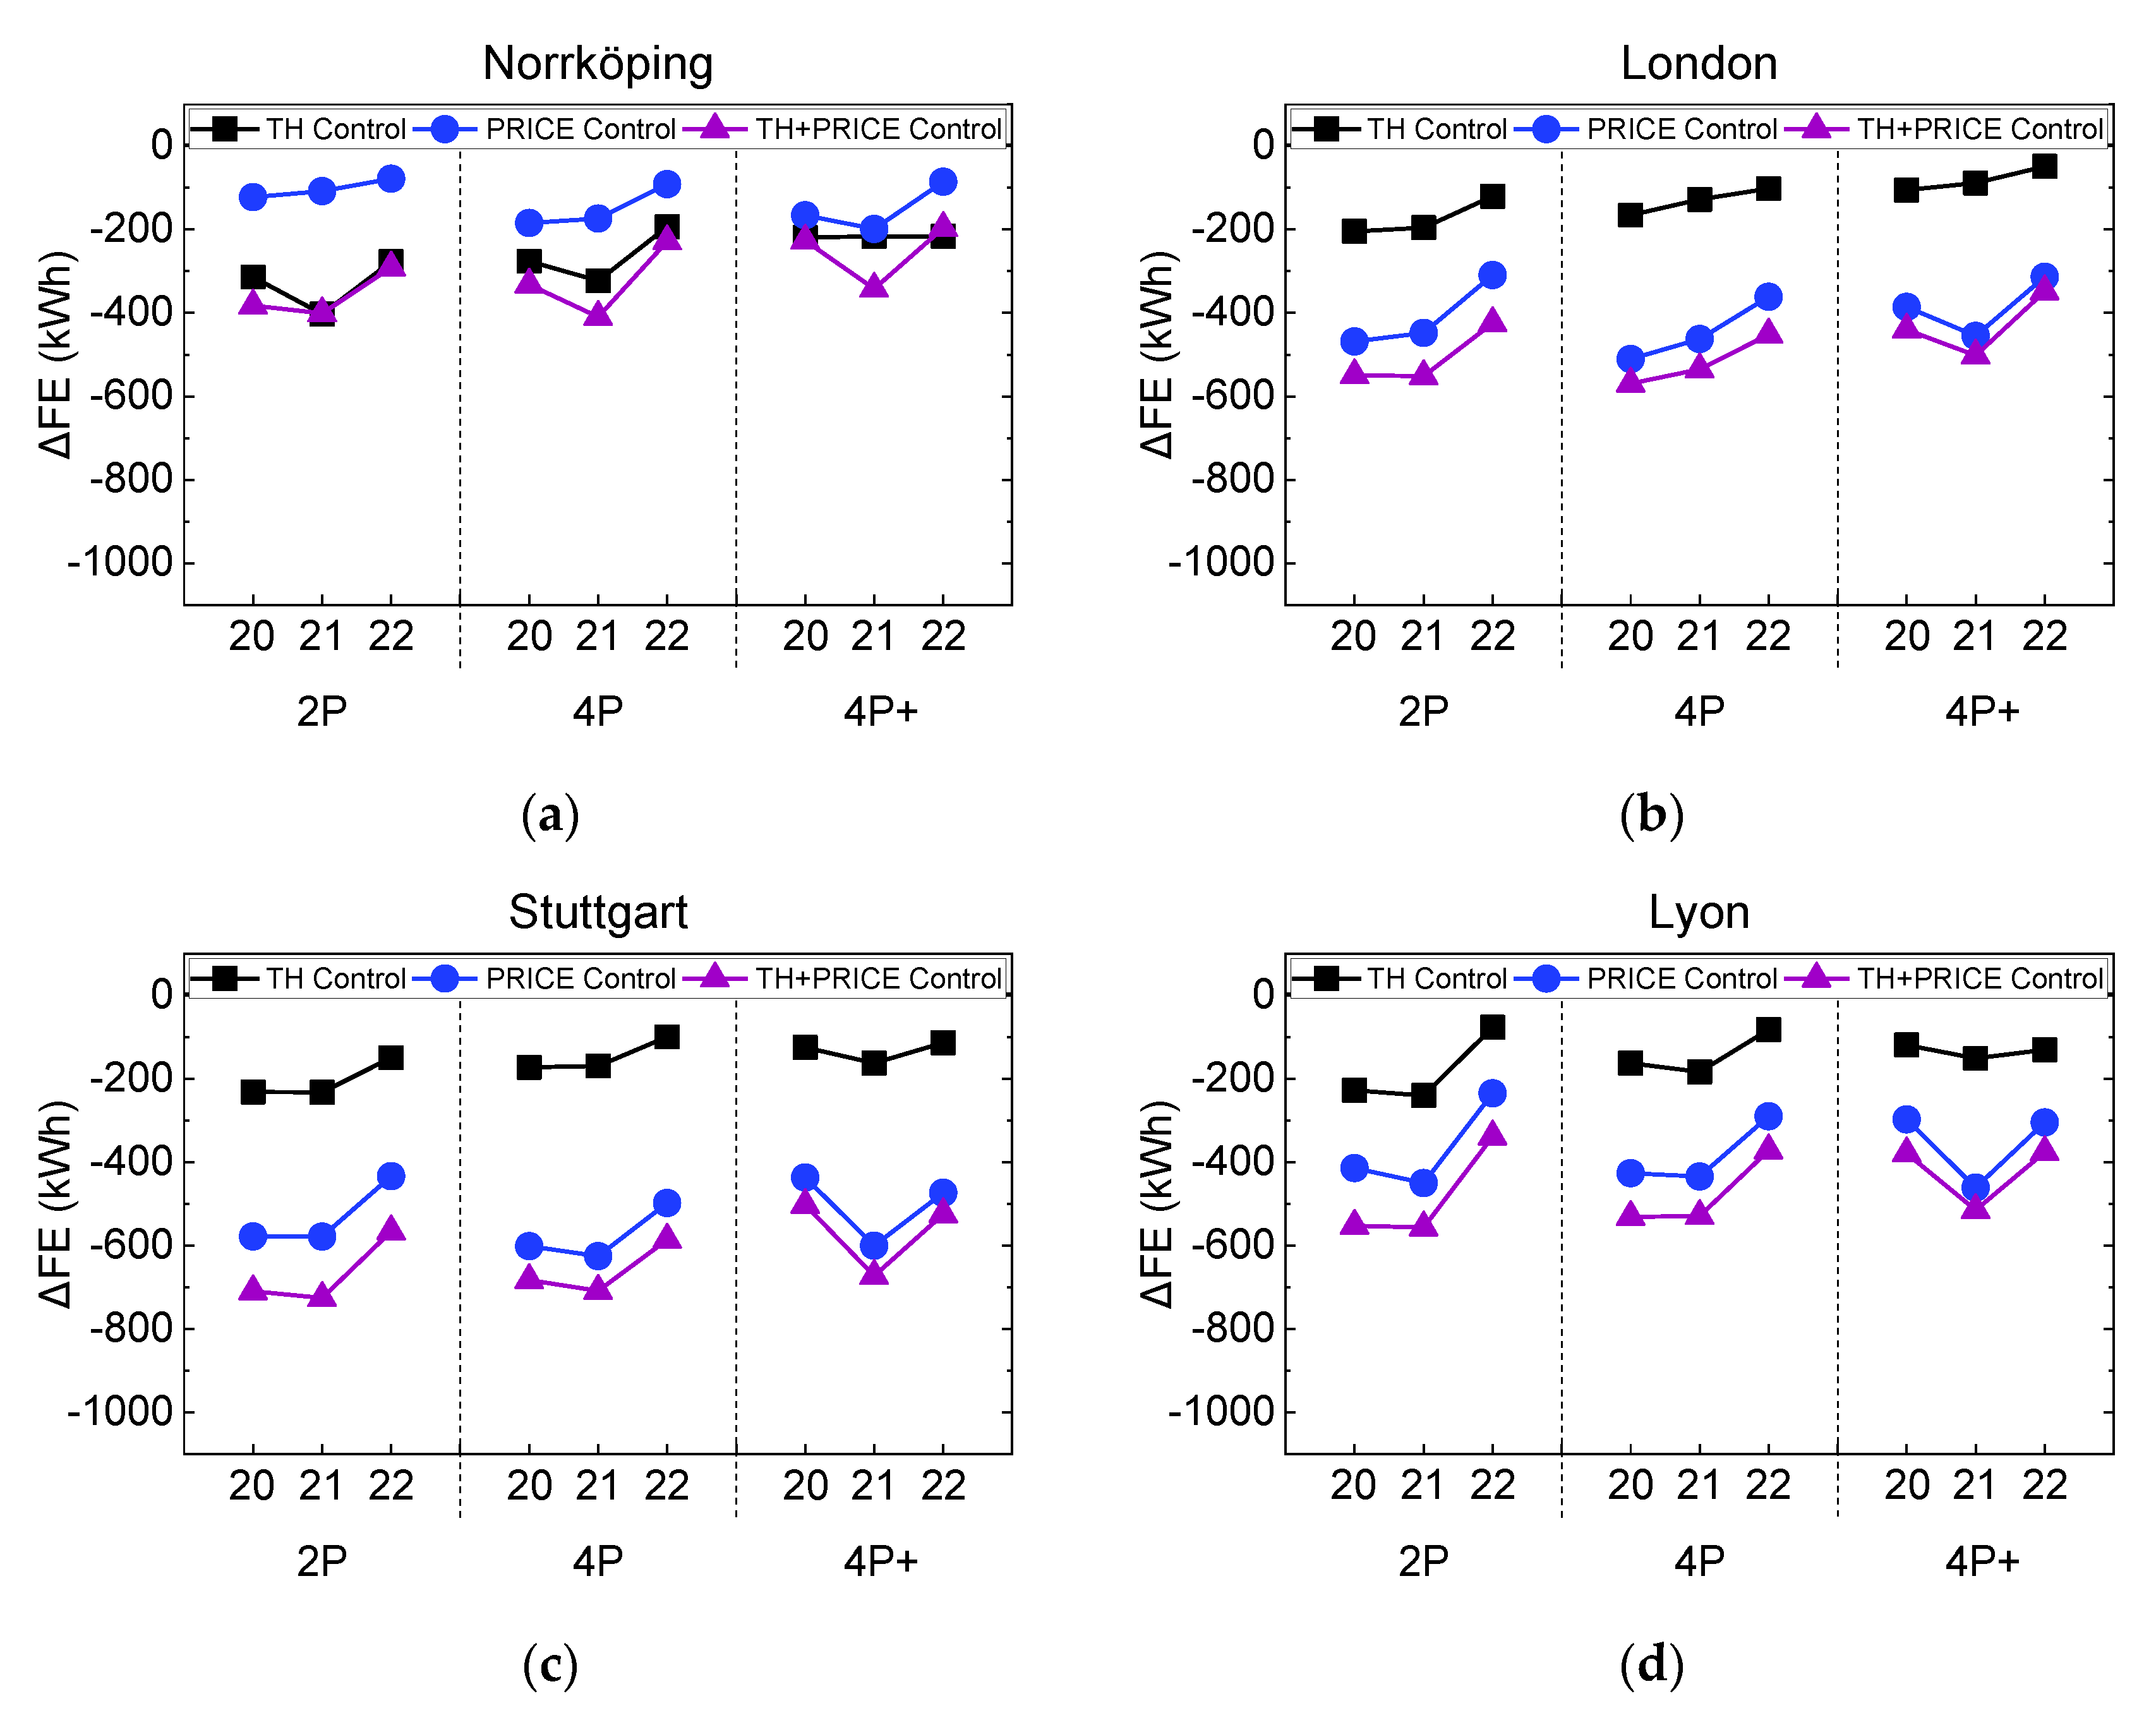
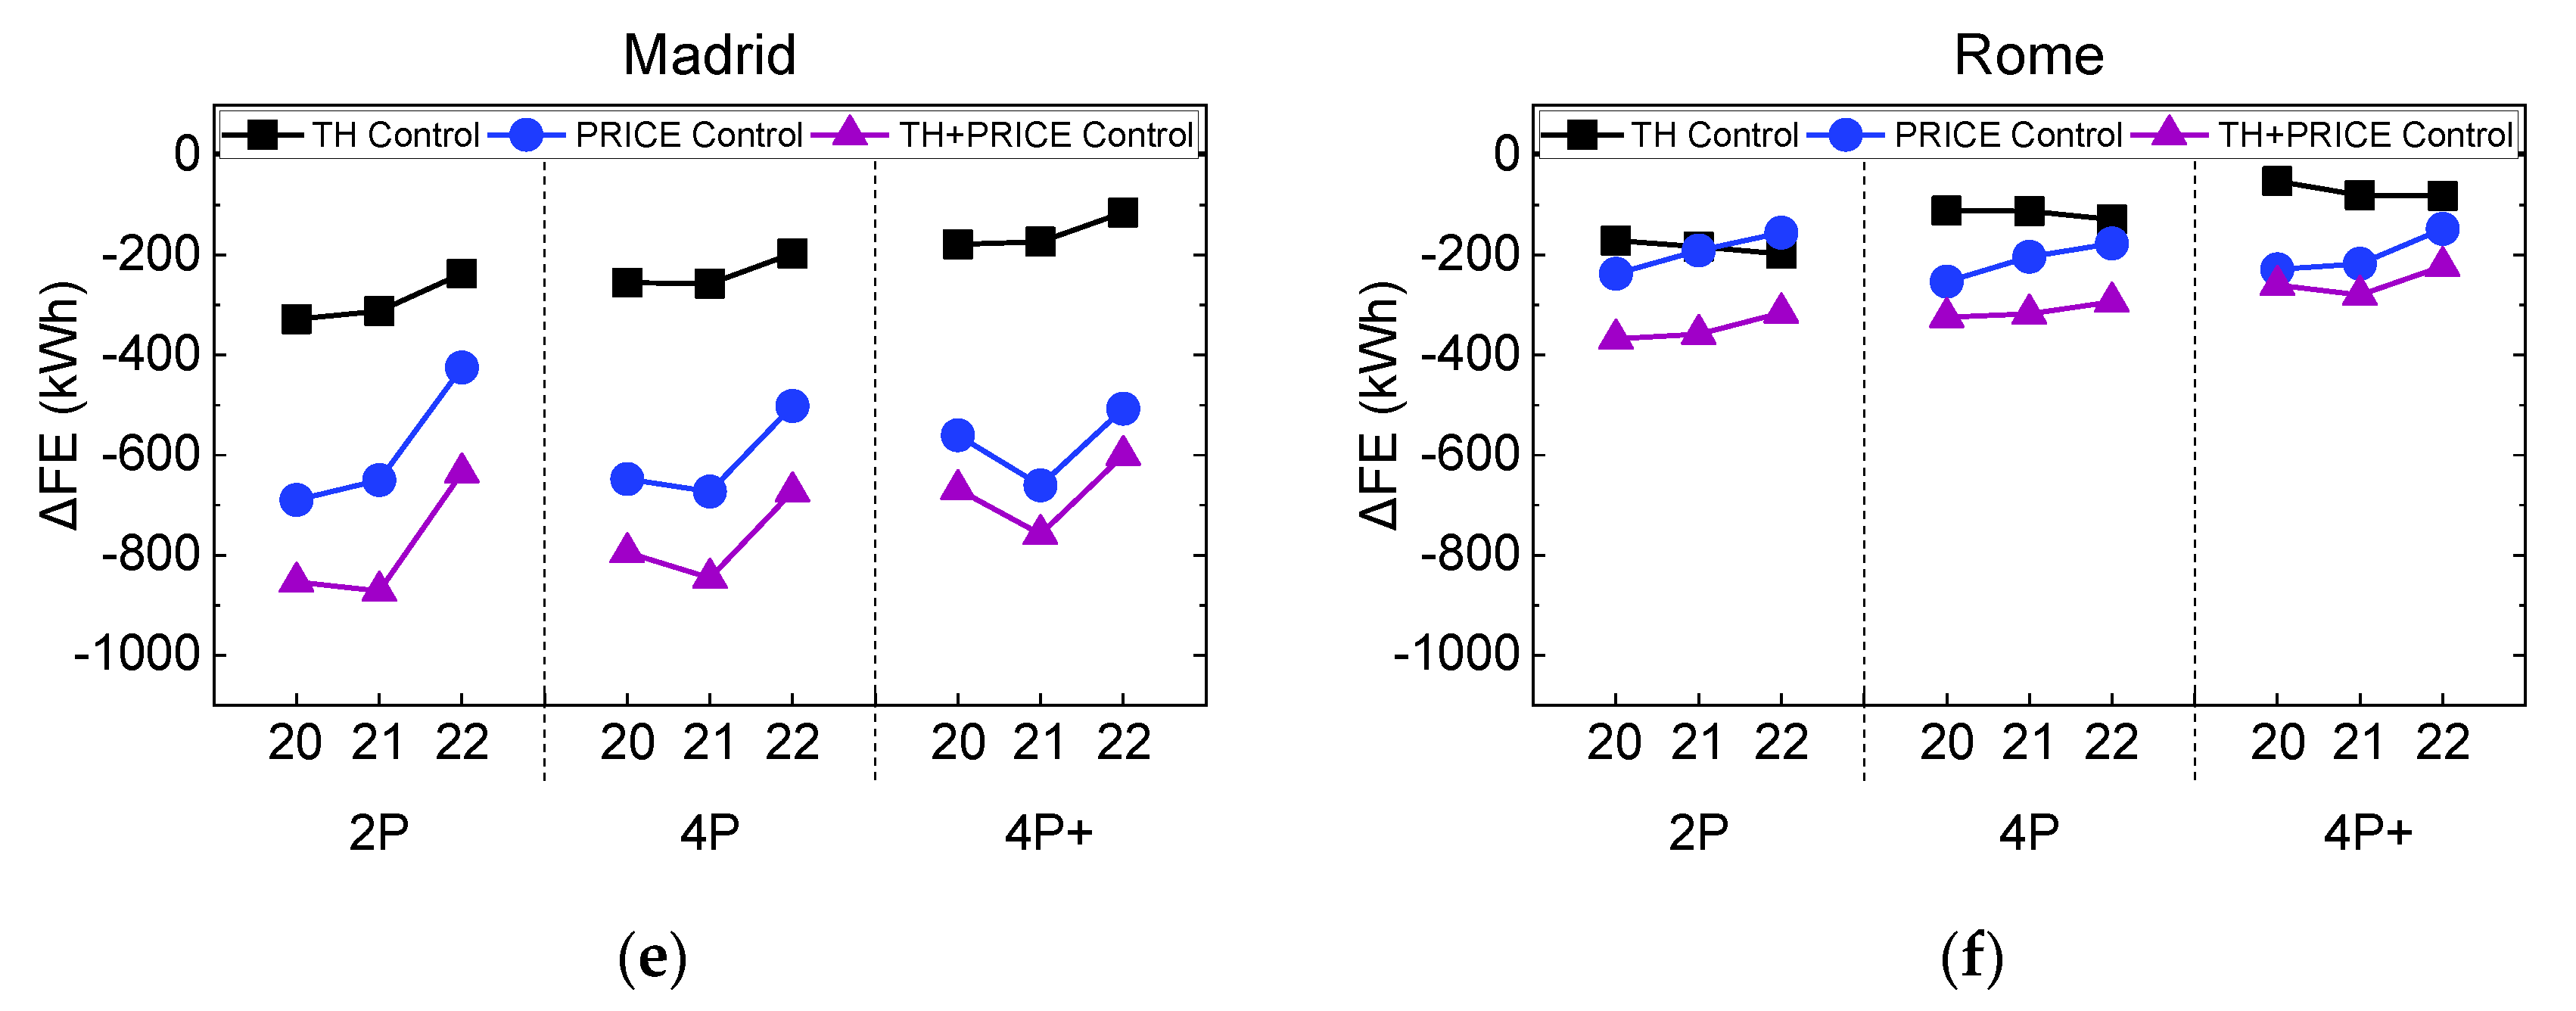
Figure 7 shows that the impact of the appliance load profiles on FE is small for the PRICE mode, but the impact of the TH mode is significantly larger for small appliance loads in all locations. This is due to larger amounts of excess PV energy available and, thus, more frequent use of the TH algorithm. Moreover, another trend is that the final energy is decreasing marginally when the TH mode is active for the set temperature of 22 °C compared to 21 °C in the case of Rome, Italy. This is the result of lower auxiliary heater energy use, which is not the case for the other examined locations.
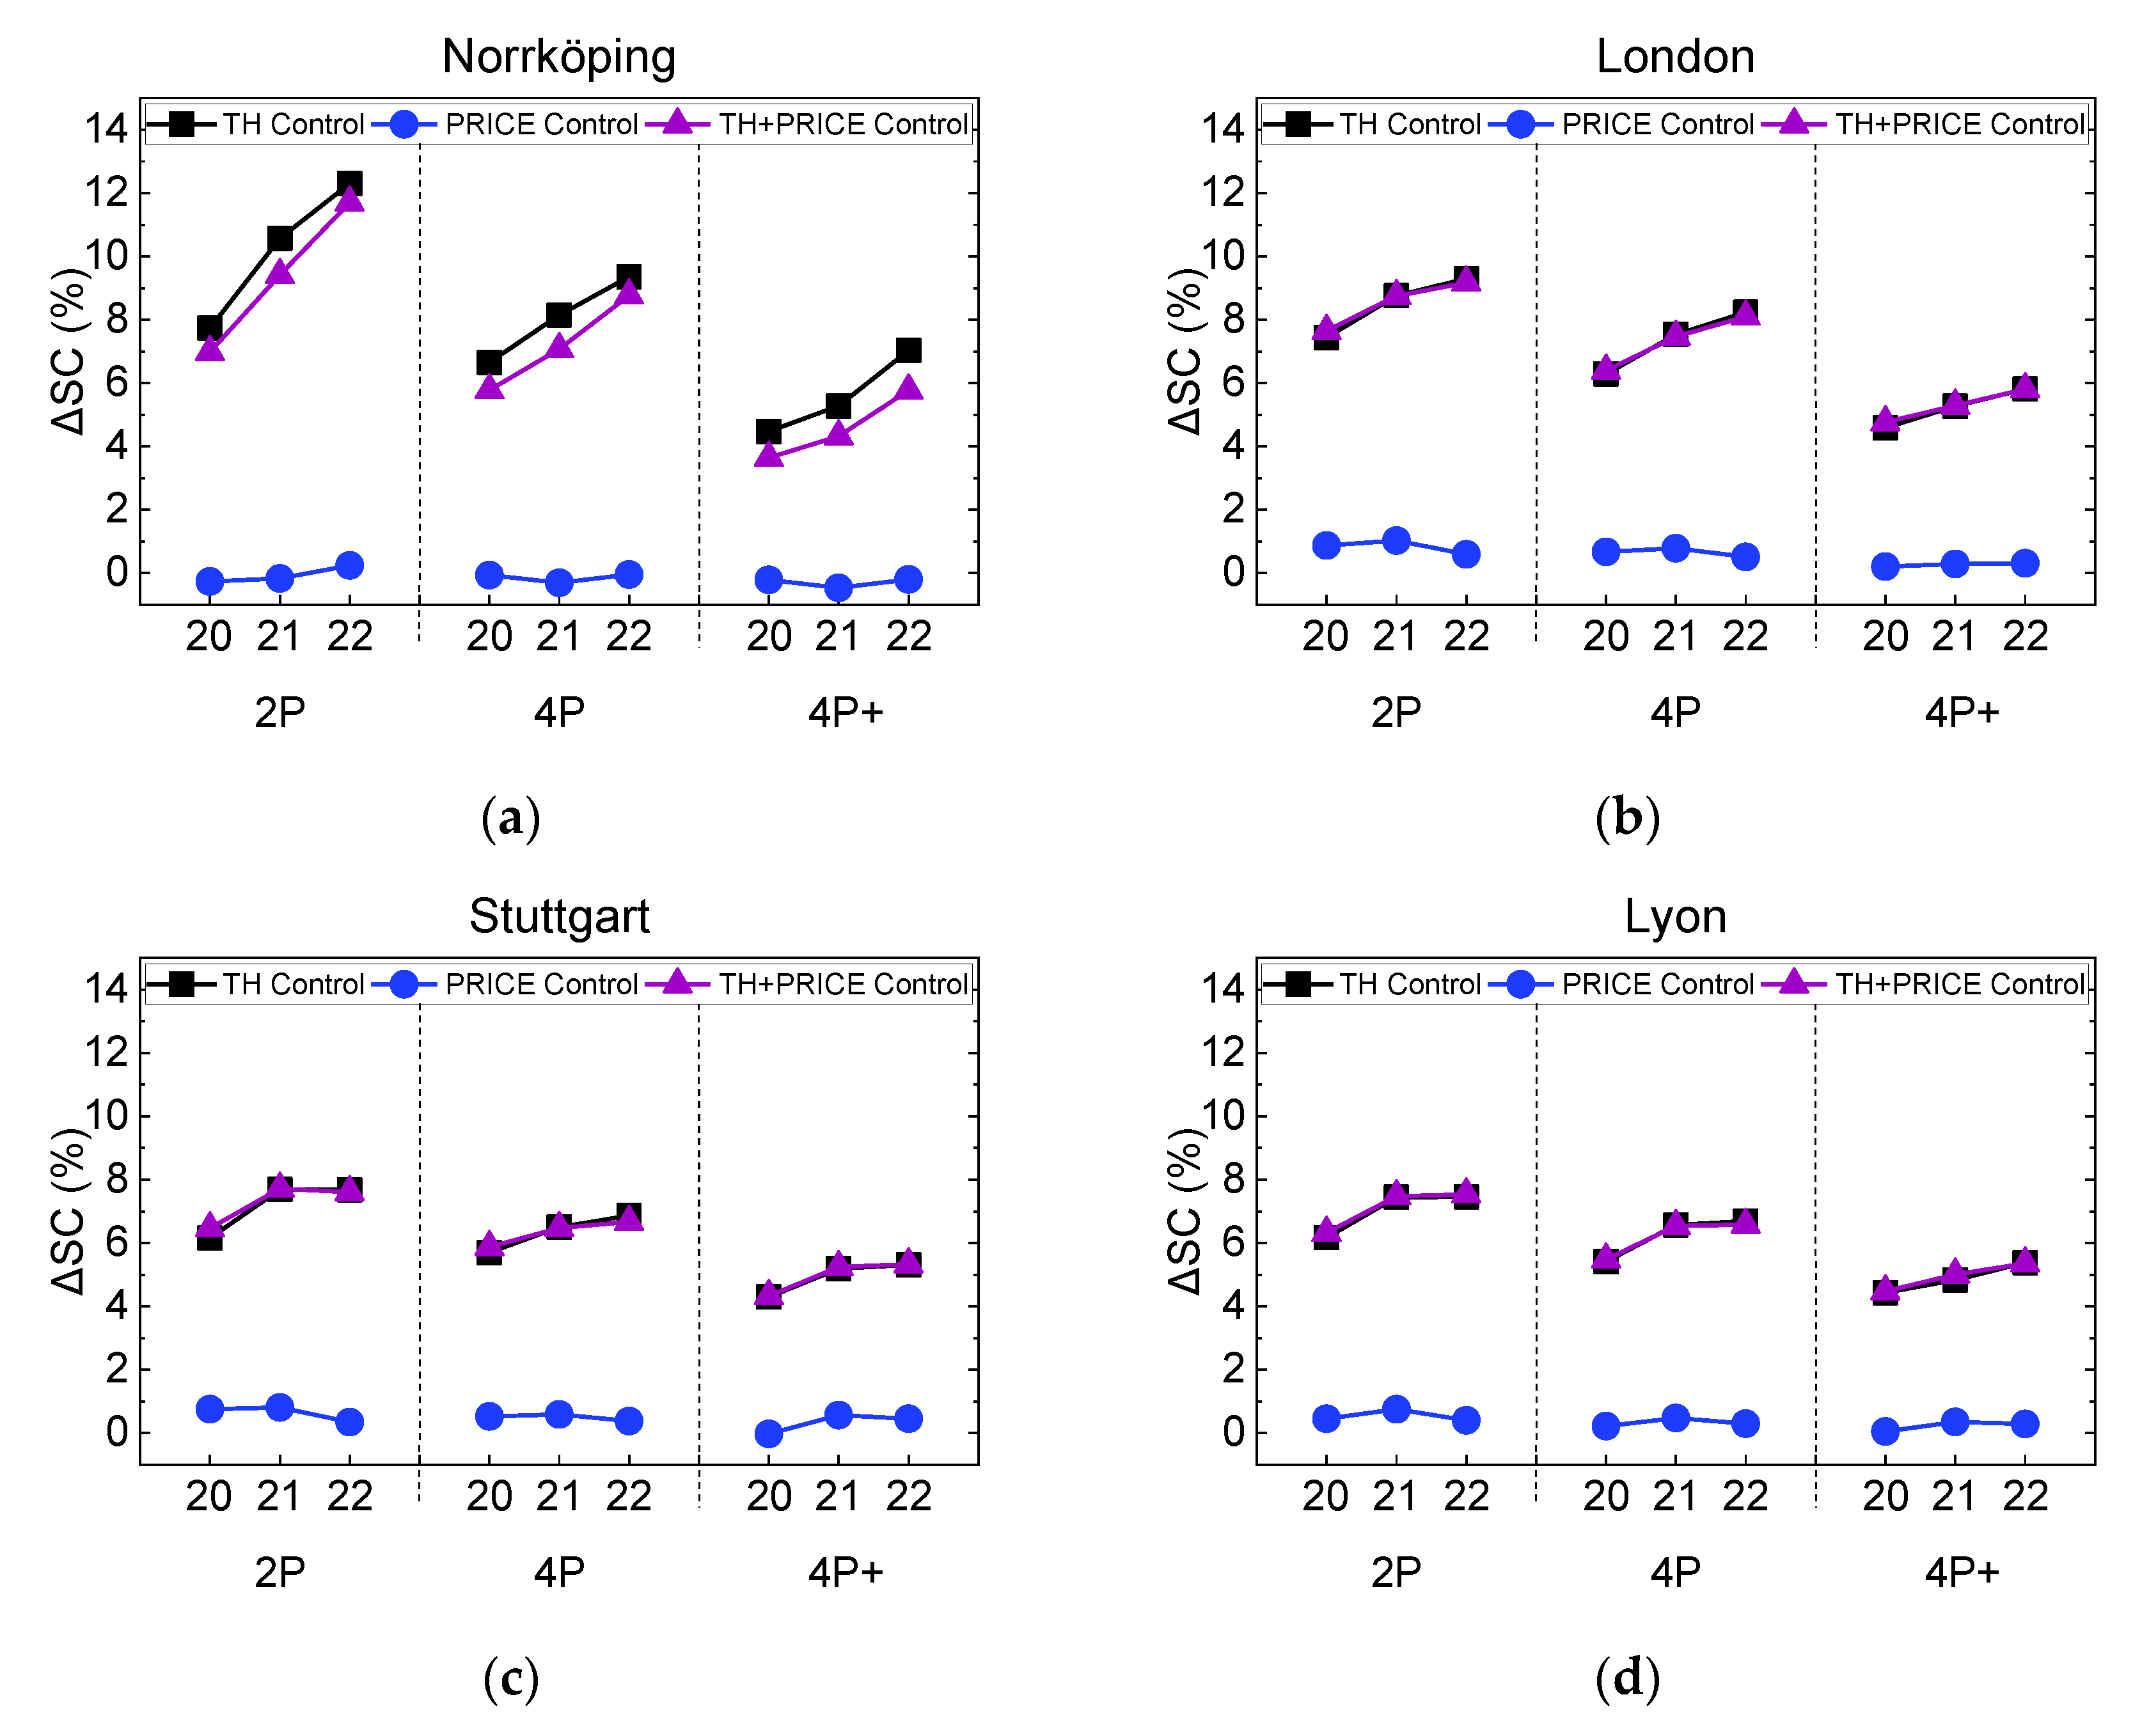
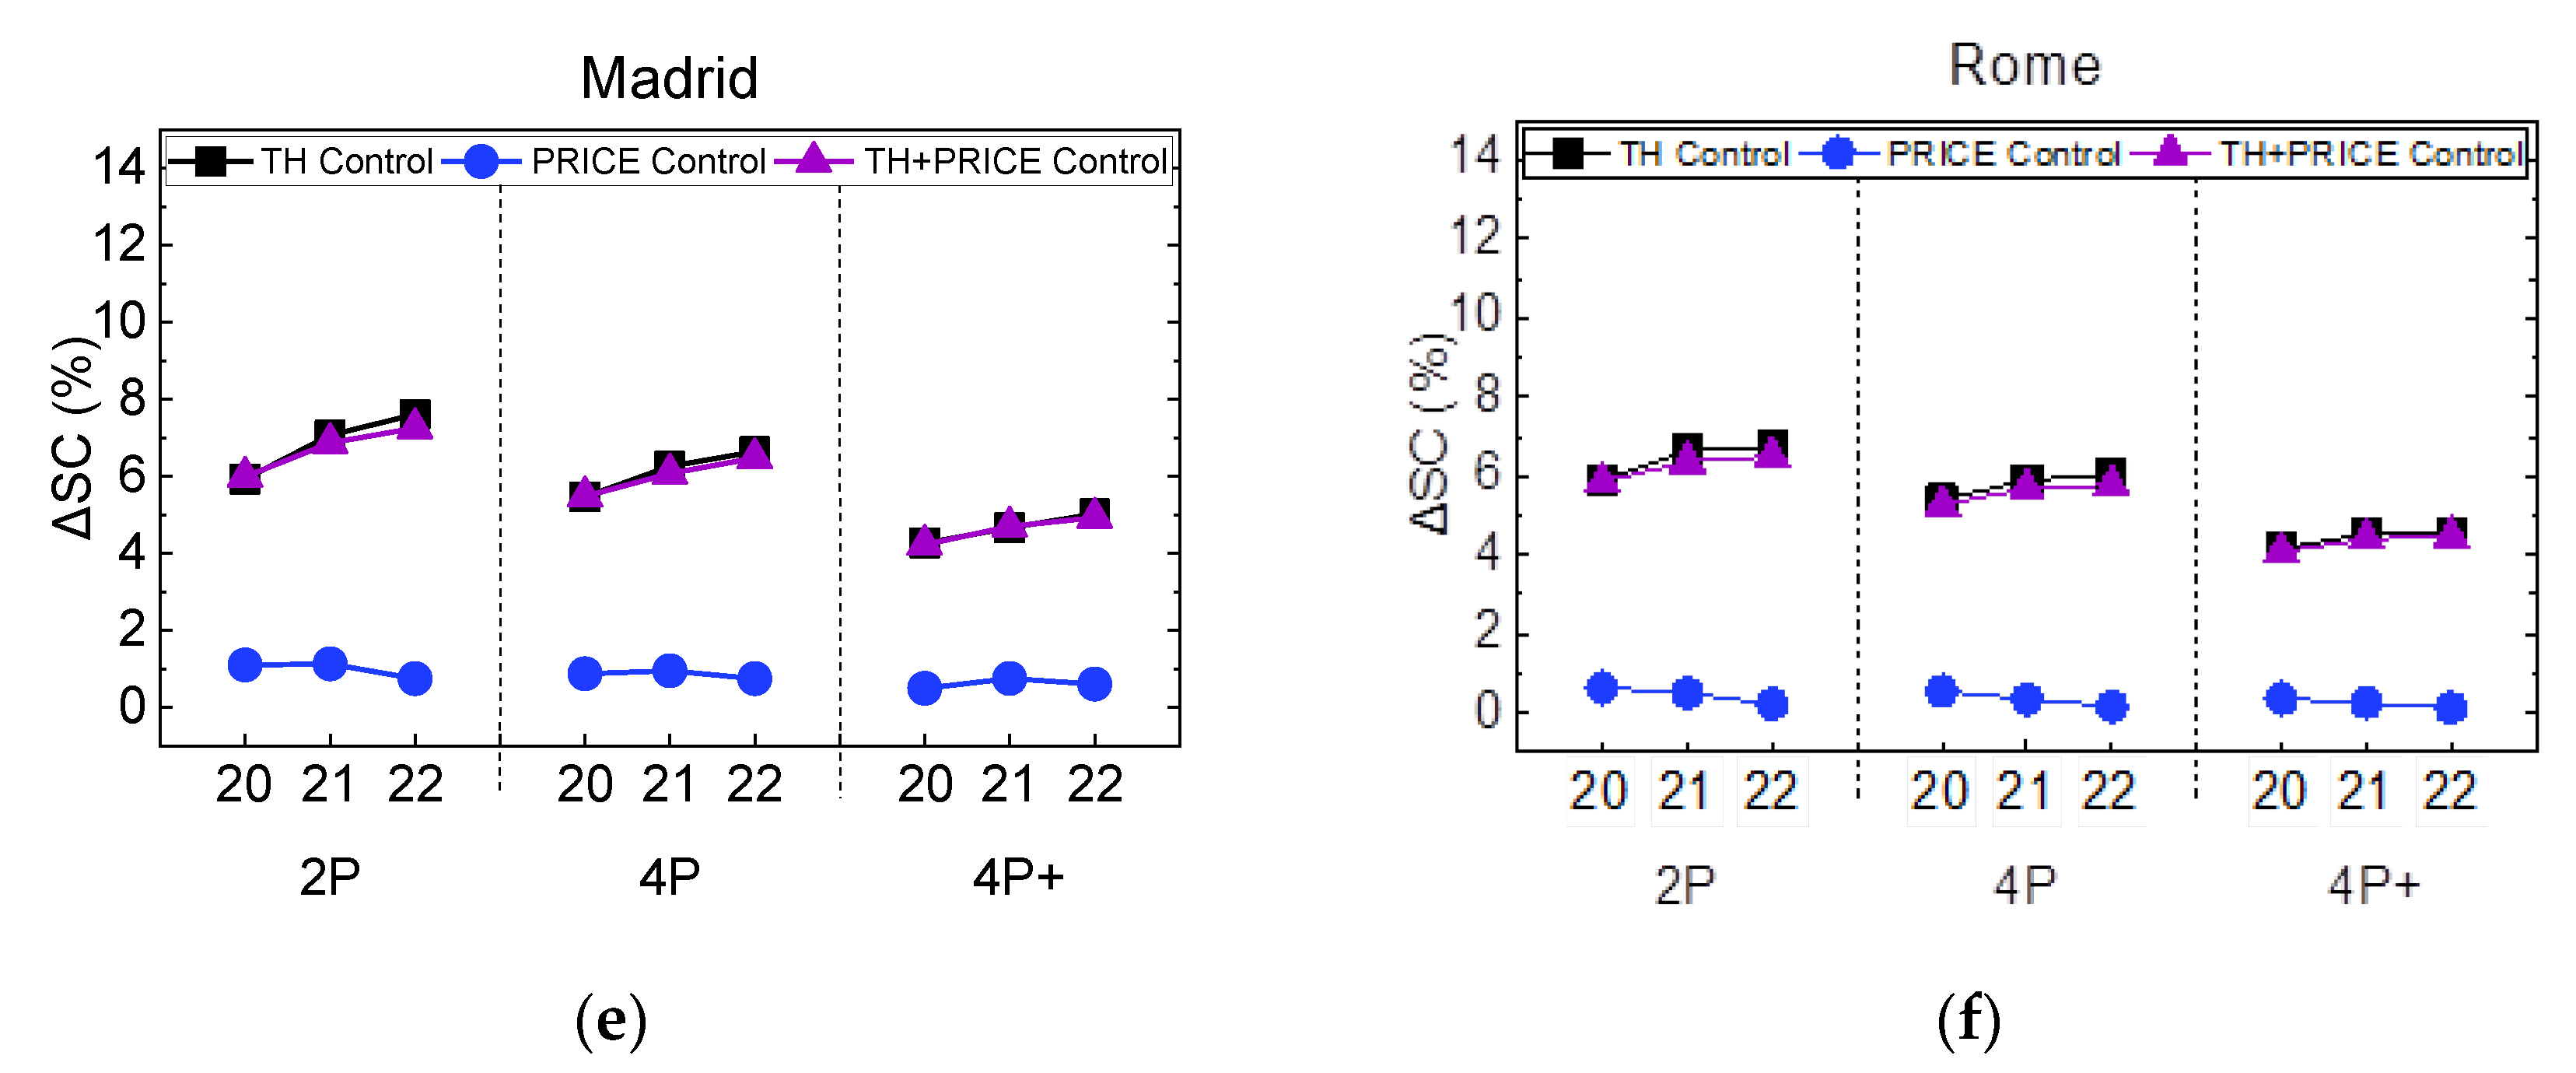
Figure 8 shows that the PRICE controller has minimal impact on SC, which is not surprising as it does not take PV production into account, only the spot market price. In Sweden, the PRICE control actually has a negative impact on SC that is also indicated when PRICE and TH controls are implemented together. On the contrary, SC is increased mainly by the rule-based thermal control (TH) when excess PV is available. ΔSC due to TH mode is highest for Norrköping with up to 13% and lowest in Rome with maximum of 6%.
ΔSC increases with increase in set temperature in most cases, with the trend again being that Norrköping has the largest increase and Rome the lowest. This increase in ΔSC is smaller for the larger appliance use profiles, and in Rome, there is in fact a decrease in ΔSC for a set temperature of 22 °C compared to 21 °C for the two large appliance use profiles.
These results are interpreted as being due to the fact that with a higher set temperature, the heating season is lengthened, which means that there is a greater overlap in time for when there is excess PV as well as space heating needed. Higher appliance use means that there is less excess PV available that can be used for overheating and, thus, the benefit of the algorithm is lower. The results for the medium-sized PV system (not shown as a diagram due to space limitations) show much lower dependency on the electricity demand for appliances due to the fact that there is more excess PV production available.
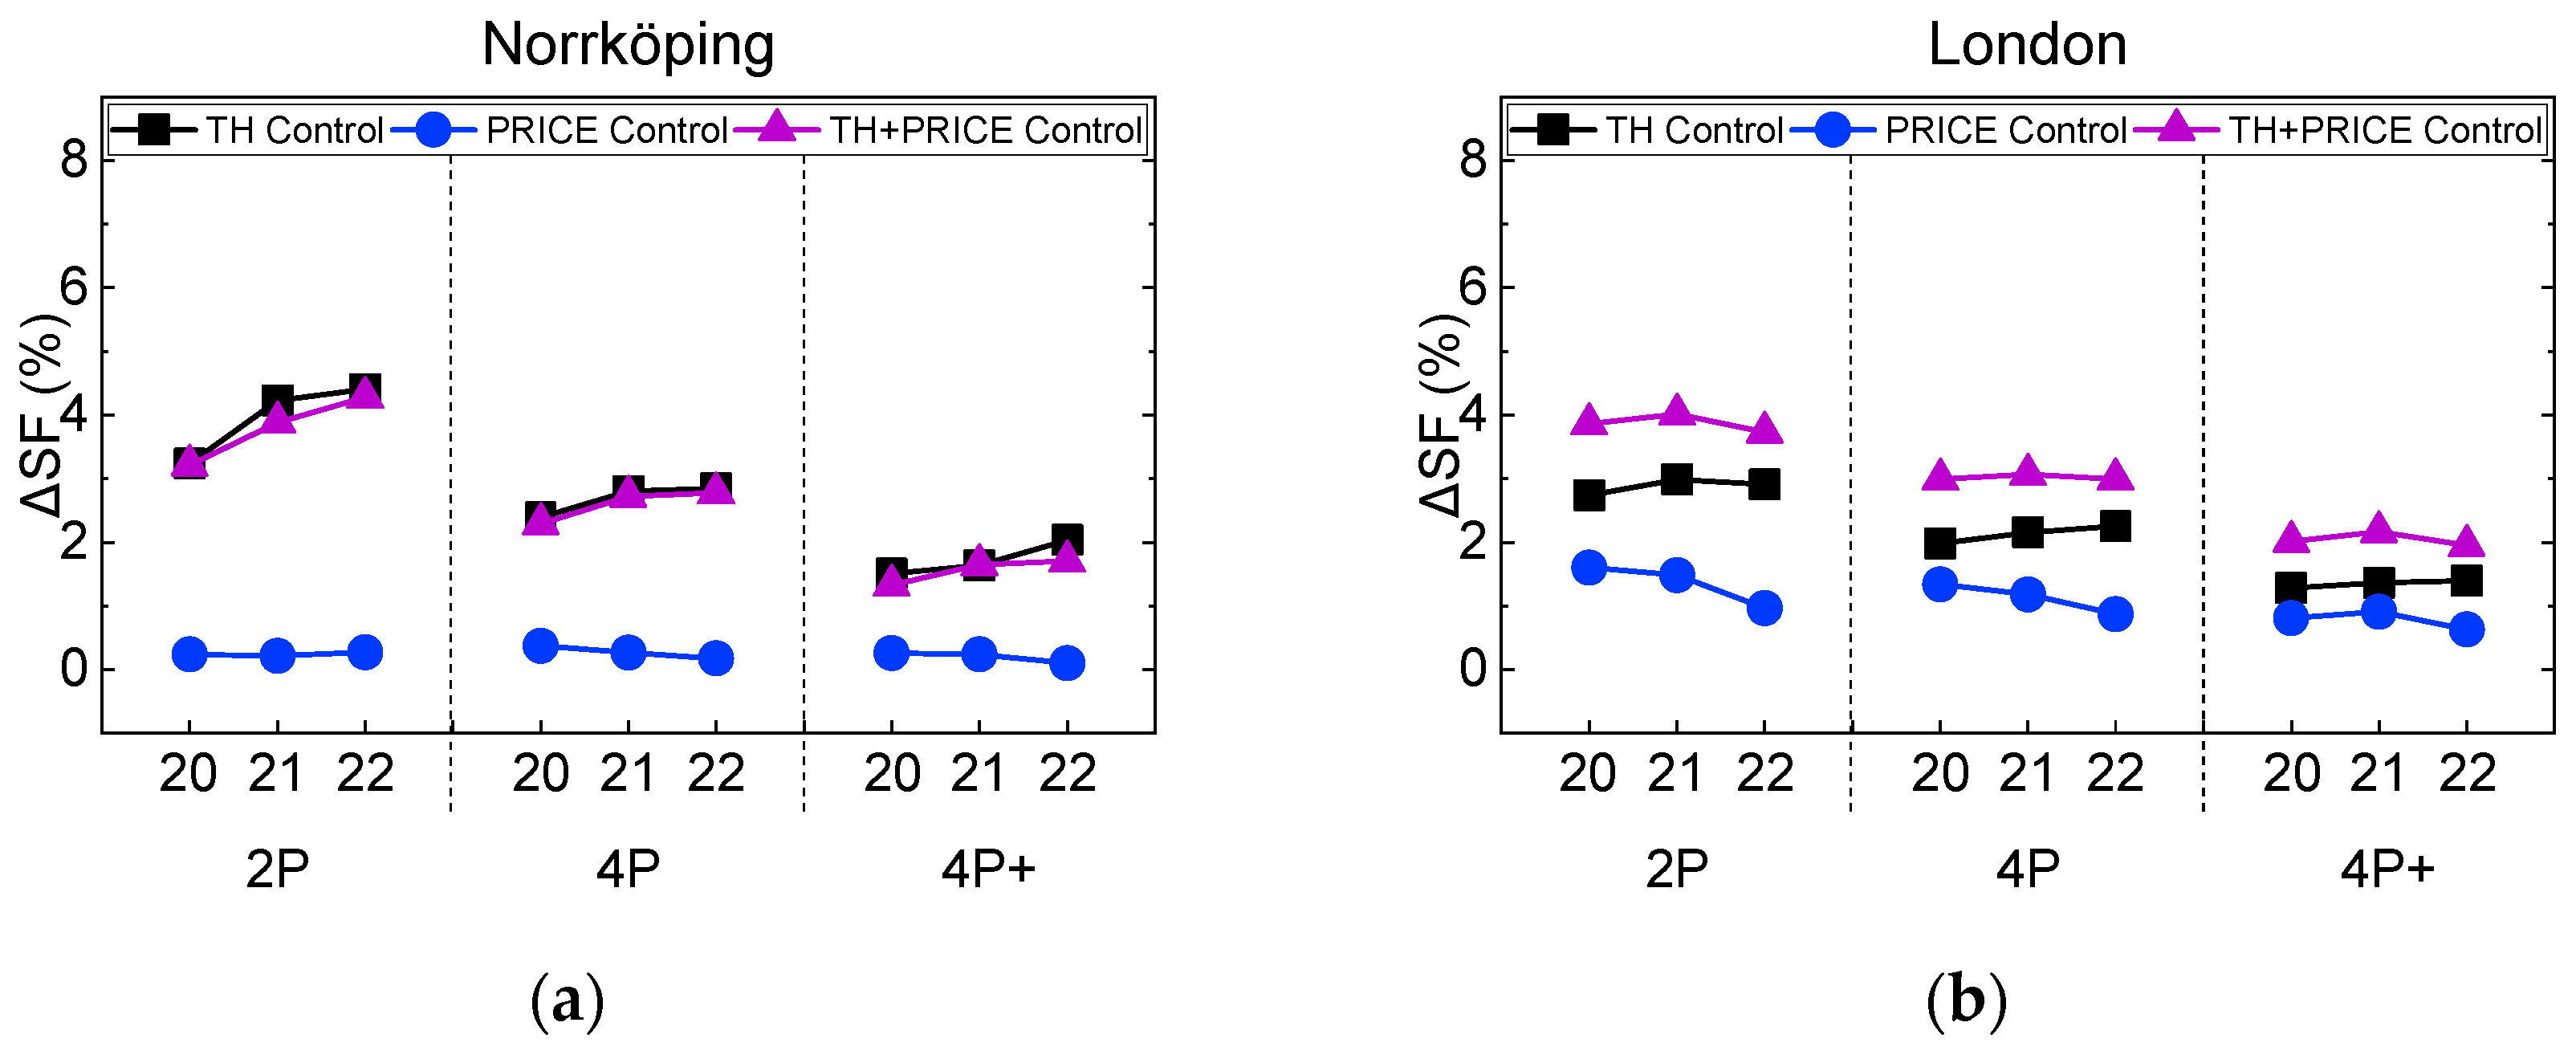
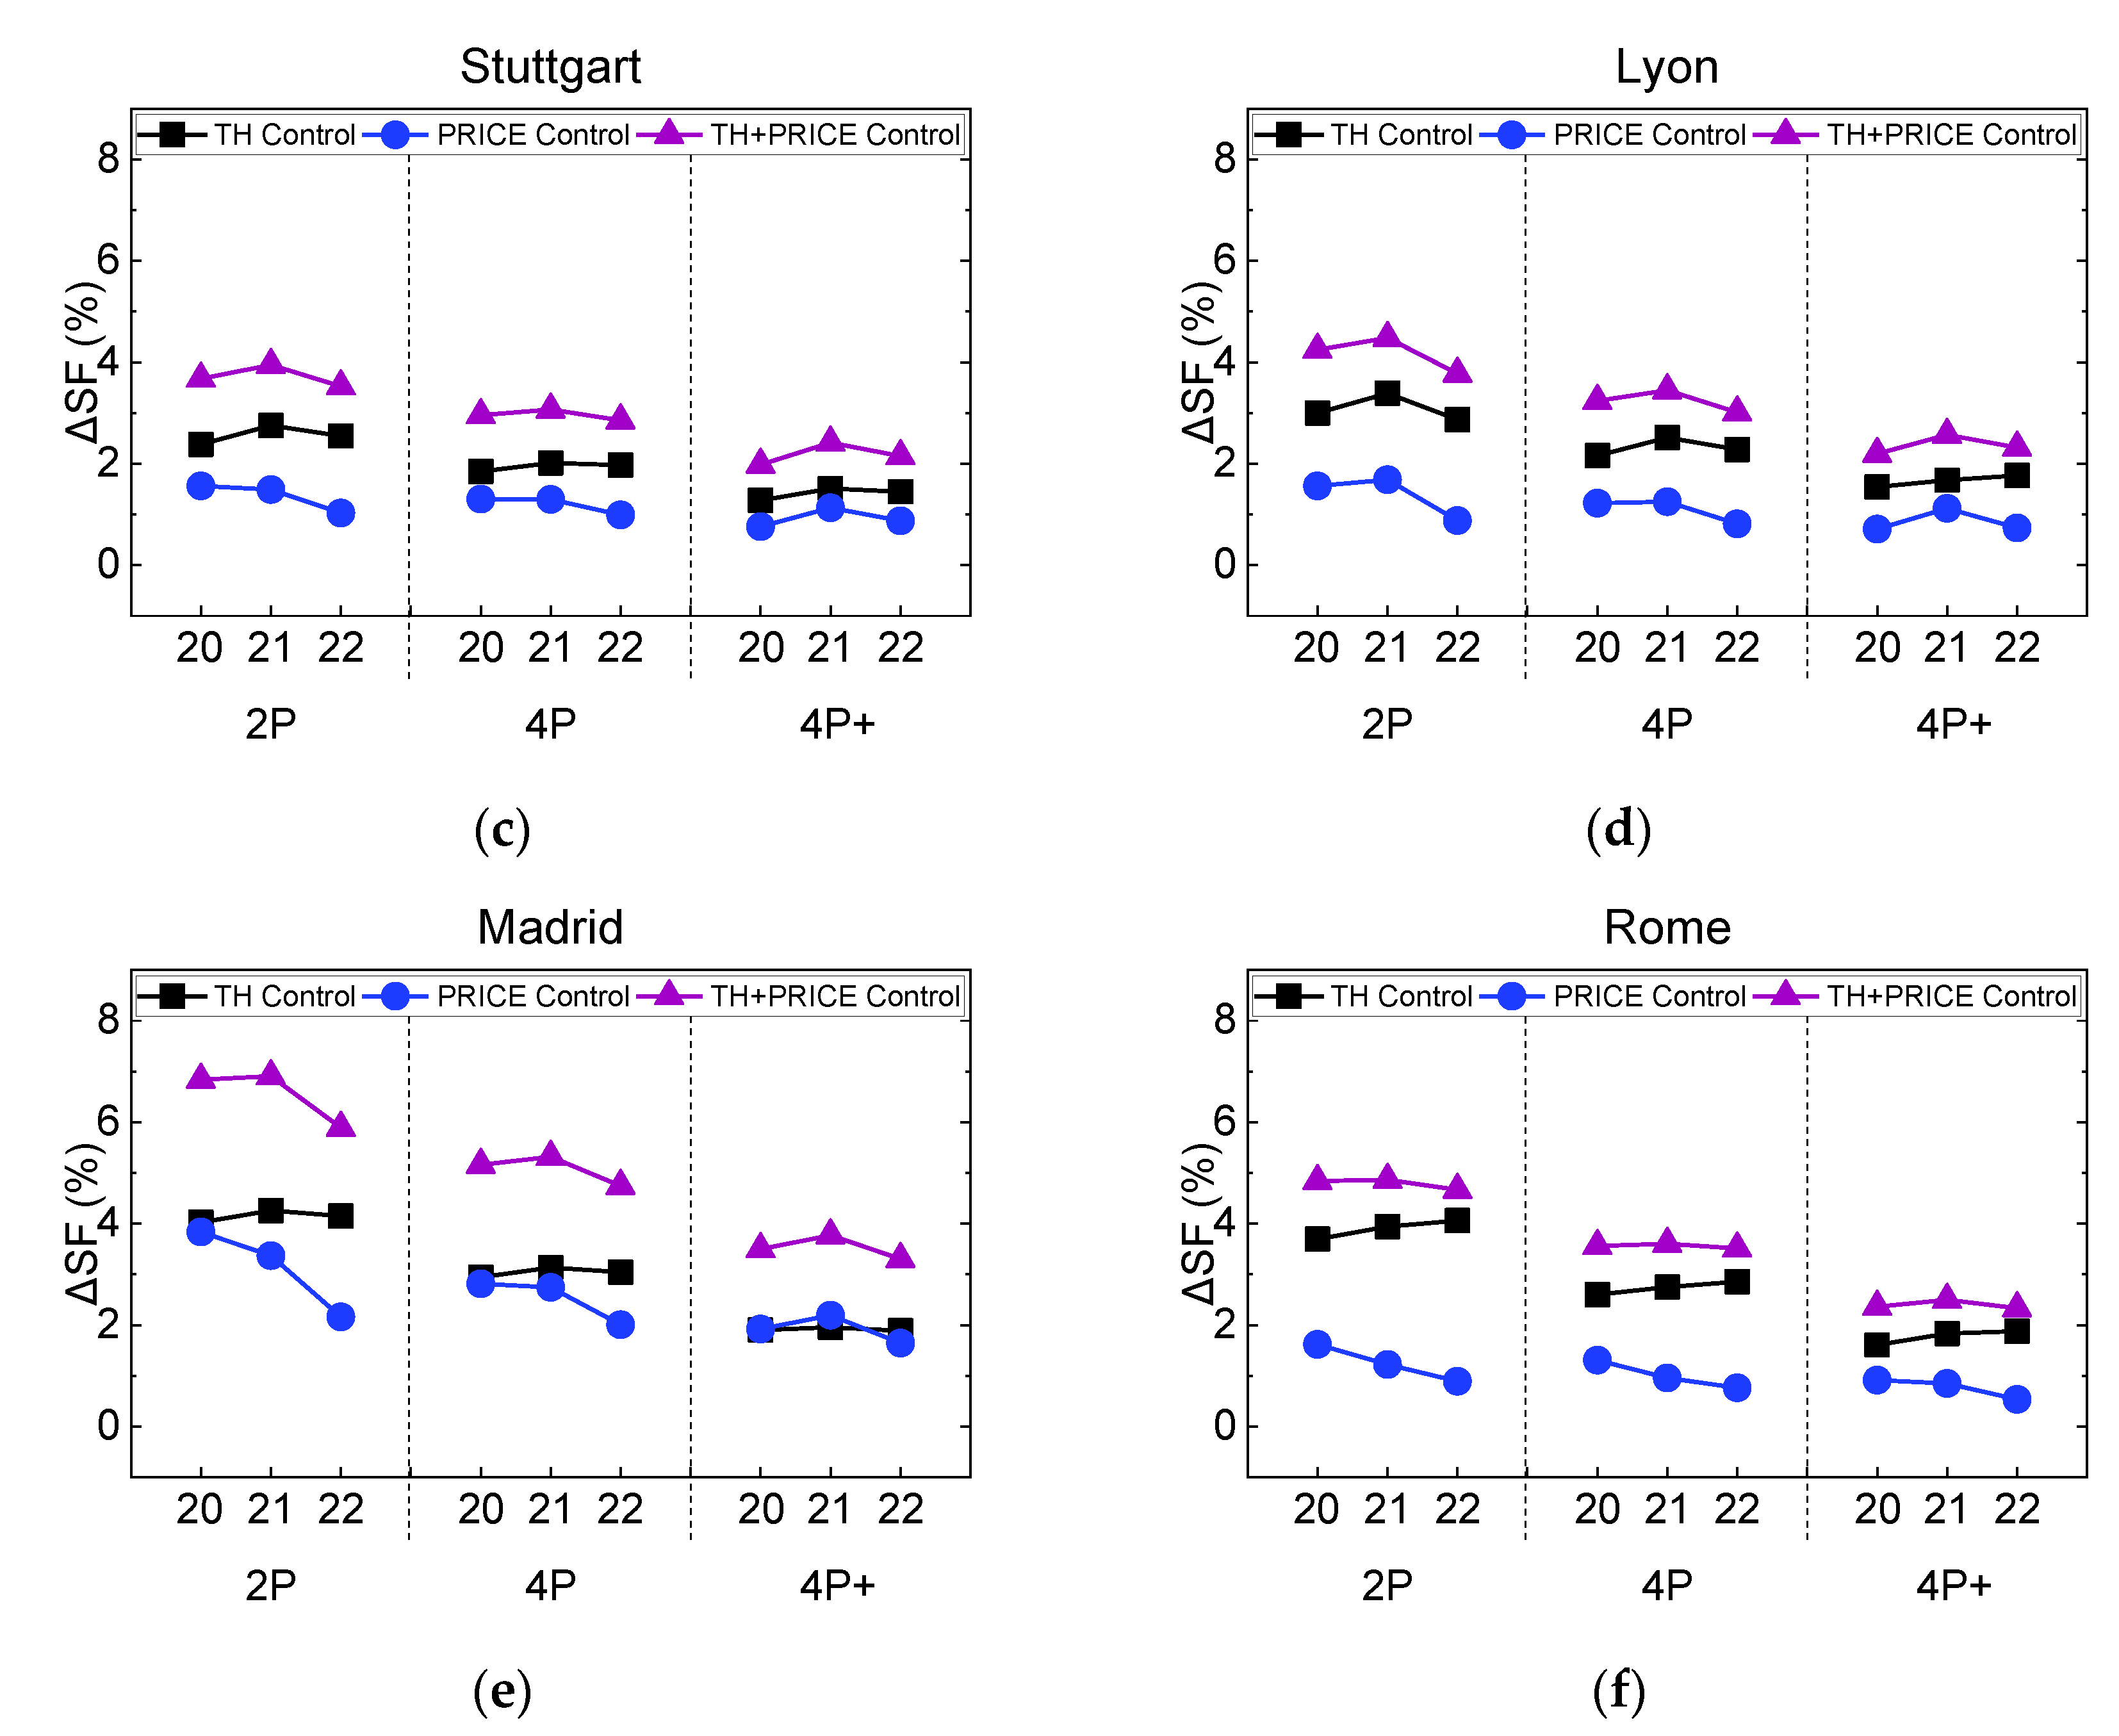
As with ΔSC, Figure 9 shows that ΔSF is not as great with higher appliance demands due to the reduced amount of excess PV production. This effect is again less apparent for the medium-sized PV system due to the greater availability of excess PV. The impact of PRICE mode in Sweden is quite negligible, while in the other locations, a marginal improvement or up to 2% in the performance is observed. However, in Spain, the system positively reacted in PRICE mode, resulting in a 2%–4% increase in SF. The PRICE mode is even more favorable for the medium-sized PV system in these countries, with ΔSF being as high in Spain as it is for the TH mode. Except for Sweden, where higher room set temperatures lead to greater ΔSF, the set temperature has little influence on ΔSF. In some examples, such as France, Spain, and less so in Germany, a room set temperature of 22 °C has lower ΔSF than for 21 °C.
For the TH mode (without PRICE mode), the increase in SF is slightly higher in Sweden, Spain, and Italy (up to 4%) than it is in the other countries (up to 3%). The combination of TH and PRICE leads to increases in SF that are nearly the same as the sum of the increases for implementing TH and PRICE separately, indicating that there is little conflict in these algorithms in terms of self-sufficiency.

4.2. Economic Analysis

As far as the economic evaluation of the NCOE of the household is concerned, a similar sensitivity analysis procedure is followed as with the key figures for the energy use performance.
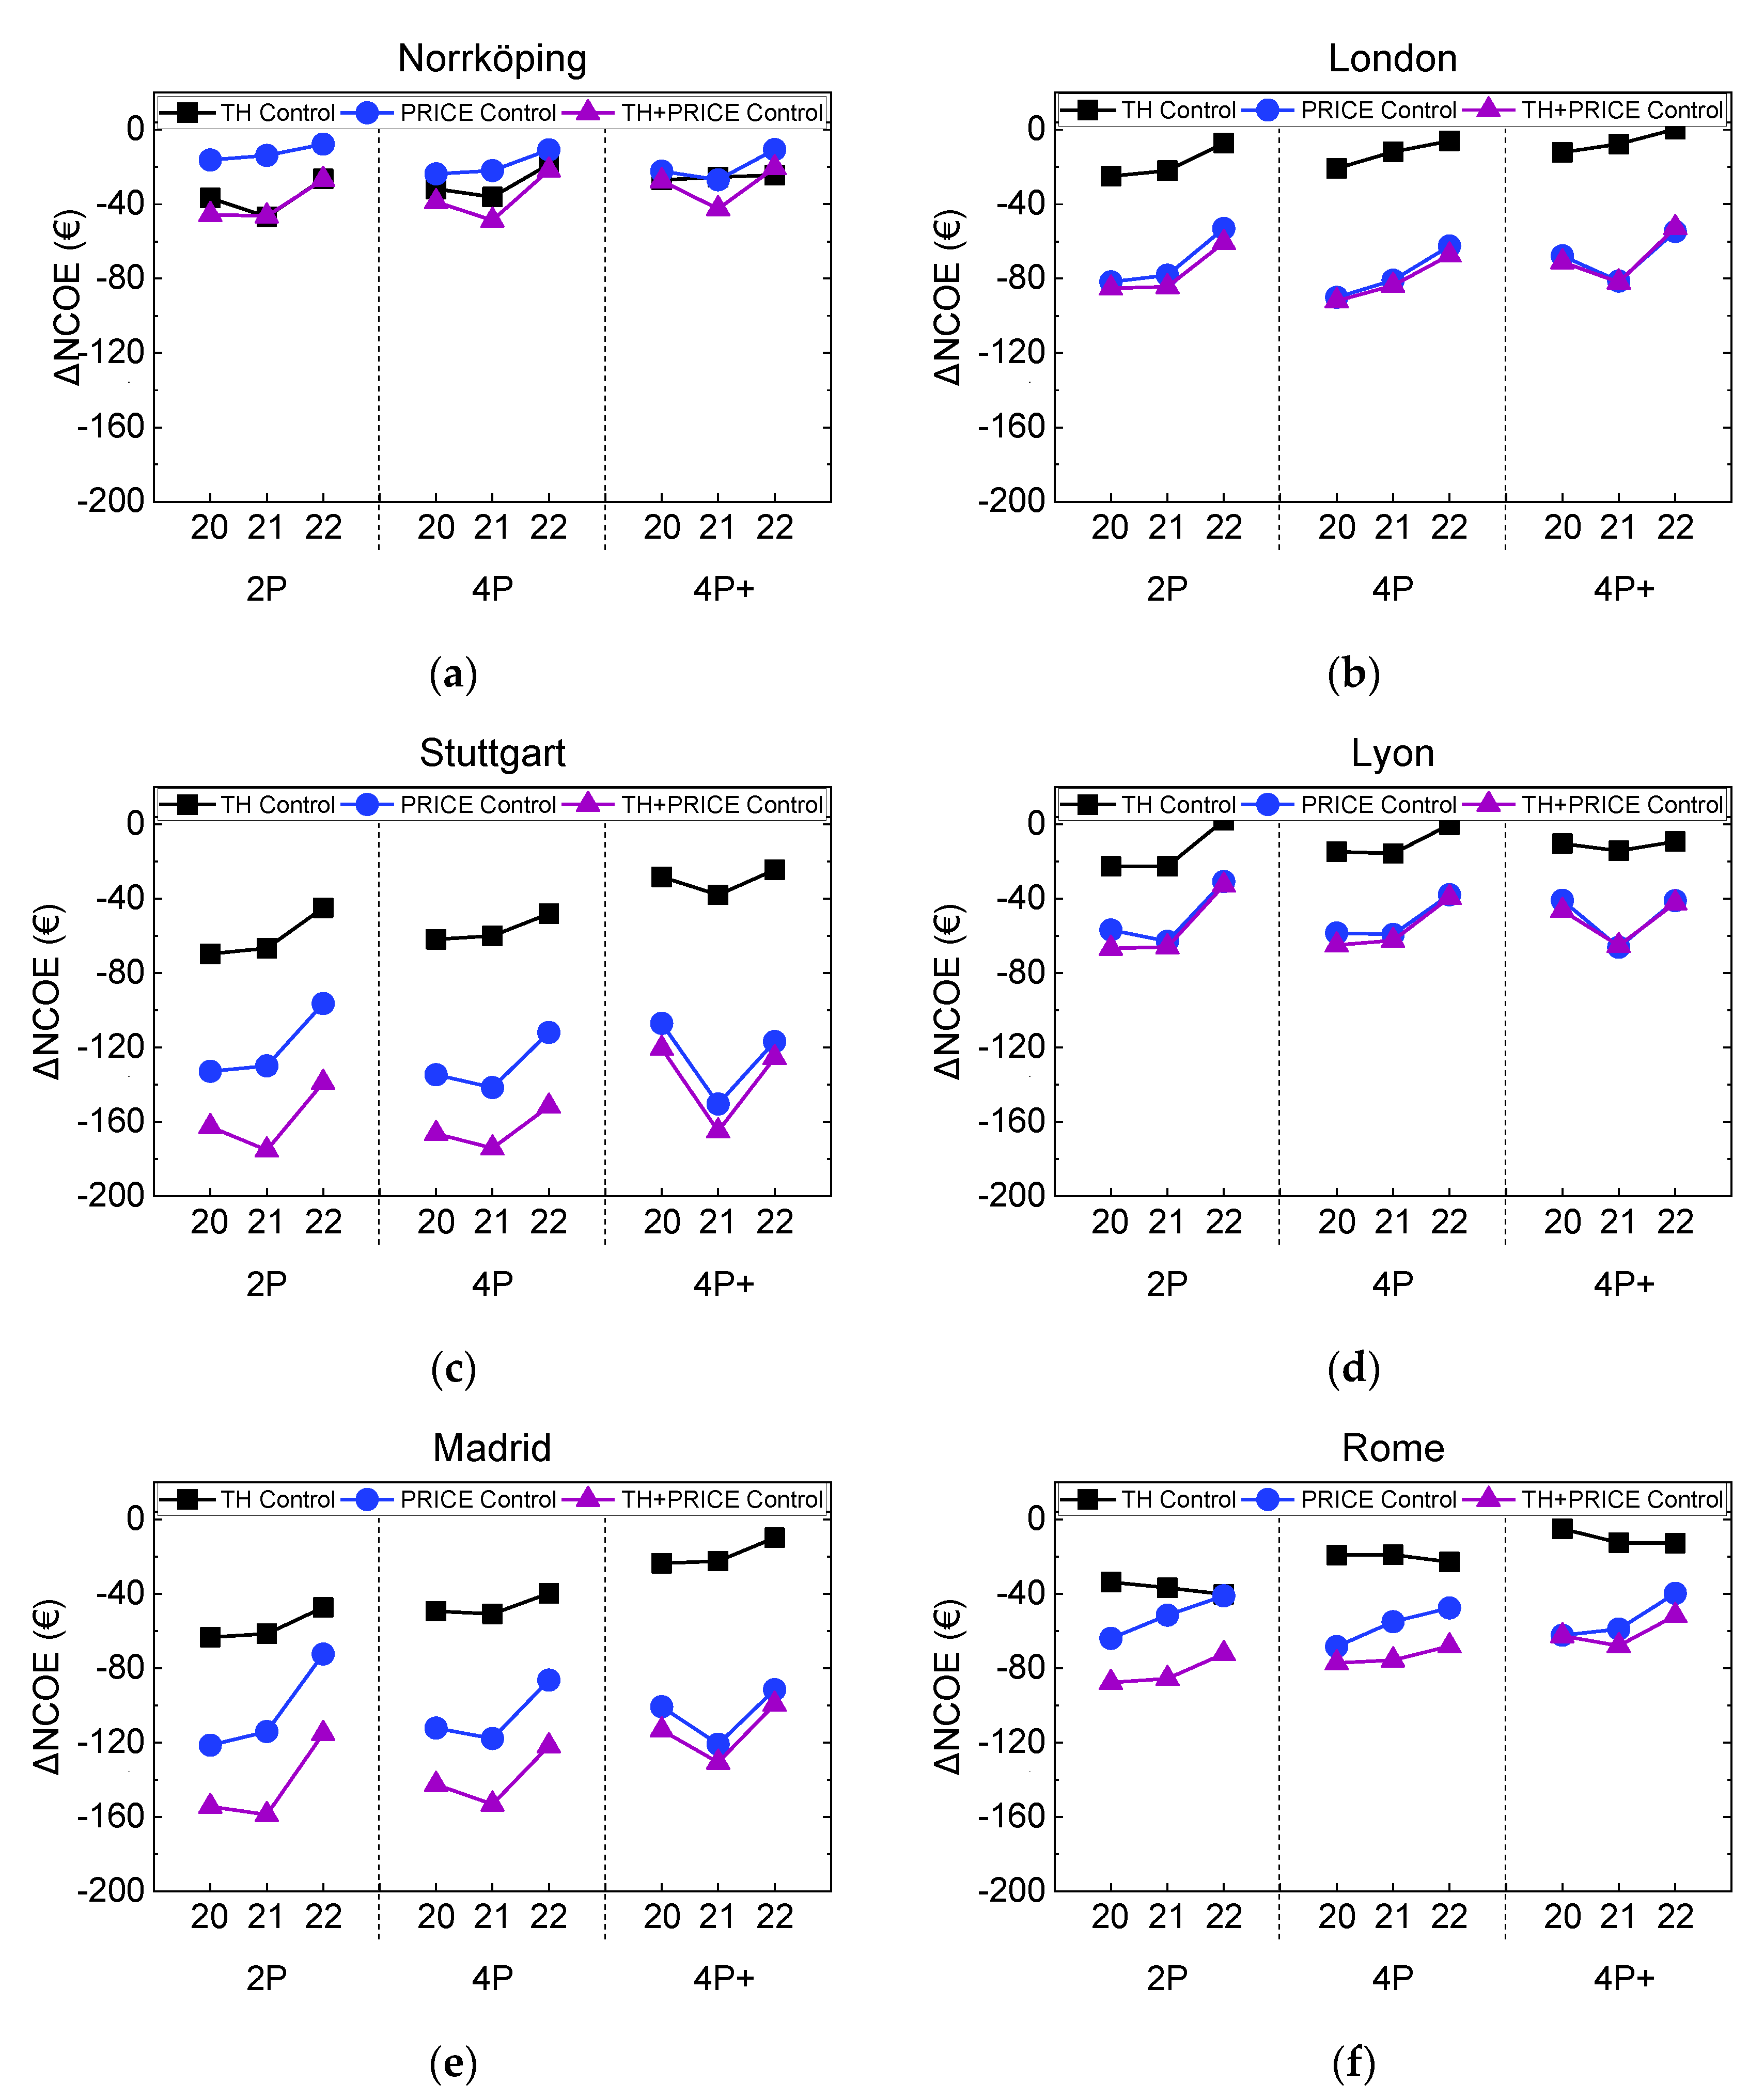
Figure 10 shows that TH control results in lower impact on cost savings compared to PRICE control, apart from for Norrköping, and that all locations apart from London and Lyon have some economic benefit from TH control of 20–60 €/yr. This benefit decreases with increasing appliance energy demand, which is interpreted as being due to lower available excess PV power. The cost savings are partly due to the prices when the algorithm is active but also due to the careful control of the auxiliary heater and reduced final energy (see Figure 6). Stuttgart and Madrid show the highest benefits of the PRICE mode, while Rome, London, and Lyon have significantly less. Norrköping again is the exception, with very low-cost savings. Increasing the zone setpoint by 1K (above the 21 °C) results in lower net cost savings in all cases. Figure 10 also shows that the increase in cost savings when applying both TH and PRICE control is nearly the sum of the savings for using the algorithms on their own, showing that there is some—but not much—conflict with one another.

4.3. Thermal Comfort

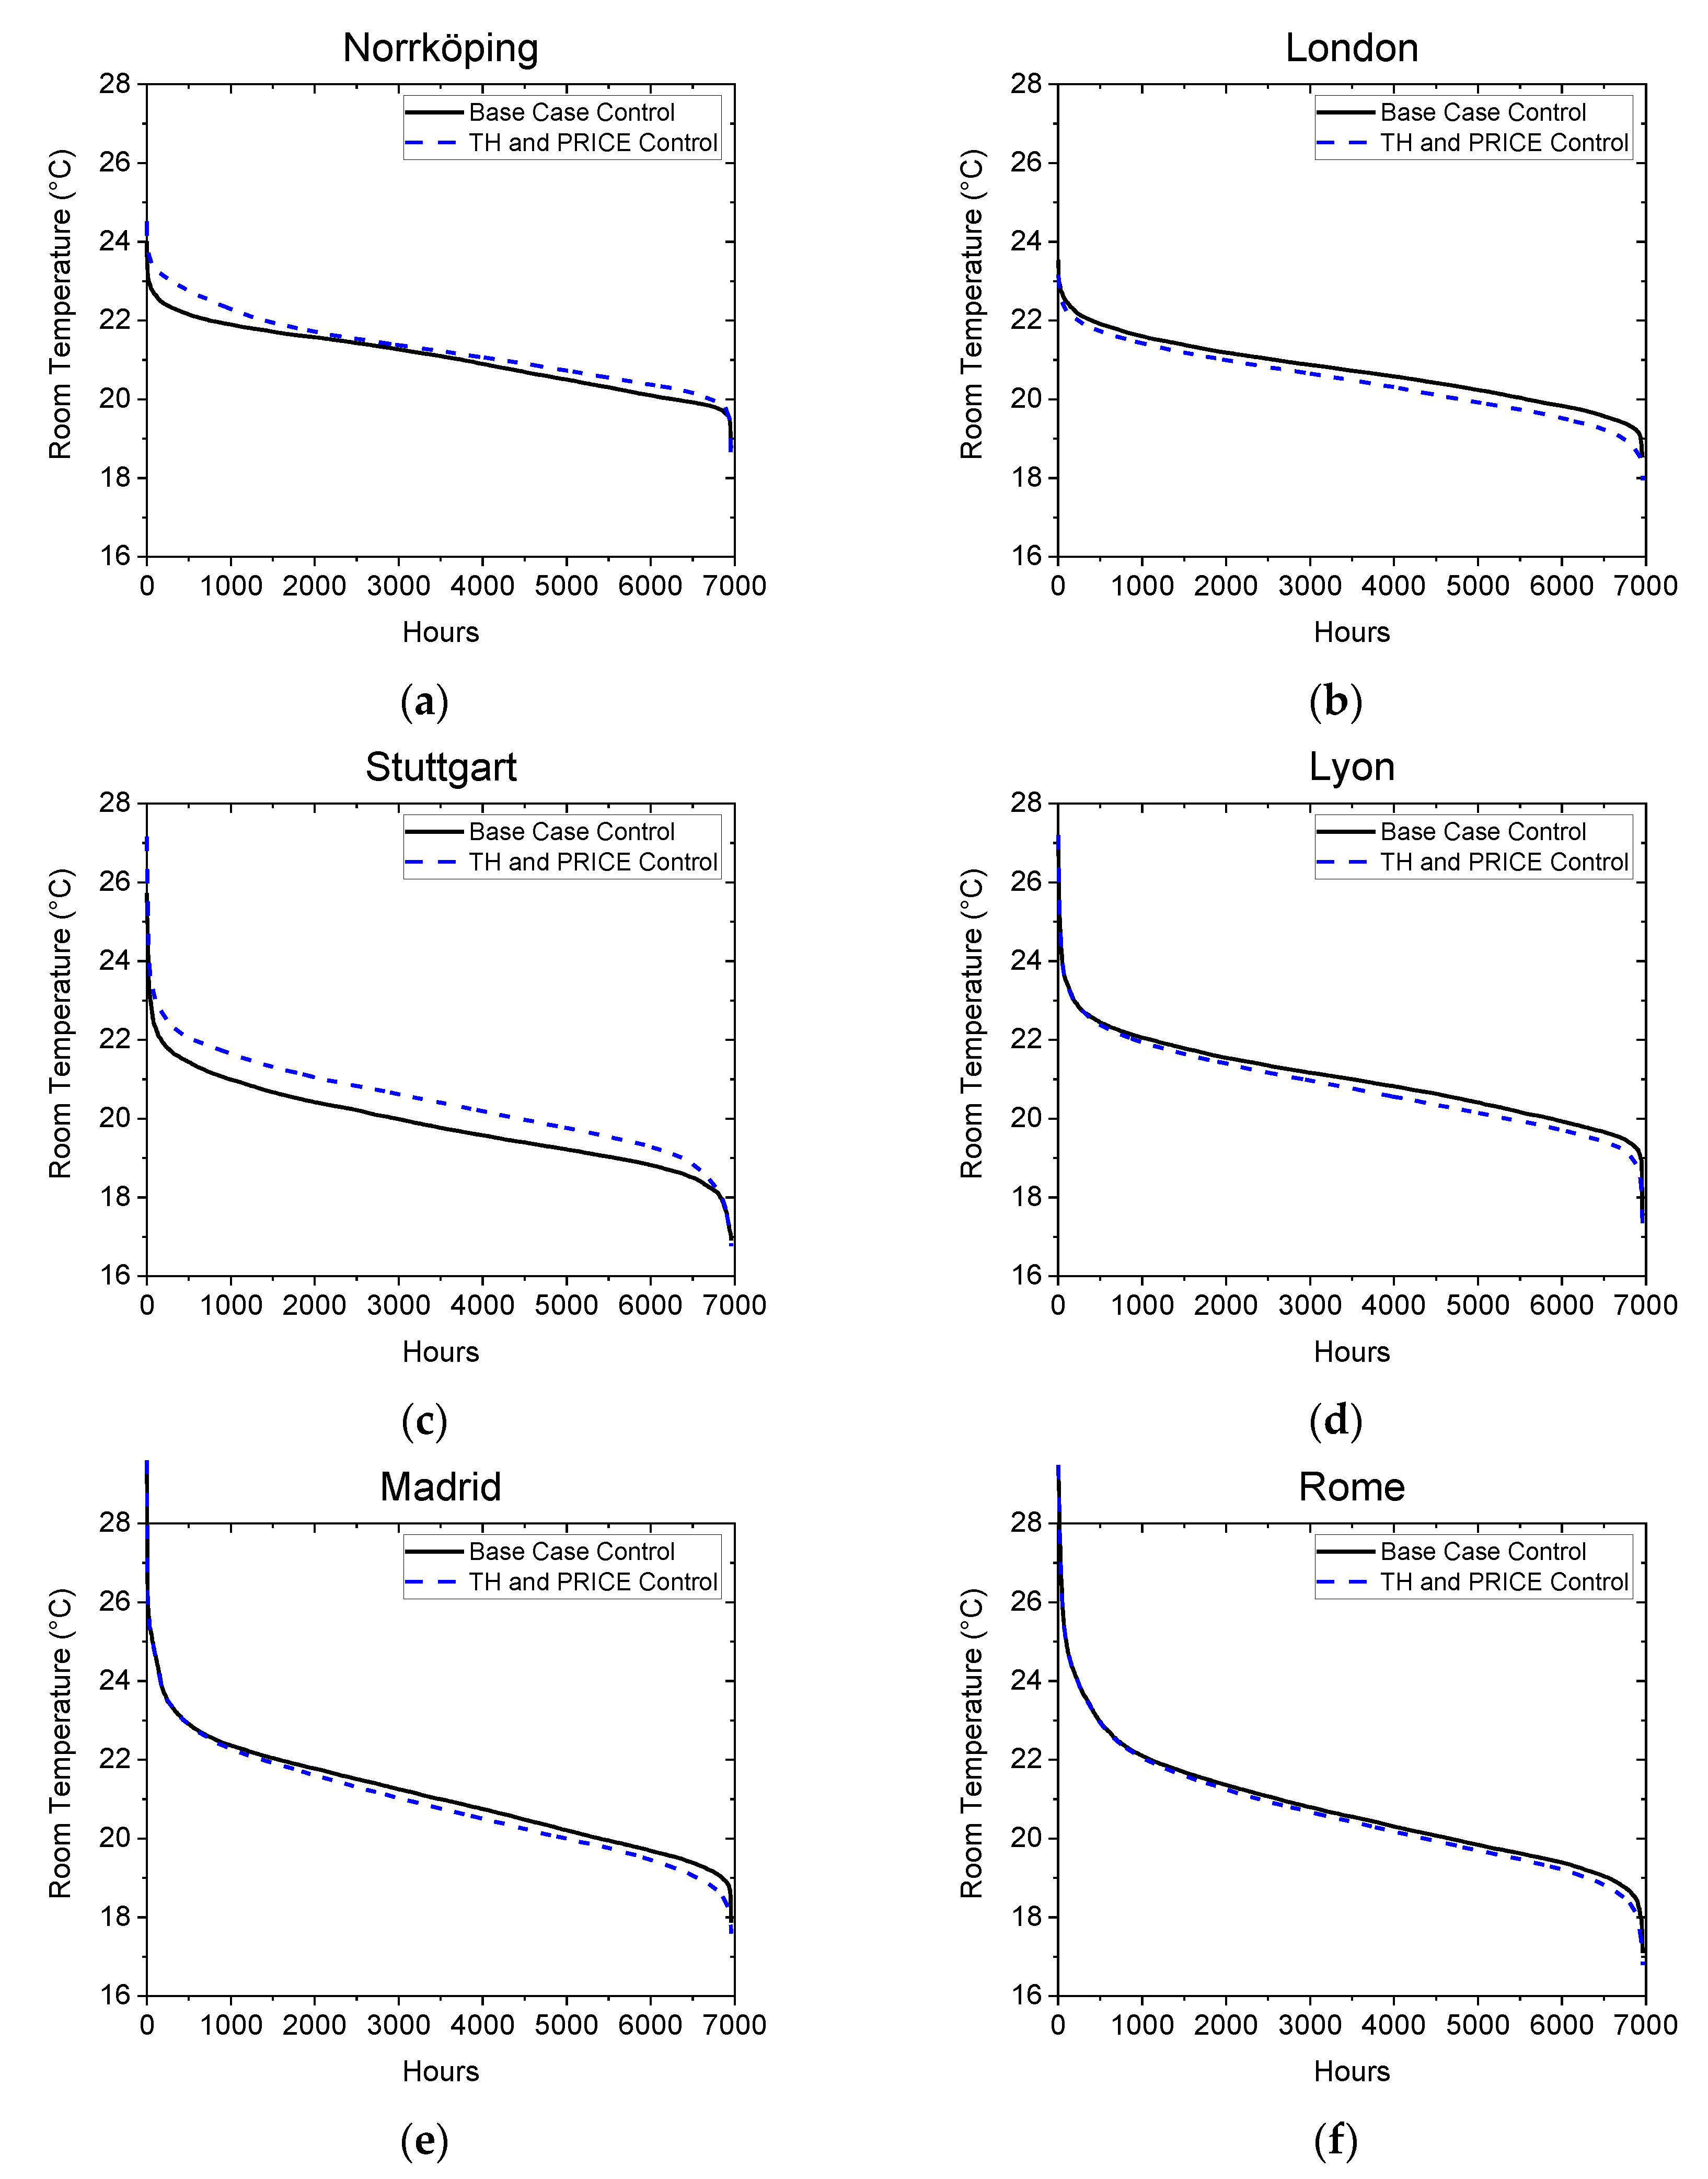
This section presents the results of the impact of the control strategies compared to the reference comfort quality. Especially for the cases of TH and PRICE control combined, which can result in either overheating or lowering the heating demand in a way that might not be acceptable for some end-users. Zone/room temperature is a metric to show this. Specifically, the hourly temperatures of the biggest zone of the building for the simulated heating seasons are shown in Figure 11 for the examined locations and for the setpoint zone temperature of 21 °C for an allowed overheating of 1K in the case of the TH mode.
Figure 11 shows that there is a tendency in Norrköpping as well as Stuttgart that the algorithms lead to overall increase in indoor temperature, indicating there is more overheating than reduced setpoint due to high spot market price. Overheating overall, more during the spring than the autumn. In Madrid, Rome, London and Lyon, however, there is a tendency for lower temperatures due to the impact of the HIGH PRICE mode. The variation in temperature is greater for London while it is less for Lyon that has higher electricity prices. Overall, in all locations, the changes in indoor temperature due to the control algorithms are relatively small (<1 °C). In locations where there is a great potential for solar radiation resources, such as Madrid and Rome, the room temperature can go above the average temperature due to higher solar gains, even during the heating season. However, it can be seen that at higher temperatures for these locations, no change in the room temperature is observed that has been caused by the advanced controls.

4.4. Discussion

In this study, the economic analysis is simplified based on the net cost of electricity, and no degradation or capital cost is included. Concerning the revenue calculation, since there is a diversity of regulations and incentives among the examined locations, the selected scenario for all countries is that the price the prosumer gets for selling to the grid is the spot market price. This does not reflect current reality; for example, France has a feed-in tariff instead of net metering, Spain removed subsidies for excess electricity to the grid for residential consumers in 2015 [39], and Sweden currently has a tax rebate for electricity fed into the grid. However, it allows for a clearer intercomparison and is a possible future scenario for all locations.
The greatest impact in final energy reduction due to the advanced control is in Madrid and Stuttgart, where prices are highest. However, this is a result related to the predictive rule-based logic for dynamic electricity price, which controls the heating demand and carefully minimizes the use of the auxiliary heater. In Madrid, due to many HIGH price periods (causing a temporary lower set temperature), the annual heating demand is reduced by 260 kWh compared to the total demand of 12.2 MWh, which is relatively little and does not impact on the thermal comforts significantly, and is consistent with the slightly lower temperatures seen in Figure 9 and Figure 10. Due to the careful control of the auxiliary heater, the annual electricity used for this is reduced by 716 kWh, while the compressor electricity is increased by 145 kWh to compensate. This is an important factor in the results for all key figures shown, including the net cost of electricity (NCOE).
For cost savings, however, things are more complex as the result depends not only on how often the PRICE mode is active (i.e., how often there are HIGH and LOW prices), but also on how large the spot price differences are during the day and when they occur. Figure 6 shows that the timing of the electricity price peaks and troughs during the day are similar in all countries, but that their magnitude varies significantly. Sweden has the lowest variation, which is consistent with the fact the cost savings are lowest in Norrköping. Italy has very high price variation during the day, looking at average values for the year, but significantly lower cost savings compared to Germany and Spain. This is due to the fact that for Rome, relatively little final energy is saved and, thus, there is a smaller cost saving.
The simulations have all been done assuming no feed-in subsidies and assuming that prosumers can buy and sell their electricity on an hourly basis, with the price closely linked to the spot market price. This is not the case in any of the countries at present. Thus, the economic results of this study should be viewed as potential savings rather than those possible with existing regulations as well as tariff and tax structures. Additionally, price data for the year 2015 have been used. With increasing deployment of renewable energy and increasing interaction of the grid and prosumers, the spot market price variations are likely to be different in the future. This has not been taken into account in the study, principally because there are so many uncertainties around this point.
The parameters for the algorithms were optimized for Norrköping and the same parameters were used for all locations. It is possible that better results can be achieved for the other locations by optimizing the parameters specifically for those boundary conditions. However, this is out of scope of this study and would be good to follow up in the future. Similarly, the results are for only one year. It is to be expected that there would be a significant variation from year to year as both weather and spot market prices vary from year to year but, again, this is out of scope for this paper. The weather affects both the demand for the system (temperature and passive solar radiation gains) as well as PV production. It also indirectly affects the spot market price by varied availability of renewable electricity (hydro, wind, and PV).

5. Conclusions

Advanced control for increasing the self-consumption of PV electricity in a single-family house (TH mode) by using thermal storage as well as the use of varying spot market price for reducing heating costs (PRICE mode) for a compact exhaust air heat pump system have been developed. A model of the system and the controls has been made in TRNSYS and then been used to make annual simulations for a wide range of boundary conditions: six locations; three indoor set temperatures; three hot water and appliance use profiles of different magnitudes; as well as two different PV system sizes, with and without battery. In all cases, a modern single-family house was used, built to the thermal standard of local building regulations. Due to the variation in local building regulations, the difference in electricity demand between the locations is not as large as might be expected, ranging from 8.6 MWh (Rome) to 12.4 MWh (Stuttgart) for the default values of boundary conditions.
The impact of the control algorithms compared to a system with the same PV and battery system has been calculated for several key figures and presented in the paper. The results show that there are a number of general trends, but there are also large differences between locations. It was found that the trends are the same for a system with and without battery, although the absolute values differ considerably. It was also found that the main trends were the same for the two PV sizes simulated, apart from for some impacts due to the amount of available excess electricity after normal loads have been supplied. Due to the careful design of the advanced control algorithms, the use of the auxiliary electric heater could be reduced, which has a major (positive) impact on the results. In the following conclusions, focus is given on the impact of the advanced algorithms rather than the absolute values, as this is the focus of the paper.
The impact of the TH mode to the self-consumption increase varies among the examined climates. Sweden shows the highest increase by 13% and 10% for the small- and medium-sized PV system, respectively, for the occupancy of two persons. A linear decrease in the impact on self-consumption is observed for all locations as the occupancy profile becomes greater. This is caused by the decreasing amount of excess PV electricity available.
As far as the solar fraction (SF) or self-sufficiency is concerned, in all locations except Sweden and Italy, PRICE mode has a lower impact than TH mode, and in Sweden, the impact is quite negligible.
It is found that the PRICE mode results in higher final energy use savings than the TH mode in all locations apart from Sweden, which is not to be expected as it is designed to overheat when the price is low and use reduced heat when the price is high. The reduction is mostly due to the intelligent control of the electric auxiliary heater, resulting in less use than in the normal control mode. The benefit of using both control modes is not quite additive, showing that there is some—but not much—conflict between the modes.
The impact of the advanced control on cost savings varies greatly, with large savings (up to 175 €) possible in Spain and in Germany, which has the second highest electricity cost of the locations and with small savings possible in Norrköping (<50 €). Moreover, in practice, the implementation of the control algorithms would have minimal capital and no running cost for the end-users. As with the impact on changes in final energy, it is only in Sweden that the TH mode leads to greater savings in cost than the PRICE mode, while in London, Lyon, and Rome, the difference between the modes is not that great. There is also a more consistent trend than for the other key figures that cost savings are lower when the indoor set temperature is higher. The impact on cost savings is also lower the higher the demand for appliances.
A follow-up investigation could study the life cycle cost of the energy storage components, such as the thermal storage, in comparison with electrical storage, since this was beyond the scope of this study. Moreover, the flexibility of the rule-based algorithms could be enhanced, and the parameters for the algorithms could be optimized for more than one location since they were only optimized for Norrköping, Sweden.

Author Contributions

Conceptualization, E.P., F.J. and C.B.; methodology, E.P., F.J. and C.B.; software, E.P., and F.J.; formal analysis, E.P., F.J and C.B.; resources, F.J., and J.W.; data curation, F.J.; writing—original draft preparation, E.P. and F.J.; writing—review and editing C.B. and J.W.; visualization, E.P. and F.J.; supervision, C.B. and J.W.; project administration, C.B.; funding acquisition, C.B. All authors have read and agreed to the published version of the manuscript.

Funding

This work is funded by the Knowledge foundation KK-Stiftelsen (grant number) 20160171.

Conflicts of Interest

The authors declare no conflict of interest.

References

  1. EU Directive 2018/2001 on the Promotion of the Use of Energy from Renewable Sources. Available online: https://eur-lex.europa.eu/legal-content/EN/TXT/HTML/?uri=CELEX:32018L2001&from=EN (accessed on 2 May 2019).
  2. Eurostat. Energy Consumption in Households EU-28. 2016. Available online: https://ec.europa.eu/eurostat/statisticsexplained/index.php?title=Energy_consumption_in_households#Energy_consumption_in_households_by_type_of_end-use (accessed on 2 May 2019).
  3. EHPA. Available online: https://www.google.com/search?client=firefox-ab&q=Axell+M%2C+Karlsson+F.+IEA+Heat+Pump+Centre%2C+Europe%3A+Heat+pumps%E2%80%94Status+and+trends (accessed on 30 April 2019).
  4. Psimopoulos, E.; Bee, E.; Widen, J.; Bales, C. Techno-economic analysis of control algorithms for an exhaust air heat pump system for detached houses coupled to a photovoltaic system. Appl. Energy 2019, 249, 355–367. [Google Scholar] [CrossRef]
  5. Arteconi, A.; Hewitt, N.J.; Polonara, F. Domestic demand-side management (DSM): Role of heat pumps and thermal energy storage (TES) systems. Appl. Therm. Eng. 2013, 51, 155–165. [Google Scholar] [CrossRef]
  6. Thür, A.; Calabrese, T.; Streicher, W. Smart grid and PV driven ground heat pump as thermal battery in small buildings for optimized electricity consumption. Sol. Energy 2018, 174, 273–285. [Google Scholar] [CrossRef]
  7. Dar, U.I.; Sartori, I.; Georges, L.; Novakovic, V. Advanced control of heat pumps for improved flexibility of Net-ZEB towards the grid. Energy Build. 2014, 69, 74–84. [Google Scholar] [CrossRef]
  8. Schibuola, L.; Scarpa, M.; Tambani, C. Demand response management by means of heat pumps controlled via real time pricing. Energy Build. 2015, 90, 15–28. [Google Scholar] [CrossRef]
  9. Alimohammadisagvand, B.; Jokisalo, J.; Sirén, K. Comparison of four rule-based demand response control algorithms in an electrically and heat pump-heated residential building. Appl. Energy 2017, 209, 167–179. [Google Scholar] [CrossRef] [Green Version]
  10. Fischer, D.; Bernhardt, J.; Madani, H.; Wittwer, C. Comparison of control approaches for variable speed air source heat pumps considering time variable electricity prices and PV. Appl. Energy 2017, 204, 93–105. [Google Scholar] [CrossRef]
  11. Beck, T.; Kondziella, H.; Huard, G.; Bruckner, T. Optimal operation, configuration and sizing of generation and storage technologies for residential heat pump systems in the spotlight of self-consumption of photovoltaic electricity. Appl. Energy 2016, 188, 604–619. [Google Scholar] [CrossRef]
  12. Rodríguez, L.R.; Ramos, J.S.; Domínguez, S.Á.; Eicker, U. Contributions of heat pumps to demand response: A case study of a plus-energy dwelling. Appl. Energy 2018, 214, 191–204. [Google Scholar] [CrossRef] [Green Version]
  13. Salpakari, J.; Lund, P. Optimal and rule-based control strategies for energy flexibility in buildings with PV. Appl. Energy 2015, 161, 425–436. [Google Scholar] [CrossRef] [Green Version]
  14. Schopfer, S.; Tiefenbeck, V.; Staake, T. Economic assessment of photovoltaic battery systems based on household load profiles. Appl. Energy 2018, 223, 229–248. [Google Scholar] [CrossRef]
  15. Quoilin, S.; Kavvadias, K.; Mercier, A.; Pappone, I.; Zucker, A. Quantifying self-consumption linked to solar home battery systems: Statistical analysis and economic assessment. Appl. Energy 2016, 182, 58–67. [Google Scholar] [CrossRef]
  16. Fedrizzi, R.; Dipasquale, C.; Bellini, A.; Gustafsson, M.; Bales, C.; Ochs, F.; Dermentzis, G.; Nouvel, R.; Cotrado, M. D6.3b Performance of the Studied Systemic Renovation Packages-Single Family Houses. Available online: http://urn.kb.se/resolve?urn=urn:nbn:se:du-29988 (accessed on 15 March 2020).
  17. Bee, E.; Prada, A.; Baggio, P.; Psimopoulos, E. Air-source heat pump and photovoltaic systems for residential heating and cooling: Potential of self-consumption in different European climates. Build. Simul. 2019, 12, 453. [Google Scholar] [CrossRef]
  18. Felten, B.; Weber, C. The value(s) of flexible heat pumps—Assessment of technical and economic conditions. Appl. Energy 2018, 228, 1292–1319. [Google Scholar] [CrossRef]
  19. Nord Pool, Market Data. Available online: https://www.nordpoolgroup.com/Market-data1/#/nordic/table (accessed on 3 April 2019).
  20. Epex Spot, Market Data. Available online: https://www.epexspot.com (accessed on 3 April 2019).
  21. IRENA (2019). Future of Solar Photovoltaic: Deployment, Investment, Technology, Grid Integration and Socio-Economic Aspects (A Global Energy Transformation: Paper), International Renewable Energy Agency, Abu Dhabi. Available online: https://www.irena.org/-/media/Files/IRENA/Agency/Publication/2019/Nov/IRENA_Future_of_Solar_PV_2019.pdf (accessed on 12 December 2019).
  22. Klein, S.A.; Beckman, W.A.; Mitchell, J.W.; Duffie, J.A.; Duffie, N.A.; Freeman, T.L.; Mitchell, J.C.; Braun, J.E.; Evans, B.L.; Kummer, J.P.; et al. Trnsys Users Manual, Version 17; University of Wisconsin Solar Energy Laboratory: Madison, WI, USA, 2010; Volume 4. [Google Scholar]
  23. Widén, J.; Lundh, M.; Vassileva, I.; Dahlquis, E.; Ellegård, K.; Wäckelgård, E. Constructing load profiles for household electricity and hot water from time-use data—Modelling approach and validation. Energy Build. 2009, 41, 753–768. [Google Scholar] [CrossRef]
  24. Wyrsch, N.; Riesen, Y.; Balif, C. Effect of the fluctuations of PV production and electricity demand on the PV electricity self-consumption. In Proceedings of the 28th EU PVSEC, Paris, France, 30 September–4 October 2013. [Google Scholar]
  25. Persson, T.; Heier, J. Småhusens framtida utformning: Hur påverkar Boverkets nya byggregler? [How Do the New Swedish Building Codes Affect Detached Houses of the Future?]; Region Gävleborg: Gävle, Sweden, 2010. [Google Scholar]
  26. Leppin, L. Development of Operational Strategies for a Heating Pump System with Photovoltaic, Electrical and Thermal Storage. Bachelor’s Thesis, Dalarna University, Borlänge, Sweden, 2017. urn:nbn:se:du-27304. [Google Scholar]
  27. Bales, C.; Betak, J.; Broum, M.; Chèze, D.; Cuvillier, G.; Haberl, R.; Hafner, B.; Haller, M.; Hamp, Q.; Heinz, A.; et al. Optimized Solar and Heat Pump Systems, Components and Dimensioning: MacSheep—New Materials and Control for a Next Generation of Compact Combined Solar and Heat Pump Systems with Boosted Energetic and Exergetic Performance. Available online: http://www.macsheep.spf.ch/ (accessed on 20 April 2019).
  28. Bletterie, B.; Bründlinger, R.; Lauss, G. On the characterisation of PV inverters’ efficiency—Introduction to the concept of achievable efficiency. Prog. Photovolt. 2011, 19, 423–435. [Google Scholar] [CrossRef]
  29. Luthander, R.; Widén, J.; Nilsson, D.; Palm, J. Photovoltaic self-consumption in buildings: A review. Appl. Energy 2015, 142, 80–94. [Google Scholar] [CrossRef] [Green Version]
  30. Kuhn, T.; Fath, K.; Bales, C.; Gustafsson, M.; Nouvel, R.; Fedrizzi, R. “D2.3 RES Availability Survey and Boundary Conditions for Simulations”. 2014. Available online: https://www.semanticscholar.org/paper/D2.3-RES-availability-survey-and-boundary-for-Kuhn-Fath/48799f59b1d94a93b9df6d4f16dcf0b6450e3d63. (accessed on 12 December 2019).
  31. Copernicus Atmosphere Monitoring Service (CAMS). Available online: https://atmosphere.copernicus.eu/ (accessed on 20 April 2019).
  32. Modern-Era Retrospective Analysis for Research and Applications, (MERRA-2) Service. Available online: https://gmao.gsfc.nasa.gov/reanalysis/MERRA-2/ (accessed on 20 April 2019).
  33. TABULA Webtool. National Building Codes. Available online: http://episcope.eu/building-typology/country/ (accessed on 20 December 2019).
  34. Concerted Action, Energy Performance of Buildings Directive. Available online: https://epbd-ca.eu/ca-outcomes. (accessed on 24 February 2020).
  35. Spain, National Regulations (CTE-HE). 2006. Available online: https://www.codigotecnico.org/index.php/menu-ahorro-energia.html (accessed on 25 February 2020).
  36. Widén, J.; Wäckelgård, E. A high-resolution stochastic model of domestic activity patterns and electricity demand. Appl. Energy 2010, 87, 1880–1892. [Google Scholar] [CrossRef]
  37. International Organization for Standardization. (2005) Ergonomics of the Thermal Environment—Analytical Determination and Interpretation of Thermal Comfort Using Calculation of the PMV and PPD Indices and Local Thermal Comfort Criteria (ISO Standard no.7730:2005). Available online: https://www.iso.org/obp/ui/#iso:std:iso:7730:ed-3:v1:en, (accessed on 11 August 2018).
  38. Electricity Prices Components for Household Consumers-Annual Data (from 2007 Onwards) Eurostat. Available online: http://appsso.eurostat.ec.europa.eu/nui/submitViewTableAction.do (accessed on 3 October 2019).
  39. López Prol, J.; Steininger, K.W. Photovoltaic self-consumption regulation in Spain: Profitability analysis and alternative regulation schemes. Energy Policy 2017, 108, 742–754. [Google Scholar] [CrossRef]
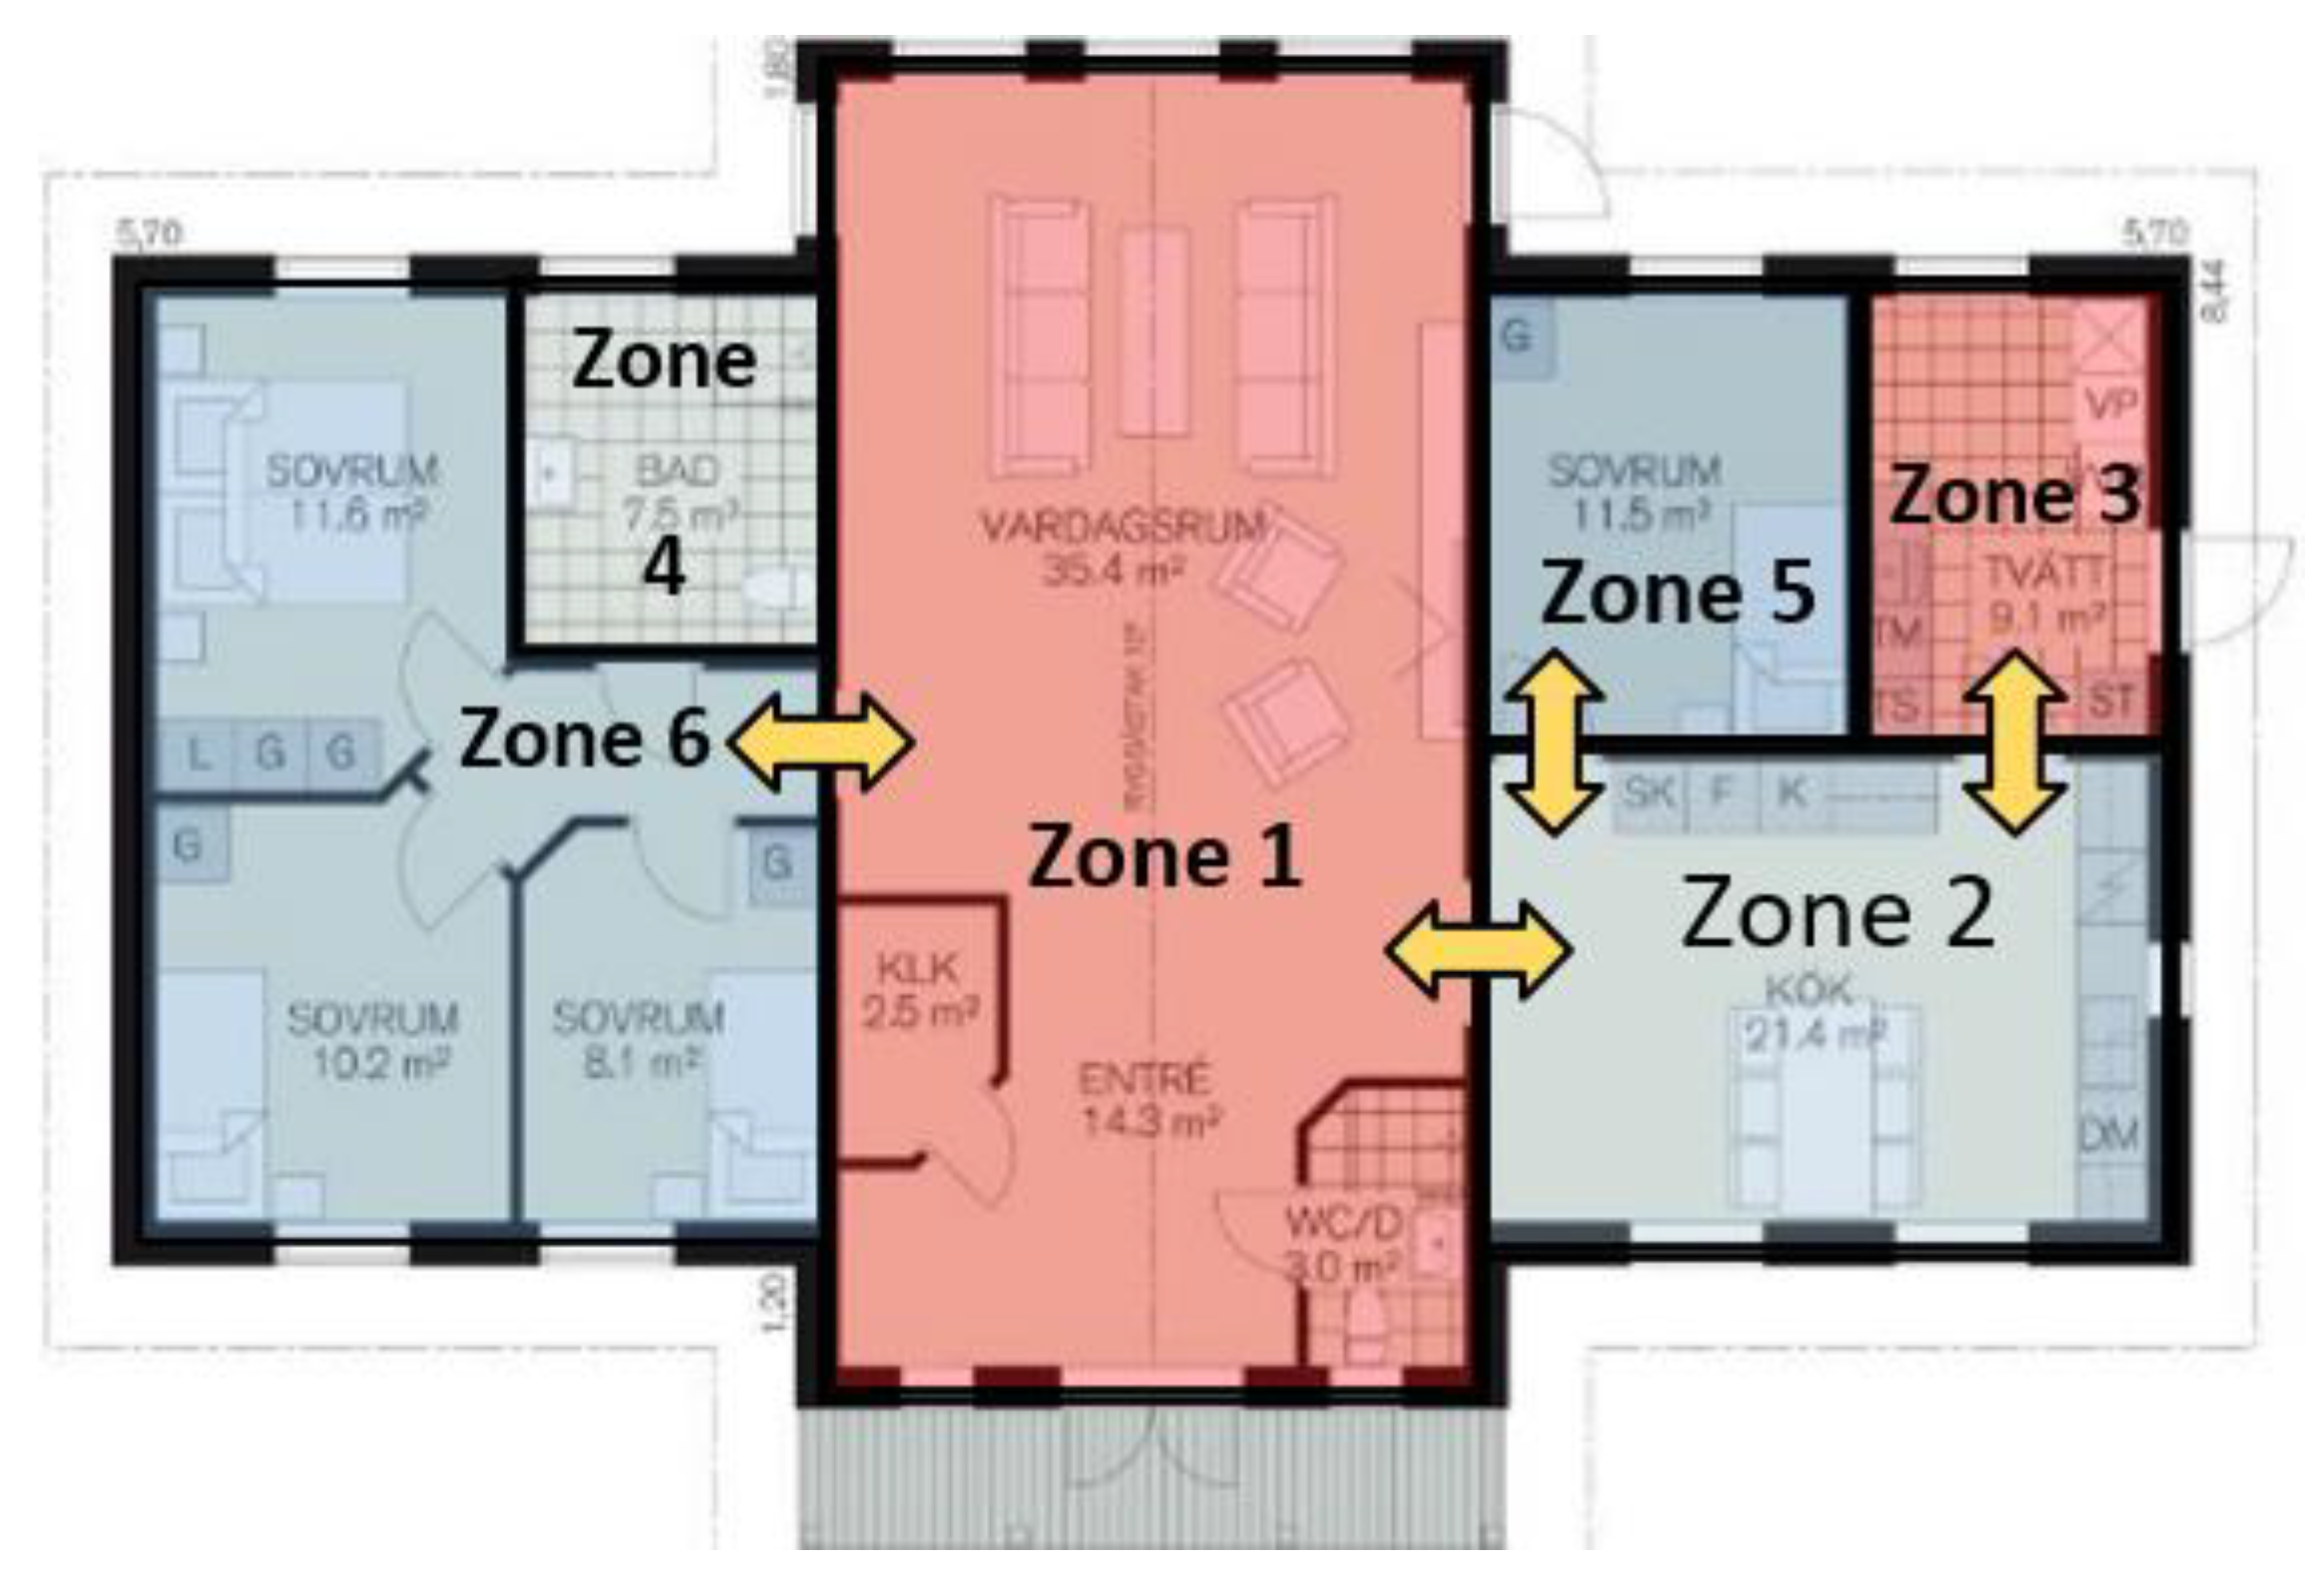
Figure 1. Layout of the building that is modeled with 6 thermal zones. Zones 1 and 3 are the ones that are used when overheating.
Energies 13 01413 g001
Figure 2. Layout of the exhaust air heat pump (HP) system and the hydronic system.
Energies 13 01413 g002
Figure 3. Coefficient of performance (COP) of the heat pump for various compressor speeds and condenser temperatures and an inlet air temperature of 21 °C. The curve “Max” shows the COP for the maximum allowed compressor speed for the specific boundary conditions, and the value of this maximum speed is given in Hz.
Energies 13 01413 g003
Figure 4. Monthly values for global irradiance (primary vertical axis) and total heat demand (secondary vertical) axis for all examined locations. (af) shows global irradiance and total heat demand respectively for each of the six examined locations.
Energies 13 01413 g004
Figure 5. Occupancy, household electricity, and domestic hot water use profile for 4P for a random day in Sweden. (a) Occupancy, (b) household electricity and (c) domestic hot water load profile.
Energies 13 01413 g005
Figure 6. Annual daily and monthly average spot market prices for the year 2015 from the various climatic locations. (a) Annual daily average and (b) Monthly average spot market prices.
Energies 13 01413 g006
Figure 7. Change in final energy (ΔFE) due to the advanced control algorithms for the small PV system with battery for the full range of boundary conditions: country, appliance use (2P, 4P, and 4P+) and room set temperature (20, 21, and 22 °C). (af) shows the ΔFE respectively for each of the six examined locations.
Energies 13 01413 g007aEnergies 13 01413 g007b
Figure 8. Change in self-consumption (ΔSC) due to the advanced control algorithms for the small PV system with battery for the full range of boundary conditions: country, appliance use (2P, 4P, and 4P+) and room set temperature (20, 21, and 22 °C). (af) shows the ΔSC respectively for each of the six examined locations.
Energies 13 01413 g008aEnergies 13 01413 g008b
Figure 9. Change in self-sufficiency (ΔSF) due to the advanced control algorithms for the small PV system with battery for the full range of boundary conditions: country, appliance use (2P, 4P, and 4P+) and room set temperature (20, 21, and 22 °C). (af) shows the ΔSF respectively for each of the six examined locations.
Energies 13 01413 g009aEnergies 13 01413 g009b
Figure 10. Change of net annual cost of electricity (ΔNCOE) due to the advanced control algorithms for the small PV system with battery for the full range of boundary conditions: country, appliance use (2P, 4P, and 4P+) and room set temperature (20, 21, and 22 °C). (af) shows the ΔNCOE respectively for each of the six examined locations.
Energies 13 01413 g010
Figure 11. Duration curve of hourly temperature of the living room during the heating season for the case with PRICE and TH control for the six examined locations. (af) shows the duration curve respectively for each of the six examined locations.
Energies 13 01413 g011
Table 1. Key figures for the compact exhaust air heat pump system. The range of values is for minimum and maximum compressor speeds for inlet air flow rate of 52 L/s at 20 °C and condenser flow rate of 0.2 L/s at 40 °C.
PreferenceQuantity
Electric compressor power (kW)0.25–1.88
Thermal power of HP (kW)1.34–4.35
Heat pump COP2.3–5.4
DHW storage tank capacity (liter)180
Electric auxiliary heater (kW)0.5–6.5
Table 2. Specifications of the PV system and battery storage.
PreferenceQuantity
Capacity PV (kW) 3.12, 5.7
Inverter efficiency (%)97.7
PV tilt (°)27
PV azimuth (°)0
Capacity battery (kWh)3.6, 7.2
Round-trip battery efficiency (%)90
Limits of state of charge (%)10–90
Table 3. Control strategies overview for on–off control of the HP and the electrical storage. Base case is the normal control of the heat pump without smart algorithms, and all examined cases include batteries.
Simulation CasesPrice SignalPV ExcessSH SetpointDHW SetpointPriority
Base case0To gridRefRefNone
Base case + EL0Charging, PVexcess > 0RefRefAppliances
Charging
TH + EL0Overheating SH, DHW
PVexcess > 320
+1 K 1+6 K 1Appliances
Thermal
PRICE + EL1Charging, PVexcess > 0±0.5 K 2RefAppliances
PRICE_TH + EL1Overheating SH, DHW
PVexcess > 320
±0.5 K 2, 1 K 1Ref, +6 K 1Appliances
Thermal
Charging
1 Τhermal mode (TH) setting; 2 PRICE setting.
Table 4. Examined climates for the simulation study.
LocationsClimate ZonesHeating Degree Days
Norrköping (Sweden)Nordic2000
London (UK)Oceanic1037
Stuttgart (Germany)Continental1548
Lyon (France)South Continental986
Madrid (Spain)Southern Dry775
Rome (Italy)Mediterranean403
Table 5. U-values for of the building elements for the various countries (W/m2K).
WallWindowFloorRoofOverall
Sweden0.231.270.120.090.20
UK0.351.80.350.20.37
Germany0.31.40.280.250.33
France0.271.40.170.220.28
Spain0.31.40.280.250.33
Italy0.342.20.330.280.42
Table 6. Electricity and domestic hot water (DHW) demands in Sweden for the three different profiles used in the study.
OccupancyAnnual Electricity Consumption Appliances (kWh/year)Annual Electricity Consumption HP (kWh/year)Annual DHW Consumption (kWh/year)
2P268963602469
4P364969644159
4P+550664204159
Table 7. Breakdown of residential electricity average price for the year 2015 for the examined locations and for customers with the relevant annual demand (Band DD).
SwedenUKGermanyFranceSpainItaly
Energy and supply (Euro-ct/kWh)3.912.17.05.712.09.6
Network (Euro-ct/kWh)5.54.66.04.34.58.5
Energy taxes (Euro-ct/kWh)6.13.514.95.64.512.2
Total (Euros/kWh)0.150.200.280.160.210.30
Spot market price fraction of the total price (%)14%21%11%25%25%17%
VAT (%)25%5%19%20%21%22%
Table 8. Overview of the key performance indicators for a complete year for the reference system for the various examined boundary conditions with and without electrical storage (for the medium load profile 4P and 21 °C setpoint and the two PV system sizes).
Energy QuantityNorrköping SwedenLondon UKStuttgart GermanyLyon FranceMadrid SpainRome Italy
Space heat ( kWh year−1)14,74817,49517,38314,12612,18511,624
DHW (kWh year−1)414941274151411141094068
Heat pump electricity (kWh year−1)504057125850482041884253
Aux electricity
(kWh year−1)
19171743290018421839731
Electrical appliances and lighting (kWh year−1)364936843679367837133668
SPF 2.722.92.562.742.713.15
PV production AC (kWh year−1)
small/medium size
3553/65193679/68294176/78004402/85265286/11,0415421/10,312
MeasureQuantity
System without battery
SC (%) Small/medium PV size45/3251/3745/3241/2839/2436/23
SF (%) Small/medium PV size15/2017/2315/2018/2321/2722/27
Final energy (kWh year−1)
Small/medium PV size
9014/85099254/86069802/89408519/79457666/70696692/6287
Net cost of Energy (€ year−1)
Small/medium PV size
1230/11091707/14772826/25731267/10391119/10291621/1486
System with battery
SC (%) Small/medium PV size62/5168/5662/5159/4659/4154/40
SF (%) Small/medium PV size21/3223/3521/3225/3832/4734/48
Final energy (kWh year−1)
Small/medium PV size
8386/72488628/72959681/83197753/64046610/51825746/4475
Net cost of Energy (€ year−1)
Small/medium PV size
1161/9751617/1288 2655/22111183/8701282/7471517/1053
Change in FE due to battery (kWh year−1)
Small/medium PV size
628/1138626/1333121/1362766/13491056/1428946/1271