Abstract
An experimental campaign on the methane-oriented underground coal gasification (UCG) process was carried out in a large-scale laboratory installation. Two different types of coal were used for the oxygen/steam blown experiments, i.e., “Six Feet” semi-anthracite (Wales) and “Wesoła” hard coal (Poland). Four multi-day gasification tests (96 h continuous processes) were conducted in artificially created coal seams under two distinct pressure regimes-20 and 40 bar. The experiments demonstrated that the methane yields are significantly dependent on both the properties of coal (coal rank) and the pressure regime. The average CH4 concentration for “Six Feet” semi-anthracite was 15.8%vol. at 20 bar and 19.1%vol. at 40 bar. During the gasification of “Wesoła” coal, the methane concentrations were 10.9%vol. and 14.8%vol. at 20 and 40 bar, respectively. The “Six Feet” coal gasification was characterized by much higher energy efficiency than gasification of the “Wesoła” coal and for both tested coals, the efficiency increased with gasification pressure. The maximum energy efficiency of 71.6% was obtained for “Six Feet” coal at 40 bar. A positive effect of the increase in gasification pressure on the stabilization of the quantitative parameters of UCG gas was demonstrated.
1. Introduction
Meeting the challenges of energy security and ensuring competitive energy costs is more important than ever. These two main goals are extremely important for maintaining security of energy supply in many parts of the world. Despite current trends towards a transition to renewable energy, fossil fuels and especially coal will continue to be the main sources of energy in the near future. Coal is the largest fuel in the global industrial energy mix, but there are significant regional differences. Coal is by far the main fuel used in industry in China and India [1]. Deployment of Carbon Capture and Storage (CCS) technologies could allow for making a distinction between coal use and the emissions from its combustion. CO2 injection enhanced oil recovery (EOR) and carbon storage in shales are expected to be a promising method. The gas injection EOR has the win–win effect on CCS when carbon dioxide is applied to stimulate the oil reservoir [2]. Such technologies, along with a significant reduction in the total demand for coal, are nowadays an important feature in scenarios for the sustainable development of energy systems.
The increased demand for coal will eventually lead to the mining of coal seams lying deeper into the ground. Conventional underground coal mining becomes more difficult, more dangerous and more expensive as mining depth increases. Since the early 1930s, Underground Coal Gasification (UCG) has promised a revolution in the safe and economic recovery of vast reserves of otherwise unmineable coal [3,4,5,6]. In the past decades, advances in the key technologies for drilling, completion and monitoring have transformed how UCG can be undertaken at great depth. This, combined with current issues of energy security and the need to reduce the environmental footprint, has initiated a huge global resurgence of interest in UCG. UCG may provide a convenient source of energy from coal seams for which traditional coal extraction techniques are economically, technically or environmentally infeasible. Many studies have shown the potential advantages of UCG over the conventional mining methods, such as the increase in coal utilization efficiency and the improvement of economic performance with simultaneous minimization of environmental emissions [7,8,9,10,11].
During UCG coal is converted into gaseous products directly in the underground conditions (in situ). There are several operational techniques for the UCG, which are explained in detail elsewhere [12,13]. The UCG involves injecting gasifying media into the ignited coal seam through a surface well. The product gas mainly contains H2, CH4, CO, CO2 and can be used both as a chemical feedstock (syngas) and as fuel for power generation [14,15]. From the chemical and thermodynamic point of view the UCG process runs analogically to gasification in the surface reactors. Typical gasification media are oxygen, air and steam. The final product gas consists mainly of hydrogen, carbon monoxide, carbon dioxide, methane and nitrogen. Composition and calorific value of the product gas depend largely on the gasifying agent employed, thermodynamic conditions of the operation, coal rank and local hydrogeological conditions [16,17,18,19,20]. Several examples exist in literature demonstrating that under appropriate control of the process, the UCG could be oriented on the production of a specific product, such as hydrogen [21,22,23,24,25,26,27].
Methane, the main component of natural gas (NG), is one of the most desirable UCG products that significantly contributes to the calorific value of gas. Modern techniques for extracting natural gas from geological deposits are based on physical processes. For example, hydraulic fracturing techniques are commonly used to increase the permeability of shale gas deposits for effective gas recovery [28]. Unlike the techniques used in NG production, the UCG process involves both physical (drilling) and chemical processes. During the UCG process, methane is formed in a methanation reaction (gas phase):
and through a direct hydrogenation of solid carbon (hydrogasification reaction):
CO + 3H2 → CH4 +H2O ΔH = −206 kJ/mol
C + 2H2(g) → CH4(g) ΔH = −91.0 kJ/mol
Both reactions are favored by the increased pressure [29,30]. Gasification pressure depends on the seam depth, which affects the hydrostatic pressure in the coal seam, and hence the allowable range for the pressure in the underground reactor. The hydrostatic pressure increases with depth at about 0.01 MPa/m for fresh water and 0.012 MPa/m for a saturated saline aquifer [31]. Consequently, at 100 m depth the hydrostatic pressure is approximately 1 MPa, and at 1000 m depth it increases to approximately 10 MPa. Such difference in pressure has a significant effect on the permissible operating conditions, and thus on the composition and conditions of the product gas. As CH4 formation is based on hydrogen production, the amount of water (steam) and hydrogen available to the gasification process is critical. Typically, the product gas from UCG has higher methane content than the product from the various surface gasifiers. Lower temperatures involved in some parts of the UCG cavity/channel and longer gas residence times, particularly at high pressures, and catalytic effects of post-gasification ash are expected to play an important role [32]. The presence of larger concentrations of methane would typically be an advantage in power generation or natural gas synthesis operations, but can be disadvantageous in synthesis reactions.
While underground coal gasification has been developed and tested over the past 80 years at numerous locations world-wide, the bulk of this experience has been in relatively shallow coals, i.e., <200 m burial depth. In Europe the main UCG interest was mostly in deep unmineable coals (bituminous rank sometimes lying in relatively thin seams) compared with those in the former Soviet Union (USSR), the USA and Australia, which have all been in shallower deposits, of which a high proportion have been of lower rank coals (particularly of high volatile bituminous and subbituminous coals). As a result, the number of operations carried out in deep seams is very limited [3].
This article presents results of an experimental study on methane-oriented UCG. Experimental simulations of UCG with oxygen and water using large bulk samples of Welsh semi-anthracite and Polish bituminous coal were conducted in a high pressure ex situ laboratory installation. Methane efficiency, gas production rates and temperature profile distribution in the seam were monitored during the multiday gasification experiments. Gasification resulted in relatively high methane yields and the maximum CH4 concentration (average) obtained during the whole experimental campaign was: 20.6%vol. The study revealed that not only gasification pressure, but also coal rank had a significant impact on methane formation. Therefore, the feasibility of methane-rich gas production through underground gasification of the two coals used was demonstrated.
2. Materials and Methods
2.1. Description of the UCG Test Stand
The schematic view of the surface installation (ex situ) used for the underground gasification experiments is presented in Figure 1.
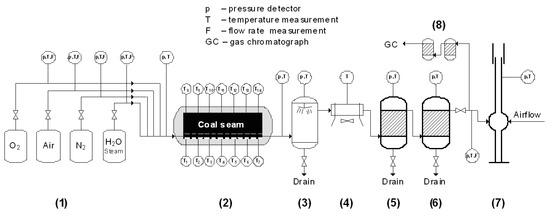
Figure 1.
Scheme of the ex-situ high pressure underground coal gasification (UCG) installation: (1) gasification reagents, (2) gasification reactor (3) water scrubber, (4) air cooler, (5,6) separators, (7) thermal combustor, (8) gas treatment module prior to gas chromatography (GC) analysis [30]. Reproduced from [30], Elsevier: 2019.
The main part of the installation is a gasification reactor in which the underground geological conditions of the coal seam are reproduced. The installation enables the simulations of the underground coal gasification process on the surface (ex situ), in an artificial coal seam (maximum seam length 3.5 m, cross-section 0.41 × 0.41 m). Tests can be carried out using gasification media such as oxygen, air, steam, CO2 and mixtures thereof. Nitrogen is used as a safety agent for inertizing and cooling down the reactor after gasification. The maximum gasification pressure is ~50 atm and the temperature is 1600 °C. The raw UCG gas is washed with water to lower its temperature, remove solid particles and condense high-boiling tar components. The subsequent stages of gas treatment include the separation of aerosols. The gas produced is finally neutralized in a combustion chamber fed with natural gas. The concentrations of the main gaseous components are analyzed by means of gas chromatography (GC). The Agilent 3000A Micro GC (Agilent Technologies, Santa Clara, CA, USA) is used for these purposes. The gas product was sampled every 30 min.
2.2. Coal Samples and Preparation of the Artificial Seam
The coal samples for the UCG tests were gathered from two different locations. The first selection of coal blocks was obtained from an open cast coal mine in the South Wales Coalfield, UK. An average thickness of the coal seam was 1.2 m and the sampling location was 88 m below the ground level. This sample was marked as “Six Feet” (semi-anthracite). The second selection of blocks was obtained from the “Wesoła” mine in Upper Silesia Basin, Poland (bituminous coal). The sampling location was 950 m below the ground level from a coal seam of an average thickness of 5 m. Results of proximate and ultimate analyses for the coals under study are presented in Table 1.

Table 1.
Proximate and ultimate characteristics of coals used for the gasification tests.
The raw coal samples after initial processing were used to create a continuous artificial coal seam with a total length of 3.05 m, width 0.41 m and thickness 0.41 m. The cross sections of the UCG reactor for the UCG tests and details of thermocouples are presented in Figure 2.
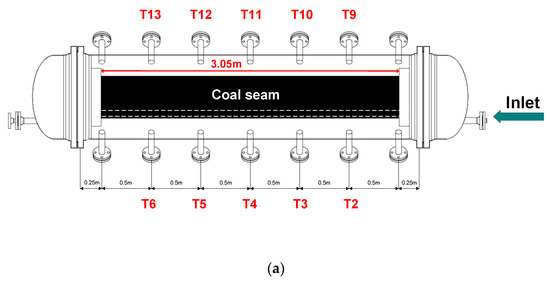
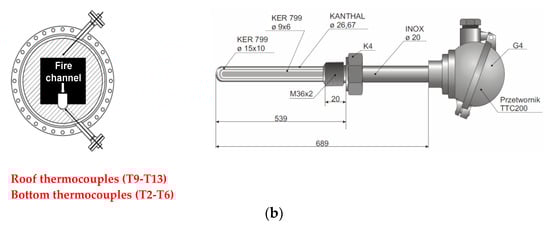
Figure 2.
Cross sections of the ex-situ reactor prepared for UCG tests: (a) side cross-section, (b) vertical cross-section [30]. Reproduced from [30], Elsevier: 2019 Distribution of temperatures during the gasification process was controlled by 10 high temperature thermocouples (Pt10Rh–Pt). The left side of Figure 2b shows vertical cross-section of the reactor. It can be seen, that the thermocouples are located in the insulating layer of the reactor and do not reach the coal seam. Such location of the thermocouples is necessary to protect them from direct contact with oxidizers. The distance of the thermocouples from the bottom and roof of the artificial seam was about 2 cm.
2.3. Experimental Campaign and Test Procedure
For each of the coal type under study, the gasification tests were conducted under two distinct pressure regimes—20 and 40 bar with the main aim to assess feasibility of the methane—rich gas production. The general process assumptions for the gasification tests are presented in Table 2. The oxidant supply rates (Nm3/h) over the course of the experiments are presented in Figure 3. Since the main aim of the study was to investigate the effect of coal rank and gasification pressure on CH4 formation, the oxidant supply rates were the same in each experiment. The supply rates were established based on previous gasification tests and adapted to the given rector’s geometry.
Table 2.
Experimental assumptions for the methane-oriented ex situ UCG tests.
Figure 3.
Supply rates of the gasification reagents during the UCG tests.
The coal seams were ignited using a pyrotechnic charge. The pyrotechnic charge was located inside the gasification channel on the bottom of the coal seam at a distance of approx. 1 m from the face of the coal seam.
2.4. Calculations
The main process parameters are calculated using the following methodologies:
Gas calorific value
The gas product was sampled every 30 min. The calorific value (Q, MJ/Nm3) of the gas product is calculated on the basis of the gas composition, according to the following equation:
where: (H2), (C2H6), (CH4), (CO), (H2S) are the mole fractions of particular components, 10.78, etc. are heating values of the particular components (MJ/Nm3).
Q = (H2) × 10.78 + (C2H6) × 63.38 + (CH4) × 35.895 + (CO) × 12.64 + (H2S) × 23.34,
- Gas yield
The total gas yields during the particular stages of gasification are calculated by integrating the curves of the gas production rates.
- 2.
- Average gas production rate
The average gas production rate was calculated by dividing the yield of gas by duration of the stage.
- 3.
- Energy in process gas
The total energy in process gas at each stage of the gasification was calculated by multiplying the gas yield by the corresponding average gas calorific value.
- 4.
- Average reactor power.
This value was calculated as the ratio of energy to time at each stage of the gasification experiment.
- 5.
- Gasification rate
Based on the gas composition and its yield the amount of carbon contained in the process gas was calculated. The mass of coal gasified during the particular stages was calculated based on technical and elemental analysis of the raw coal.
- 6.
- Energy efficiency
The gasification efficiency was calculated by dividing the energy contained in the process gas by energy contained in the mass of gasified coal.
3. Results and Discussion
3.1. Gas Production Rates
The evolution of product gas over the course of the gasification experiments with “Six Feet” and “Wesoła” coals, conducted at 20 and at 40 bar are presented in Figure 4 and Figure 5, respectively. As can be seen from the presented graphs, the values of the gas production rates were changeable in all gasification experiments, with the maximum values approximately 10 Nm3/h. The oscillations observed in gas production rates usually reflect changes in gasification conditions inside the coal seam, resulting from the heterogeneity of coal properties and gas flow disturbances due to enlargement of the cavity and spalling of roof material. Such phenomena are typical for the UCG process. In the UCG experiments carried out at 40 bar, a gradual increase in gas production rate was observed during the entire gasification process, and the values of the produced gas volumes were characterized by smaller fluctuations in time. This proves the positive effect of the increase in gasification pressure on the stabilization of the quantitative parameters of the gas produced during UCG.
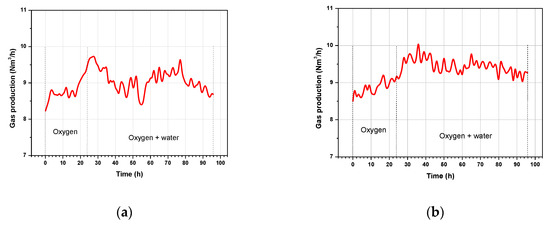
Figure 4.
Gas production rates over the course of gasification experiments at 20 bar: (a) “Six Feet” semi-anthracite, (b) “Wesoła” hard coal.
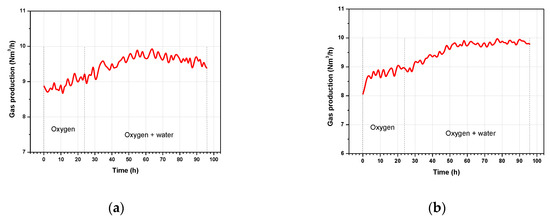
Figure 5.
Gas production rates over the course of gasification experiments at 40 bar: (a) “Six Feet” semi-anthracite, (b) “Wesoła” hard coal.
The average gas production rates and gas yields per mass of coal consumed for all UCG experiments are presented in Table 3. For both coals used, the gas production rates are affected by the gasification pressure and the correlation is positive. As seen from the presented data, for the experiments with “Six feet” semi-anthracite, the gas yield expressed as the volume of gas per mass of gasified coal was not significantly dependent on gasification pressure. For “Wesoła” hard coal, the gas yield slightly decreased at higher gasification pressure. Higher gas yields from gasified coal mass during gasification of “Six Feet” semi-anthracite resulted from better gasification conditions due to higher calorific value and lower ash content in the gasified sample.
Table 3.
Gas production parameters for the UCG experiments conducted.
3.2. Product Gas Composition and Gas Calorific Value
Changes in the product gas composition for the gasification experiments at 20 and 40 bar are presented in Figure 6 and Figure 7, respectively. Average gas compositions obtained in the particular gasification experiments are presented in Table 4.
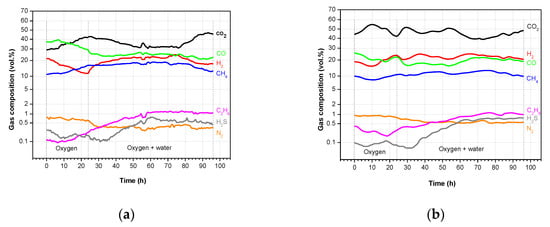
Figure 6.
Changes in gas composition over the course of gasification experiments at 20 bar: (a) “Six Feet” semi-anthracite, (b) “Wesoła” hard coal.
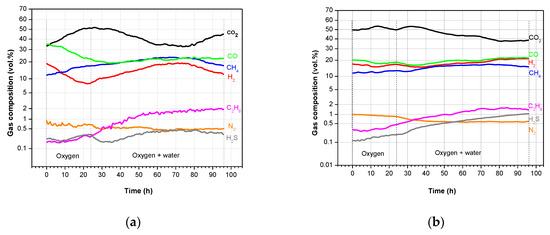
Figure 7.
Changes in gas composition over the course of gasification experiments at 40 bar: (a) “Six Feet” semi-anthracite, (b) “Wesoła” hard coal.
Table 4.
Average gas compositions obtained during the four UCG experiments conducted.
As can be seen from the data presented, the gas composition was significantly dependent on both the coal properties and gasification pressure. For both the 20 and 40 bar experiments, gas from “Six Feet” semi-anthracite was characterized by higher contents of highly calorific components, especially methane. As seen from the data in Table 4, the average methane concentration for “Six Feet” semi-anthracite was 15.8%vol. at 20 bar and 19.1%vol. at 40 bar. During the gasification of “Wesoła” coal, the methane concentration was 10.9%vol. and 14.8%vol. at 20 and 40 bar, respectively.
The higher concentrations of CH4 in gas produced during the gasification of “Six Feet” sample resulted in relatively higher gas calorific values, i.e., 11.7 and 12.1 MJ/Nm3 at 20 and 40 bar respectively compared to 9.2 MJ/Nm3 at 20 bar and 10.4 MJ/Nm3 at 40 bar during the gasification of “Wesoła” hard coal. The graphs presented in Figure 8 and Figure 9 show that in each of the 4 gasification experiments, the calorific value of the gas increased over time, which reflects the progress of cavity and the gradual improvement of gasification conditions. Deterioration of gas quality was observed at the final stage of the gasification process, regardless of the coal rank and gasification pressure used. This is typical during UCG according to the linear CRIP (Controlled Retracting Injection Point) technique, which is the signal to start the next UCG rector by retracting the linear position of the oxidant injector.
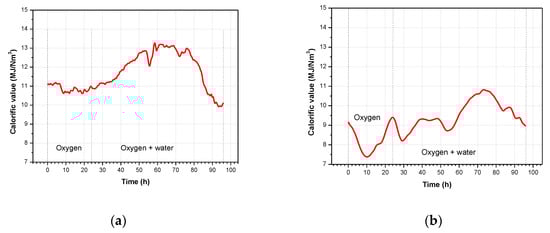
Figure 8.
Changes in gas calorific value over the course of gasification experiments at 20 bar: (a) “Six Feet” semi-anthracite, (b) “Wesoła” hard coal.
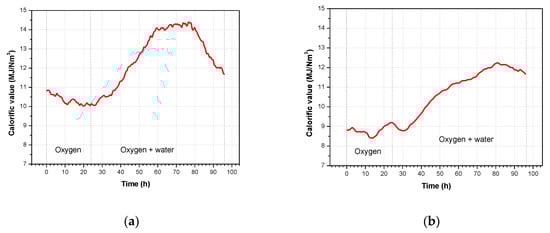
Figure 9.
Changes in gas calorific value over the course of gasification experiments at 40 bar: (a) “Six Feet” semi-anthracite, (b) “Wesoła” hard coal.
The gasification of “Six Feet” semi-anthracite yielded significantly lower quantities of CO2 compared to the gasification of “Wesoła” hard coal. The experiments revealed that the CO2 content was heavily affected by the gasification pressure and a positive correlation was observed. This can be explained by the intensification of coal combustion reaction (reaction limited by oxidant diffusion) and intensification of methanation reaction leading to the formation of methane and CO2 as the main products.
The hydrogen and carbon monoxide contents were strongly dependent on both coal properties and gasification pressure. Higher hydrogen yields for “Wesoła” coal were obtained for experiments at both pressures. A negative correlation between hydrogen concentration and gasification pressure was observed, which was caused by the consumption of hydrogen in methanation and hydrogenation reactions favored by the increased gasification pressure. The gasification of “Six Feet” sample generated much more CO than “Wesoła” coal. This may be due to the intensification of the Bouduard reaction during gasification of the semi-anthracite, which is favored at higher temperatures.
In each of the four gasification tests, the effect of water injection on the gas quality was evident. As can be seen in the graphs presented in Figure 6 and Figure 7, water injection resulted in a rapid increase in methane and hydrogen formation and a decrease in CO2 concentration (limitation of combustion reactions), irrespective of the coal rank and gasification pressure used. This resulted in a significant improvement in the calorific value of gas, which can be concluded from the graphs presented in Figure 8 and Figure 9.
3.3. Temperature Profiles
The temperature distributions during the experiments in the bottom part and in the roof strata are shown in Figure 10, Figure 11, Figure 12 and Figure 13. The rate of temperature increase was different between the coals. Temperatures during the gasification of “Wesoła” coal increased more rapidly than during the gasification of “Six Feet” coal which showed a more gradual increase (potentially due to differences in reactivity, as lower rank coals are more reactive). This is particularly visible for roof strata temperatures. The maximum gasification temperatures during the experiments were approximately 1200 °C and were recorded in the roof strata near the reactor inlet (oxidation zone). It should be emphasized, however, that the actual process temperatures were much higher, but due to the insulating phenomena (refractory materials and ceramic thermocouples casings used), the records had lower values. Another observation is that temperatures in the bottom strata for almost each experiment were about 100 °C lower compared to the roof strata. This confirms that UCG ash and slag produced during the process and molten roof material can effectively insulate against heat conduction to the bottom of the coal seam. The only exception was the “Wesoła” coal gasification test at 40 bar, in which the temperature differences were relatively small. No significant impact of the gasification pressure on temperature distribution was observed during the gasification tests.
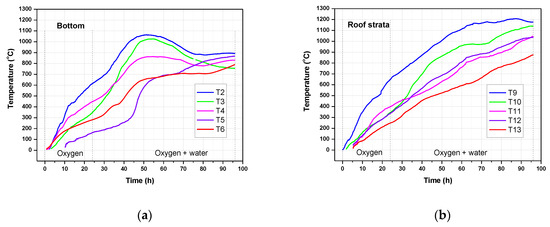
Figure 10.
Distributions of temperatures during “Six Feet” semi-anthracite gasification at 20 bar: (a) seam bottom, (b) roof strata.
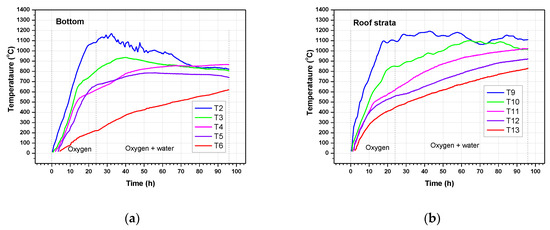
Figure 11.
Distributions of temperatures during “Wesoła” hard coal gasification at 20 bar: (a) seam bottom, (b) roof strata.
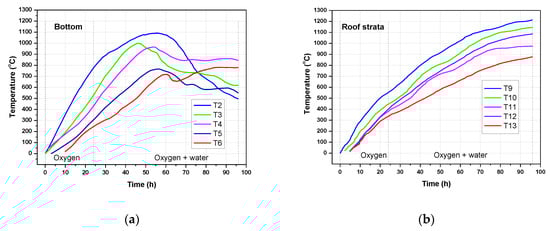
Figure 12.
Distributions of temperatures during “Six Feet” semi-anthracite gasification at 40 bar: (a) seam bottom, (b) roof strata.
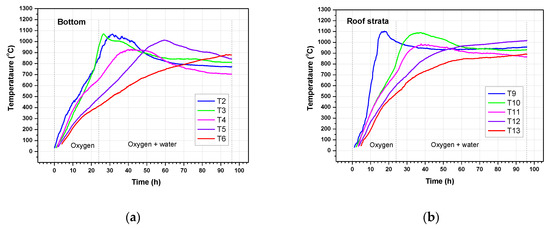
Figure 13.
Distributions of temperatures during “Wesoła” hard coal gasification at 40 bar: (a) seam bottom, (b) roof strata.
3.4. Process Balance Calculations
The energy and mass balance calculations for the UCG experiments carried out are presented in Table 5. The study revealed that at the same experimental conditions, gasification of “Wesoła” coal took place at much higher coal consumption rates, i.e., 5.3 kg/h compared to 4.5 kg/h at 20 bar and 5.6 kg/h compared to 4.7 kg/h at 40 bar for “Wesoła” and “Six Feet” coal, respectively. These differences can be explained by the higher reactivity of “Wesoła” sample (lower rank coal). According to energy balance estimates, the “Six feet” coal gasification was characterized by much higher energy efficiency than gasification of the “Wesoła” sample. At 20 bar, the energy efficiency for “Six Feet” was 69.7% compared to 56.8% obtained for “Wesoła” experiment. For both tested coals, the energy efficiency values increased with pressure and the experiments at 40 bar resulted in 71.6% and 60.8% for “Six Feet” and “Wesoła” coals, respectively. This improvement was mainly due to the higher methane concentrations in the gas obtained during experiments at the higher gasification pressure.
Table 5.
Summary of the material and energy balance calculations for the four experiments conducted.
4. Conclusions
The experiments conducted demonstrated a significant influence of coal properties, and operational pressure on the main process parameters, including gas composition, methane yields and energy efficiency, in particular:
The gas production rates were changeable in all gasification experiments, with the maximum values approximately 10 Nm3/h. The oscillations reflected the changes in gasification conditions due to the heterogeneity of coal properties and changes in the cavity geometry. A positive impact of gasification pressure increase on the stabilization of quantitative parameters of gas was demonstrated.
The UCG gas composition was significantly dependent on both the coal properties and gasification pressure. For both the 20 and 40 bar experiments, gas from “Six Feet” semi-anthracite was characterized by higher contents of highly calorific components, especially methane. The average methane concentration for “Six Feet” semi-anthracite was 15.8%vol. at 20 bar and 19.1%vol. at 40 bar. During the gasification of “Wesoła” coal, the methane concentration was 10.9%vol. and 14.8%vol. at 20 and 40 bar, respectively. The gasification of “Six Feet” semi-anthracite yielded significantly lower quantities of CO2 compared to the gasification of “Wesoła” hard coal and the CO2 content was heavily affected by the gasification pressure (positive correlation).
The effect of water injection on the gas quality was evident. The water injection resulted in a rapid increase in CH4 and H2 formation and a decrease in CO2 concentration, independently of the coal rank and gasification pressure.
The rate of temperature increase was different between the coals. Temperatures during the gasification of “Wesoła” coal increased more rapidly than during the gasification of “Six Feet” coal which showed more gradual increase. This was potentially due to the differences in reactivity. The maximum gasification temperatures during the experiments were approximately 1200 °C and were recorded in the roof strata near the reactor inlet (oxidation zone).
At the same experimental conditions, gasification of “Wesoła” coal took place at much higher coal consumption rates, i.e., 5.3 kg/h compared to 4.5 kg/h at 20 bar and 5.6 kg/h compared to 4.7 kg/h at 40 bar for “Wesoła” and “Six Feet” coal, respectively. These differences can be explained by the higher reactivity of “Wesoła” sample (lower rank coal).
The “Six Feet” coal gasification was characterized by much higher energy efficiency than gasification of the “Wesoła” sample. At 20 bar, the energy efficiency for “Six Feet” was 69.7% compared to 56.8% obtained for “Wesoła” experiment. For both tested coals, the energy efficiency values increased with pressure and the experiments at 40 bar resulted in 71.6% and 60.8% for “Six Feet” and “Wesoła” coals, respectively. This improvement was mainly due to the higher CH4 concentrations in the gas obtained at the higher gasification pressure.
Author Contributions
K.K.: Conceptualization, Methodology, Writing—original draft, Project Administration, Funding Acquisition; M.W.: Experiments, Visualization; K.S.: Writing—review and editing; R.Z.: Resources, Writing—Review & Editing; H.R.T.: Resources, Writing—Review & Editing. All authors have read and agreed to the published version of the manuscript.
Funding
This work was a part of the MEGAPlus project supported by the EU Research Fund for Coal Steel, under the Grant Agreement number 800774—MEGAPlus—RFCS-2017 and Polish Ministry of Science and Higher Education under Grant Agreement No. 3996/FBWiS/2018/2.
Conflicts of Interest
The authors declare no conflict of interest.
References
- International Energy Agency. World Energy Outlook 2019; IEA: Paris, UK, 2019; Available online: https://www.iea.org/reports/world-energy-outlook-2019 (accessed on 13 November 2019).
- Jia, B.; Tsau, J.S.; Barati, R. A review of the current progress of CO2 injection EOR and carbon storage in shale oil reservoirs. Fuel 2019, 236, 404–427. [Google Scholar] [CrossRef]
- Couch, G. Underground Coal Gasification; CCC/151; IEA Clean Coal Centre: London, UK, 2009; p. 129. [Google Scholar]
- Bhutto, A.W.; Bazmi, A.A.; Zahedi, G. Underground coal gasification: From fundamentals to applications. Prog. Energy Combust. Sci. 2013, 39, 189–214. [Google Scholar] [CrossRef]
- Shafirovich, E.; Varma, A. Underground coal gasification: A brief review of current status. Ind. Eng. Res. 2009, 48, 7865–7875. [Google Scholar] [CrossRef]
- Gregg, D.W.; Edgar, T.F. Underground coal gasification. AIChE J. 1978, 24, 753–781. [Google Scholar] [CrossRef]
- Burton, E.; Friedmann, J.; Upadhye, R. Best Practices in Underground Coal Gasification; Contract No. W-7405-Eng-48; Lawrence Livermore National Laboratory: Livermore, CA, USA, 2005. [Google Scholar]
- Fei, M. Underground coal gasification (UCG): A new trend of supply-side economics of fossil fuels. Nat. Gas Ind. B 2016, 3, 312–322. [Google Scholar]
- Nakaten, N.; Schlüter, R.; Azzam, R.; Kempka, T. Development of a techno-economic model for dynamic calculation of cost of electricity, energy demand and CO2 emissions of an integrated UCG-CCS process. Energy 2014, 66, 779–790. [Google Scholar] [CrossRef]
- Maev, S.; Blinderman, M.S.; Gruber, G.P. Underground coal gasification (UCG) to products: Designs, efficiencies, and economics. Undergr. Coal Gasif. Combust. 2018, 435–468. [Google Scholar] [CrossRef]
- Burchart-Korol, D.; Krawczyk, P.; Czaplicka-Kolarz, K.; Smoliński, A. Eco-efficiency of underground coal gasification (UCG) for electricity production. Fuel 2016, 173, 239–246. [Google Scholar] [CrossRef]
- Perkins, G. Underground Coal Gasification. Part I: Field demonstrations and process performance. Progr. Energy Comb. Sci. 2018, 67, 158–187. [Google Scholar] [CrossRef]
- Kapusta, K.; Stańczyk, K. Development conditions and limitations of the underground coal gasification in Poland. Przem. Chem. 2009, 88, 331–338. [Google Scholar]
- Xiao, Y.; Yin, J.; Hu, Y.; Wang, J.; Yin, H.; Qi, H. Monitoring and Control in Underground Coal Gasification: Current Research Status and Future Perspective. Sustainability 2019, 11, 217. [Google Scholar] [CrossRef]
- Kapusta, K.; Wiatowski, M.; Stańczyk, K. An experimental ex-situ study of the suitability of a high moisture ortho-lignite for underground coal gasification (UCG) process. Fuel 2016, 179, 150–155. [Google Scholar] [CrossRef]
- Klebingat, S.; Kempka, T.; Schulten, M.; Azzam, R.; Fernández-Steeger, M.T. Optimization of synthesis gas heating values and tar by-product yield in underground coal gasification. Fuel 2018, 229, 248–261. [Google Scholar] [CrossRef]
- Klebingat, S.; Kempka, T.; Schulten, M.; Azzam, R.; Fernandez-Steeger, T.M. Innovative thermodynamic underground coal gasification model for coupled synthesis gas quality and tar production analyses. Fuel 2016, 183, 680–686. [Google Scholar] [CrossRef]
- Perkins, G. Underground coal gasification—Part II: Fundamental phenomena and modeling. Prog. Energy Combust. Sci. 2018, 67, 234–274. [Google Scholar] [CrossRef]
- Zagoršcak, R.; An, N.; Palange, R.; Green, M.; Krishnan, M.; Thomas, H.R. Underground coal gasification—A numerical approach to study the formation of syngas and its reactive transport in the surrounding strata. Fuel 2019, 253, 349–360. [Google Scholar] [CrossRef]
- Perkins, G.; Sahajwalla, V. A Mathematical Model for the Chemical Reaction of a Semi-infinite Block of Coal in Underground Coal Gasification. Energy Fuels 2005, 19, 1679–1692. [Google Scholar] [CrossRef]
- Stańczyk, K.; Smoliński, A.; Kapusta, K.; Wiatowski, M.; Świądrowski, J.; Kotyrba, A.; Rogut, J. Dynamic experimental simulation of hydrogen oriented underground gasification of lignite. Fuel 2010, 89, 3307–3314. [Google Scholar] [CrossRef]
- Yang, L.; Zhang, X.; Liu, S.; Yu, L.; Zhang, W. Field test of large–scale hydrogen manufacturing from underground coal gasification (UCG). Int. J. Hydrog. Energy 2008, 33, 1275–1285. [Google Scholar] [CrossRef]
- Liu, S.Q.; Wang, Y.Y.; Zhao, K.; Yang, N. Enhanced-hydrogen gas production through underground gasification of lignite. Min. Sci. Technol. 2009, 19, 384–394. [Google Scholar] [CrossRef]
- Yang, L.; Ding, R. The fundamental researches on hydrogen manufacturing from underground coal gasification. Resour. Mater. 1990, 12, 27–32. [Google Scholar]
- Stańczyk, K.; Kapusta, K.; Wiatowski, M.; Świądrowski, J.; Smoliński, A.; Rogut, J.; Kotyrba, A. Experimental simulation of hard coal underground gasification for hydrogen production. Fuel 2012, 91, 40–50. [Google Scholar] [CrossRef]
- Wiatowski, M.; Stańczyk, K.; Świądrowski, J.; Kapusta, K.; Cybulski, K.; Krause, E.; Grabowski, J.; Rogut, J.; Howaniec, N.; Smoliński, A. Semi-technical underground coal gasification (UCG) using the shaft method in Experimental Mine “Barbara”. Fuel 2012, 99, 170–179. [Google Scholar] [CrossRef]
- Wiatowski, M.; Kapusta, K.; Świądrowski, J.; Cybulski, K.; Ludwik-Pardała, M.; Grabowski, J.; Stańczyk, K. Technological aspects of underground coal gasification in the Experimental “Barbara” Mine. Fuel 2015, 159, 454–462. [Google Scholar] [CrossRef]
- Jia, B.; Tsau, J.S.; Barati, R.G. Investigation of Shale-Gas-Production Behavior: Evaluation of the Effects of Multiple Physics on the Matrix. SPE Reserv. Eval. Eng. 2019, 23, 13. [Google Scholar] [CrossRef]
- Wiatowski, M.; Kapusta, K.; Ludwik-Pardała, M.; Stańczyk, K. Ex-situ experimental simulation of hard coal underground gasification at elevated pressure. Fuel 2016, 184, 401–408. [Google Scholar] [CrossRef]
- Wiatowski, M.; Kapusta, K.; Stańczyk, K.; Stańczyk, K. Efficiency assessment of underground gasification of orthoand meta-lignite: High-pressure ex situ experimental simulations. Fuel 2019, 236, 221–227. [Google Scholar] [CrossRef]
- Barady, B.H.G.; Brown, E.T. Rock Mechanics for Underground Mining, 2nd ed.; Chapman and Hall: London, UK, 1993. [Google Scholar]
- Beath, A.; Craig, S.; Littleboy, A.; Mark, R.; Mallett, C. Underground Coal Gasification: Evaluating Environmental Barriers; Exploration and Mining Report P2004/5; CSIRO Exploration and Mining: Canberra, Australia, 2004. [Google Scholar]


© 2020 by the authors. Licensee MDPI, Basel, Switzerland. This article is an open access article distributed under the terms and conditions of the Creative Commons Attribution (CC BY) license (http://creativecommons.org/licenses/by/4.0/).