An Ultrasonic Longitudinal Through-Transmission Method to Measure the Compressive Internal Stress in Epoxy Composite Specimens of Gas-Insulated Metal-Enclosed Switchgear


Abstract
1. Introduction
2. Experiment
2.1. Epoxy Composite Specimen
2.2. Testing System
2.3. Finite Element Simulation
3. Principle
3.1. Ultrasonic Longitudinal Through-Transmission Method
3.2. Acoustoelastic Effect
3.3. Deformation
3.4. System Delay
3.5. Ultrasonic Longitudinal Wave Velocity
4. Results and Analysis
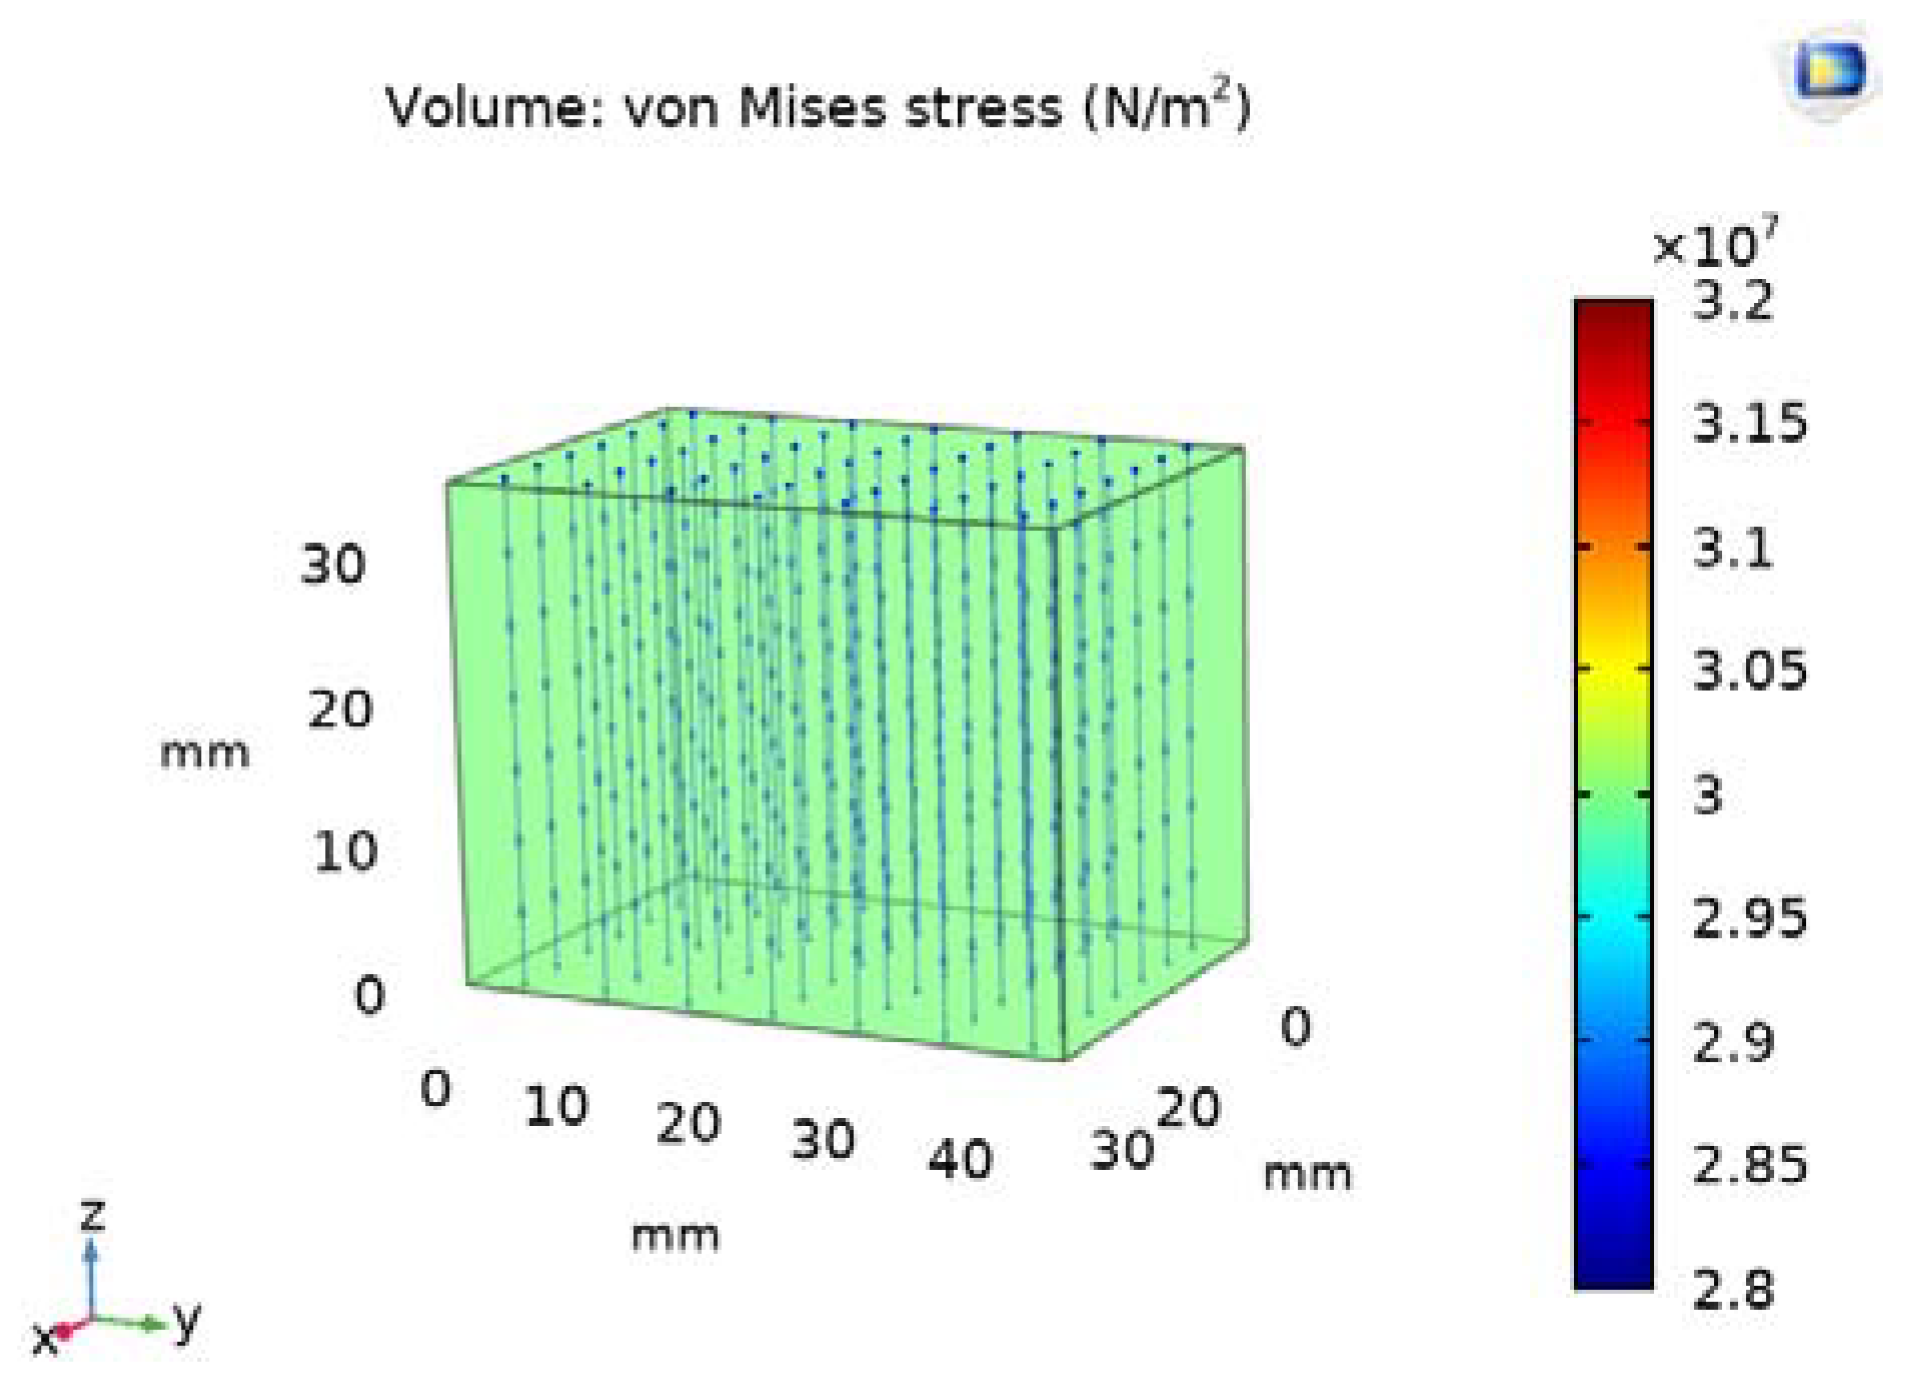
4.1. Simulation Results
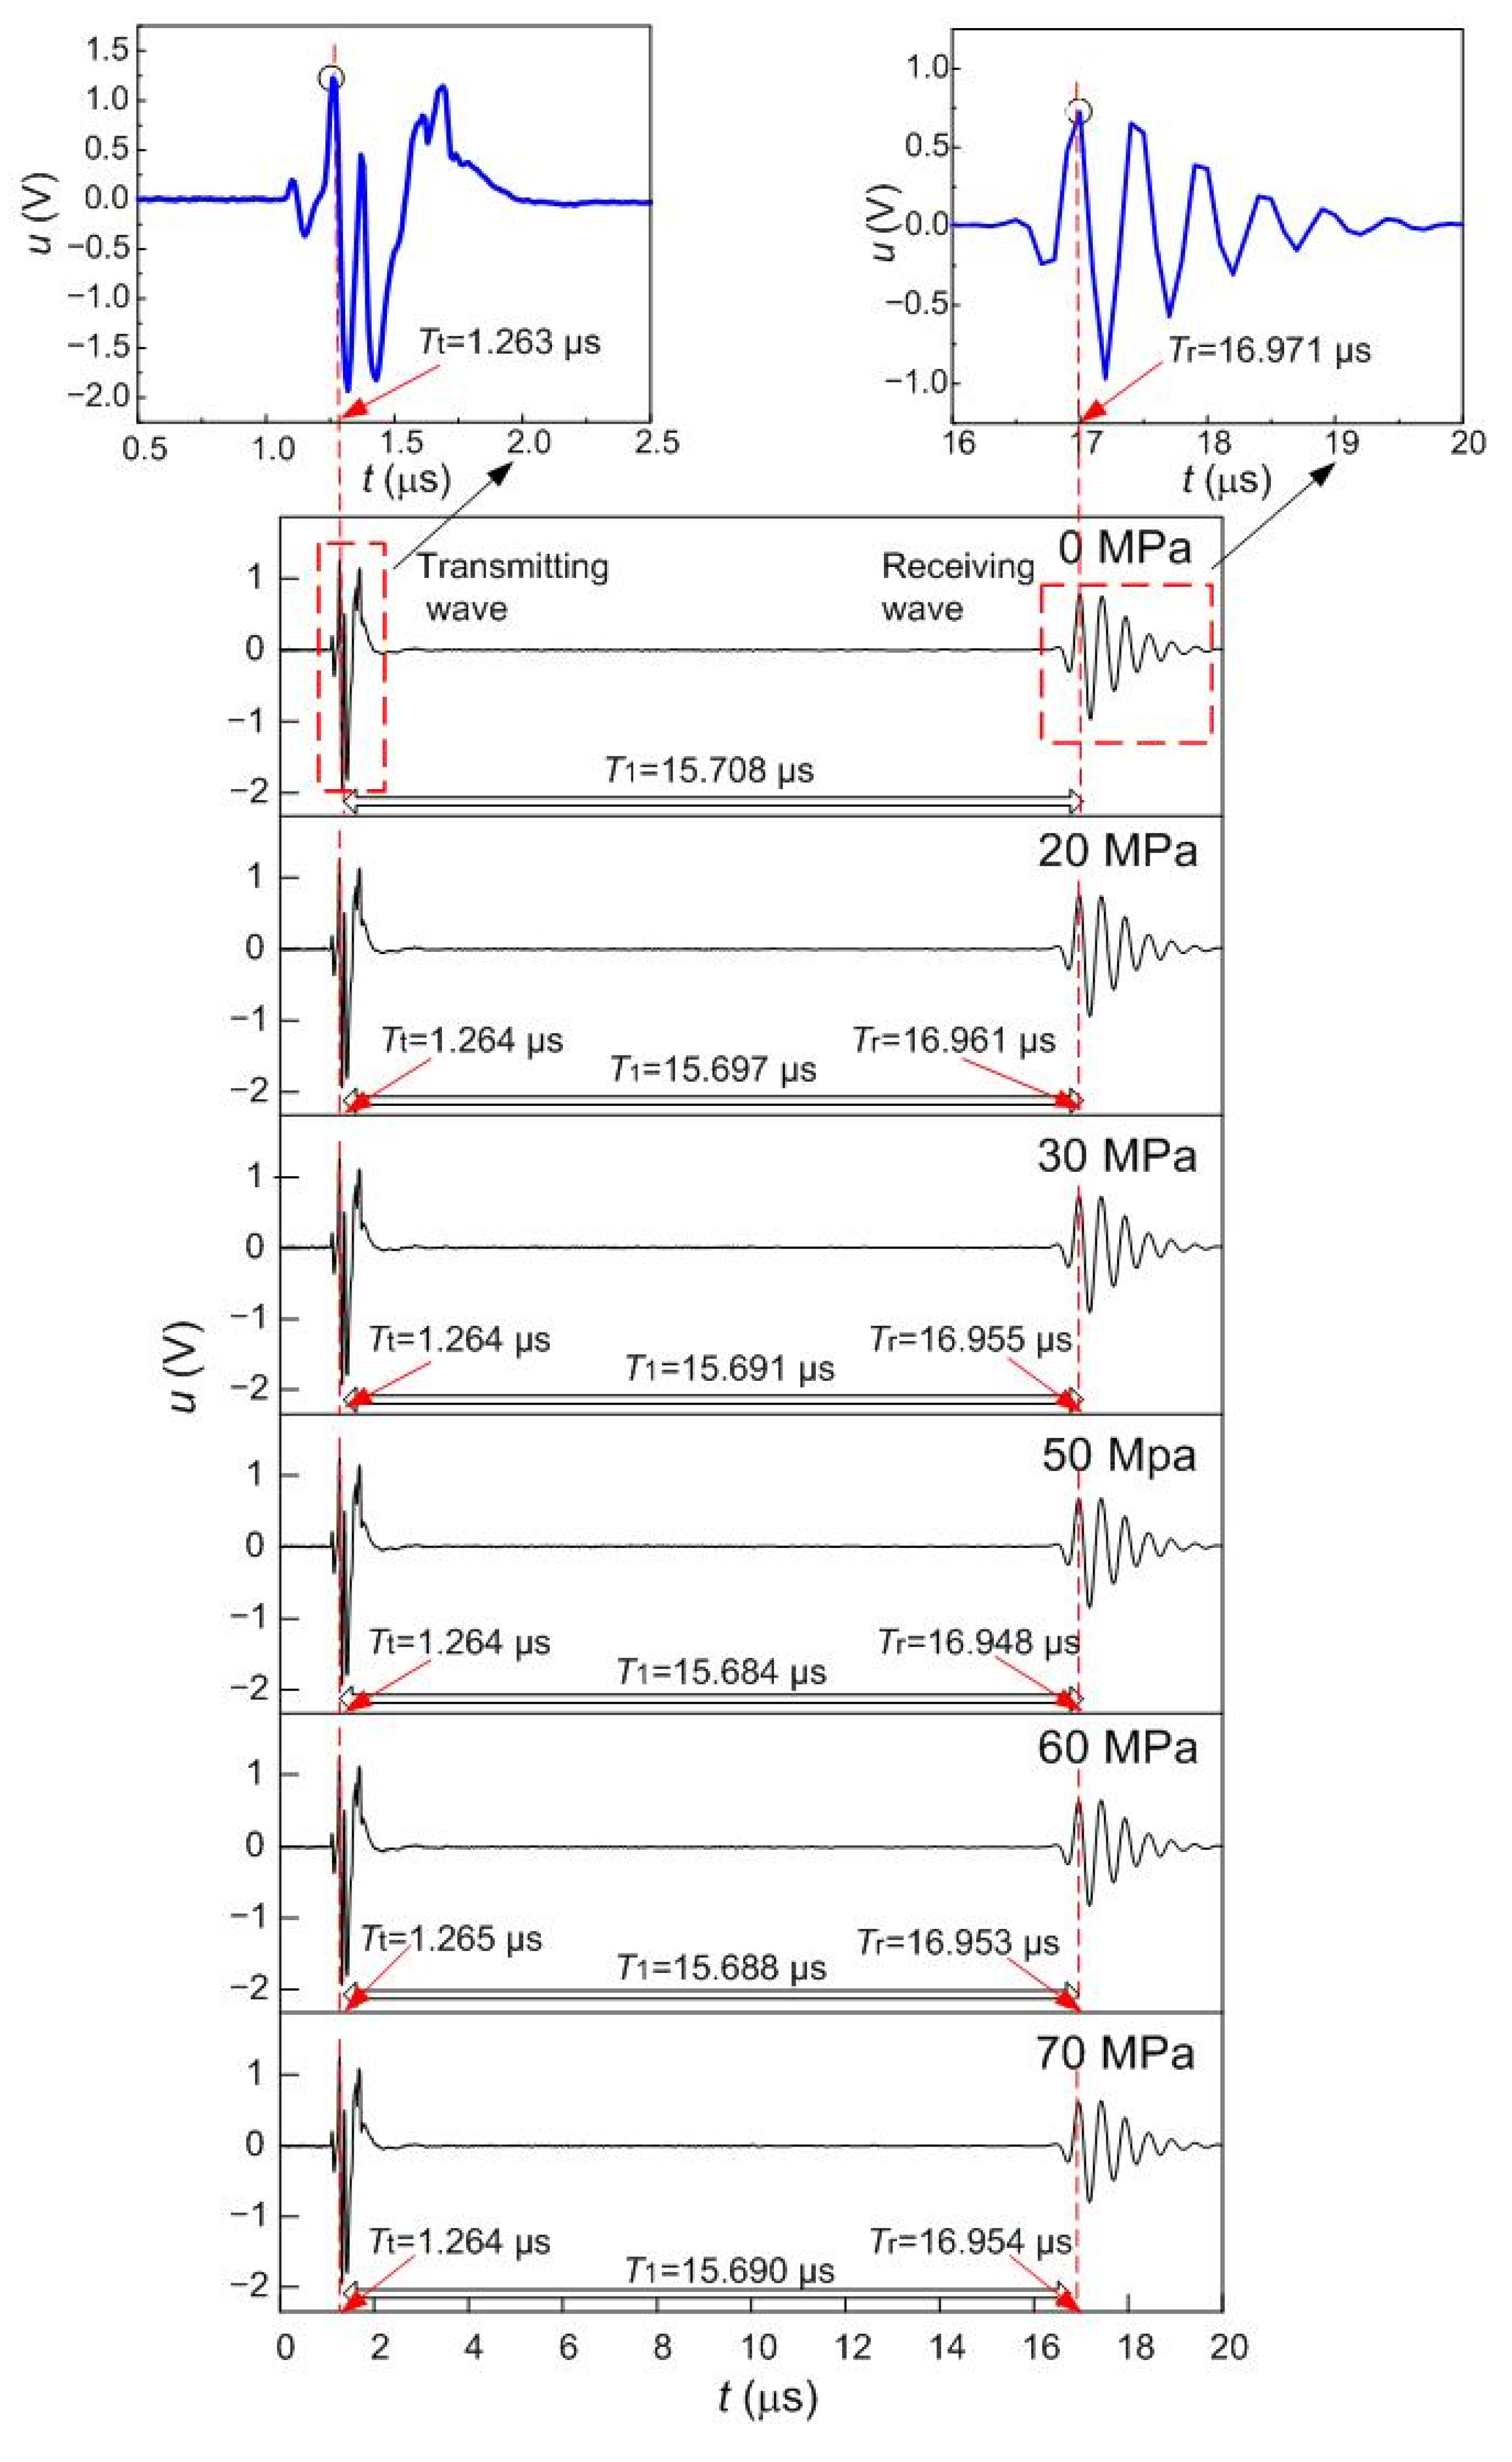
4.2. Ultrasonic Waveforms
4.3. System Delay
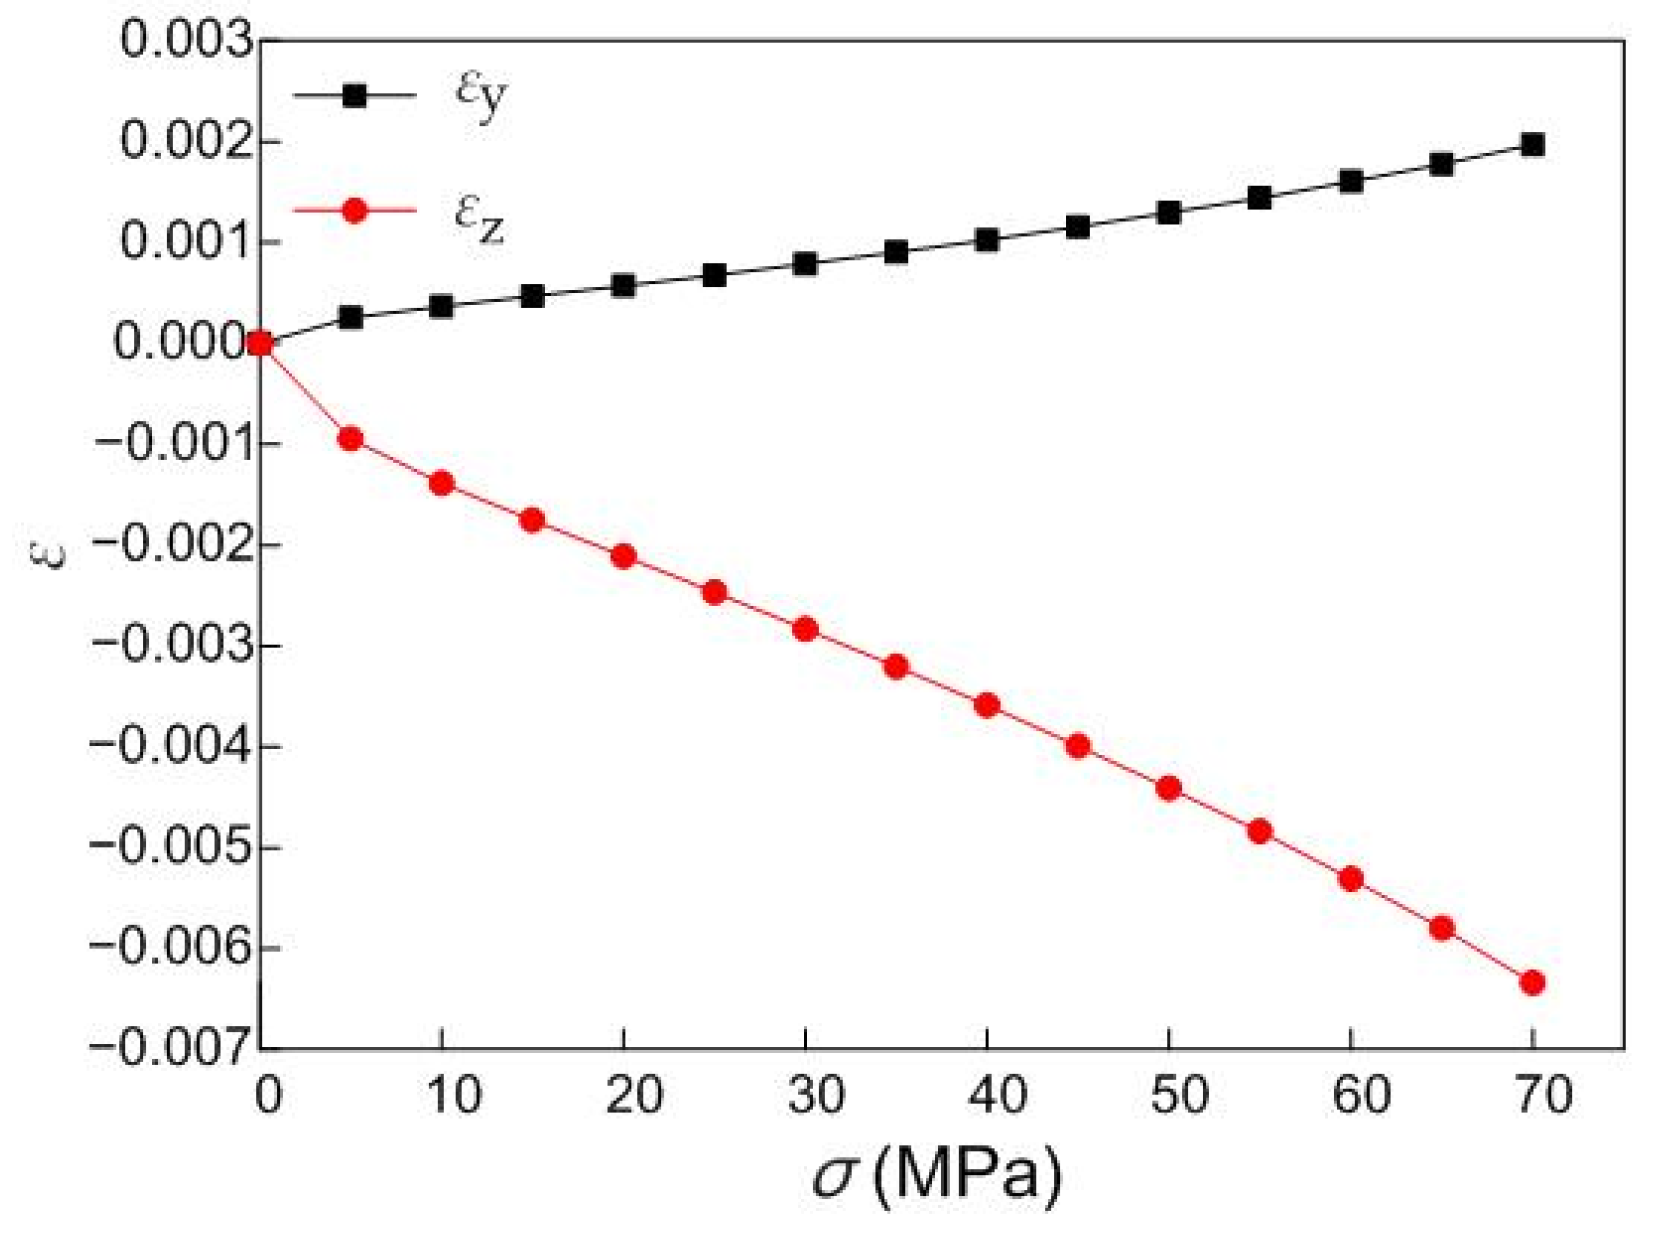
4.4. Elongation dy in the Direction Vertical to the Stress
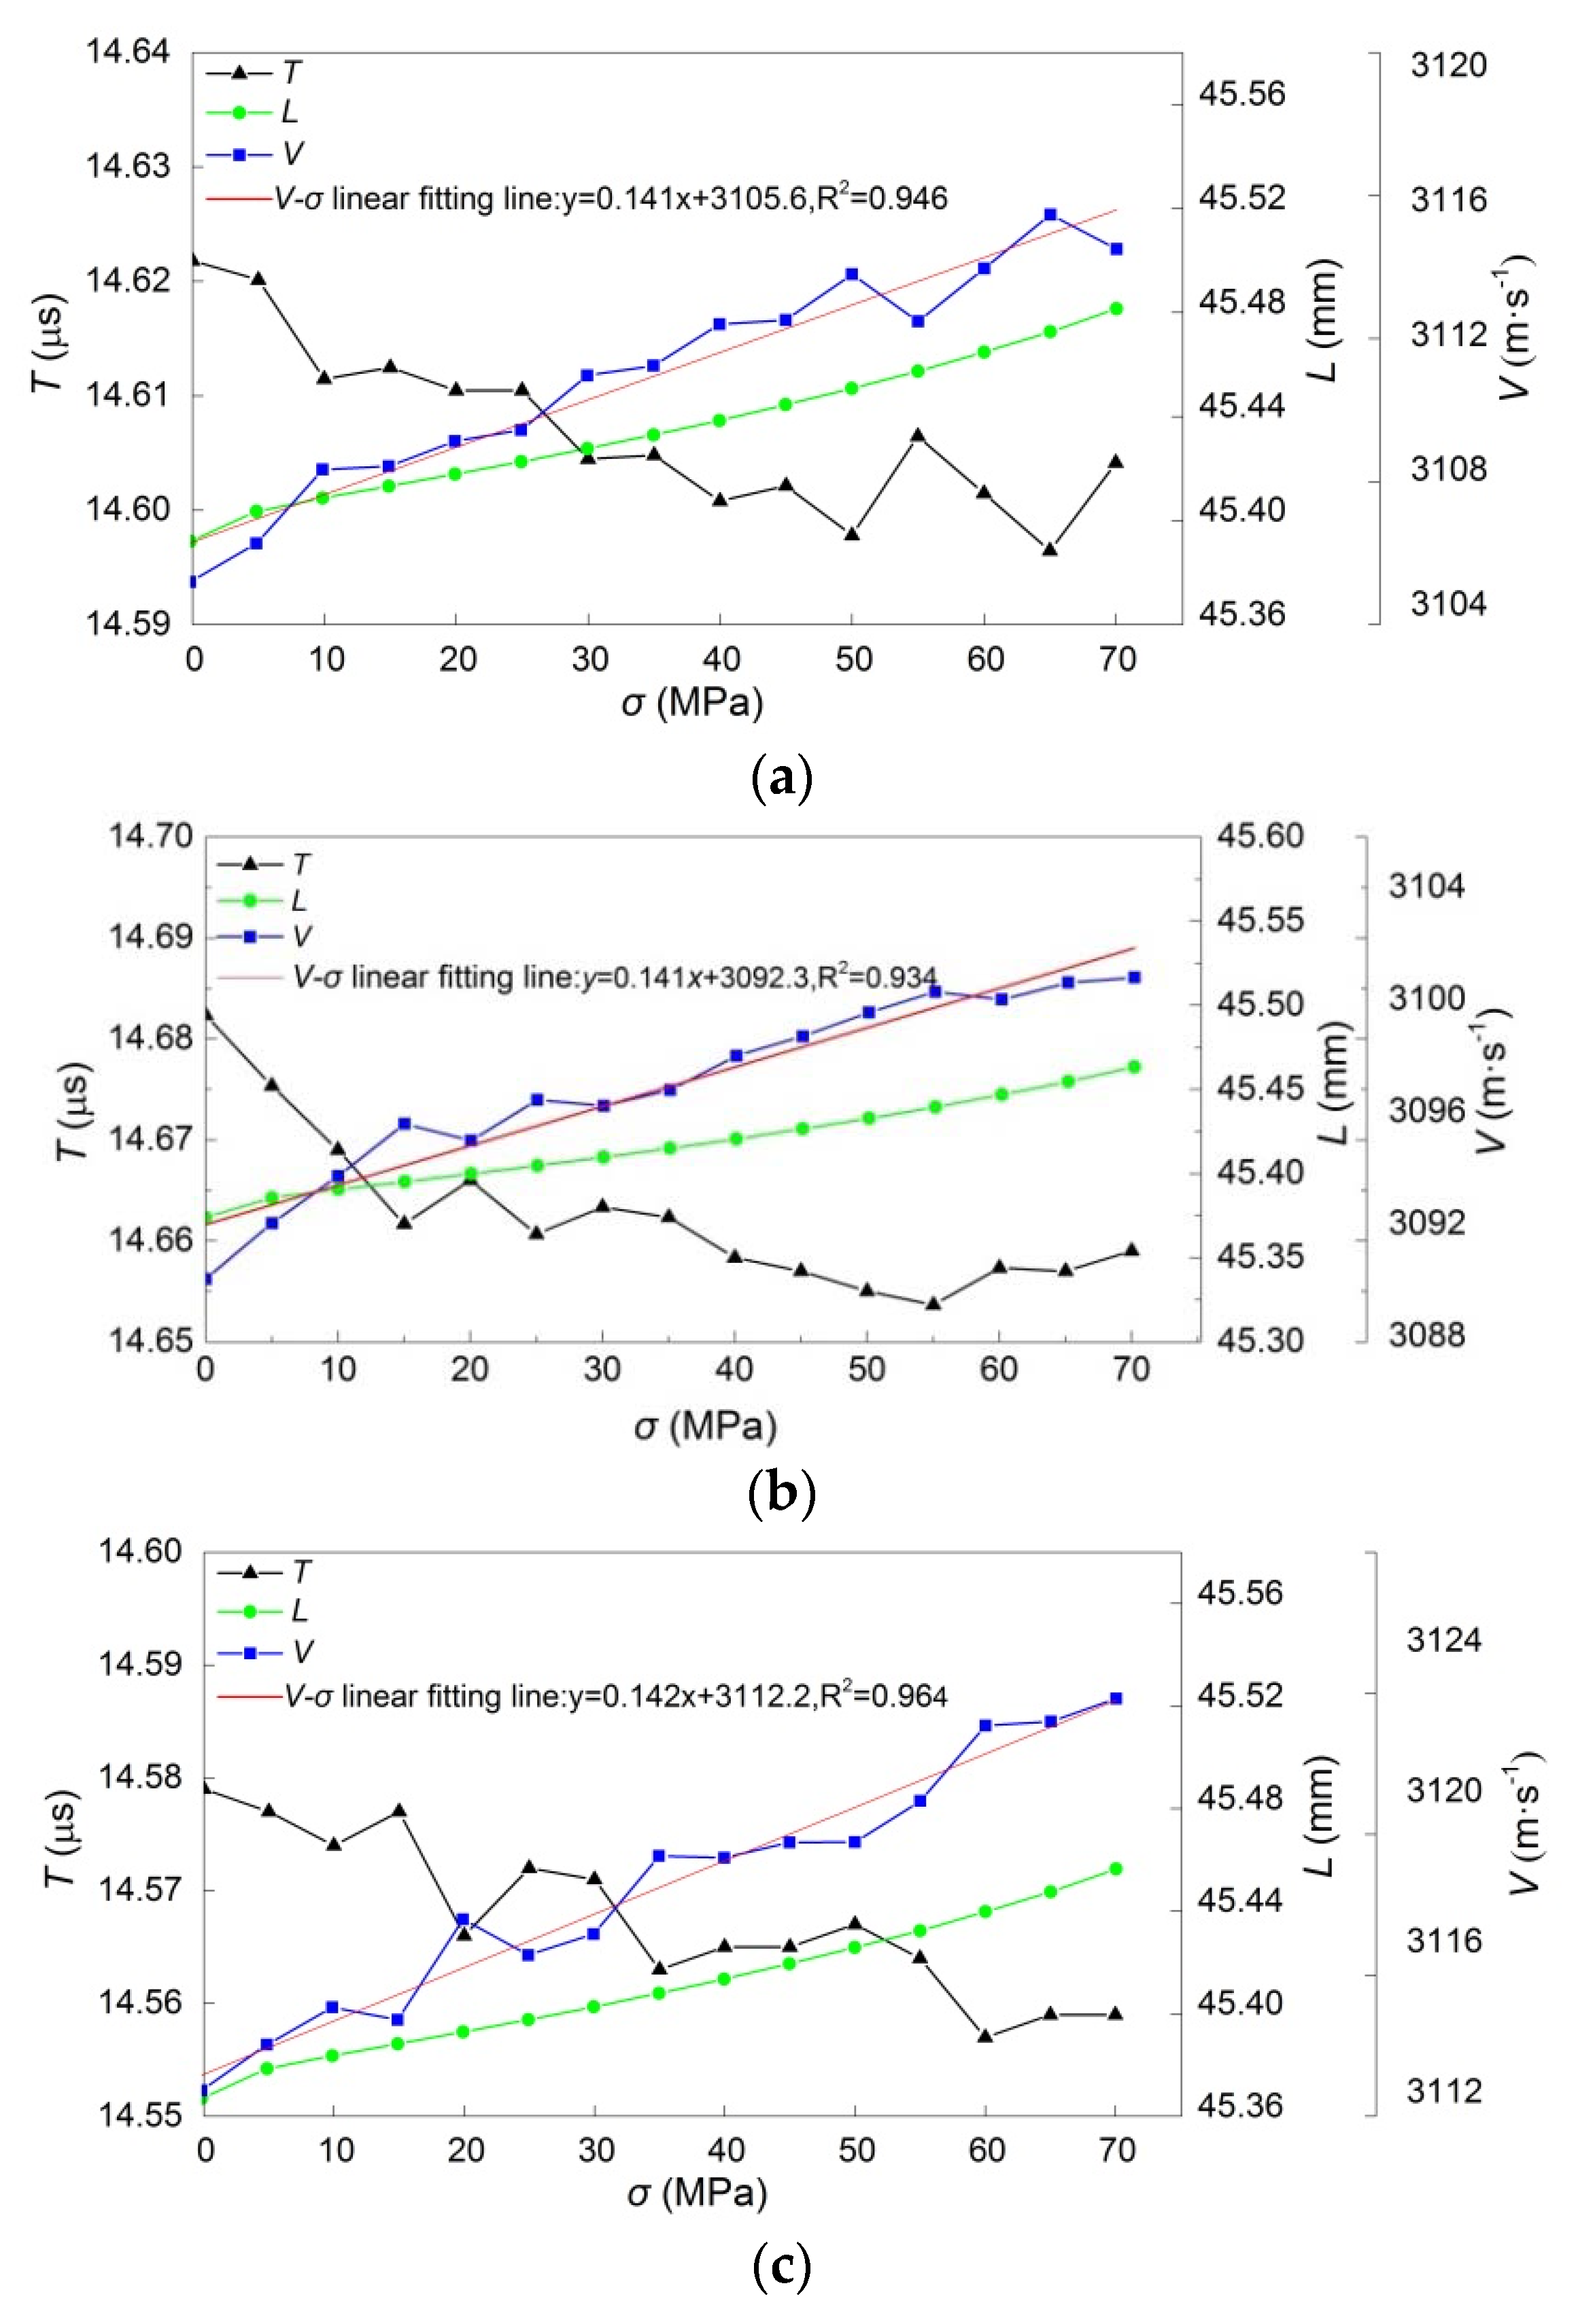
4.5. Wave Velocity–Stress Relationship
4.6. Acoustoelastic Coefficient
4.7. Compressive Internal Stress Measurement
5. Conclusions
Author Contributions
Funding
Conflicts of Interest
Appendix A. Assessment of Uncertainty
Appendix A.1. Uncertainty of Directly Measured Variables
Appendix A.1.1. The Uncertainty of L0, L0a, and L0b
Appendix A.1.2. The Uncertainty of T1, T1a, and T1b
Appendix A.1.3. The Uncertainty of εy
Appendix A.1.4. The Uncertainty of a, b, and h
Appendix A.1.5. The Uncertainty of F
Appendix A.2. The Uncertainty of Intermediate Variables
Appendix A.2.1. The Uncertainty of T0
Appendix A.2.2. The Uncertainty of V

| σ (MPa) | 0 | 5 | 10 | 15 | 20 | 25 | 30 | 35 |
| u (V) (m/s) | 1.424 | 1.424 | 1.426 | 1.426 | 1.427 | 1.427 | 1.427 | 1.427 |
| σ (MPa) | 40 | 45 | 50 | 55 | 60 | 65 | 70 | |
| u (V) (m/s) | 1.427 | 1.428 | 1.427 | 1.428 | 1.428 | 1.428 | 1.428 |
Appendix A.2.3. The Uncertainty of σa
| σ (MPa) | 0 | 5 | 10 | 15 | 20 | 25 | 30 | 35 |
| u (σa) (MPa) | 0 | 0.434 | 0.456 | 0.490 | 0.534 | 0.586 | 0.643 | 0.705 |
| σ (MPa) | 40 | 45 | 50 | 55 | 60 | 65 | 70 | |
| u(σa) (MPa) | 0.770 | 0.838 | 0.908 | 0.980 | 1.052 | 1.125 | 1.090 |
Appendix A.2.4. The Uncertainty of k:
| σ (kN) | 0 | 5 | 10 | 15 | 20 | 25 | 30 | 35 |
| u (k) (10−3m/s/MPa) | 8.939 | 9.079 | 9.093 | 9.116 | 9.149 | 9.191 | 9.242 | 9.302 |
| σ (kN) | 40 | 45 | 50 | 55 | 60 | 65 | 70 | |
| u (k) (10−3m/s/MPa) | 9.370 | 9.448 | 9.533 | 9.627 | 9.728 | 9.837 | 9.784 |
Appendix A.2.5. The Uncertainty of K
| σ (kN) | 0 | 5 | 10 | 15 | 20 | 25 | 30 | 35 |
| u (K) (10−6/MPa) | 2.886 | 2.931 | 2.935 | 2.943 | 2.953 | 2.967 | 2.983 | 3.002 |
| σ (kN) | 40 | 45 | 50 | 55 | 60 | 65 | 70 | |
| u (K) (10−6/MPa) | 3.024 | 3.049 | 3.077 | 3.107 | 3.140 | 3.175 | 3.158 |
Appendix A.3. The Uncertainty of σc
| σ (kN) | 0 | 5 | 10 | 15 | 20 | 25 | 30 | 35 |
| u (σc) (MPa) | 14.269 | 14.281 | 14.298 | 14.369 | 14.427 | 14.387 | 14.531 | 14.532 |
| σ (kN) | 40 | 45 | 50 | 55 | 60 | 65 | 70 | |
| u (σc) (MPa) | 14.630 | 14.753 | 14.761 | 14.830 | 14.941 | 15.099 | 15.226 |
References
- IEEE Std C37.122 TM-2010. IEEE Standard for High Voltage Gas-Insulated Substations Rated Above 52 kV; IEEE Power & Energy Society: New York, NY, USA, 2011. [Google Scholar]
- Qi, B.; Gao, C.J.; Li, C.R.; Xiong, J. The influence of surface charge accumulation on flashover voltage of GIS/GIL basin insulator under various voltage stresses. Int. J. Electr. Power Energy Syst. 2019, 105, 514–520. [Google Scholar] [CrossRef]
- Zhou, W.J.; Zheng, Y.; Yang, S.; Li, H.; Wang, B.S.; Qiao, S.Y. Detection of intense partial discharge of epoxy insulation in SF6 insulated equipment using Carbonyl Sulfide. IEEE Trans. Dielectr. Electr. Insul. 2016, 23, 2942–2948. [Google Scholar] [CrossRef]
- Exner, W.; Hein, R.; Mahrholz, T.; Wierach, P.; Monner, H.P.; Sinapius, M. Impact of nanoparticles on the process-induced distortions of carbon fiber reinforced plastics: An experimental and simulative approach. J. Appl. Polym. Sci. 2019, 136, 47031. [Google Scholar] [CrossRef]
- Zhou, Y.B.; Wan, S.W.; Zeng, X.W.; Li, S.Y.; Zhong, S.J. Cause analysis of a 220 kV GIS leakage and disc insulator breakage. Guangdong Electr. Power 2012, 25, 118–121. [Google Scholar]
- Li, J.P. Cause analysis of the two crackings of basin insulators in a substation extension project. Technol. Wind 2017, 18, 206. [Google Scholar]
- Shi, Y.Z.; Zhang, X.; Li, X.Y.; Huang, R.H.; Wei, J.R.; Yao, S.J. Judgment method of basin insulator rupture process based on the analysis of stress and strain. Insul. Surge Arresters 2015, 2, 19–22. [Google Scholar]
- Fei, L.F.; Gong, X.Y.; Chen, W. Factors influencing the water pressure of insulating spacer in GIS/GCB. High Volt. Appar. 2014, 50, 125–130. [Google Scholar]
- He, J.B.; Li, Z.H.; Teng, J.; Li, M.; Wang, Y. Absolute stress field measurement in structural steel members using the Lcr wave method. Measurement 2018, 122, 679–687. [Google Scholar] [CrossRef]
- Santos, A.A.; Ambiel, L.B.; Garcia, R.H.; Rodovalho, T.G. Stress analysis in carbon/epoxy composites using Lcr waves. J. Compos. Mater. 2014, 48, 3425–3434. [Google Scholar] [CrossRef]
- He, L.F.; Liu, J. Acoustoelasticity Technology, 1st ed.; Science Press: Beijing, China, 2002; pp. 142–143. [Google Scholar]
- Jhang, K.Y.; Quan, H.H.; Ha, J.; Kim, N.Y. Estimation of clamping force in high-tension bolts through ultrasonic velocity measurement. Ultrasonics 2006, 44, 1339–1342. [Google Scholar] [CrossRef]
- Fukuoka, H.; Toda, H.; Yamane, T. Acoustoelastic stress analysis of residual stress in a patch-weld disk. Exp. Mech. 1978, 18, 277–280. [Google Scholar] [CrossRef]
- Pan, Q.X.; Liu, S.; Li, X.; Xu, C.G. Characteristic evaluation on bolt stress by ultrasonic nondestructive methods. Adv. Mater. Sci. Eng. 2015, 134090. [Google Scholar] [CrossRef]
- Bray, D.E.; Junghans, P. Application of the LCR ultrasonic technique for evaluation of post-weld heat treatment in steel plates. NDT E Int. 1995, 28, 235–242. [Google Scholar] [CrossRef]
- Duquennoy, M.; Ouaftouh, M.; Ourak, M. Ultrasonic evaluation of stresses in orthotropic materials using Rayleigh waves. NDT E Int. 1999, 32, 189–199. [Google Scholar] [CrossRef]
- Jia, D.W.; Bourse, G.; Chaki, S.; Lacrampe, M.F.; Robin, C.; Demouveau, H. Investigation of stress and temperature effect on the longitudinal ultrasonic waves in polymers. Res. Nondestruct. Eval. 2014, 25, 20–29. [Google Scholar] [CrossRef]
- Xu, Y.; Yang, Z.F.; Zhou, H.Q.; Zhang, W.B. Application of acoustoelasticity in studying compressive stress state in Polymer bonded explosive. In Proceedings of the IEEE Far East Forum on Nondestructive Evaluation/Testing New Technology and Application, Zhuhai, China, 29–31 May 2015; pp. 95–99. [Google Scholar]
- Wang, W.; Zhang, Y.M.; Zhou, Y.F.; Meng, S.H.; Chen, D.K.K. Plane stress measurement of orthotropic materials using critically refracted longitudinal waves. Ultrasonics 2019, 94, 430–437. [Google Scholar] [CrossRef]
- Zou, Z.Y.A.; Yang, L.; Tian, F.Y.; Zheng, Y.; He, W.M.; Hao, Y.P.; Li, L.C. Ultrasonic Velocity Measurement of Epoxy Composite for GIS Based on Through-transmission Method. In Proceedings of the International Conference on Electrical Materials and Power Equipment, Guangzhou, China, 7–10 April 2019; pp. 716–720. [Google Scholar]
- Chang, X.L.; Li, S.H. The Vaccum Casting Producing Technology of Epoxy Resin. Shandong Ind. Technol. 2016, 10. [Google Scholar]
- Hao, L.C.; Yang, B.L.; Tian, H.; Li, J.C. Study of Process Technology of UHV Basin Insulator. Insul. Mater. 2014, 47, 45–49. [Google Scholar]
- Duquennoy, M.; Ouaftouh, M.; Ourak, M.; Xu, W.J. Influence of natural and initial acoustoelastic coefficients on residual stress evaluation: Theory and experiment. J. Appl. Phys. 1999, 86, 2490–2498. [Google Scholar] [CrossRef]
- Egle, D.M.; Bray, D.E. Measurement of acoustoelastic and third-order elastic constants for rail steel. J. Acoust. Soc. Am. 1976, 60, 740–744. [Google Scholar] [CrossRef]
- Hughes, D.S.; Kelly, J.L. Second-order elastic deformation of solids. Phys. Rev. 1953, 92, 1145–1149. [Google Scholar] [CrossRef]
- Nogueira, C.L. Ultrasonic evaluation of acoustoelastic in aluminium. J. Mater. Civ. Eng. 2017, 29, 04017158. [Google Scholar] [CrossRef]
- Q/GDW 11127-2013. Specifications for Basin Insulator Used in 1100kV Gas-Insulated Metal-Enclosed Switchgear; State Grid: Beijing, China, 2014. [Google Scholar]
- Hao, Y.P.; Xie, H.K.; Wang, G.L. Assessment of insulation condition of generator stator bars based on velocity of ultrasonic waves. IEEE Trans. Dielectr. Electr. Insul. 2003, 10, 539–547. [Google Scholar]
- Tian, F.Y.; Hao, Y.P.; Zou, Z.Y.A.; Zheng, Y.; He, W.M.; Yang, L.; Li, L.C. An ultrasonic pulse-echo method to detect internal defects in epoxy composite insulation. Energies 2019, 12, 4804. [Google Scholar] [CrossRef]
- GB/T 13283-2008. Accuracy Class of Measuring Instruments and Display Instruments for Industrial Process Measurement and Control; General Administration of Quality Supervision; Inspection and Quarantine of the People’s Republic of China and Standardization Administration of the People’s Republic of China: Beijing, China, 2008.
- Zhou, K.; Pan, Q.X.; Shao, C.; Pan, R.P. Reliability evaluation of stress in the direction of thickness based on ultrasonic measurement method. In Proceedings of the IEEE International Conference on Mechatronics and Automation, Changchun, China, 5–8 August 2018; pp. 1481–1485. [Google Scholar]
- GB/T 27418-2017. Guide to the Evaluation and Expression of Uncertainty in Measurement; General Administration of Quality Supervision; Inspection and Quarantine of the People’s Republic of China and Standardization Administration of the People’s Republic of China: Beijing, China, 2017.
- Wu, W.L.; Zhang, Y.; Fu, Z.Q.; Qin, M. The combined uncertainty on the slope of zero-crossing linear fitting. J. Yunnan Univ. Natl. Nat. Sci. Ed. 2011, 20, 71–74. [Google Scholar]


| Acoustoelastic Coefficient | #1 Specimen | #2 Specimen | #3 Specimen | Average Value |
|---|---|---|---|---|
| K (×10−5/MPa) | 4.542 | 4.562 | 4.562 | 4.556 |
© 2020 by the authors. Licensee MDPI, Basel, Switzerland. This article is an open access article distributed under the terms and conditions of the Creative Commons Attribution (CC BY) license (http://creativecommons.org/licenses/by/4.0/).
Share and Cite
Zou, Z.; Hao, Y.; Tian, F.; Zheng, Y.; He, W.; Yang, L.; Li, L. An Ultrasonic Longitudinal Through-Transmission Method to Measure the Compressive Internal Stress in Epoxy Composite Specimens of Gas-Insulated Metal-Enclosed Switchgear. Energies 2020, 13, 1248. https://doi.org/10.3390/en13051248
Zou Z, Hao Y, Tian F, Zheng Y, He W, Yang L, Li L. An Ultrasonic Longitudinal Through-Transmission Method to Measure the Compressive Internal Stress in Epoxy Composite Specimens of Gas-Insulated Metal-Enclosed Switchgear. Energies. 2020; 13(5):1248. https://doi.org/10.3390/en13051248
Chicago/Turabian StyleZou, Zhouyiao, Yanpeng Hao, Fangyuan Tian, Yao Zheng, Weiming He, Lin Yang, and Licheng Li. 2020. "An Ultrasonic Longitudinal Through-Transmission Method to Measure the Compressive Internal Stress in Epoxy Composite Specimens of Gas-Insulated Metal-Enclosed Switchgear" Energies 13, no. 5: 1248. https://doi.org/10.3390/en13051248
APA StyleZou, Z., Hao, Y., Tian, F., Zheng, Y., He, W., Yang, L., & Li, L. (2020). An Ultrasonic Longitudinal Through-Transmission Method to Measure the Compressive Internal Stress in Epoxy Composite Specimens of Gas-Insulated Metal-Enclosed Switchgear. Energies, 13(5), 1248. https://doi.org/10.3390/en13051248