Abstract
Situations of internal stress in basin insulators inside gas-insulated metal-enclosed switchgear (GIS) can lead to cracks, which can influence the safety and stability of apparatus. However, there is currently no research on internal stress measurements for composites of GIS basin insulators, and only measurements for surface stress. In this paper, an internal stress measurement method for GIS epoxy composite is proposed using an ultrasonic longitudinal through-transmission technique based on the acoustoelastic effect. An internal stress measurement system is developed to investigate the relationship between the uniaxial compressive internal stress and the velocity of the ultrasonic wave vertical to the stress in epoxy composite within a range of 0–70 MPa, and to calculate the acoustoelastic coefficient of epoxy composite. The effects of system delay are eliminated in measuring the propagation time. Some epoxy composite cuboid specimens with similar materials and using a manufacturing process similar to those of 252 kV GIS basin insulators are synthesized, and the uniformity of the internal stress in cuboid specimens is verified by finite element simulation. The results reveal a linear increase of the ultrasonic longitudinal wave velocity with increasing stress. It has been shown that the average acoustoelastic coefficient of GIS epoxy composites, using the longitudinal waves vertical to the stress, is 4.556 × 10⁻⁵/MPa. Additionally, the absolute errors of the internal stress measurements are less than 12.397 MPa. This research shows that the ultrasonic method based on the acoustoelastic effect for measuring the internal stress in GIS epoxy composites is feasible.
1. Introduction
Gas-insulated metal-enclosed switchgear (GIS) has advantages that include high reliability, small ground space requirements, a long maintenance cycle, low environmental impact, flexible construction, good expansibility, etc. GIS is widely used in large-scale hydropower projects, urban high-voltage power grids installed on complex terrains and in narrow areas. As weakness components of GIS, basin insulators are internal insulators in GIS, as shown in Figure 1, and are used for electrical insulation, isolation of the gas chamber and supporting conductor, and mainly determine the safe and reliable operation of a GIS [1,2].
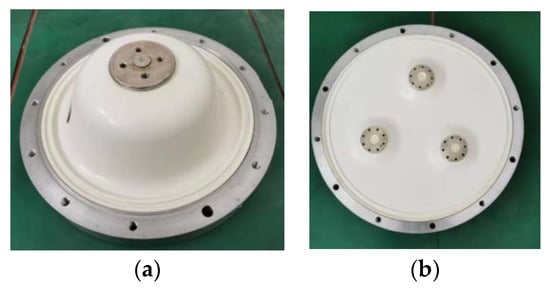
Figure 1.
Images of a gas-insulated metal-enclosed switchgear (GIS) basin insulator: (a) single-phase insulator; (b) three-phase in one tank insulator.
Basin insulators are thoroughly mixed by epoxy resin, alumina filler, and a curing agent in different contents, and they are then manufactured through the casting and curing processes [3]. Internal stress can be generated in basin insulators, during their manufacture, transportation, installation, and operation. In the manufacturing process, residual stress is caused by chemical shrinkage due to cross-link reactions and thermal shrinkage while cooling down from curing to room temperature [4]. In addition, internal stress results from the vibration and friction in the transportation; the mechanical force due to unbalanced installation and switching operations; the vibration induced by short-circuit electrodynamic force; the thermal gradient stress due to central conductor operating heating and the different thermal expansion coefficients between the epoxy composite and insert metal in the operation. The internal stress can cause microcracks, which gradually develop to larger sizes, and can lead to gas leakages, partial discharges, insulation flashover, ablation, and the cracking of the whole insulator.
For instance, in 2012, a gas leakage accident happened in a breaker functional unit of a porcelain bushing chamber at the high-voltage side of a transformer in a 220 kV GIS substation in Guangdong Province, China, which was induced by cracking in a basin insulator. This resulted from tangential compressive internal stress, due to an artificial uneven bolt fastening force [5]. An isolated static side basin insulator, in an isolating switch docked with a bushing, cracked in 2017. The conductor in the switch was inclined to the insulator, resulting in bending tangential compressive stress. The measurement and adjustment of the verticality of the bushing were absent during the bushing installation [6].
It has been reported that a surface stress distribution on a 252 kV GIS basin insulator was measured during a pressure test [1] by Shi et al. [7] using strain gages pasted on an insulator. They measured the surface stress distributions to investigate the developments of the cracking, and to find the vulnerable point on the surface of the insulators, which is useful for improving insulator design and increasing mechanical strength. In this method, it was only the surface stress, but not the internal stress, which was measured. However, the internal stress finally determines the vulnerable points and the mechanical strength of the insulators during the pressure tests [8]. Nevertheless, there is currently no proposition for measuring internal stress in basin insulators inside a GIS.
To measure internal stress, two kinds of methods could be used: destructive and non-destructive methods. The destructive methods are based on the relaxation of the stress in a material by cutting, breaking, machining, or similar methods, and thus lead to damage to the material. These include the hole-drilling method, ring core method, slot-cutting method, indentation method, layer removal method, etc. The non-destructive methods are based on the relationship between the internal stress and physical parameters, and include five main methods: X-ray diffraction method and neutron diffraction method, based on the evaluation of interplanar spacing in crystal materials [9]; the magnetic method, based on the magnetostriction effect in ferromagnetic materials [10]; the photoelasticity method, based on the birefringence exhibited by certain transparent materials [10]; the ultrasonic method, based on the relationship between stress and ultrasonic wave velocity [9].
Previous studies have shown that the ultrasonic method could non-destructively measure the internal stress in many composites [9]. The ultrasonic method for measuring internal stress is based on the acoustoelastic effect, and it is classified according to wave mode into longitudinal waves, shear waves, combinations of shear and longitudinal waves, critically refracted longitudinal waves, Rayleigh waves, etc. [11].
The ultrasonic stress measurement technique has been mainly developed for the case of metallic materials. Based on ultrasonic longitudinal waves parallel to stress, Jhang et al. [12] used the phase detection technique to precisely measure the propagation time in high-tension bolts and estimated the clamping forces. However, the effects of ultrasonic system delay were not eliminated in measuring the propagation time. Fukuoka et al. [13] applied the sing-around method to measure the wave velocity differences through ultrasonic shear waves and determined the residual stress distribution in a patch-welded circular plate made of mild steel. The method of combining shear and longitudinal waves was proposed by Pan et al. [14] to measure the tensile internal stress along the length of the bolts, made of austenitic stainless steel and low-carbon steel. This method could improve the measurement accuracy, as the effects of temperature and elastic deformation were eliminated. The residual stress in the near surface of patch-welded steel plates was measured by Bray et al. [15] using critically refracted longitudinal waves, which were excited by a longitudinal transmitter with the first critical incident angle. Duquennoy et al. [16] developed propagation equations of Rayleigh waves for measuring the residual stress in the lateral surface of aluminum alloy sheets after the quenching process, and the results were consistent with the destructive layer removal method.
At present, there are few investigations regarding the application of the acoustoelastic effect on the internal stress measurements in non-metal materials. Jia et al. [17] found that the velocity of the longitudinal waves changed linearly with the tensile internal stress in certain polymer materials, such as polycarbonate, polystyrene, polyamide, and polybutylene terephthalate. They used the longitudinal pulse-echo method to measure the ultrasonic velocity based on the time interval between first and second reflected waves at the back surface. Based on the longitudinal pulse-echo method, Xu et al. [18] observed a linear relationship between the longitudinal wave velocity and the compressive internal stress in polymer-bonded explosives, calculated the acoustoelastic coefficient, and measured the internal stress. In this method, the ultrasonic wave velocity was measured based on the propagation time obtained through a phase correlation algorithm, and the strain was obtained using a scanning acoustic microscope. Wang et al. [19] proposed an equation that determined the relationship between the stress, in the area beneath the surface, and propagation time of critically refracted longitudinal waves in a carbon-fiber-reinforced plastic composite, and concluded that the propagation time was linearly dependent on the stress. They calculated that the acoustoelastic coefficient was consistent with the experimental results.
There is only a report investigating the acoustoelastic effect in the fiber-reinforced epoxy composite with epoxy matrix, by Santos et al. [10], who employed the critically refracted longitudinal waves. They showed that the propagation time varied linearly with the tensile internal stress in the fiber direction of 0°, 45°, and 90° and the propagation time was the longest in the 0° direction. However, by using the Lcr waves technique, the stress measurements were only limited to the area beneath the surface of the epoxy composite, and the internal stress inside could not be measured. Additionally, the applications to calculating the stress, using the relationship between the stress and the propagation time, were not demonstrated.
In this study, the tangential compressive internal stress, resulting from mechanical compression in the epoxy composite specimens of GIS basin insulators, was measured based on the acoustoelastic effect. The method based on the longitudinal through-transmission technique, instead of the conventional pulse-echo method, is proposed for the GIS epoxy composite, because there is no second reflected wave at the back surface, due to the high attenuation and long propagation distance of the epoxy composite. The uniformity of the internal stress in cuboid epoxy specimens was verified through finite element simulation, which is important information that previous researchers were unable to make verifications. An internal stress measurement system is developed to investigate the relationship between the internal stress and the velocity of ultrasonic waves vertical to the stress in the epoxy composite, and to calculate the acoustoelastic coefficient. The system delay was measured using two epoxy specimens with two different thicknesses. Additionally, the internal stress measurement errors were calculated and analyzed.
2. Experiment
2.1. Epoxy Composite Specimen
In this study, epoxy composite cuboid specimens were manufactured by a company, with similar materials and manufacturing process to those of 252 kV GIS single-phase basin insulators, and the process is explained as follows. To begin, bisphenol A epoxy resin and alumina filler were mixed with a ratio of 1:4, and then the vacuum membrane degasification was conducted for the first time. Next, the anhydride-type curing agent was added and the mixture was thoroughly blended for 70–80 min; the time duration is long enough to ensure the materials are evenly distributed. The vacuum membrane degasification was conducted for the second time. The liquid mixture was then poured into a preheated casting mold with the speed in the range of 1.5–2 kg/min. Furthermore, two-stage curing was conducted. In the first curing cycle, the temperature was increased to 105 °C in two hours and then maintained for 15 h. In the second curing cycle, the temperature was increased to 155 °C and maintained for 15 h [20,21,22].
There were six cuboid specimens prepared, labeled as #1–6 specimens, with a length (a) of 45 mm, a width (b) of 30 mm, a height (h) of 35 mm, a density of 2.23 g/cm3, and an elastic modulus of 12.25 GPa. The length (a) was the same as the thickness of the 126 kV three-phase-in-one-tank type GIS basin insulators. The cuboid specimen has been used for ultrasonic compressive stress measurements in published reports [18,23,24,25,26]. If the material of the cuboid specimen is uniform, the internal stress in the specimen will be homogeneous [23]. The uniformity of the epoxy composite was regulated according to the standard: the difference in filler content should be less than 2% and the difference of density should be less than 0.2 g/cm3 [27]. Therefore, the internal stress in the cuboid epoxy specimen is homogeneous. The diameters of alumina filler in the epoxy specimens follow a normal distribution, with 20 μm medium diameter (D50), which is defined as the corresponding particle diameter when the cumulative particle diameter distribution percentage of a sample reaches 50% [21].
The #1, #2, and #3 specimens were used for investigating the relationship between internal stress and ultrasonic longitudinal wave velocity, as well as for calculating the acoustoelastic coefficient. Based on the obtained acoustoelastic coefficient, the internal stress of the #4, #5, and #6 specimens could be measured.
2.2. Testing System
In this study, an internal stress measurement system using an ultrasonic longitudinal through-transmission method for epoxy composite specimens similar to GIS basin insulators was set up. This system consists of an ultrasonic pulser/receiver, two ultrasonic transducers, an oscilloscope, a compression test machine, a strain test instrument and its strain foils, a computer, epoxy composite specimens, and connecting wires, as shown in Figure 2.
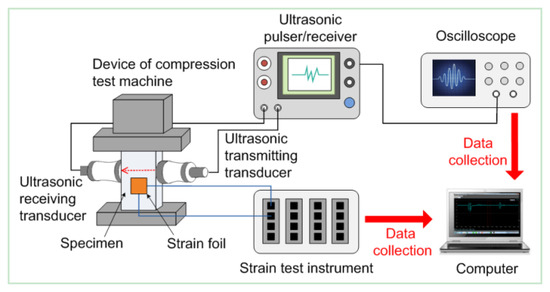
Figure 2.
A schematic diagram of the ultrasonic internal stress measurement system using the longitudinal through-transmission method for the GIS epoxy composite specimen.
In the experiment, the ultrasonic signals emitted by a transducer were originally generated by an ultrasonic pulser/receiver (CTS-23, Shantou Institute of Ultrasonic Instruments Co., Ltd., Shantou, China), with a frequency bandwidth of 0.5–3 MHz, an emitting pulse rise time of around 30 ns, and an A-scan type. The working mode of pitch and catch was selected to connect two transducers. The rectification signals, including positive, negative, and bidirectional signals, could be directly taken from the panel of CTS-23. In order to obtain original ultrasonic waveforms without rectification, CTS-23 was improved by connecting the oscilloscope directly with the point before the rectification mode in the electrical circuit inside the CTS-23. Thus, the waveforms that contained the most information could be obtained [28,29].
The transmitting and receiving transducers were general longitudinal straight beam transducers (2.5P20, Shantou Institute of Ultrasonic Instruments Co., Ltd., Shantou, China), with a central frequency of 2.5 MHz and a diameter of 20 mm. A QQ9 wire was used to connect the transducers and ultrasonic pulser/receiver. Water was used as the couplant between the transducers and the specimen. Rubber bands were employed to press the transducers against the specimen.
The electrical waveforms were observed with a digital oscilloscope (DPO4104), which was manufactured by Tektronix Co., Ltd. in Beaverton, OR, USA and purchased from Mei Da Ke Digital Technology Co., Ltd. in Guangzhou, China. The sampling frequency was 5 GS/s and the sampling period was 0.2 ns, which allowed for precise measurements of the ultrasonic propagation time in the specimen, as the smallest variation of the propagation time was more than 1 ns. The bandwidth of the oscilloscope was 20 MHz, which was sufficient for measuring the ultrasonic signals emitted at 2.5 MHz and could eliminate the noise with a frequency greater than 20 MHz.
The uniaxial compression tests performed on the specimen were operated by a microcomputer-controlled compression test machine (CMT5105, Shenzhen Xin San Si Material Detecting Co., Ltd., Shenzhen, China), with a capacity of 100 kN and an accuracy level of 1. The accuracy is equal to the ratio of the maximum absolute error and capacity; therefore, in the range of 100 kN, the accuracy class of 1 indicates that the maximum absolute error is 1 kN [30]. The uniaxial compressive loading, gradually increased by an equal-stress gradient with a speed of 0.5 mm/min, was applied on the specimen (stress was the ratio of force F to cross-sectional area and the cross-section was 45 mm (a) × 30 mm (b)). The propagation time was measured at each 5 MPa interval from 0 to 70 MPa, and thus, 15 times in total. As the cracks occurred in the specimen under approximately 130 MPa stress, the maximum allowable stress reached 70 MPa, corresponding to 94.5 kN, which was within the range of the compression test machine.
A high-performance static tester (JMTS-116, Jing Ming Technology Co., Ltd., Yangzhou, China) with strain foils was used to measure the strain of the specimens under stress along the z-direction. The strain foils were used to collect the strain data of εy in the y-direction and εz in the z-direction, shown in Figure 3. The strain accuracy of ±10−6 was sufficient in this study, as the strain variation was around 10−4. The dimensions of specimens were measured using a Mitutoyo micrometer with an error of 0.001 mm.
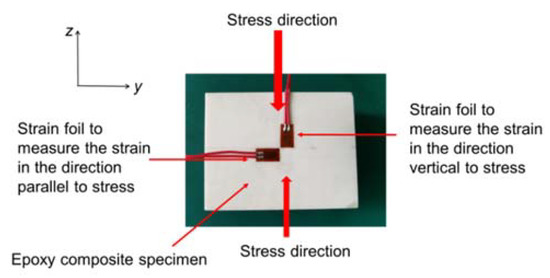
Figure 3.
A strain foil pasted on the specimen to measure strain.
2.3. Finite Element Simulation
A finite element simulation was employed to investigate the uniformity of internal stress in specimens during the compression experiments in the range of 0–70 MPa, using COMSOL software (COMSOL 5.4). This software was manufactured by COMSOL Co., Ltd. in Stockholm, Switzerland, and purchased from Kang Mo Shu Er Software Technology Co., Ltd. in Shanghai, China. The simulation model includes a three-dimensional cuboid epoxy specimen, which has the same dimensions and material properties, including the density, Young’s modulus, and Poisson’s ratio, as those of the specimens used in the experiments.
3. Principle
3.1. Ultrasonic Longitudinal Through-Transmission Method
The schematic diagram of the ultrasonic longitudinal through-transmission method, which requires one transmitting transducer and one receiving transducer, is depicted in Figure 4.
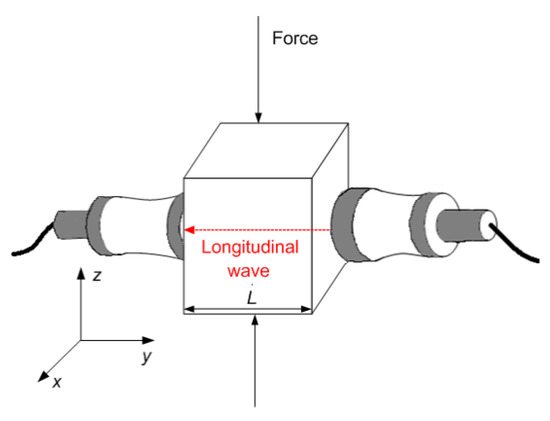
Figure 4.
The diagram of the ultrasonic internal stress measurement using the longitudinal through-transmission method.
The electrical waves from the ultrasonic pulser/receiver are converted into ultrasonic longitudinal waves by piezoelectric wafers in the transmitting transducer. After passing the propagation distance L in the specimen, the longitudinal waves are converted back into electrical waves by piezoelectric wafers in the receiving transducer. In Figure 4, the direction of the ultrasonic wave propagation is along the y-direction and the direction of the applied force is along the z-direction.
3.2. Acoustoelastic Effect
In the range of linear elasticity, the internal stress in a material obeys a linear relationship with the velocity of the ultrasonic wave propagating through it. This relationship is expressed as an acoustoelastic effect [9]. In this paper, ultrasonic longitudinal wave technology was used to measure the internal stress in epoxy composites.
The acoustoelastic equation for ultrasonic longitudinal waves in the case of uniaxial stress is defined as Equation (1) in the following [18]. Equation (1) is applicable to isotropic materials but not for composites. However, as this research is based on a composite material with uniaxial stress, Equation (1) can be applied in composites—only for uniaxial stress. Auteliano has applied equations for isotropic materials by using ultrasonic critically refracted longitudinal waves to investigate the uniaxial stress in carbon fiber composites with epoxy matrix [10].
where V0 is the ultrasonic longitudinal wave velocity in the initial stress state (m/s); σ0 is the initial stress (MPa); V is the ultrasonic longitudinal wave velocity in the stressed state (m/s); σ is the applied stress (MPa); K is the acoustoelastic coefficient (/MPa), which indicates the sensitivity of ultrasonic wave velocity to stress in the acoustoelastic effect [11].
Assuming the initial stress to be zero σ0 = 0, and then σ − σ0 = σ, dV = V − V0, Equation (1) can be written as follows:
The wave velocity variation dV to the stress variation σ can be indicated as the ratio k0. Combined with Equation (2), k0 can be expressed as follows:
Equation (3) can be derived as follows:
Equation (4) indicates that the acoustoelastic coefficient K can be calculated from k0 and V0. If K, σ0, and V0 are determined, according to Equation (1), σ can be calculated by measuring V in the unknown stressed state.
In the condition of uniaxial compression, the applied stress σ is equivalent to the internal stress σc. In this study, the proposed equation for calculating internal stress σc can be expressed as follows:
3.3. Deformation
The ultrasonic wave propagation distance L—shown in Figure 4 in the stressed state—is calculated as follows:
where L0 is the ultrasonic wave propagation distance in the specimen in the unstressed state along the y-direction. The dy is the elongation along the y-direction when the specimen is under a compressive loading along the z-direction. The calculation equation for the dy is given by the following:
3.4. System Delay
The propagation time T in the specimen is calculated as follows:
where T1 is the time interval from the wave peak time of the transmitting wave to the wave peak time of the receiving wave. T0 is the system delay, which is mainly originated from the following two aspects. One is the electrical delay. There exists a delay in transmitting a pulse to piezoelectric wafers, due to triggering, conversion, and transmission in the connecting wires. The other is the acoustic delay: this is the time required for the ultrasonic waves to pass through the couplant to the specimen, which is similar for the receiving process.
A method is proposed to measure T0 by using two specimens, labeled as A and B, with a thickness of L0a and L0b in the unstressed state. For the A and B specimens, the time interval between the first wave peak time of the ultrasonic transmitting wave and receiving wave are indicated as T1a and T1b, and the ultrasonic propagation times are indicated as Ta and Tb. Therefore, the propagation time in the epoxy composite of thickness L0a − L0b is T1a − T1b, which does not include the system delay T0. As for the same material, the ratio of the propagating time is equal to the ratio of the thickness, which can be expressed as follows:
Then, according to Equation (8), T0 can be calculated as:
3.5. Ultrasonic Longitudinal Wave Velocity
The ultrasonic longitudinal wave velocity V in the specimen is obtained as follows:
where L is the propagation distance and T is the propagation time.
4. Results and Analysis
4.1. Simulation Results
Through simulating the compression tests applied to the specimen, the uniformity of the internal stress can be determined. The simulation results for the stress state of 30 MPa are shown in Figure 5. From Figure 5, it can be observed that the von Mises volume stress of the specimen is homogeneous, and the direction of the first principle stress is along the z-direction. The simulation results in the stress states from 0 to 70 MPa all demonstrate the uniformity of internal stress.
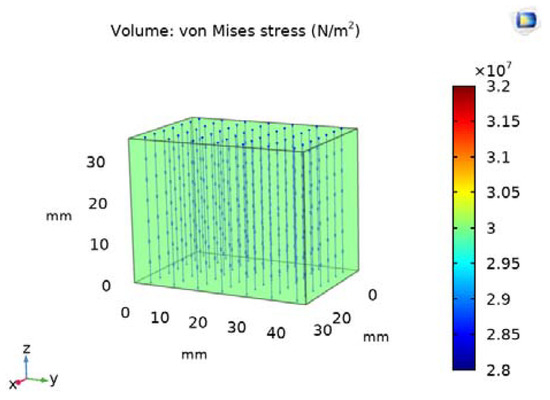
Figure 5.
The simulation of the internal stress in the specimen under a 30 MPa compressive stress.
4.2. Ultrasonic Waveforms
In the experiment, the attenuation of the ultrasonic pulser/receiver was adjusted to 48 dB and the ambient temperature was 15 °C. The voltage value u for the electrical waveforms for the #1 specimen, under stresses of 0, 20, 30, 50, 60, and 70 MPa, are shown in Figure 6.
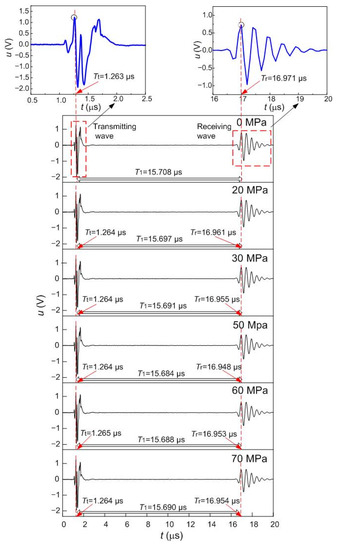
Figure 6.
The waveforms of the #1 specimen under different stresses.
In Figure 6, Tt is the wave peak time of the transmitting wave; Tr is the wave peak time of the receiving wave; T1 is the time interval from the wave peak time of the transmitting wave Tt to the wave peak time of the receiving wave Tr. An extremely small drop was found in T1 with a span of 0.025 μs, when the compressive loading on the #1 specimen is in the range 0–70 MPa. The variation of T1 is around 0.16% of 15.708 μs, which is the T1 in the stress state of 0 MPa.
4.3. System Delay
The method to measure the system delay T0 is proposed by measuring two specimens with thicknesses of 45.392 mm L0a and 30.215 mm L0b in the unstressed state. The time interval between the ultrasonic wave peaks, T1a, is 15.708 μs, and T1b is 10.819 μs. Based on Equation (9), Ta was calculated as 14.622 μs. Then, the system delay T0 was calculated as 1.086 μs, according to Equation (10).
4.4. Elongation dy in the Direction Vertical to the Stress
According to Equation (6), it is required to consider the elongation dy in the direction vertical to the compressive stress, when the propagation distance L is measured, is required. The stretching strain εy in the y-direction and the contracting strain εz in the z-direction of the #1 specimen under 0–70 MPa compressive loadings are presented in Figure 7. The dy values were obtained by substituting εy into Equation (7).
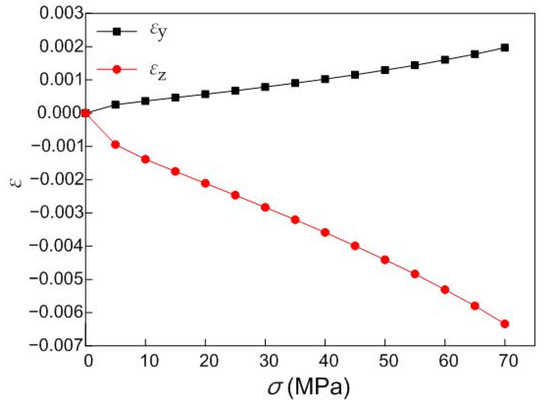
Figure 7.
The variation of the stretching strain εy and the contracting strain εz of the #1 specimen in the compression tests.
From Figure 7, it is found that the εy of the #1 specimen is 0.00197 under 70 MPa, indicating that the stretching deformation is 0.00197 of the original length (45.392 mm). Thus, the dy is 0.089 mm. In addition, the strain vertical to the stress is linearly increased with the increasing stress, while the strain parallel to the stress decreased, in the range of 0–70 MPa.
4.5. Wave Velocity–Stress Relationship
The internal stress measurement system with an ultrasonic longitudinal through-transmission method was used to measure the propagation time T and propagation distance L, the ultrasonic velocity V of the #1, #2, and #3 specimens and the results are shown in Figure 8. The T values were obtained from Equation (8); the L values were obtained from Equation (6); the ultrasonic longitudinal wave velocity V values were obtained from Equation (11). The linear fitting lines of the relationship between σ and V are plotted, and the line slopes k and the square of the Pearson correlation coefficients R2 are shown in Figure 8, where it can be observed that V linearly increases with increasing σ, with an R2 of 0.934–0.964.
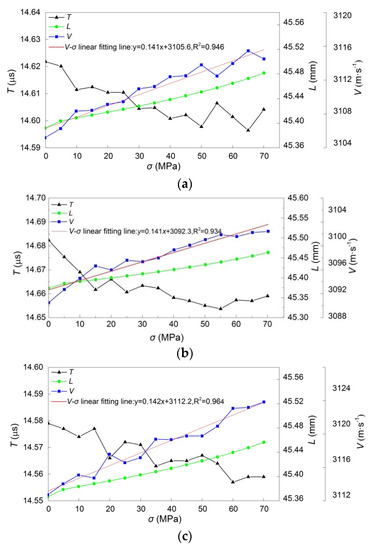
Figure 8.
The propagation time T, propagation distance L, and wave velocity V of the #1, #2, and #3 specimens under 0–70 MPa stress: (a) #1 specimen; (b) #2 specimen; (c) #3 specimen.
4.6. Acoustoelastic Coefficient
According to Equation (4), the acoustoelastic coefficient K is the ratio of k0 to V0. The k0 is the ratio of ultrasonic wave velocity variation to stress variation, which is equal to the slope k of the V – σ linear fitting. The K values of the #1, #2, and #3 specimens are listed in Table 1. The average acoustoelastic coefficient of the GIS epoxy composite using the longitudinal waves vertical to the stress is 4.556 × 10⁻⁵/MPa, which is smaller than the acoustoelastic coefficient of 96 × 10−5/MPa for a polymer-bonded explosive with longitudinal waves perpendicular to the stress [18], and slightly larger than the acoustoelastic coefficient of 2.68 × 10⁻⁵/MPa of low-carbon steel using longitudinal waves parallel to the stress [31].

Table 1.
Acoustoelastic coefficient K of longitudinal waves perpendicular to the stress in the #1, #2, and #3 epoxy specimens.
4.7. Compressive Internal Stress Measurement
The internal stress σc values of the #4, #5, and #6 specimens were calculated by substituting K into Table 1, and V0 of the #4, #5, and #6 specimens—measured as 3090 m/s—into Equation (5). Then, the measurement accuracy was verified by comparison of the calculated internal stress σc with the applied mechanical compressive stress, which was equivalent to the actual internal stress σa.
The T, L, and V of the #4, #5, and #6 specimens obtained in the same uniaxial compressive loading tests described for the #1, #2, and #3 specimens are demonstrated in Figure 9. By substituting V into Equation (5), the σc values were calculated. The assessment of uncertainty of calculated stress σc is presented in Appendix A. Then, after a comparison of σc with σa, the absolute error Ea and the relative error Er were calculated, as shown in Figure 10. Figure 10 presents the internal stress measurements under 14-times compression and the number of loading times is indicated as N.
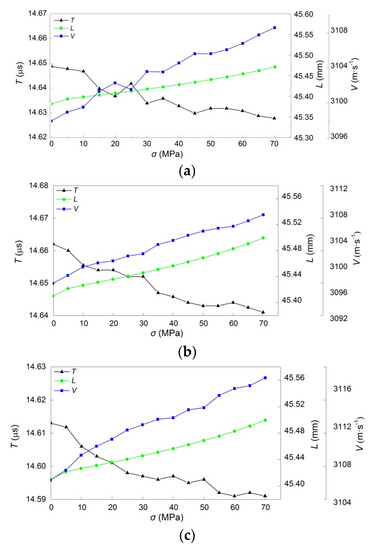
Figure 9.
The propagation time T, propagation distance L, and wave velocity V of the #4, #5, and #6 specimens under 0–70 MPa stress: (a) #4 specimen; (b) #5 specimen; (c) #6 specimen.
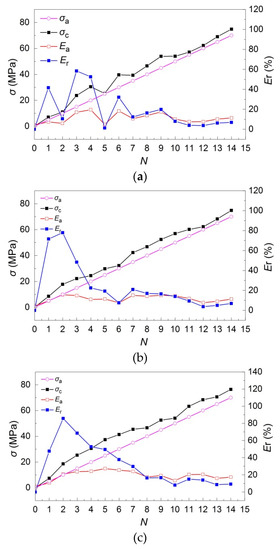
Figure 10.
The internal stress σa, calculated internal stress σc, absolute error Ea, and relative error Er of the #4, #5, and #6 specimens: (a) #4 specimen; (b) #5 specimen; (c) #6 specimen.
From Figure 10a–c, the largest Ea and Er are as follows. For the #4 specimen, Ea is the largest, with a value of 10.511 MPa in the stressed state of 20 MPa, and Er is the largest, with a value of 58.392% in the stressed state of 15 MPa. For the #5 specimen, Ea is the largest with a value of 7.794 MPa in the stressed state of 10 MPa, and Er is the largest, with a value of 77.942% in the stressed state of 10 MPa. For the #6 specimen, Ea is the largest, with a value of 12.397 MPa in the stressed state of 25 MPa, and Er is the largest with a value of 85.788% in the stressed state of 10 MPa. The largest Ea is in the range of 7.794–12.397 MPa under 10–20 MPa, and the largest Er is in the range of 58.392–85.788% under 10–25 MPa. Additionally, it can be plainly observed that the values of Er are large in the stress state of 10–15 MPa but less than 19.876% in the stress state of 40–70 MPa.
The reasons for these measurement errors are as follows. (1) The ratio k0 of the ultrasonic wave velocity variation to the stress variation is very small—only around 0.141 m/s/MPa—thus the small variation in the longitudinal velocity resulting from measurement errors can lead to a variation of the calculated internal stress. (2) Random errors are present in the measurements. For example, the signal noise can induce errors in the measurements of the propagation time. (3) The errors induced from the accuracy of the machines that perform the measurements, such as the sampling period of the oscilloscope, micrometer measurement errors, strain measurement errors from the strain test machine, and applied force errors from the compression test machine. (4) The deviation in dimensions during the manufacturing process of specimens can induce errors. (5) The varying propagation time in couplants under different operations can induce errors.
5. Conclusions
In this study, an internal stress measurement system using the proposed ultrasonic longitudinal through-transmission method was developed to measure the compressive internal stress in the epoxy composite specimens of GIS based on the acoustoelastic effect. The following conclusions can be drawn.
(1) The uniformity of the internal stress in cuboid epoxy composites can be verified through finite element simulation, in the case that the material is uniform.
(2) The ultrasonic longitudinal through-transmission method can be applied for the epoxy composite specimens of GIS with the property of the high attenuation and the long propagation distance. There is a good linear relation between the stress and ultrasonic longitudinal wave velocity, with a high linear correlation coefficient, in GIS epoxy composites. The average acoustoelastic coefficient of the GIS epoxy composites using the longitudinal waves vertical to the stress was found to be 4.556 × 10⁻⁵/MPa.
(3) The ultrasonic system delay should be considered in measuring the ultrasonic wave propagation time if the through-transmission method is used, and the delay can be measured using two specimens with different thicknesses.
(4) The internal stress has been calculated using the proposed method. The absolute errors of the ultrasonic internal stress measurements are less than 12.397 MPa, and the relative errors are large in the stress state of 10–15 MPa, with the largest value at 85.788% and less than 19.876% in the stress state of 40–70 MPa.
(5) The reason for the measurement errors include the small ratio of the ultrasonic wave velocity variation to the stress variation, random errors, instrument measurement errors, and dimension deviations during the manufacturing process of epoxy specimens.
This research shows that the ultrasonic internal stress measurement method for GIS epoxy composites is feasible, providing a basis for the research to measure the internal stress in basin insulators. The technique can be used as quality control for new insulators in factories and to analyze insulators after they go into disuse.
Author Contributions
Y.H. conceived and designed the experiments. She also provided the guidance in writing the paper. Z.Z. designed and performed the experiments. She also wrote the paper. F.T., Y.Z., and W.H. worked on the analysis part and helped in the experiments. L.Y. guided the writing. L.L. provided guidance on the tests. All authors have read and agreed to the published version of the manuscript.
Funding
This research was funded by Smart Grid Joint Fund Key Project between National Natural Science Foundation of China and State Grid Corporation, grant number U1766220.
Conflicts of Interest
The authors declare no conflict of interest.
Appendix A. Assessment of Uncertainty
The assessment of uncertainty of the calculated internal stress σc, is explained in Appendix A.
Appendix A.1. Uncertainty of Directly Measured Variables
Appendix A.1.1. The Uncertainty of L0, L0a, and L0b
The uncertainty of L0a, presented as u (L0a), contains two aspects. One is the type A evaluation of the standard uncertainty uA (L0a), due to random errors in artificial measurements, and another is the type B evaluation of the standard uncertainty uB (Loa), due to micrometer measurement errors of 0.001 mm, which are distributed following a uniform distribution [32].
The uA (L0a) can be calculated according to Equation (A1) [32]:
where uA (L0a) is the type A evaluation of standard uncertainty of L0a. n is the number of independent measurements. i is the integer and 1 ≤ i ≤ n.?L0a is the average value of the n measurements of L0a.
If L0a is measured 10 times, uA (L0a) can be calculated as follows:
The uB (L0a) can be calculated as follows:
The u (L0a) is the uncertainty combining uA (L0a) and uB (L0a), and it can be calculated as follows:
Similarly, u (L0a) and u (L0a) can be calculated as follows:
Appendix A.1.2. The Uncertainty of T1, T1a, and T1b
The uncertainty of T1 contains two aspects. One is the type A evaluation of standard uncertainty uA (T1), due to random errors in artificial measurements and signal noise. Another is the type B evaluation of standard uncertainty uB (T1), induced from errors, distributed according to a uniform distribution, due to the 0.2 ns sampling period of the oscilloscope [32].
If T1 is measured 10 times, uA (T1) can be calculated as follows:
The uB (T1) can be calculated as follows:
The u(T1) is the uncertainty combining uA (T1) and uB (T1), and it can be calculated as follows:
Similarly, u (T1a) and u (T1b) can be calculated as follows:
Appendix A.1.3. The Uncertainty of εy
The uncertainty of εy, presented as u (εy), is induced from the 10−6 error of the stain test instrument measurement, distributed according to a uniform distribution.
Appendix A.1.4. The Uncertainty of a, b, and h
The a, b, and h are labeled as the length, width, and height of the cuboid specimen. The uncertainty of a, presented as u(a), contains three aspects. The first is the type A evaluation of the standard uncertainty uA (a), due to random errors in artificial measurements. The second is the type B evaluation of the standard uncertainty uB1 (a), induced from errors, due to micrometer measurement errors of 0.001 mm, which are distributed following the uniform distribution. The third is the type B evaluation of the standard uncertainty uB2, induced from the dimension deviation of 0.4 mm in the manufacturing process of specimens [32]. The u (a) can be calculated as follows:
Similarly, u(b), and u(h) can be calculated as follows:
Appendix A.1.5. The Uncertainty of F
F is the applied compressive force on the specimen from the compression test machine. The uncertainty of F, presented as u (F), is induced from the 1 kN measurement error of the stain test instrument, distributed according to a uniform distribution.
Appendix A.2. The Uncertainty of Intermediate Variables
Appendix A.2.1. The Uncertainty of T0
The expression of T0 can be expanded according to Equations (9) and (10) and written as follows:
Then, u (V) is expressed as follows [32]:
We take the first derivative of T0 with respect to T1a, T1b, L0a, and L0b, respectively.
Therefore,
Appendix A.2.2. The Uncertainty of V
Equation (11), for calculating V, can be expanded as Equation (A24), after being combined with Equations (6), (7), and (8).
Then, u (V) is expressed as follows [32]:
We take the first derivative of V with respect to L0, εy, T1, and T0, respectively.
Table A1.
u (V) in the cases of 0–70 MPa stress.
Table A1.
u (V) in the cases of 0–70 MPa stress.
| σ (MPa) | 0 | 5 | 10 | 15 | 20 | 25 | 30 | 35 |
| u (V) (m/s) | 1.424 | 1.424 | 1.426 | 1.426 | 1.427 | 1.427 | 1.427 | 1.427 |
| σ (MPa) | 40 | 45 | 50 | 55 | 60 | 65 | 70 | |
| u (V) (m/s) | 1.427 | 1.428 | 1.427 | 1.428 | 1.428 | 1.428 | 1.428 |
Appendix A.2.3. The Uncertainty of σa
The actual compressive stress σa, applied on the specimen, is the ratio of force F to the cross-sectional area a × b, presented in Equation (A30).
Then, ua (σ) is expressed as follows [32]:
Table A2.
u (σa) in the cases of 0–70 MPa stress.
Table A2.
u (σa) in the cases of 0–70 MPa stress.
| σ (MPa) | 0 | 5 | 10 | 15 | 20 | 25 | 30 | 35 |
| u (σa) (MPa) | 0 | 0.434 | 0.456 | 0.490 | 0.534 | 0.586 | 0.643 | 0.705 |
| σ (MPa) | 40 | 45 | 50 | 55 | 60 | 65 | 70 | |
| u(σa) (MPa) | 0.770 | 0.838 | 0.908 | 0.980 | 1.052 | 1.125 | 1.090 |
Appendix A.2.4. The Uncertainty of k:
The equation for the combined uncertainty of the linear fitting line slope k is shown in Equation (A35), containing the type A evaluation of uncertainty and type B evaluation uncertainty [33]:
where k is the fitting line slope, with a value of 0.141. R is the Pearson correlation coefficient, with a value of 0.973. n is the number of datapoints, with a value of 15.
Table A3.
u (k) in the cases of 0–70 MPa stress.
Table A3.
u (k) in the cases of 0–70 MPa stress.
| σ (kN) | 0 | 5 | 10 | 15 | 20 | 25 | 30 | 35 |
| u (k) (10−3m/s/MPa) | 8.939 | 9.079 | 9.093 | 9.116 | 9.149 | 9.191 | 9.242 | 9.302 |
| σ (kN) | 40 | 45 | 50 | 55 | 60 | 65 | 70 | |
| u (k) (10−3m/s/MPa) | 9.370 | 9.448 | 9.533 | 9.627 | 9.728 | 9.837 | 9.784 |
Appendix A.2.5. The Uncertainty of K
The acoustoelastic coefficient K is a ratio of k to V0. The uncertainty of the acoustoelastic coefficient u (K) is expressed as follows [32]:
Table A4.
u (K) in the cases of 0–70 MPa stress.
Table A4.
u (K) in the cases of 0–70 MPa stress.
| σ (kN) | 0 | 5 | 10 | 15 | 20 | 25 | 30 | 35 |
| u (K) (10−6/MPa) | 2.886 | 2.931 | 2.935 | 2.943 | 2.953 | 2.967 | 2.983 | 3.002 |
| σ (kN) | 40 | 45 | 50 | 55 | 60 | 65 | 70 | |
| u (K) (10−6/MPa) | 3.024 | 3.049 | 3.077 | 3.107 | 3.140 | 3.175 | 3.158 |
Appendix A.3. The Uncertainty of σc
The internal stress σc can be calculated according to Equation (11). The uncertainty of σc, presented as u (σc), is expressed as follows:
The uncertainty of the measured internal stress σc, presented as u (σc), in the cases of 0–70 MPa stress σ are shown in Table A5.
Table A5.
u (σc) in the cases of 0–70 MPa stress.
Table A5.
u (σc) in the cases of 0–70 MPa stress.
| σ (kN) | 0 | 5 | 10 | 15 | 20 | 25 | 30 | 35 |
| u (σc) (MPa) | 14.269 | 14.281 | 14.298 | 14.369 | 14.427 | 14.387 | 14.531 | 14.532 |
| σ (kN) | 40 | 45 | 50 | 55 | 60 | 65 | 70 | |
| u (σc) (MPa) | 14.630 | 14.753 | 14.761 | 14.830 | 14.941 | 15.099 | 15.226 |
References
- IEEE Std C37.122 TM-2010. IEEE Standard for High Voltage Gas-Insulated Substations Rated Above 52 kV; IEEE Power & Energy Society: New York, NY, USA, 2011. [Google Scholar]
- Qi, B.; Gao, C.J.; Li, C.R.; Xiong, J. The influence of surface charge accumulation on flashover voltage of GIS/GIL basin insulator under various voltage stresses. Int. J. Electr. Power Energy Syst. 2019, 105, 514–520. [Google Scholar] [CrossRef]
- Zhou, W.J.; Zheng, Y.; Yang, S.; Li, H.; Wang, B.S.; Qiao, S.Y. Detection of intense partial discharge of epoxy insulation in SF6 insulated equipment using Carbonyl Sulfide. IEEE Trans. Dielectr. Electr. Insul. 2016, 23, 2942–2948. [Google Scholar] [CrossRef]
- Exner, W.; Hein, R.; Mahrholz, T.; Wierach, P.; Monner, H.P.; Sinapius, M. Impact of nanoparticles on the process-induced distortions of carbon fiber reinforced plastics: An experimental and simulative approach. J. Appl. Polym. Sci. 2019, 136, 47031. [Google Scholar] [CrossRef]
- Zhou, Y.B.; Wan, S.W.; Zeng, X.W.; Li, S.Y.; Zhong, S.J. Cause analysis of a 220 kV GIS leakage and disc insulator breakage. Guangdong Electr. Power 2012, 25, 118–121. [Google Scholar]
- Li, J.P. Cause analysis of the two crackings of basin insulators in a substation extension project. Technol. Wind 2017, 18, 206. [Google Scholar]
- Shi, Y.Z.; Zhang, X.; Li, X.Y.; Huang, R.H.; Wei, J.R.; Yao, S.J. Judgment method of basin insulator rupture process based on the analysis of stress and strain. Insul. Surge Arresters 2015, 2, 19–22. [Google Scholar]
- Fei, L.F.; Gong, X.Y.; Chen, W. Factors influencing the water pressure of insulating spacer in GIS/GCB. High Volt. Appar. 2014, 50, 125–130. [Google Scholar]
- He, J.B.; Li, Z.H.; Teng, J.; Li, M.; Wang, Y. Absolute stress field measurement in structural steel members using the Lcr wave method. Measurement 2018, 122, 679–687. [Google Scholar] [CrossRef]
- Santos, A.A.; Ambiel, L.B.; Garcia, R.H.; Rodovalho, T.G. Stress analysis in carbon/epoxy composites using Lcr waves. J. Compos. Mater. 2014, 48, 3425–3434. [Google Scholar] [CrossRef]
- He, L.F.; Liu, J. Acoustoelasticity Technology, 1st ed.; Science Press: Beijing, China, 2002; pp. 142–143. [Google Scholar]
- Jhang, K.Y.; Quan, H.H.; Ha, J.; Kim, N.Y. Estimation of clamping force in high-tension bolts through ultrasonic velocity measurement. Ultrasonics 2006, 44, 1339–1342. [Google Scholar] [CrossRef]
- Fukuoka, H.; Toda, H.; Yamane, T. Acoustoelastic stress analysis of residual stress in a patch-weld disk. Exp. Mech. 1978, 18, 277–280. [Google Scholar] [CrossRef]
- Pan, Q.X.; Liu, S.; Li, X.; Xu, C.G. Characteristic evaluation on bolt stress by ultrasonic nondestructive methods. Adv. Mater. Sci. Eng. 2015, 134090. [Google Scholar] [CrossRef]
- Bray, D.E.; Junghans, P. Application of the LCR ultrasonic technique for evaluation of post-weld heat treatment in steel plates. NDT E Int. 1995, 28, 235–242. [Google Scholar] [CrossRef]
- Duquennoy, M.; Ouaftouh, M.; Ourak, M. Ultrasonic evaluation of stresses in orthotropic materials using Rayleigh waves. NDT E Int. 1999, 32, 189–199. [Google Scholar] [CrossRef]
- Jia, D.W.; Bourse, G.; Chaki, S.; Lacrampe, M.F.; Robin, C.; Demouveau, H. Investigation of stress and temperature effect on the longitudinal ultrasonic waves in polymers. Res. Nondestruct. Eval. 2014, 25, 20–29. [Google Scholar] [CrossRef]
- Xu, Y.; Yang, Z.F.; Zhou, H.Q.; Zhang, W.B. Application of acoustoelasticity in studying compressive stress state in Polymer bonded explosive. In Proceedings of the IEEE Far East Forum on Nondestructive Evaluation/Testing New Technology and Application, Zhuhai, China, 29–31 May 2015; pp. 95–99. [Google Scholar]
- Wang, W.; Zhang, Y.M.; Zhou, Y.F.; Meng, S.H.; Chen, D.K.K. Plane stress measurement of orthotropic materials using critically refracted longitudinal waves. Ultrasonics 2019, 94, 430–437. [Google Scholar] [CrossRef]
- Zou, Z.Y.A.; Yang, L.; Tian, F.Y.; Zheng, Y.; He, W.M.; Hao, Y.P.; Li, L.C. Ultrasonic Velocity Measurement of Epoxy Composite for GIS Based on Through-transmission Method. In Proceedings of the International Conference on Electrical Materials and Power Equipment, Guangzhou, China, 7–10 April 2019; pp. 716–720. [Google Scholar]
- Chang, X.L.; Li, S.H. The Vaccum Casting Producing Technology of Epoxy Resin. Shandong Ind. Technol. 2016, 10. [Google Scholar]
- Hao, L.C.; Yang, B.L.; Tian, H.; Li, J.C. Study of Process Technology of UHV Basin Insulator. Insul. Mater. 2014, 47, 45–49. [Google Scholar]
- Duquennoy, M.; Ouaftouh, M.; Ourak, M.; Xu, W.J. Influence of natural and initial acoustoelastic coefficients on residual stress evaluation: Theory and experiment. J. Appl. Phys. 1999, 86, 2490–2498. [Google Scholar] [CrossRef]
- Egle, D.M.; Bray, D.E. Measurement of acoustoelastic and third-order elastic constants for rail steel. J. Acoust. Soc. Am. 1976, 60, 740–744. [Google Scholar] [CrossRef]
- Hughes, D.S.; Kelly, J.L. Second-order elastic deformation of solids. Phys. Rev. 1953, 92, 1145–1149. [Google Scholar] [CrossRef]
- Nogueira, C.L. Ultrasonic evaluation of acoustoelastic in aluminium. J. Mater. Civ. Eng. 2017, 29, 04017158. [Google Scholar] [CrossRef]
- Q/GDW 11127-2013. Specifications for Basin Insulator Used in 1100kV Gas-Insulated Metal-Enclosed Switchgear; State Grid: Beijing, China, 2014. [Google Scholar]
- Hao, Y.P.; Xie, H.K.; Wang, G.L. Assessment of insulation condition of generator stator bars based on velocity of ultrasonic waves. IEEE Trans. Dielectr. Electr. Insul. 2003, 10, 539–547. [Google Scholar]
- Tian, F.Y.; Hao, Y.P.; Zou, Z.Y.A.; Zheng, Y.; He, W.M.; Yang, L.; Li, L.C. An ultrasonic pulse-echo method to detect internal defects in epoxy composite insulation. Energies 2019, 12, 4804. [Google Scholar] [CrossRef]
- GB/T 13283-2008. Accuracy Class of Measuring Instruments and Display Instruments for Industrial Process Measurement and Control; General Administration of Quality Supervision; Inspection and Quarantine of the People’s Republic of China and Standardization Administration of the People’s Republic of China: Beijing, China, 2008.
- Zhou, K.; Pan, Q.X.; Shao, C.; Pan, R.P. Reliability evaluation of stress in the direction of thickness based on ultrasonic measurement method. In Proceedings of the IEEE International Conference on Mechatronics and Automation, Changchun, China, 5–8 August 2018; pp. 1481–1485. [Google Scholar]
- GB/T 27418-2017. Guide to the Evaluation and Expression of Uncertainty in Measurement; General Administration of Quality Supervision; Inspection and Quarantine of the People’s Republic of China and Standardization Administration of the People’s Republic of China: Beijing, China, 2017.
- Wu, W.L.; Zhang, Y.; Fu, Z.Q.; Qin, M. The combined uncertainty on the slope of zero-crossing linear fitting. J. Yunnan Univ. Natl. Nat. Sci. Ed. 2011, 20, 71–74. [Google Scholar]
© 2020 by the authors. Licensee MDPI, Basel, Switzerland. This article is an open access article distributed under the terms and conditions of the Creative Commons Attribution (CC BY) license (http://creativecommons.org/licenses/by/4.0/).