1. Introduction
A microgrid can be seen as a small energy network composed of loads, Distributed Generators (DG), and in some cases, Energy Storage Systems (ESS) to support supply demands [
1]. Currently, conventional generation systems are shifting to lower capacity DG. In addition, the application of ESS is increasing and becoming very common. These technologies are significantly changing the energy landscape, spreading the concept of microgrids [
2].
The increasing adoption of lithium-ion batteries for use in stationary banks or other applications such as electric vehicles has led to a reduction in the production costs of this technology [
2]. Some studies showed that a price reduction of around 50% in lithium-ion batteries used in electric vehicles could occur over the next decade, keeping them at a lower cost than the price paid for stationary batteries’ kWh [
3]. Therefore, market interest in applications that benefit both the power grid and the environment is growing, which limits energy expenditure and reduces greenhouse gas emissions [
4].
The automotive EV market has been increasing over the years, due to the decrease in the cost of its components and the concerns to reduce greenhouse gas emissions [
4,
5,
6,
7,
8,
9]. These concerns have forced industries and countries to implement plans to reduce the consumption of fossil fuels, such as the European target to have an EV share of 80% by 2050 [
10]. However, this goal will add an extra demand of 150 GW in the European power system, resulting in demand peaks arising from EV charging stations [
8,
10,
11]. Hence, although EVs with Photovoltaic renewable sources (PV) can be a suitable environmental and economic option assisting the reduction of fossil fuel dependence, when a large number of units is considered, higher demand peaks may erupt, causing stresses to the power system [
4,
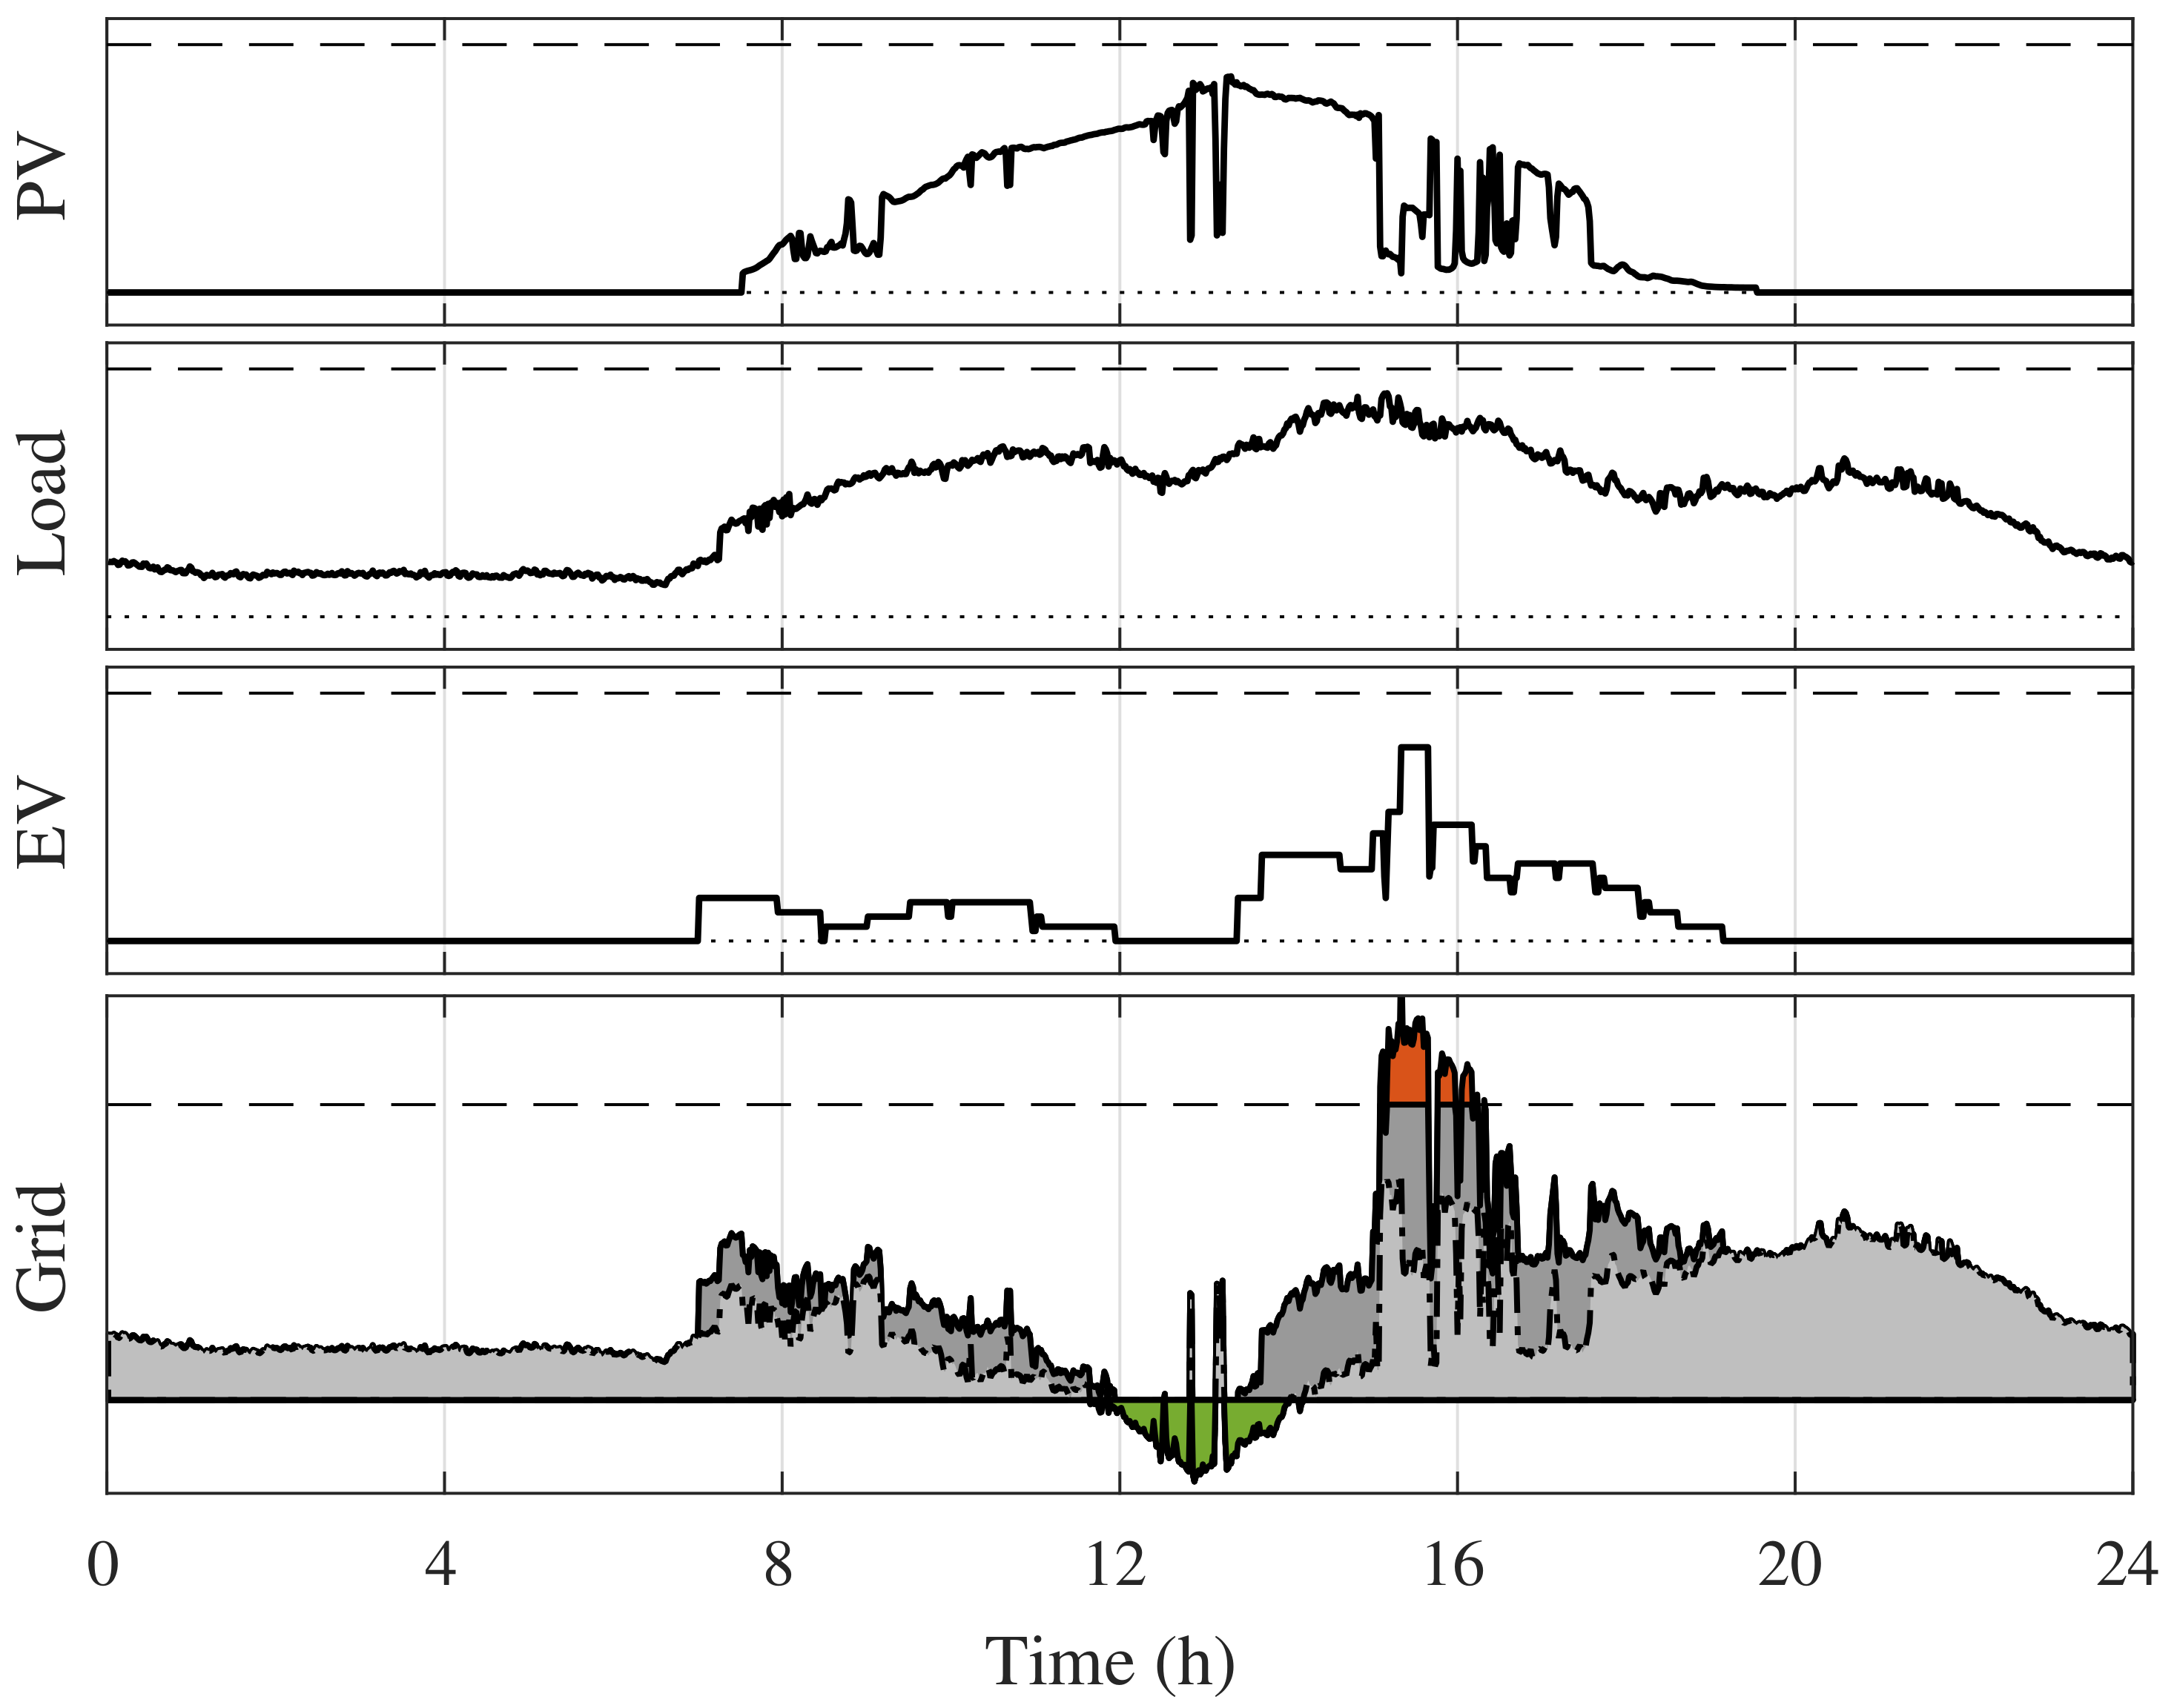
5]. A typical issue of microgrids with EV charging and PV generation can be seen in
Figure 1. The PV power depends on the solar irradiance while load and EV power are user dependent. The power grid results from the balance of EV, load, and PV generation.
It is noted that there are periods in which the microgrid demand exceeds the contracted power due to EV charging. In another case, the PV surplus is not efficiently utilized. The results of this analysis point to the need for an Energy Management System (EMS) that properly coordinates EV units in the microgrid and takes into account the occurrence of peak demand. In addition, the EVM-EMS is expected to be able to store surplus energy in EV batteries in order to supply the system when needed (Vehicle to Grid (V2G)). Electric vehicles can act both as an alternative energy storage and as a generator to support the grid, improving efficiency and reliability [
1,
5,
8,
9]. Even more, other functions can be added to the EMS to allow ancillary services of frequency and voltage regulation in distribution grids [
8]. Since for most of the parking time, the vehicles remain idle, the EVM-EMS enables more flexibility to the demand control [
5,
11].
If electric vehicles are properly considered in the management system, it may be possible to reduce demand peaks and integrate the elements of micro-grids. This will contribute to economic benefits, while using energy from renewable sources more efficiently and reliably. However, the coordination of intermittent power sources, dynamic loads, and unpredictability of EV, while maximizing efficiency and minimizing costs, implies a large number of obstacles that the EMS must overcome [
1,
2,
9,
11].
A significant number of techniques have been proposed for implementing microgrid managers in order to achieve multiple benefits, e.g., maximizing profit, minimizing operation costs, and reducing emissions. In [
12], a multivariable strategy was proposed that intended to minimize operation costs while decreasing voltage deviation in the IEEE 33 bus system.
Most of the management systems apply optimization methods and generation and demand forecasting to improve the results of microgrid operation. In [
13], irradiance and wind speed predictions were used for PV and wind renewable power sources and a heuristic based algorithm was built in the Python language. This strategy considers energy balance, charging limits, State Of Charge (SOC), and power generation. Another approach presented by [
14] investigated microgrid management considering the energy price, taking into account the energy exchange with external agents. Model Predictive Control (MPC) was employed in the optimization algorithm, which considered the operating cost and the battery degradation in the cost function specification. In [
6], the management established by the authors consisted of two parts: a modular topology that used an Autoregressive Integrated Moving Average (ARIMA) model for forecasting and Mixed-Integer Linear Programming (MILP) for optimization.
A two-step management strategy was presented in [
7], which separated the load profile calculation from the PV forecast estimate. Moreover, a few works described heuristics optimization techniques. The authors in [
15] formulated a game theory to minimize microgrid operation costs or maximize profit from generation units. Additional management methods handled hierarchical control to coordinate the active and reactive power dispatch [
16]. The proposed microgrid manager was verified for IEEE 33 buses. Furthermore, stochastic optimization techniques were used for frequency regulation and power management [
17], in which the authors followed a mixed strategy of a Bayesian estimator with a Kalman filter to achieve the energy price. Several other papers focused on real-time strategies for optimal power distribution. In [
18], the authors applied the MPC method to dispatch power among charging stations. In comparison with the proposed article, a similar EMS strategy was given by [
19], who proposed a new EMS approach that took the user preferences and prediction data into account, and the MILP method was chosen for the optimization using software MATLAB/GAMS to solve the computation.
This paper proposes a real-time optimized EMS with a multiple rule decision strategy for microgrids with electric vehicle charging stations. The microgrid is assumed to be comprised of dynamic user loads, PV units operating on the Maximum Power Point (MPP), and an EV parking lot with charging stations wherein all elements are connected to the external grid. The proposed scheme takes the PV generation forecast and the modes priority into account and applies dynamic programming for the optimization process, considering multiple factors in the cost functions. The proposed management system provides four EV charging modes to provide the user several options, as ultra/fast charging or energy/cost efficiency. The ECO and V2G modes apply dynamic programming to optimize the EV battery operation. The proposed approach takes into account the user preferences while aiming to alleviate the microgrid demand and make a profit for the facility owner. Moreover, the EMS system is implemented in a feasible architecture to verify the dynamic programming operation in real-time conditions.
The work is organized as follows:
Section 2 presents the proposed microgrid structure, while
Section 3 establishes the behavior model of EV and formulates the cost functions.
Section 4 presents the algorithm of the management supervisor and shows the dynamic programming method that is utilized. The results of the management strategy are carried out in
Section 5, while
Section 6 concludes the work.
2. Microgrid Arrangement Description
Microgrids with PV generation have been installed in a wide power range, from single string low power rooftops (∼1 kWp) up to multiple string power stations (∼5 MWp). Most PV powered microgrids include multiple user loads, such as lighting, electronics, motor-based loads, and demand controlled loads, e.g., air conditioners and water heating. Recently, with the growing EV power demand, charging stations have been also added to the microgrids.
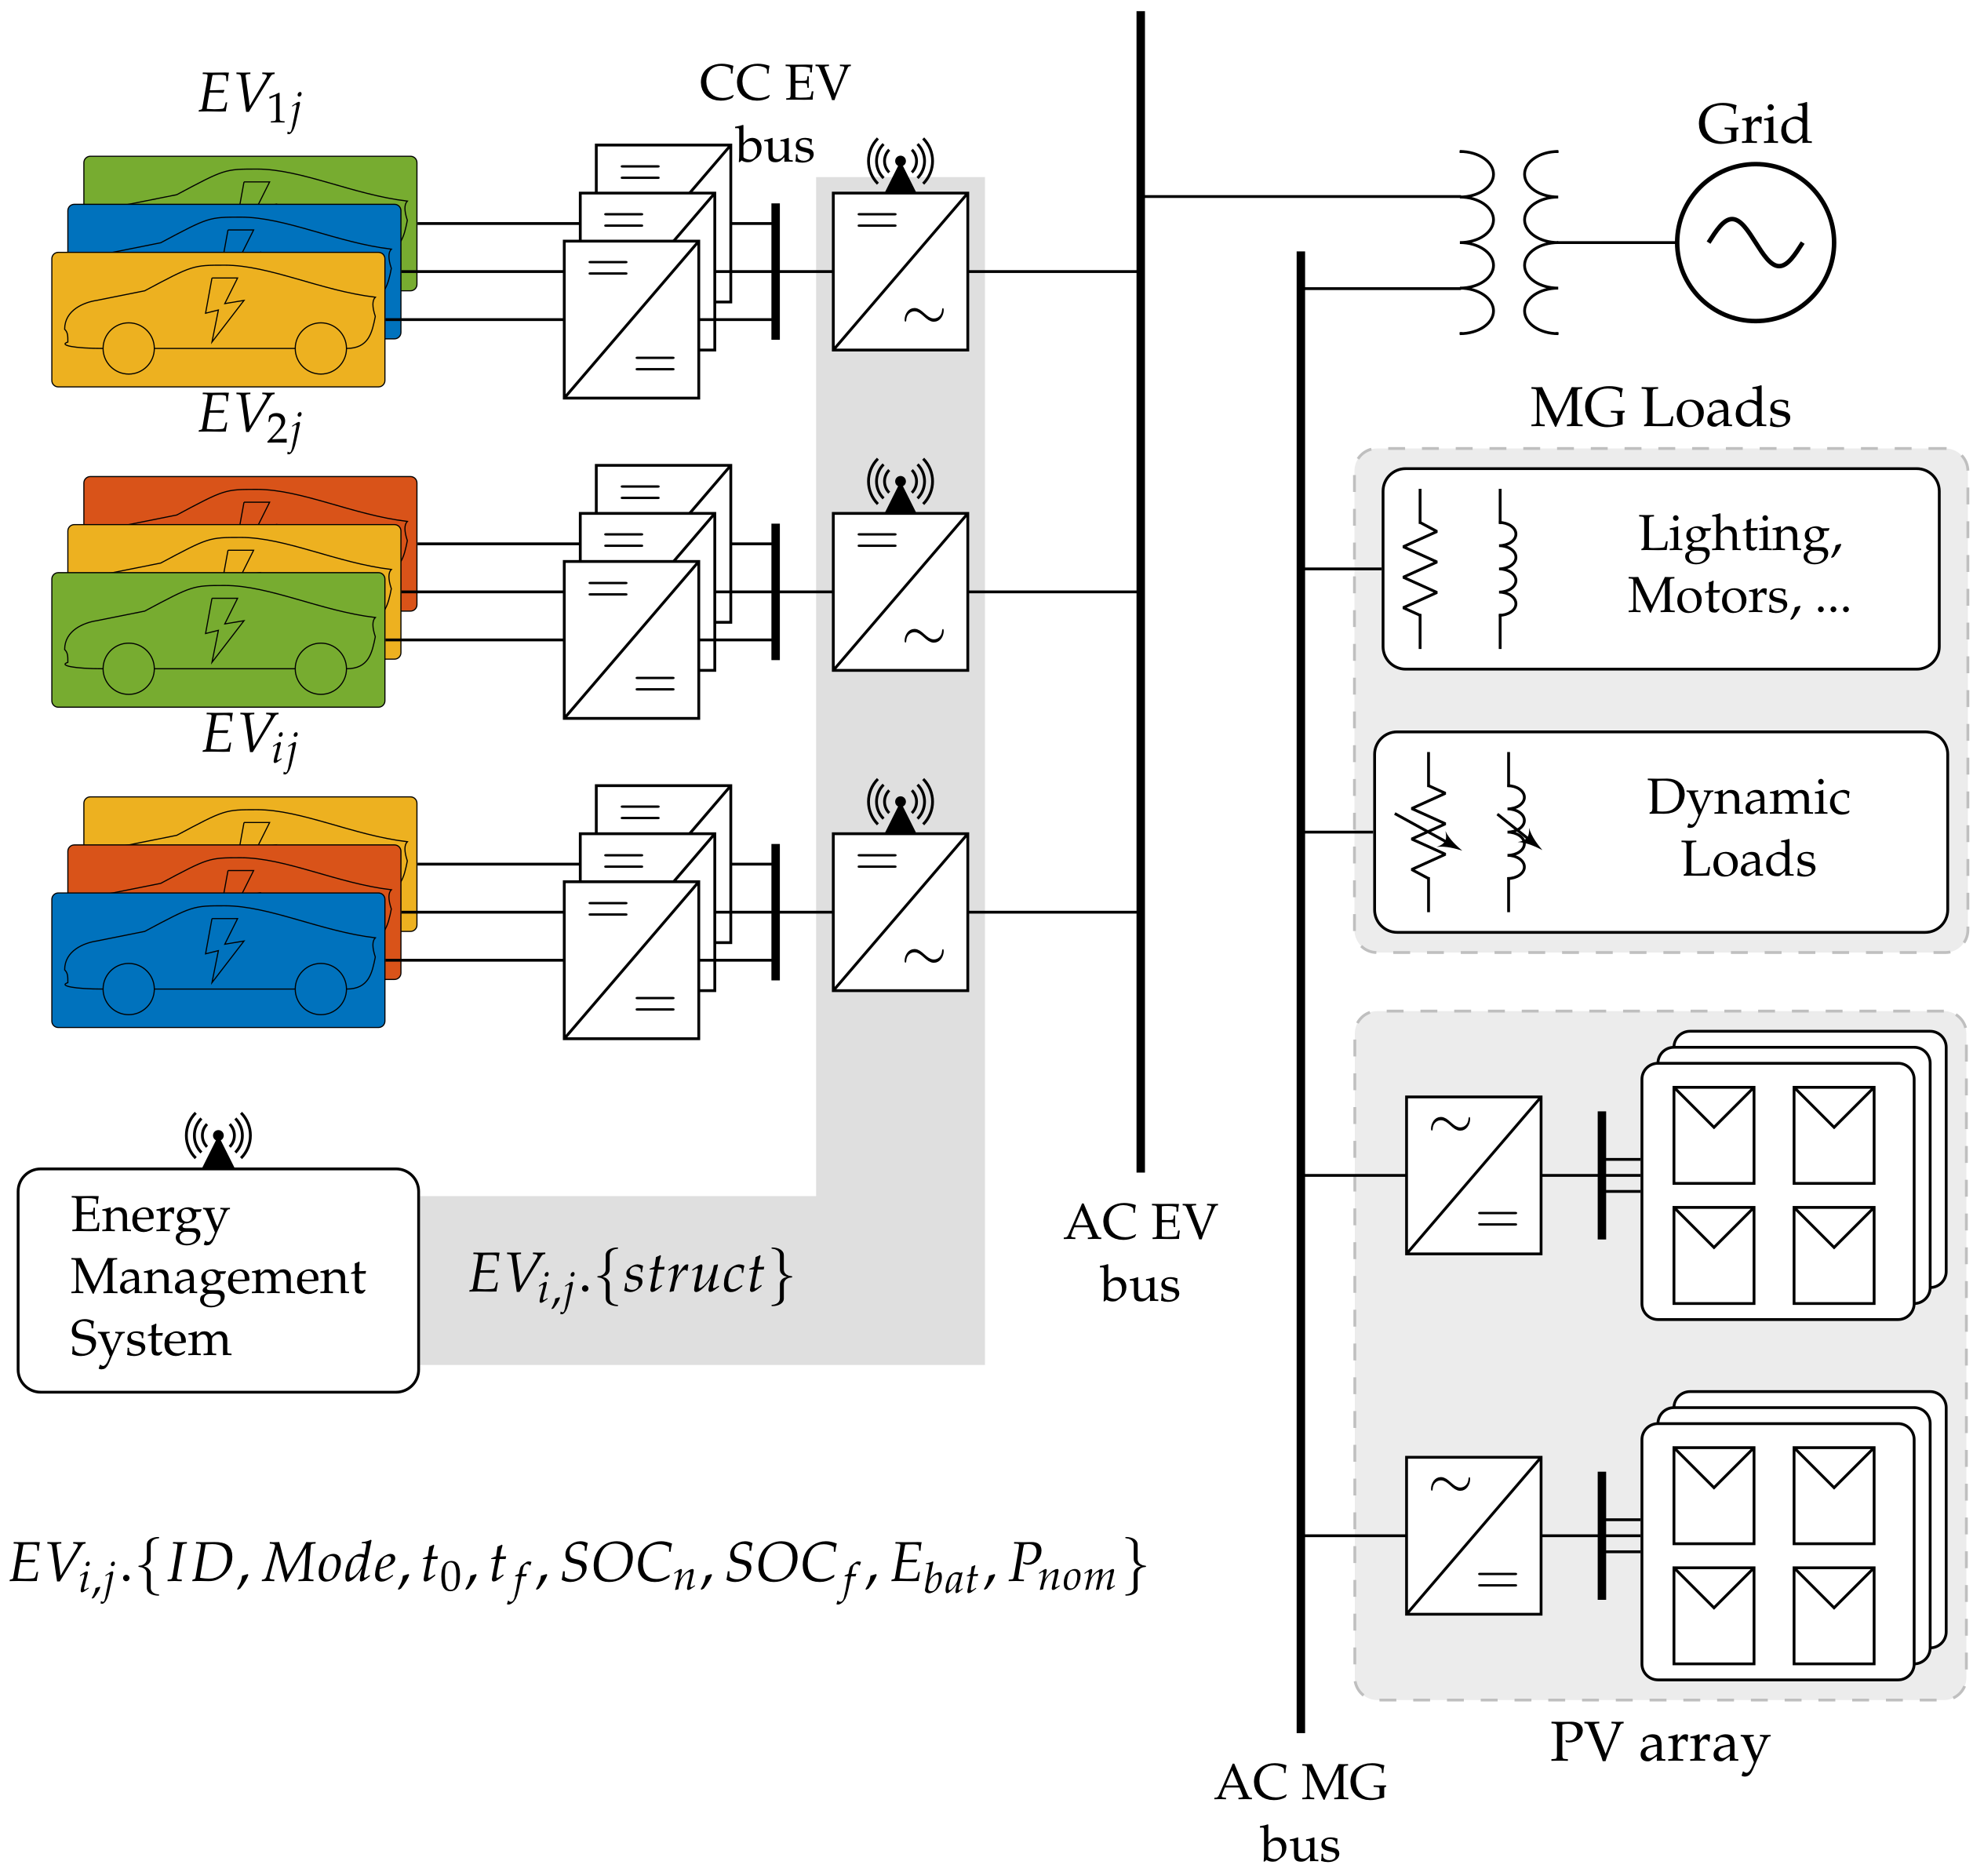
This paper considers a microgrid composed of user loads and PV arrays connected to an AC power bus (AC MG). The proposed arrangement also incorporates a few EV charging stations throughout a dedicated bus (AC EV). Both power buses are connected to the grid through a power transformer, as shown in
Figure 2. For simplicity, in this paper, only the active power will be considered for the optimization purposes, and therefore, the reactive power will not be taken into account. Likewise, the distribution impedance will not be considered; however, the efficiency of all converters will be taken into account. EV users can select the charging mode on any station, so that the same station can be used for different charging modes. In
Figure 2, each EV color represents a specific mode chosen by the user.
Microgrid loads are usually classified into static or dynamic loads. In this paper, it will be considered a typical demand profile of a commercial establishment, and the PV generation profile will be used to represent the different weather conditions. In
Figure 2, it is indicated that the EMS communicates with the converters by a communication path, and some EV information is acquired that will be used in the management.
2.1. Energy Management System
The proposed Energy Management System (EMS) block continuously collects power information from EV charging stations, the PV generation system, and microgrid demand. The EMS uses the power profile of all subsystems in order to coordinate the EV charging. To optimize the microgrid operation, EMS also collects the individual EV charging profile provided by the EV users upon arrival at the parking lot. The EV data profile consists of a data structure identified by , which includes identification, storage system profile, and user preference parameters, wherein i is related to the charger group and j specifies the outlet of the charger. The main information in the structure is: user/vehicle identifier (), charging mode chosen by the user (), connection time (), expected disconnection time (), current () and final desired SOC (), maximum battery capacity (), and nominal charging power ().
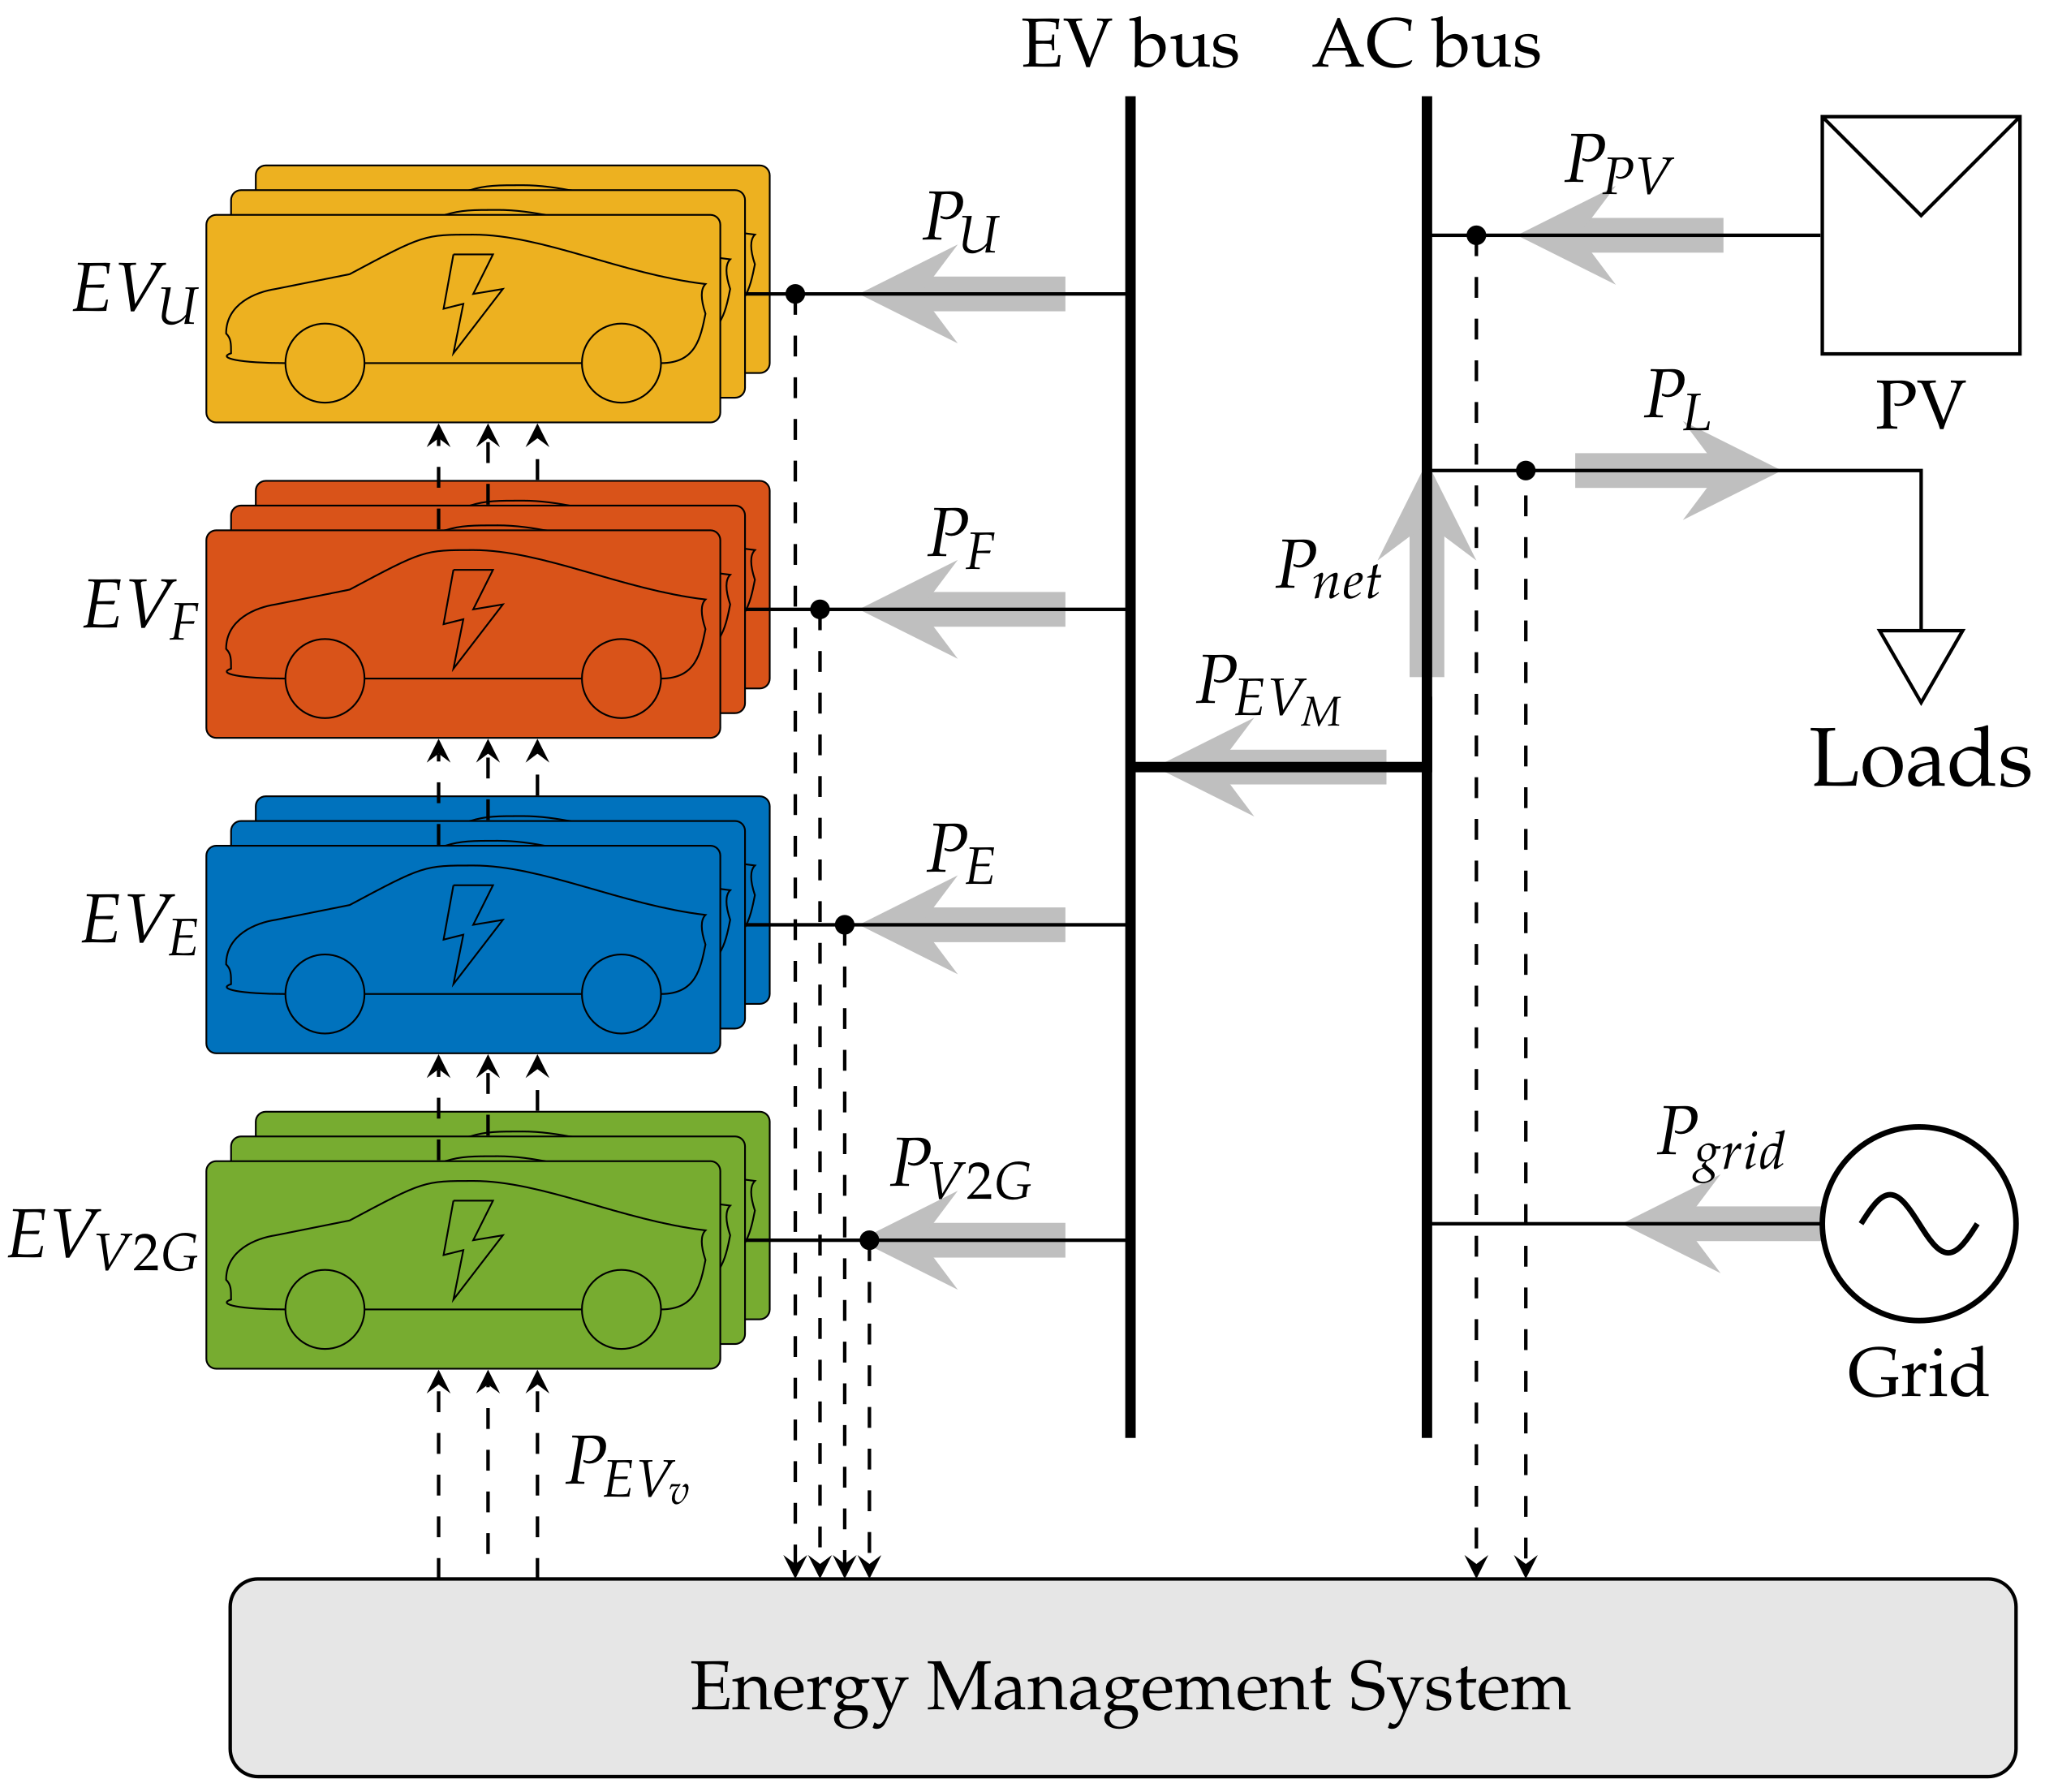
From the microgrid diagram, in
Figure 2, a simplified arrangement is proposed and brings together the EVs by charging modes (
), as presented in
Figure 3. The power flows in PV panels, and loads are identified by
and
, respectively. In addition, the EMS receives power system measurements and dispatches the individual charging commands
based on an optimization algorithm for all charging demands. The proposed EMS provides a set
of four EV charging modes: ULTRA, FAST, ECO, and V2G. The total power flows related to all vehicles in the same charging mode are given by
,
,
, and
, respectively.
Based on
Figure 3, it can be assumed that the power balance of the proposed system arrangement is given by
, herein
, and represents the resulting power between demand and generation.
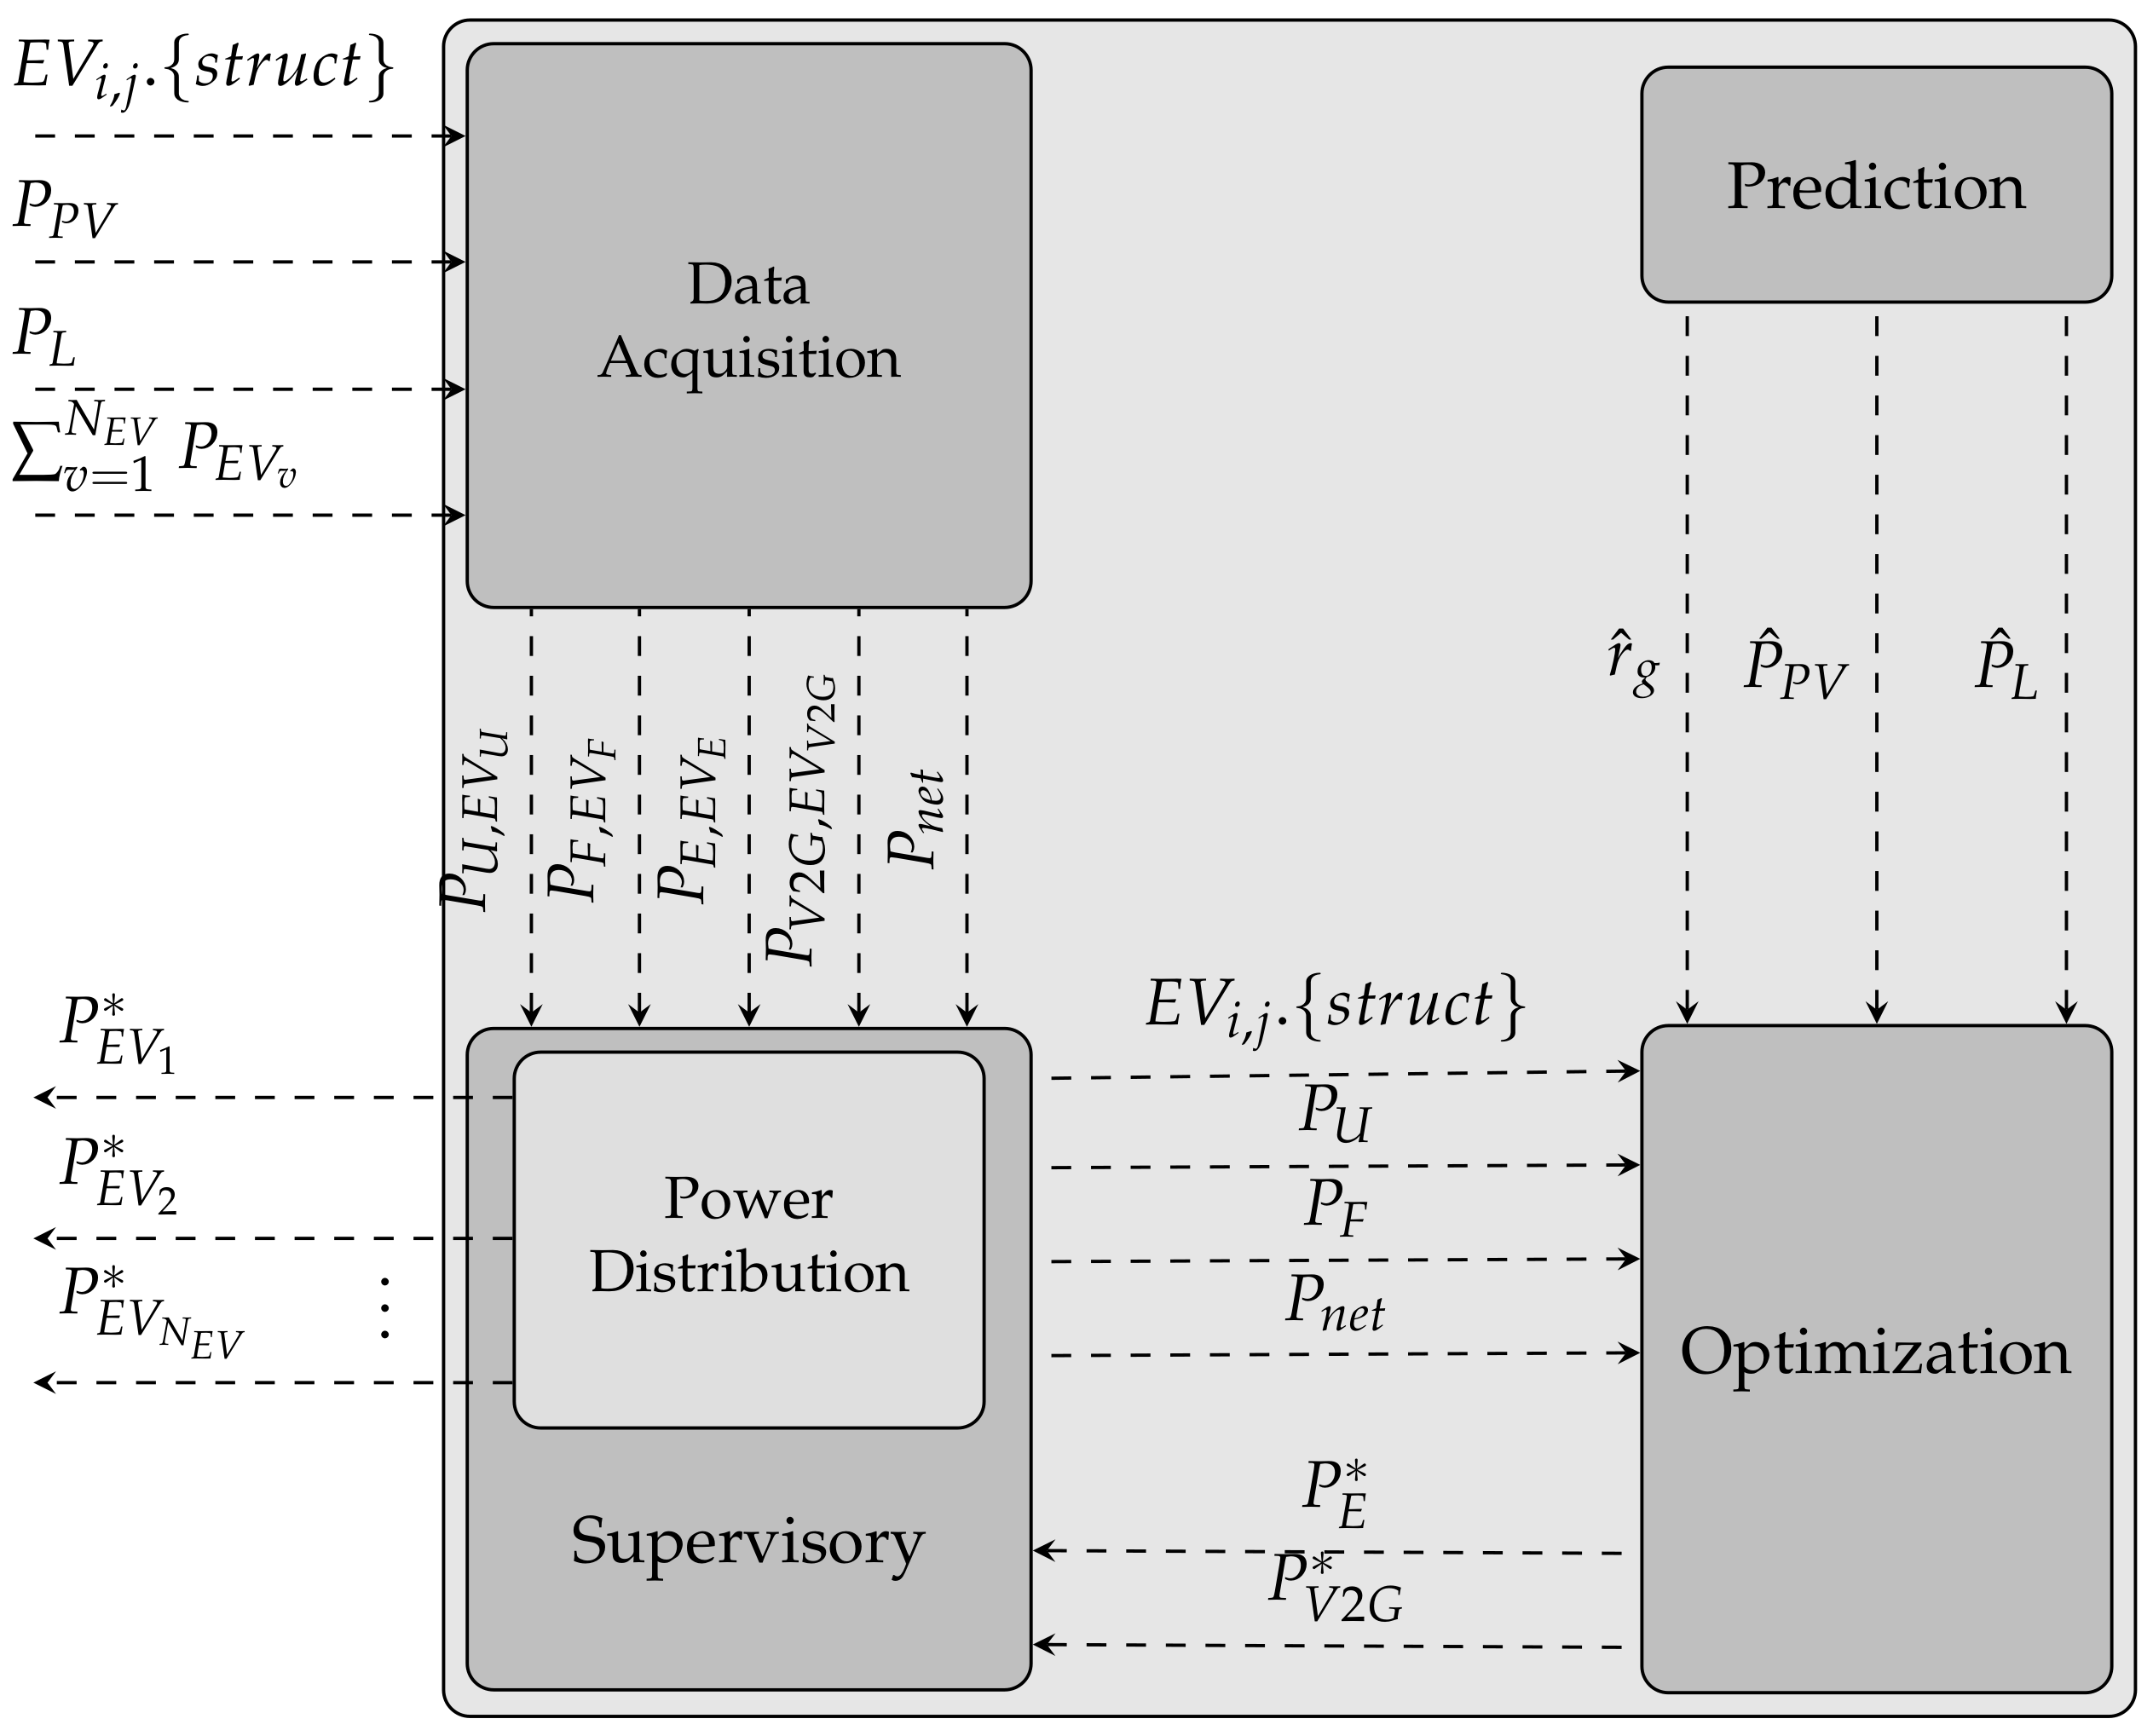
The logical architecture of the EMS block is defined in
Figure 4, and it consists of four functional modules: acquisition, supervision, optimization, and prediction.
2.2. EMS Operation
When a vehicle connects to the charger station, the EV user selects the desired charging profile, and an acquisition module reads and organizes data from EV users. Furthermore, the PV generation and load demand data are acquired continuously. The supervisor module manages the real-time tasks of the system. It receives the data from the acquisition module and verifies if it is necessary to perform an optimization operation. At each calculation step, the ULTRA and FAST power references are updated, and the supervisor module splits and sends the results to the inverter controllers. When ECO and V2G modes are selected, the supervisor also requests an optimization operation. In this case, a dynamic programming method is used to calculate the EV charging power references for all EV connection period. The optimization method uses dynamic programming in order to reach the optimal progression of charging throughout the day. In the optimization process, forecast data provided by the prediction module are used, such as energy price (), PV generation forecast (), and load demand ().
2.3. Operational Model of EV
For simplicity, a linear battery model can be applied to obtain the SOC behavior for each vehicle, which is given by:
wherein
is the total battery capacity to each
v vehicle,
is the charging/discharging efficiency, and
represents the resulting battery percentage one sample ahead
, based on charging power
available on current sample
n.
Fundamental restrictions are established for the
in order to adjust the EV performance and limit the control behavior
. Therefore, the SOC limits are given by:
which restricts the control performance to:
The EV connection status is defined as:
wherein
and
are arguments of the EV acquisition structure and are related to initial and final charging instants. Still,
indicates the current time inside the interval
. Initially,
is specified as
.
3. EMS Cost Factors
The cost functions are defined to achieve the EV profiles and the suitable system characteristics, e.g., peak shaving in high demand situations, desired SOC reaching, and profit from the energy exchange between the microgrid and distribution network (grid). It then discusses each part that constitutes the cost functions, so that specific features of each mode are taken into account.
3.1. State in the Final Time (ECO/V2G)
In order to establish a final value for the SOC, and thus enable a starting point for the dynamic programming method, it is proposed:
Herein,
represents the error between calculated
and the reference SOC for the last vehicle connection sample, where:
The gain defines a weight for the final state; represents the error between the desired SOC at final time and the calculated one ; and is the maximum capacity of each vehicle in ECO and V2G modes.
3.2. PCC Power Balance (ECO/V2G)
In order to indicate the power balance at the Point of Common Coupling (PCC) and to verify the energy exchange between the PV source, loads, and the EV, it can established that:
In this case, the EV is defined as the load type profile, wherein:
wherein
represents all vehicles in all modes, except the current vehicle.
In (
7),
is the weight associated with the influence of
in the cost function, e.g., such that the microgrid manager could attribute an extra charge for V2G energy;
is the purchase energy price from the external grid for sample
;
represents the optimal charging power. The variables
and
are the one day-ahead demand and PV generation, respectively, which are obtained from the prediction module. The variable
establishes the influence on the control law computation of all modes of the remaining vehicles. Therefore, the cost function takes the EV charging demand into account. The charging profile is calculated until the disconnection for all vehicles, regardless of the current instant. The term
is applied to equalize units of the factors of the cost function and to obtain the energy unit.
3.3. Generation Surplus (ECO/V2G)
The ECO mode is defined such the EMS commands the power stations to charge the EVs during the PV generation surplus or when the energy price is low. To accomplish this approach, a gain schedule
is added to the control response
in the PCC power balance factor. When a surplus occurs,
is lower than one, and the cost function prioritizes the charge of the EVs in both ECO and V2G modes. The surplus index is summarized as:
wherein
must be chosen in order to increase the charging rate when the PV generation overcomes
.
3.4. Battery Degradation (V2G)
Since V2G mode enables the vehicle to discharge, one of the aspects that must be taken into account is the battery degradation. This is an important issue for the user’s profit. This paper deals with temperature effects and Depth Of Discharge (DOD), considering the scenarios analyzed by [
20,
21]. Thereby, the factor associated with temperature degradation is given by:
Herein,
is the Lithium battery price per kWh (in this paper,
/kWh), and
L is the battery lifetime in seconds [
3].
In Equation (
11), the battery lifetime
describes the charging power influence on temperature, as:
where
a and
b are constants obtained from curves that relate cycles/charging time versus 50% DOD, available in [
20,
21].
is the ambient temperature, and
is the thermal resistance. From this analysis, it is demonstrated that the higher the temperature applied on the battery, the lower is
L.
The factor related to DOD degradation is considered only when discharging occurs, and it is given by:
wherein:
The gain includes a relative DOD weight; is the difference between possible values of SOC tested in optimization and the calculated SOC according to the control law applied from the possible values of power . The represents all quantized levels in the SOC state variable, while represents the quantized levels in the control law. Both are tested verifying all possibilities in a defined quantized space to achieve the minimum control law that results in the optimal state trajectory. The main idea of this factor is to balance the battery discharging, while minimizes the SOC difference.
3.5. Power Variation Limitation
The cost function of V2G mode also includes the charging power variation limitation, in order to avoid sudden changes in the control law. The limitation normalized by the maximum charger power is given by:
Herein, the gain establishes the maximum variation, and is the maximum charging power.
3.6. Energy Sale to the Grid
The possibility of supplying electric energy for the system through EV storage is one of the main characteristics of the proposed microgrid manager. Therefore, the cost factor of V2G mode to include the profit from the sale of energy can be established as:
The variable represents the sale price of energy, and it is defined as 0.55 $/kWh, taking the purchase price of energy into account; and is the efficiency of converters. Efficiency must be exceeded for the V2G energy sale to become viable.
4. EV Charging Modes Definition
From ULTRA up to V2G charging modes, the optimization functions have a dependence on different sets of inputs. The modes’ dependence is given by:
The charging modes are defined to have a specific behavior and operation specifications according to the user selection. The main role and characteristics of each charging mode are shown below:
The main stimulus of ULTRA mode is for vehicles that stay parked a short time and users that want high level priority. In this case, the nominal power charging () is applied if the microgrid demand is not exceeded considering the PV/loads’ power measurement (). No prediction data are used for this mode;
FAST mode is designed for users who want to pay less than ULTRA users for charging, but they will have reduced charging priority compared with the ULTRA ones. Analogous to the previous mode, the maximum permissible power charger is supplied, but in this case, it also takes the ULTRA demand into account. Again, no prediction data are used for this mode;
ECO mode is formulated for users who want to pay the minimum cost to get some charging. However, these users will be considered the lowest priority. From the user specified SOC and leaving time and with the PV generation and load demand forecast, the manager optimizes the charging such that the minimum $/kWh is applied. In this case, the final SOC is not guaranteed since it also depends on the energy cost and charging power of ULTRA and FAST vehicles, or if the user leaves before the specified departure hour.
V2G mode may discharge the vehicle to provide profit to the user while supplying the microgrid. Although it has high flexibility, it has a complex control considering a large number of variables. Analogous to ECO mode, it is handled with an optimization method to comply with all specifications, taking the demand of all modes into account, as well as the predicted data. V2G mode can also supply power to the other vehicles when the demand of the microgrid is not sufficient to attend to ULTRA/FAST charging requests.
It is noticed that the proposed charging modes are dependent on each other, since a priority order (ULTRA > FAST > ECO) is specified to manage the different charging modes. Therefore, during the periods when the microgrid reaches its demand limitation, the charging power will be maintained on the higher priority modes while it is reduced on other modes.
4.1. ULTRA Mode
In this mode, the charging power (
) is set to be the vehicle nominal power (
), whenever possible. If the microgrid reaches its contracted demand at the same
, the power is proportionally reduced to each vehicle in this mode, using the index
determined by:
wherein
is the demand contracted by the microgrid and
is the nominal power charging of each vehicle in this mode. If the microgrid has already reached the contracted demand before the charging power calculation,
is set to zero, and all vehicles in this mode are idle. Briefly, the charging power of ULTRA mode is proposed to be:
wherein
.
4.2. FAST Mode
This mode follows the same strategy applied in ULTRA mode, providing the maximum charging power, taking into account that the previous mode is already achieved. Whenever a microgrid power limitation occurs, FAST mode power dispatch is limited by the index
, given by:
wherein
indicates the sum of all vehicles in ULTRA mode. Like the previous mode, the limitation strategy is applied to this case; if the microgrid demand has already reached its limit, then
is set to zero. Thereby, the resultant charging power of the FAST mode may be written as:
Herein, .
4.3. ECO Mode
For the vehicles in ECO mode, the manager decides to charge them preferably when a PV surplus occurs or at periods of lower demand, therefore bringing savings for the user and benefits to the grid. From factors (
Section 3) related to this mode and using the optimization technique known as dynamic programming [
22], the cost function is formulated as:
where
is related to the factor presented in (
7). The dispatched power
of Equation (
7) is the one that causes the minimum cost
among all possible power sets (
), and it results in the optimal SOC trajectory. The definition of the optimal power
is then given by:
In a demand limitation case, the index of the charging power is calculated from:
Herein,
and
are the profiles already determined in (
19) and (
21). Furthermore, like ULTRA and FAST modes, if the microgrid demand has reached the demand limitation, then all vehicles in this mode become idle, due to
being set to zero. The resultant charging power for the ECO mode vehicles is specified by:
wherein
.
4.4. V2G Mode
Similar to ECO mode, the optimization technique and the factors previously described are used to formulate the cost function. Nevertheless, this mode is divided in two regions: , which represents (charging); and , which represents (discharging). The main idea is to deal with a specific design for each different region.
For the charging region
, the cost function is given by:
and for region
, it is written as:
The expressions (
26) and (
27) differ by the term
in the discharging region. Naturally,
due to the operating charging power in the region
being negative, though with the addition of
, the energy sale must overcome the degradation term to be feasible.
The dispatched power
is part of the set that comprises all possible quantized values
and implies the total minimum cost described by:
The optimal power definition
is given by:
In the case of the demand limitation related to vehicles in ULTRA and FAST modes and if the SOC of the EV is over 40%, the index of discharging power follows the same expression of ECO mode (see (
24)). However, in this case, the V2G vehicles discharge and supply the other modes and/or the load demand. Therefore, the resulting charging power for the V2G mode is defined by:
Herein, .
For this situation, the current charging power of ULTRA and FAST modes is recalculated considering the
charging power. In a scenario where the microgrid demand has reached the contracted demand prior to calculating the charging power, then the power dispatched to the vehicles in V2G mode is
. V2G mode vehicles may increase the virtually value of the contracted demand from the microgrid because they store energy. Thus, when there are no vehicles in V2G mode, the limitation imposed on ULTRA (see Equation (
18)) and FAST (see Equation (
20)) modes is performed. Otherwise, if the microgrid demand is above the limit and there is energy stored in the vehicles in V2G, the charging power of ULTRA and FAST modes will be set in the V2G algorithm.
4.5. Supervisory and Optimization Algorithms
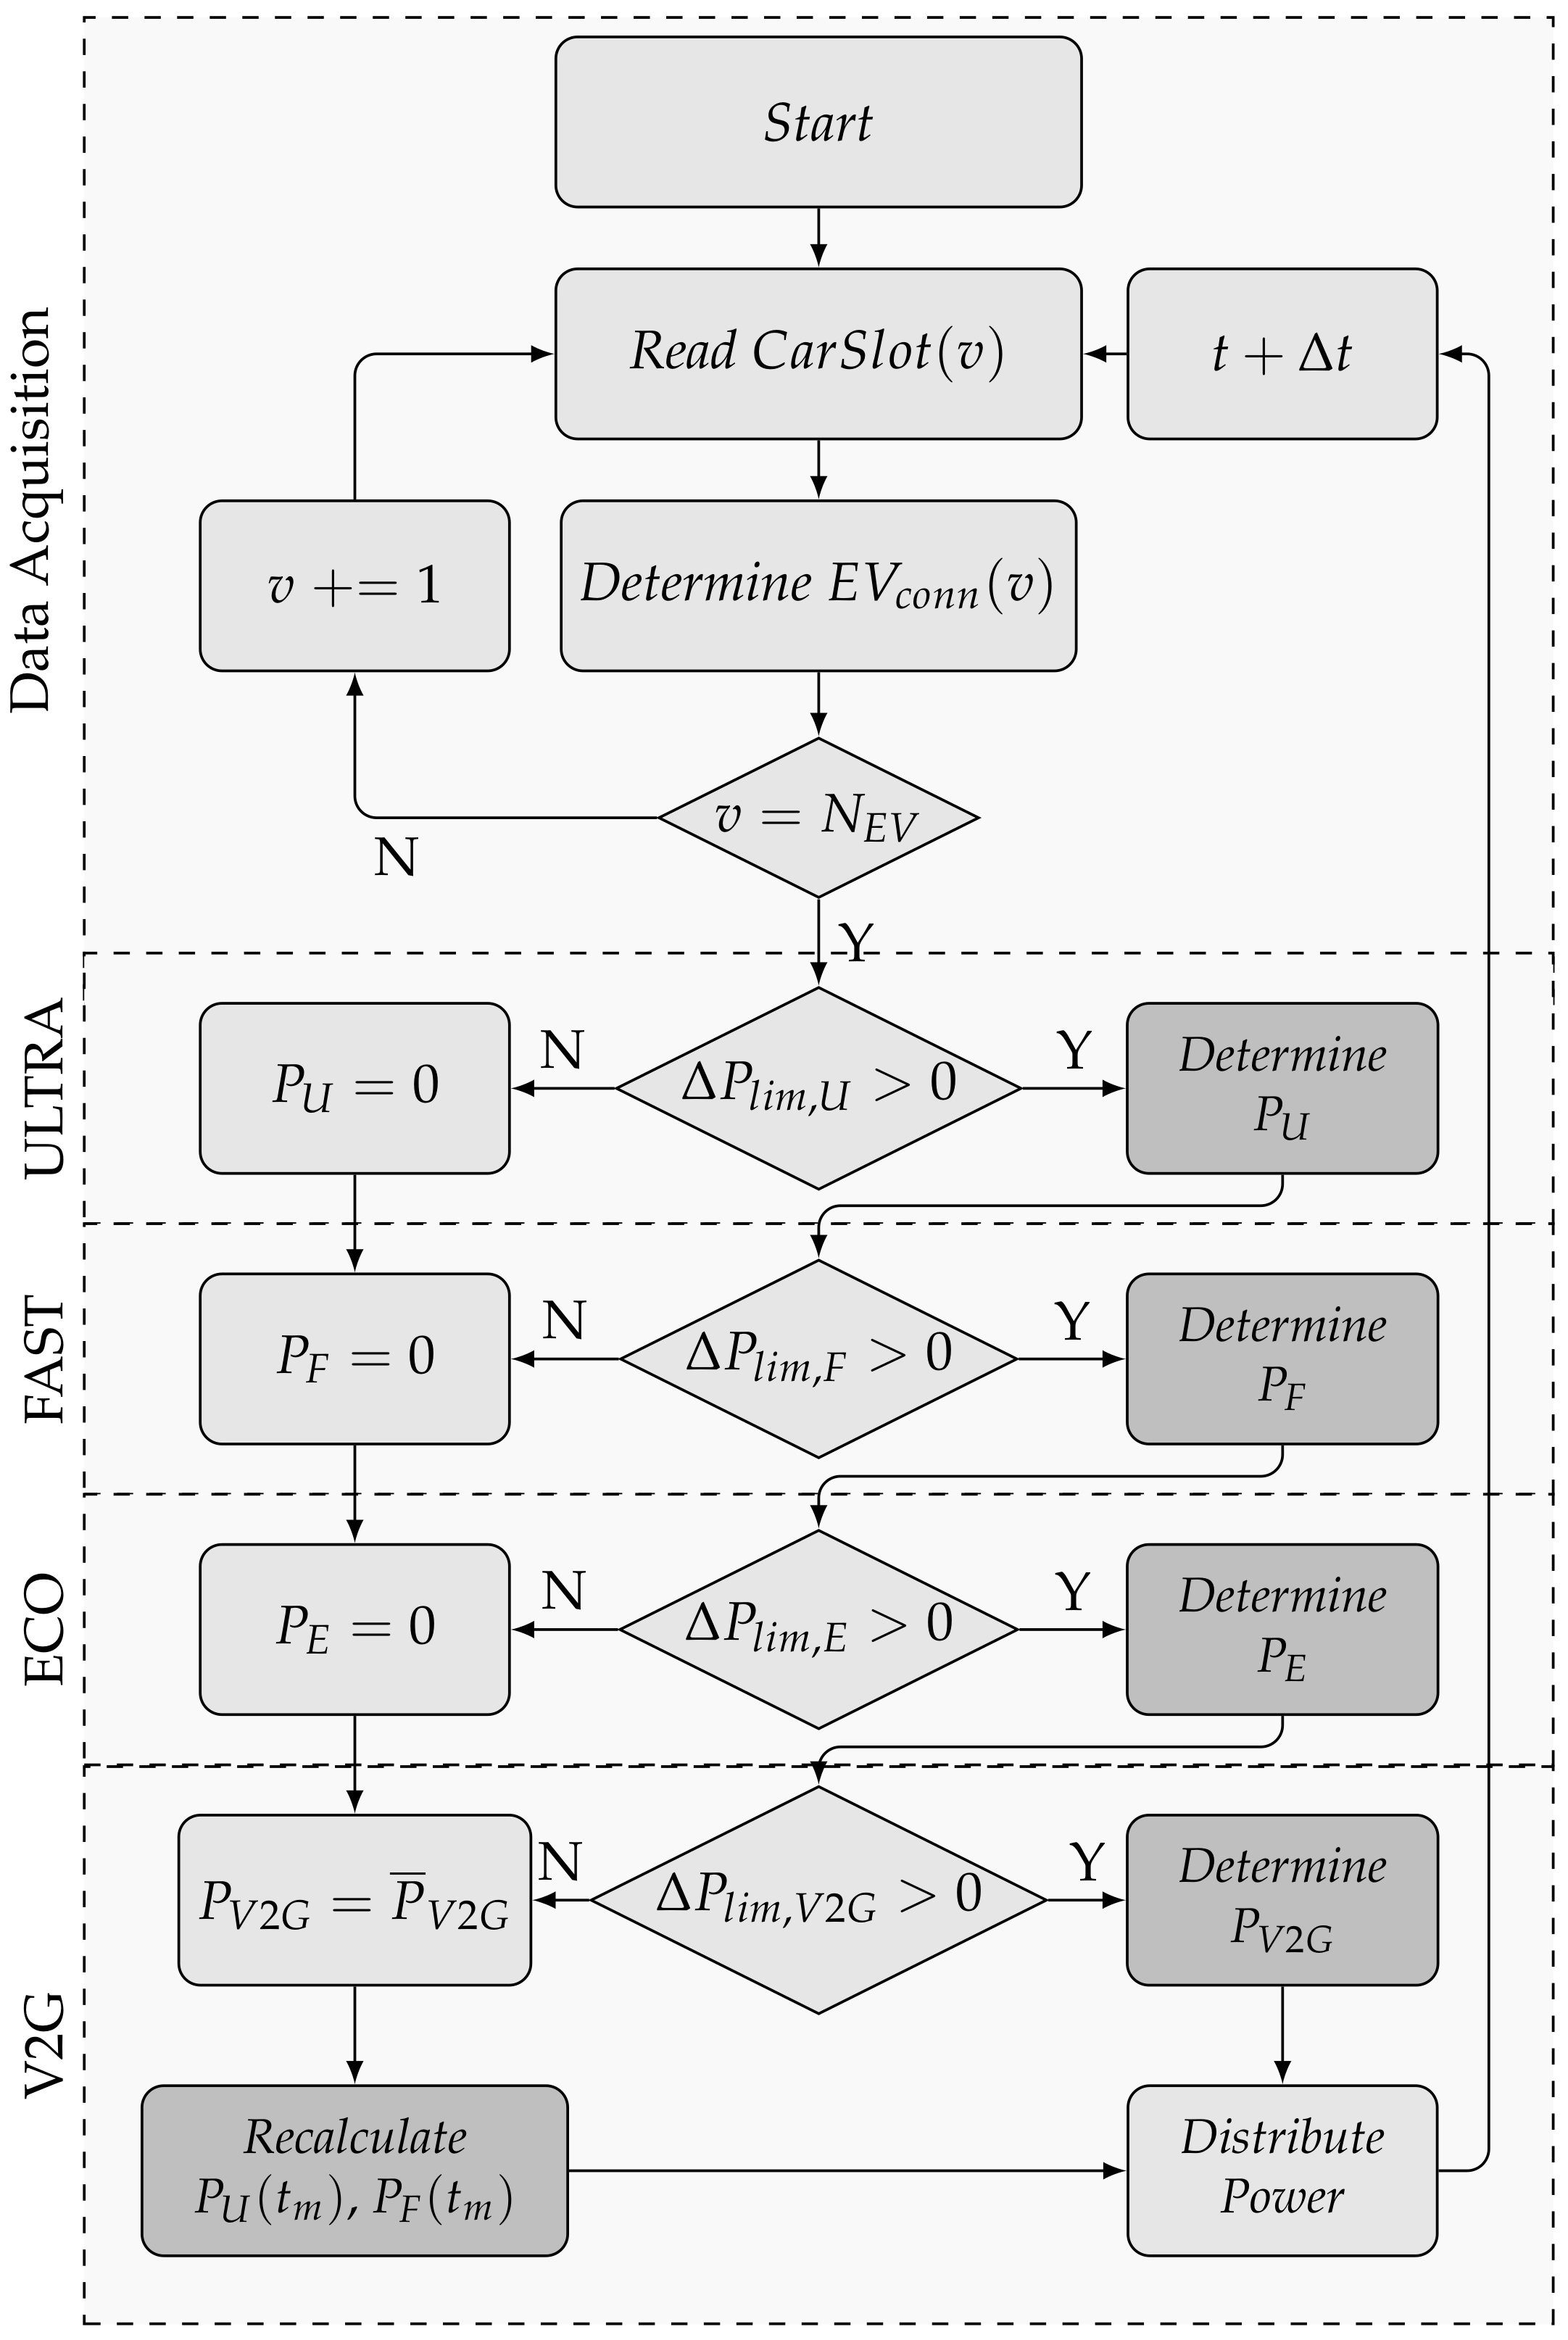
The management strategy for the EV/PV microgrid (
Figure 4) is represented by the flowchart in
Figure 5, wherein the acquisition and supervision modules are highlighted.
The data are acquired by EMS at each time interval, and the power for each vehicle v that is connected to the charging stations is determined. In the first step, the measurement variables are acquired, covering all parking lots (). When there is no vehicle connected, the algorithm follows right through the end and distributes the PV available power to loads of the microgrid. Without the EV connected, the EMS may request power from the grid or deliver PV surplus to the grid, as necessary.
When a vehicle is connected, then
is updated, and EMS determines the connection vector
based on Equation (
4). At the end of the acquisition process, the car data are saved using the format
, as defined previously.
After the acquisition process, the supervisory stage is initiated, which is responsible for defining the actions to be taken following the priority order set. This module analyzes the contracted demand limit and takes corrective actions to keep the demand at the appropriate level. The variables , , and are related to the difference between the contracted demand limit and the cumulative sum of each mode. If there are vehicles in ECO or V2G modes, the optimization module is requested.
Both functions for
and
computation are presented in Algorithm 1, which illustrates the processing logic of the ULTRA and FAST modes.
| Algorithm 1:ULTRA and FAST modes. |
 |
First, the value of the current SOC is saved, and is calculated; has a variable size depending on each EV connection time. Then, the size of from , as well as is established, defining the charging power profile. Assuming that represents the interval and that is an updated value in each step, it is noted that has also a varying size, which decreases each time step. The charging power profile is recalculated in each time step such that its data may be used as forecast demand in the optimization method.
After the definition stage of the charging power profile,
is calculated according to (
19) or (
21), based on the specific mode. The SOC value is updated from (
1), and the total demand of each mode
and
is computed. During demand limitation, the variables
and
represent the reduced charging power dispatched to the vehicles, according to the indexes
and
indicated in (
19) or (
21), respectively.
When ECO and V2G modes are requested, Algorithm 2 is used to perform the optimization of the ECO and V2G cost functions.
| Algorithm 2:ECO and V2G modes. |
 |
The optimization related variables are quantized considering the value range and the level number of SOC () and charging power (). The higher is the number of quantization levels, the more accurate will be the control, but more processing will be required. The range of allowed values is represented by and .
In Algorithm 2, initially, all operation possibilities are examined for the last sample time () of the EV charging horizon. The costs of the optimal powers are saved in for each state . The power that implies the lower cost of is saved in matrix , corresponding to . Then, the regression analysis is performed by checking each value of and for all sample times in the interval . From calculation, values not quantized in are usually obtained; therefore, the cost is linearly interpolated () according to the obtained SOC value. The control law is also interpolated. After, the cost matrix is assembled based on lower calculated cost . The optimal power matrix receives the control law, which provides the lower cost .
The progressive stage (Line 32) follows the same strategy adopted for ULTRA and FAST; however, the matrix calculated in the previous stage is used, which contains the optimal power profile for the determined initial SOC. This optimization process is repeated throughout all the EV connection period, including the charging profiles to the and vectors.
The demand limitation is verified for both ECO and V2G modes, and when V2G mode is requested, the charging dispatch for ULTRA () and FAST () modes is recalculated.
4.6. Prediction Module
To verify the EMS operation, the same values of PV generation and demand are utilized, however considering a 30 minute sample time decimation to add some issues for the management. These data are acquired to represent a typical scenario of a microgrid profile and to verify the EMS response during the PV and load variations. Therefore, the variables and have the same behavior of and except for the different sample time between them.
The EMS is considered to be able to obtain the data of the energy price from an Internet connection; thereby, the system may be subject to market price changes.
In the emulation environment, an additional Python algorithm was developed, such that it can collected forecast data of PV generation using an Internet-based communication.
5. EMS Testing Results
In order to verify the proposed management strategy, at first, the manager architecture (see
Figure 4) was entirely implemented using MATLAB
software with a conceptual microgrid (see
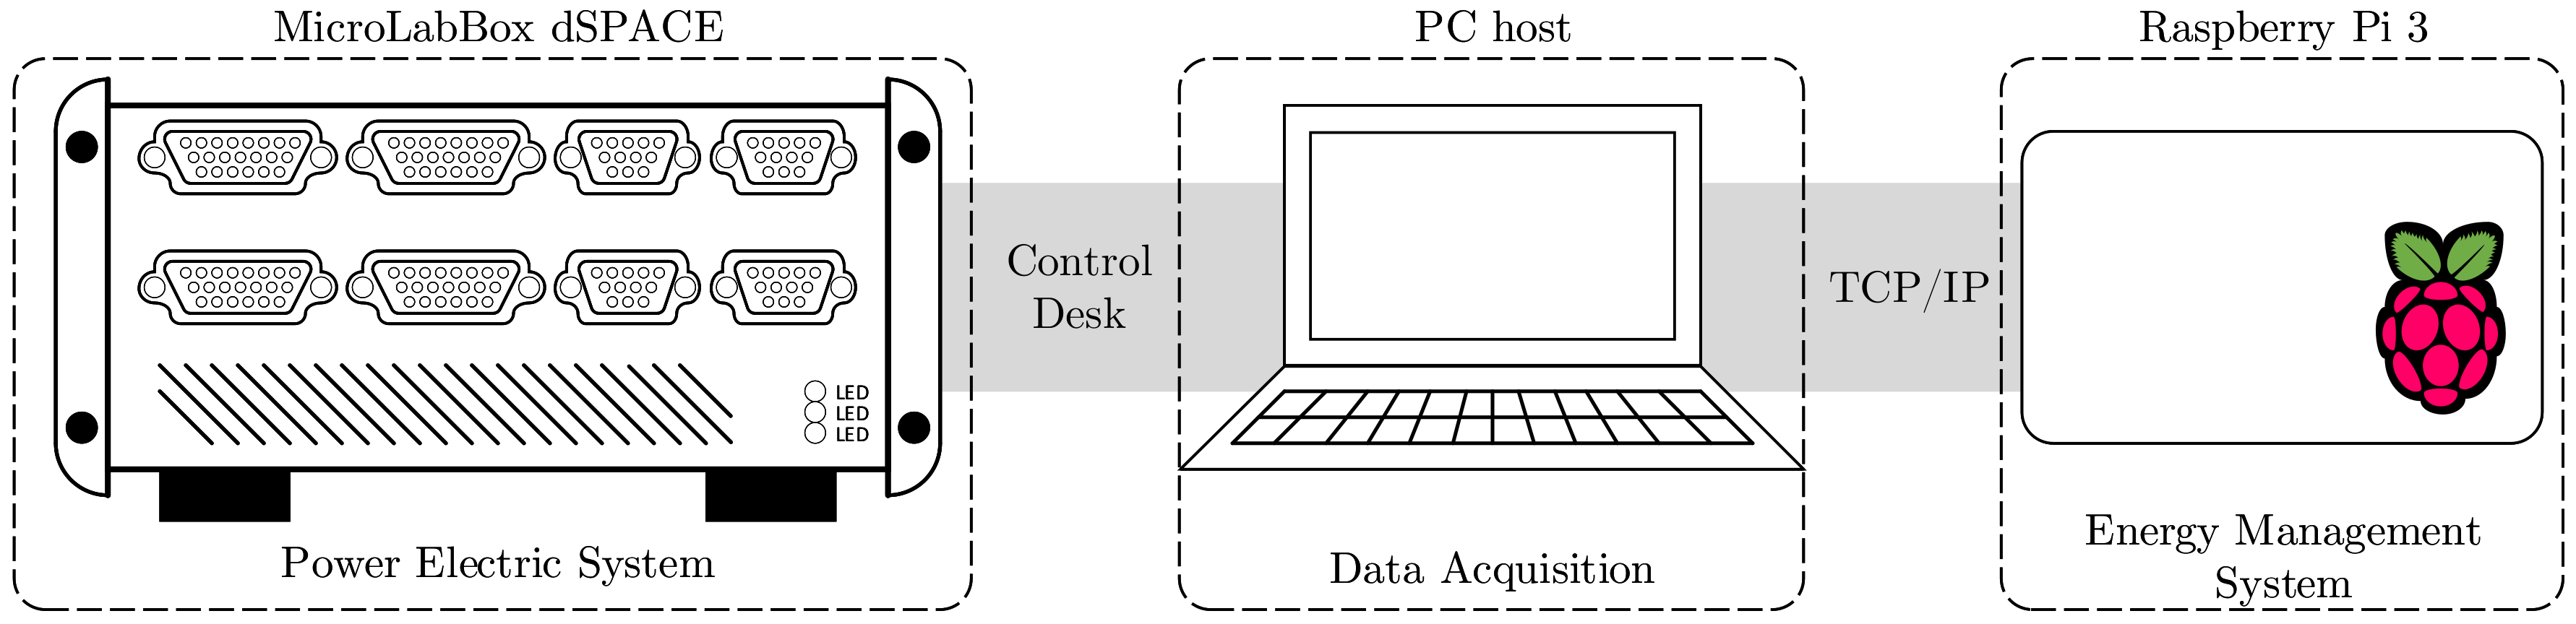
Figure 2). Additionally, the EMS algorithms were also implemented using the Python language and executed in a Raspberry Pi 3 platform. A MicroLabBox dSPACE was used to verify the real-time EMS behavior on a microgrid emulation platform, and its schematic is presented in
Figure 6.
The power electric system was emulated within the dSPACE, and all required data were made available by the software dSPACE/ControlDesk. Since the data must be managed by the Raspberry, a TCP/IP protocol was chosen for the communication path. The energy management was computed by the Raspberry, then all reference signals were sent back to the power system emulation platform, through the PC host. To verify the EMS operation, the emulation results obtained by the platform, illustrated in
Figure 6, were compared and matched to the simulation results that are presented in this section.
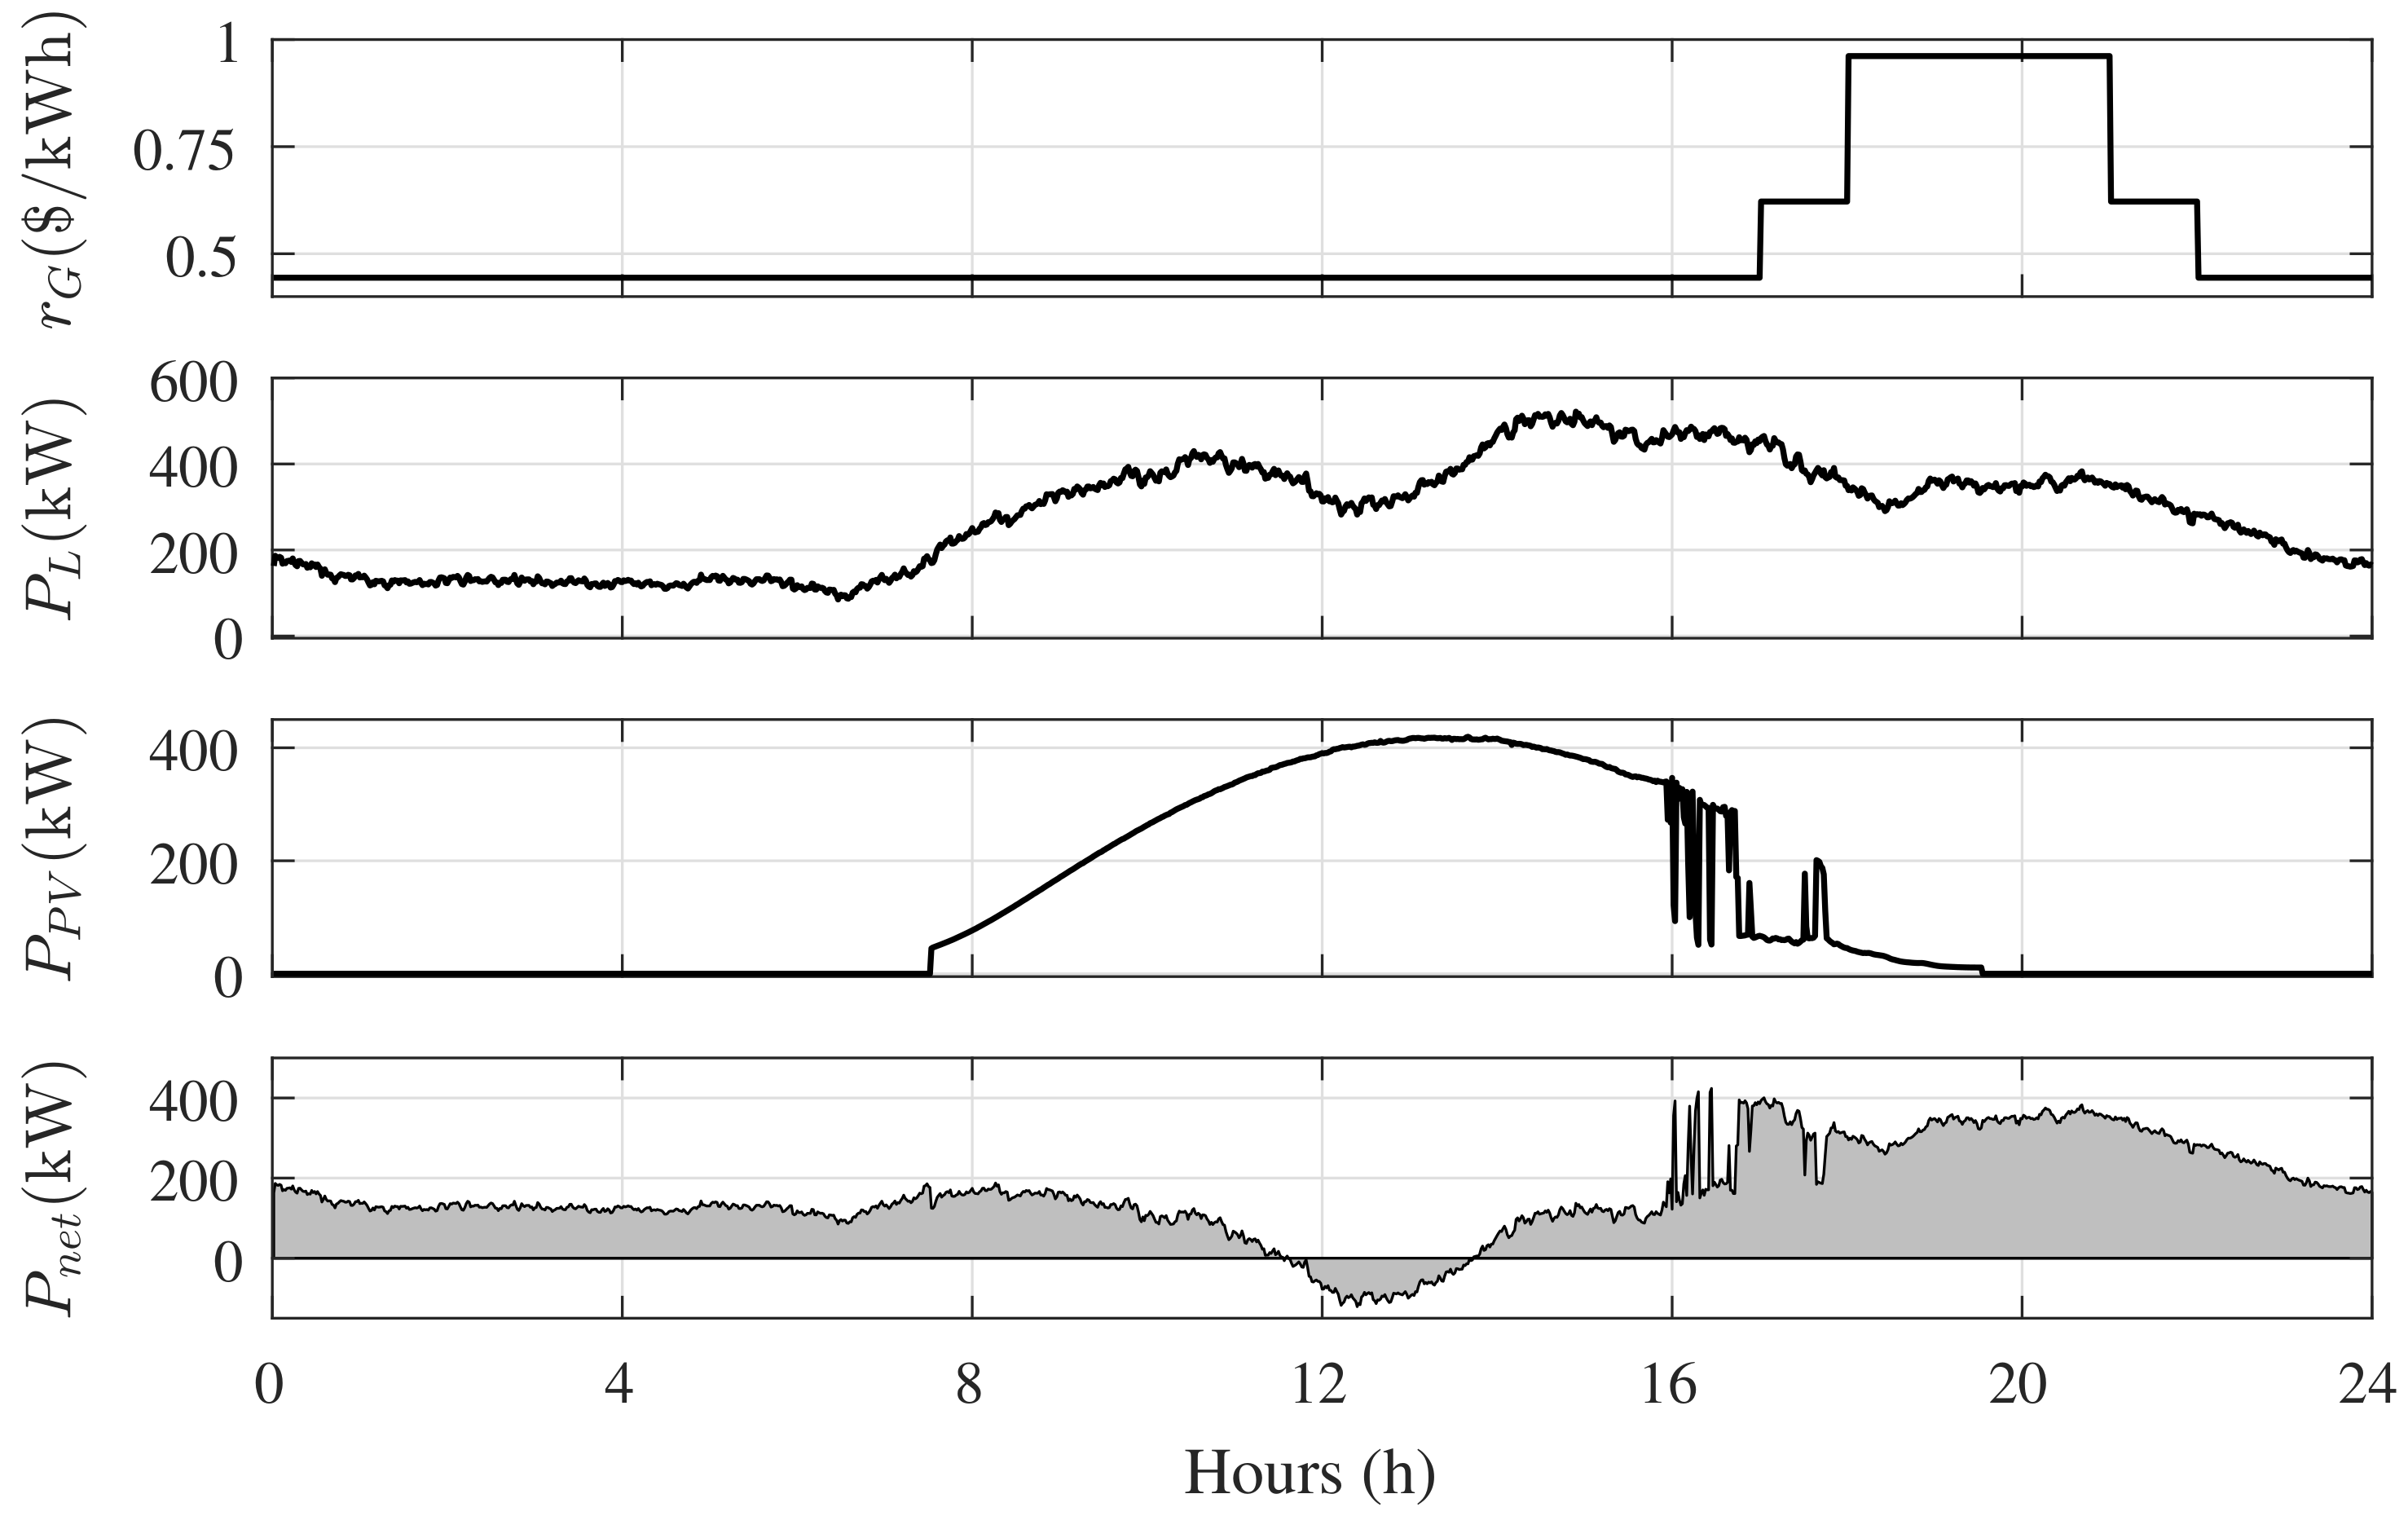
Figure 7 presents the measured data along with the energy price curve provided by [
23], based on the commercial mode fee. The predicted data were determined using the measured data for a week before with 30 minute sample time decimation. Since the main scope of this paper is on the optimization and management logic, the EMS evaluation considered a constant temperature value throughout the day
in order to highlight the effect of main variables
,
,
, and EV charging operation.
Ten EV slots were considered in the facility parking lot, with distributed modes and parking periods. This arrangement was defined in order for it to be possible to identify the manager performance against connection variability and operation modes.
Table 1 presents the EMS parameters used in the analysis, while the EV charger was considered a commercial model Terra 54, developed by ABB company, which provided 50 kW of nominal power [
24]. It can be seen that
had two different ranges, and the total number of values (quantization) was determined by
, as for SOC range, which was defined by
.
In order to validate the algorithms developed for management, microgrid evaluations were performed using the the proposed EMS, the Terra 54 charger, a 420 kWp PV distributed generation, and a 450 kW load demand.
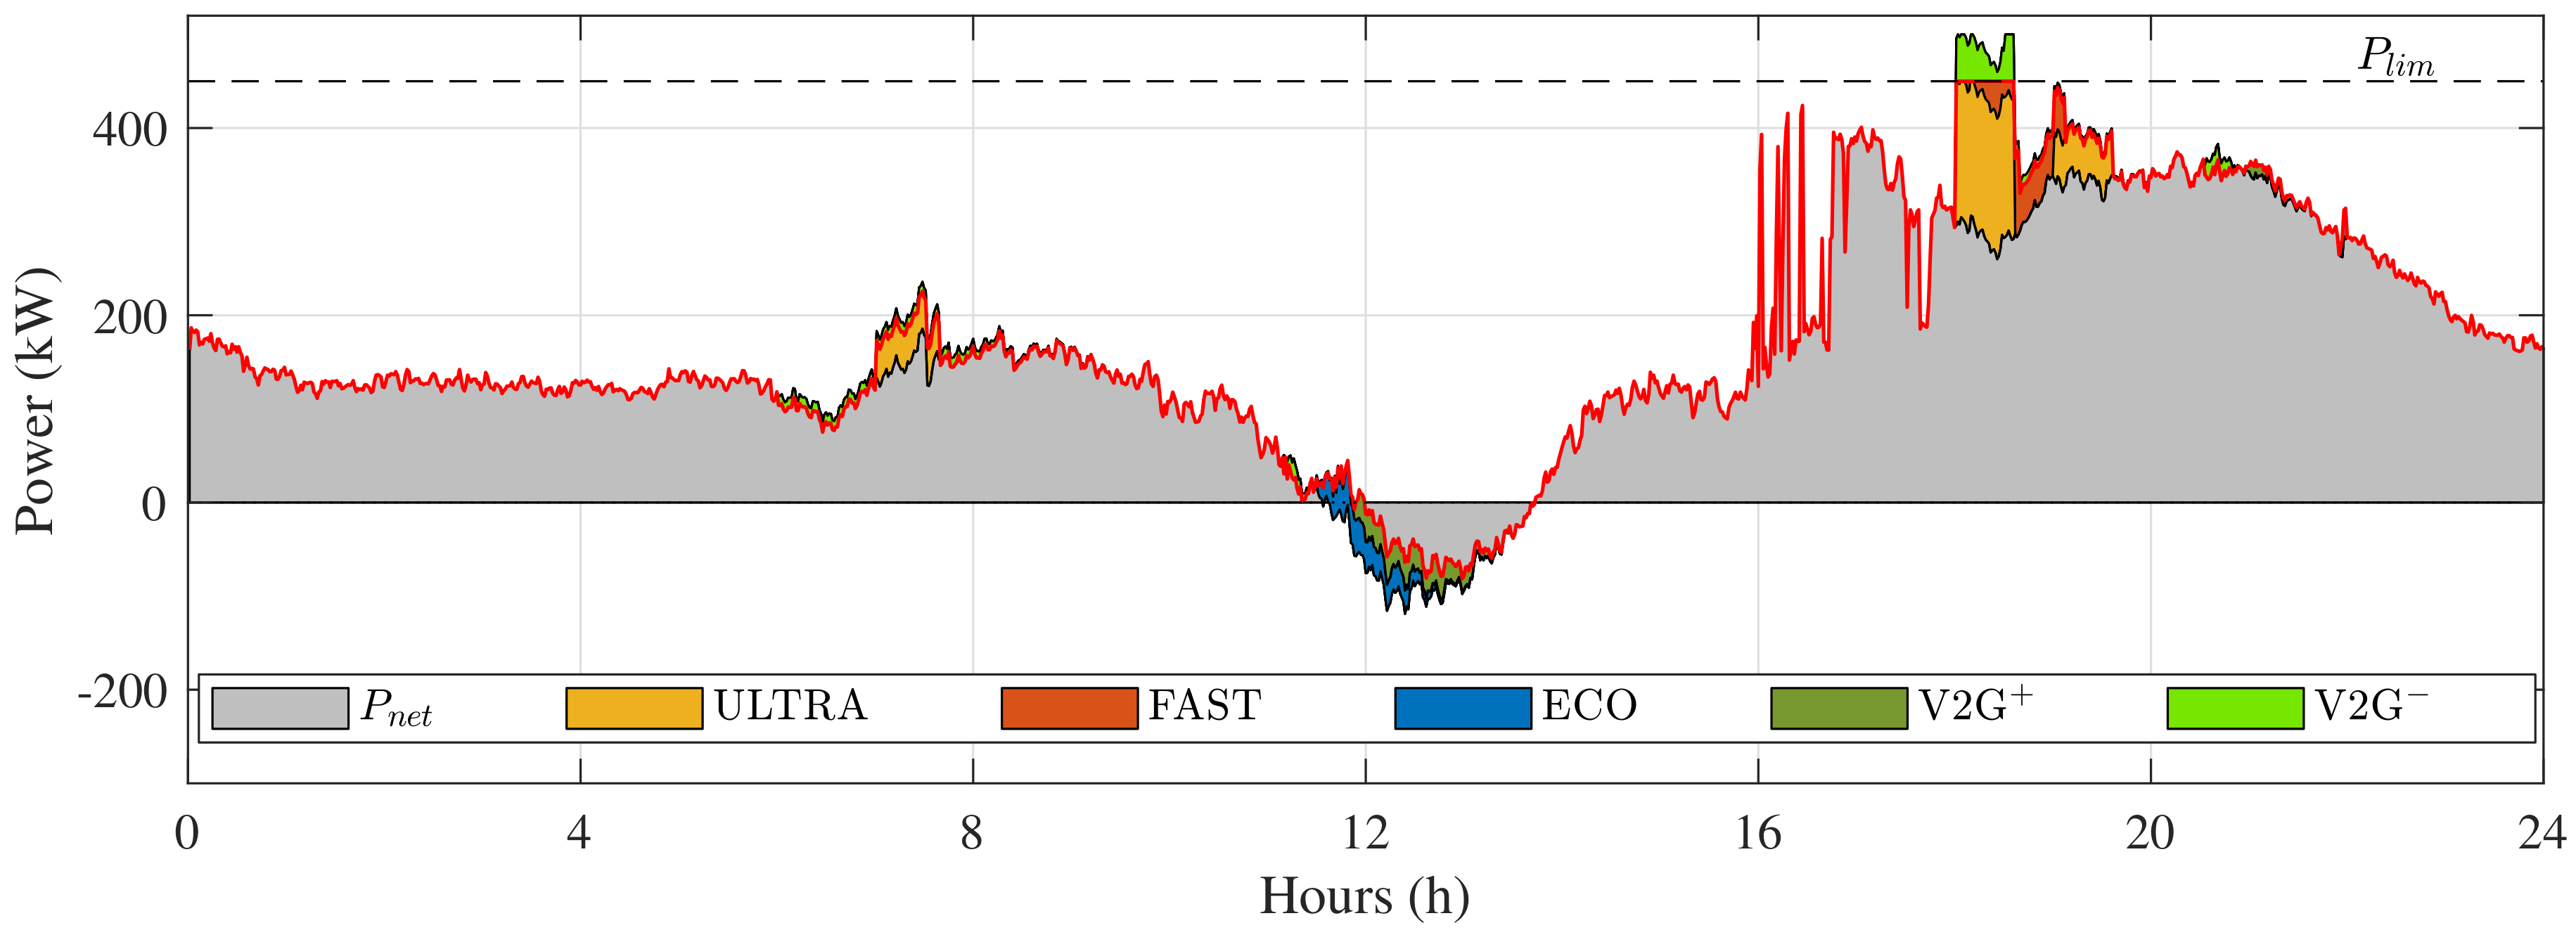
Figure 8 shows the microgrid power flows, emphasizing the V2G mode, which is separated by two regions: charging (V2G
) and discharging (V2G
). The required of the microgrid from the external grid (
) is highlighted in red.
When V2G
was present, part of the microgrid demand was supplied by the vehicles in V2G mode. During the surplus period, it can be noticed that the energy was used more efficiently, being applied to charge those vehicles set on ECO and V2G modes instead of being exported to the external grid. Hence, it is important to note that vehicles set on V2G mode only charged when the energy price was appropriate. Moreover, between 6 p.m. to 8 p.m., the V2G stored energy was discharged, generating economic benefits for the microgrid owner such as the energy purchase in moments of peak demand, reducing the facility operation costs.
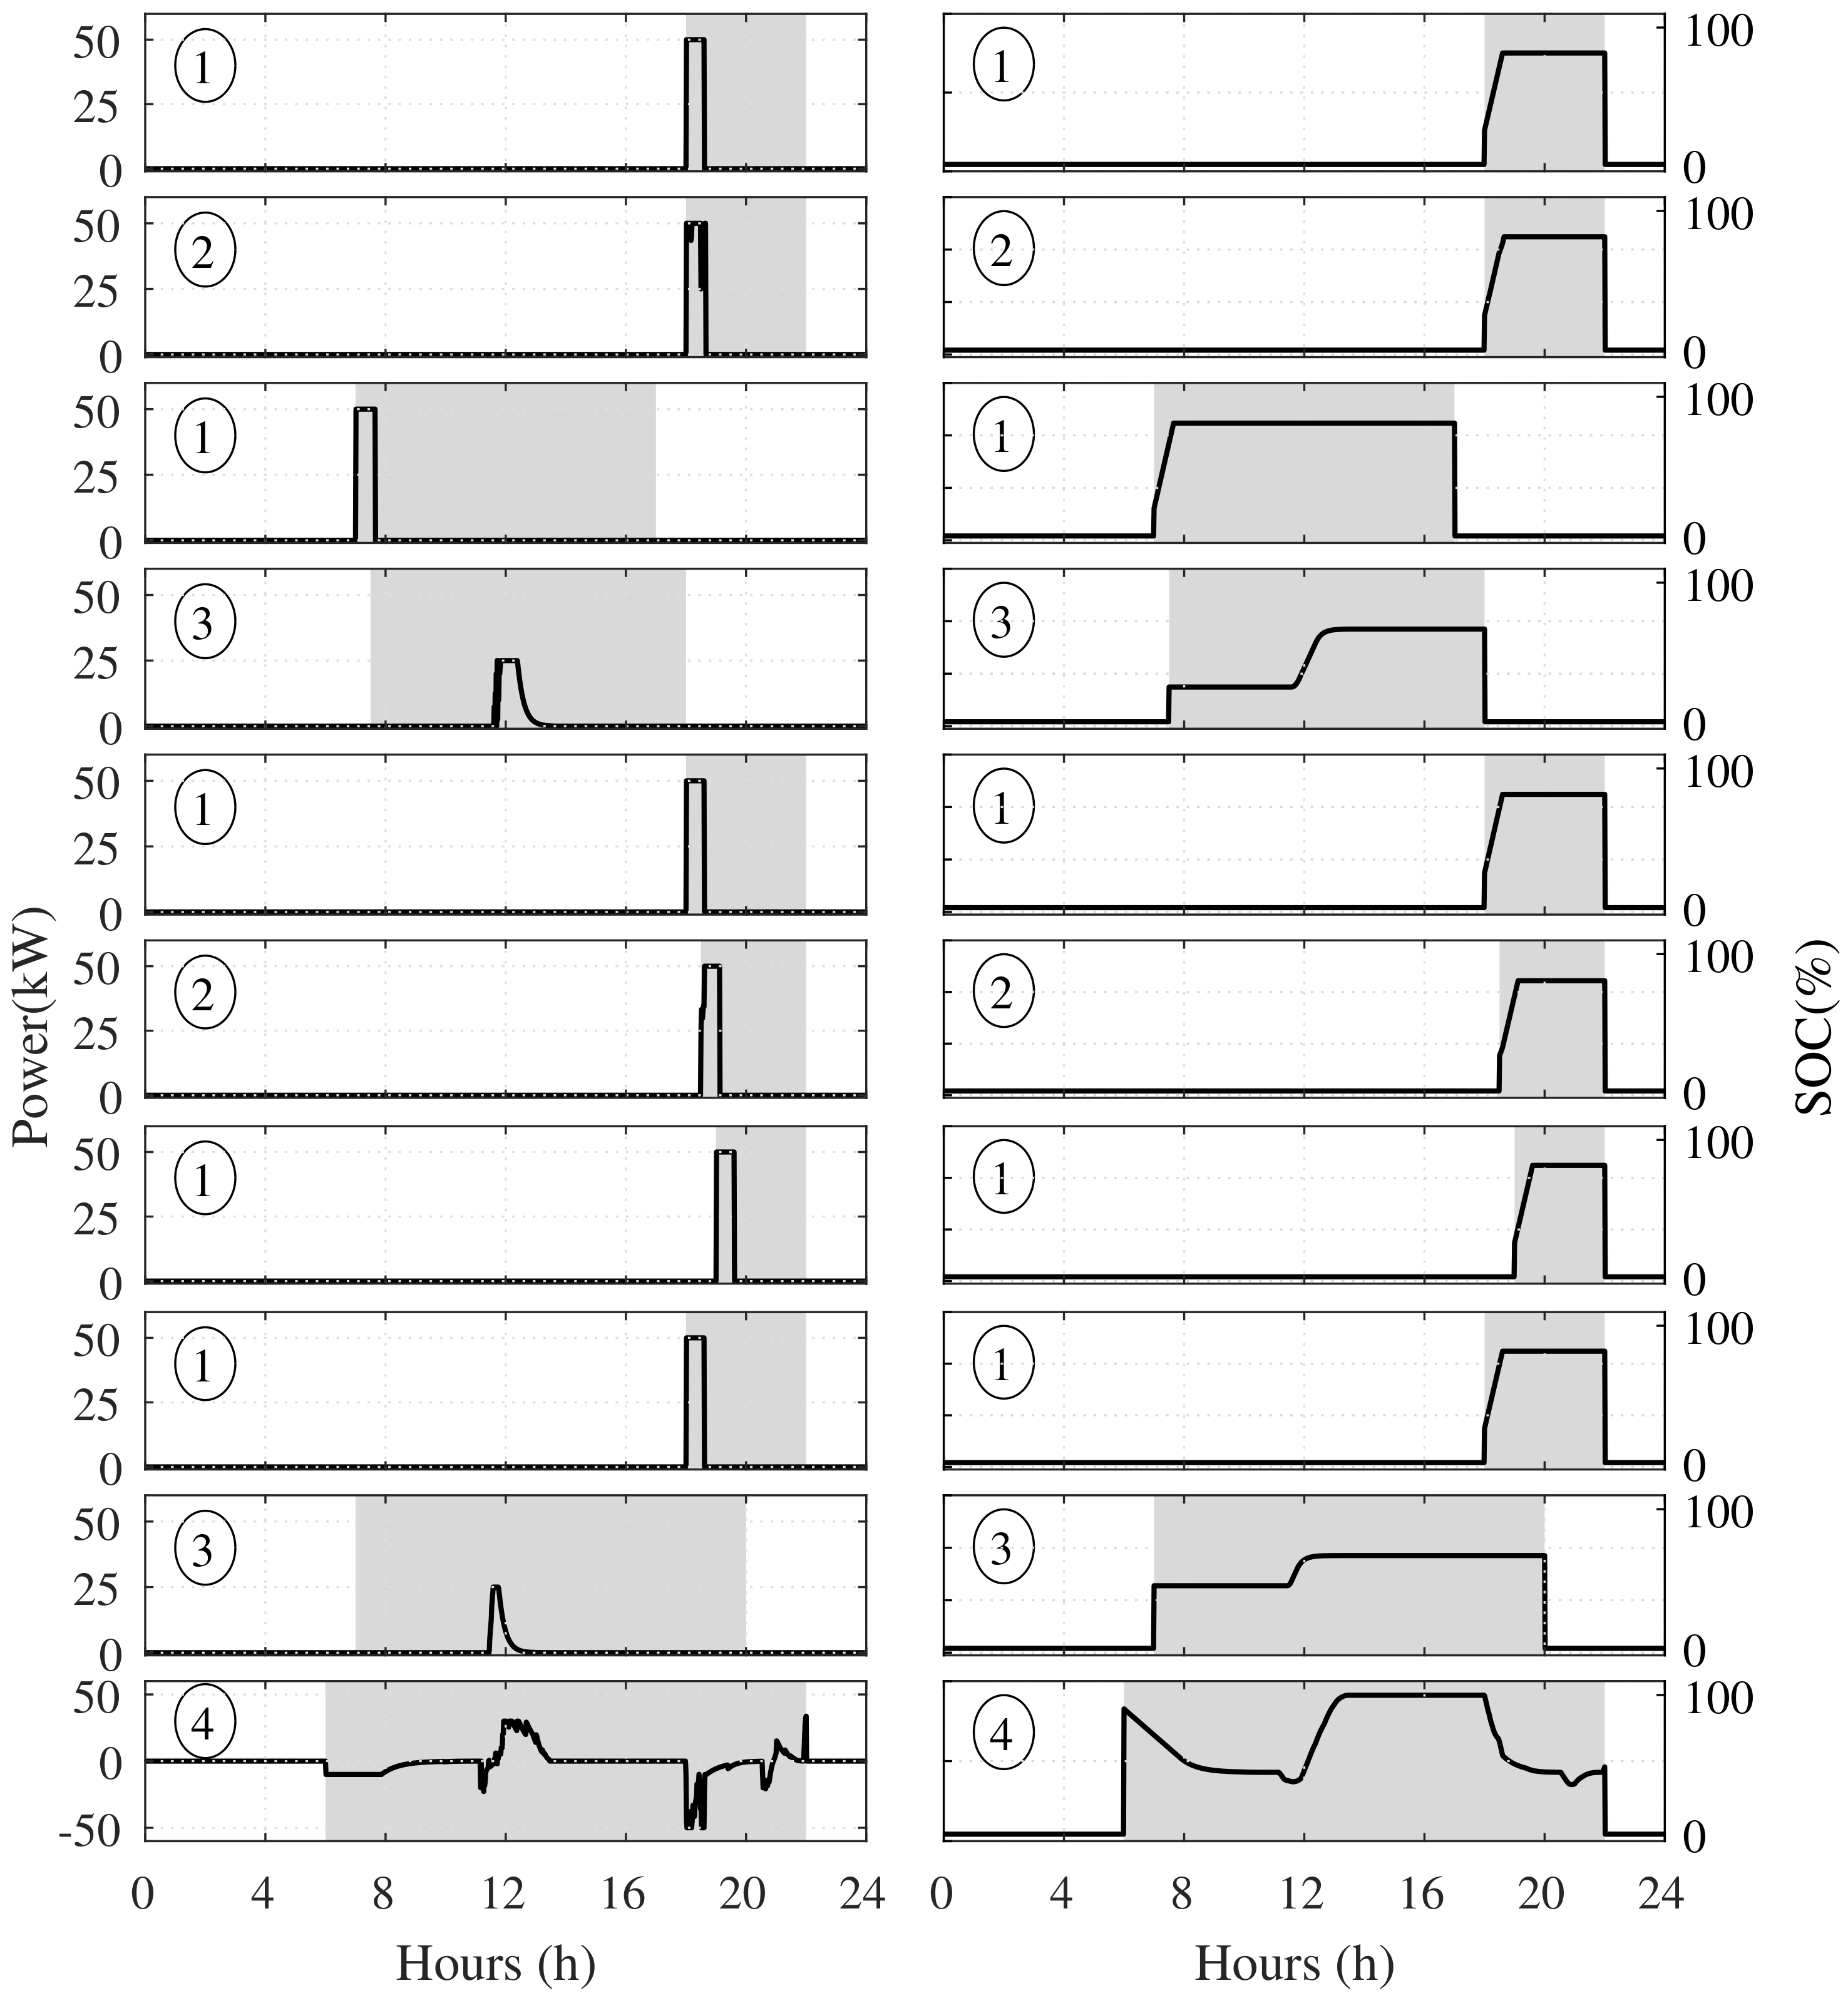
Figure 9 shows the charging mode (1, ULTRA; 2, FAST; 3, ECO; 4, V2G), power flow, and SOC for each EV in the parking lot. The gray regions represent the parking duration for each EV, while the solid line presents the instantaneous power and SOC defined/optimized by the EMS.
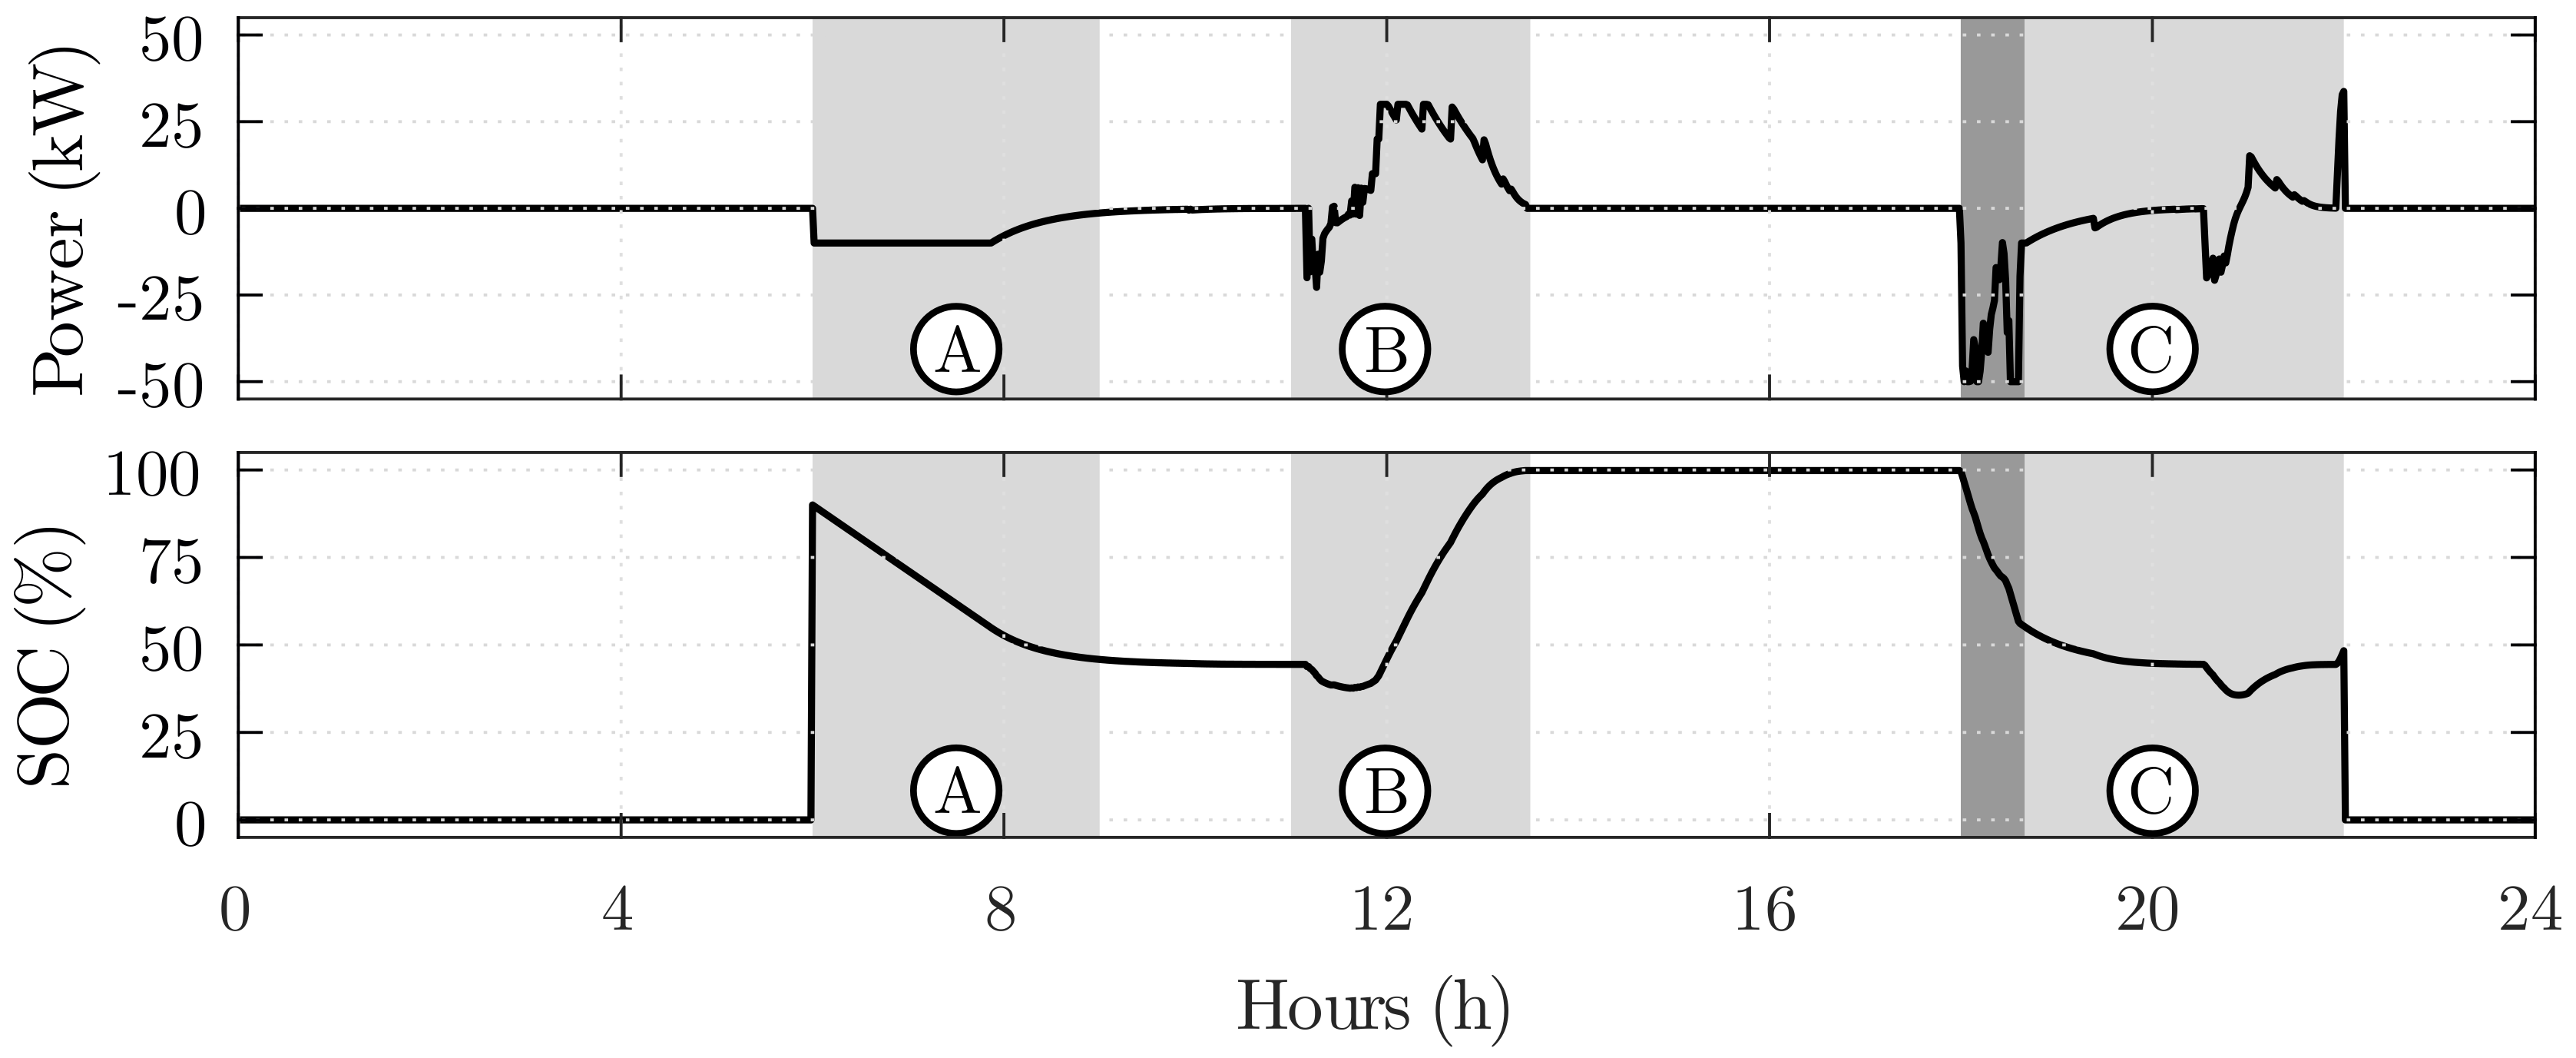
An analysis of each EV indicated that the ones in ULTRA mode were charged at nominal power while the vehicles in FAST mode had a slight reduction during the period of limited demand. Vehicles in ECO mode were charged at periods with PV surplus, avoiding demand peaks. In addition, EVs on V2G mode supplied energy to all other vehicles during moments of peak demand, around 6 p.m. To achieve this condition, the EMS commanded the energy surplus storage from 11:30 a.m. to 1:30 p.m. to sell it for a higher price during demand peaks. Since vehicles in V2G mode included discharging possibilities, the SOC and power flow of these vehicles are depicted individually in
Figure 10.
Region A in the
Figure 10 represents the initial
discharging. The discharge was related to the high initial
SOC and to the predicted charging period in Region B, where a PV surplus existed, and the energy cost was lower considering the action of
proposed in Generation Surplus subsection. In Region C, the price of the grid energy had its highest value, so it was convenient that
vehicles assisted in power supply for the microgrid. The charging power spikes close to the disconnection instant were related to the factor state in the final time. The dark part in Region C was associated with the demand limitation, since in this condition, the
was commanded up to its nominal power in order to supply the microgrid overdemand power.
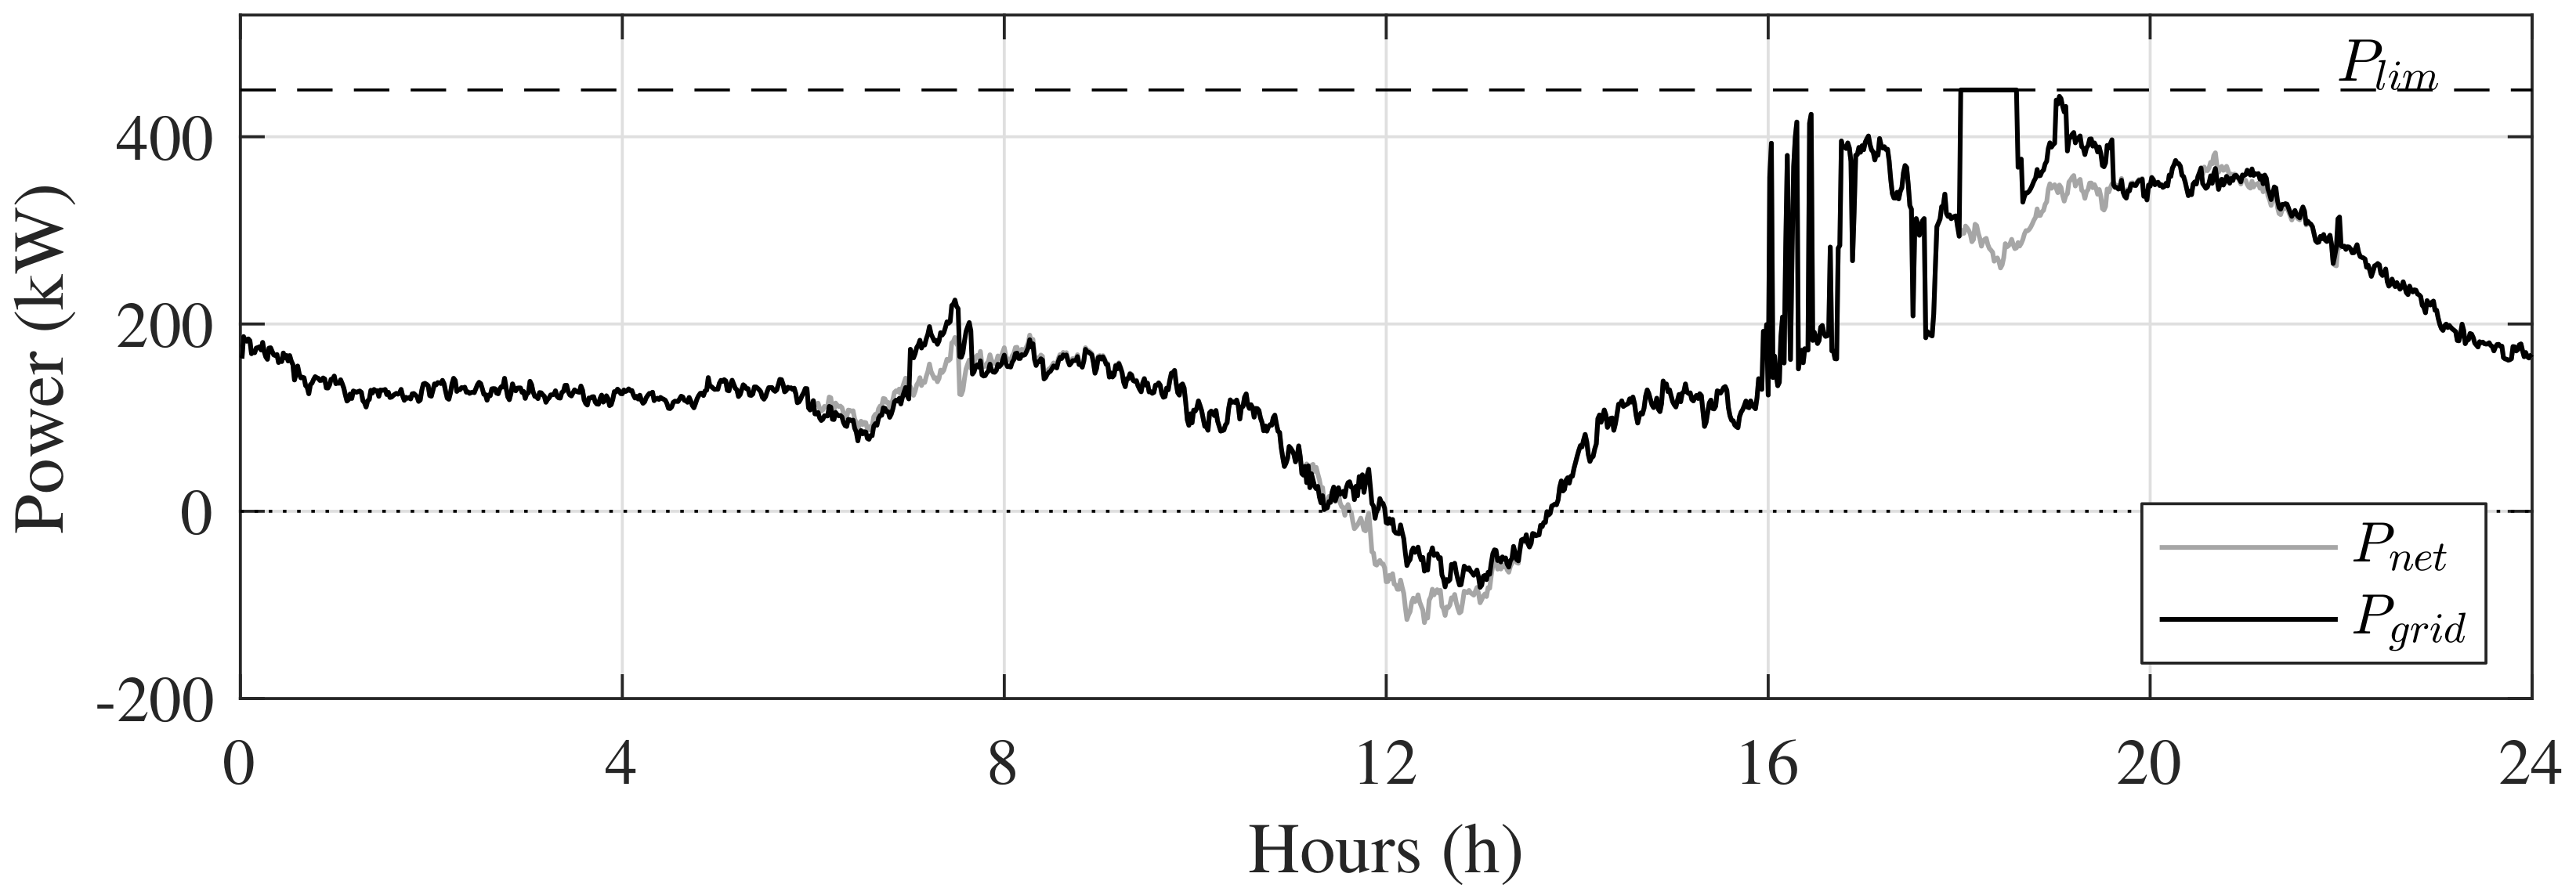
In the presented evaluation, there was a charging limitation only for FAST mode, confirming the priority employed by ULTRA mode. ECO mode also met the priority set and achieved an optimal charging profile without exceeding demand limits. V2G mode fulfilled the preferences defined by the user and the facility, and a more efficient use of the energy from the microgrid was obtained. The overall influence of the EMS for EV parking lot can be seen in
Figure 11, where the
and
flows are shown individually.
It can be seen that EV charging increased the microgrid demand at night, but the effect of valley filling was obtained throughout the afternoon. The proposed EMS behaved appropriately to supply the demand peaks, both limiting the charging of the , as well as providing the valley filling from PV surplus using .
A comparison of numerical analysis is presented in
Table 2, wherein four scenarios are shown: 1, the microgrid without the EV parking lot; 2, with the EV parking lot, but no EMS; 3, with EV with a conventional EMS, with only ULTRA and FAST modes; and 4, with the EV parking lot with the proposed EMS. All scenarios that utilized EV slots took the configuration presented in
Figure 9 into account, except for some changes among the scenarios. The second scenario considered EV only in ULTRA mode, without any EMS strategy. The third scenario considered a conventional EMS where only ULTRA and FAST modes were applied. ECO mode EVs in
Figure 9 were considered in FAST mode, and the vehicle in V2G mode was assumed in ULTRA mode. The last scenario applied the proposed EMS entirely.
It can be seen that the system without an EV parking lot had the minimum cost with grid purchase; however, the increase of the EV market will make this arrangement more common. Then, if the system has no EMS to manage the charge/discharge, the price spent may rise, as can be noticed in the second scenario, which presented a cost increase of 20.93%. This cost was considered a penalty for exceeding the demand limit [
25] along 2.5% of the day above its demand limit. This situation was improved with the conventional EMS, which reduced back to 0% the exceeding the energy of the microgrid, and decreased to 8.8% the cost of grid energy purchase. The influence of ECO and V2G modes can be seen in the fourth scenario, which reduced the energy cost to 7.43%, maintaining the system demand within the limits.
6. Conclusions
This paper proposed a new approach for energy management systems for microgrids with loads, PV units, and EV parking lots. The management system provided four charging modes that could be chosen by the users of the parking lot, and the EV factors that must be considered in charging modes were formulated.
The proposed EMS was evaluated using a 450 kW typical microgrid. As designed, the ULTRA mode charged the vehicles with nominal power within the expected time. In the FAST mode, the charging level and the priority level were achieved, since the EMS applied a charging limitation when demand exceeded the microgrid capacity. ECO mode was designed to provide the minimum charging cost to the user; thereby, over the analysis, it was verified that the vehicle charging occurred along the PV surplus, and no extra demand was requested from the microgrid in high demand periods. The V2G mode was developed to provide several benefits to the microgrid and also to attend to the user preferences. The V2G vehicles were discharged in high demand periods to support the microgrid loads and/or the other modes, and the same ones were charged in the PV surplus period. This performance occurred due to the relation between the price of V2G and the grid energy, taking the battery degradation into account to determine the charging power profile. The optimization algorithms were executed in convenient time in a Raspberry Pi 3 platform and were tested with an dSPACE emulation environment. All EV user preferences were met, as well as a relief in the valley of the microgrid demand, providing economic benefits to the microgrid agent.


 ,
, 


