Article

Logistics Design for Mobile Battery Energy Storage Systems

College of Engineering, Texas A&M University-Kingsville, Kingsville, TX 78363, USA
*
Author to whom correspondence should be addressed.
Energies 2020, 13(5), 1157; https://doi.org/10.3390/en13051157
Submission received: 6 February 2020 / Revised: 28 February 2020 / Accepted: 2 March 2020 / Published: 4 March 2020
(This article belongs to the Special Issue Integration of Electric Vehicles and Battery Storage Systems)

Abstract

:
Currently, there are three major barriers toward a greener energy landscape in the future: (a) Curtailed grid integration of energy from renewable sources like wind and solar; (b) The low investment attractiveness of large-scale battery energy storage systems; and, (c) Constraints from the existing electric infrastructure on the development of charging station networks to meet the increasing electrical transportation demands. A new conceptual design of mobile battery energy storage systems has been proposed in recent studies to reduce the curtailment of renewable energy while limiting the public costs of battery energy storage systems. This work designs a logistics system in which electric semi-trucks ship batteries between the battery energy storage system and electric vehicle charging stations, enabling the planning and operation of power grid independent electric vehicle charging station networks. This solution could be viable in many regions in the United States (e.g., Texas) where there are plenty of renewable resources and little congestion pressure on the road networks. With Corpus Christi, Texas and the neighboring Chapman Ranch wind farm as the test case, this work implement such a design and analyze its performance based on the simulation of its operational processes. Further, we formulate an optimization problem to find design parameters that minimize the total costs. The main design parameters include the number of trucks and batteries. The results in this work, although preliminary, will be instrumental for potential stakeholders to make investment or policy decisions.

1. Introduction

It is anticipated that Electric Vehicles (EV) penetration will meet an extensive growth in the near future [1] due to their highly promising performance and negligible production of Greenhouse Gas (GHG) emissions [2,3,4]. However, EV charging still faces issues arising from infrastructure and technology, for instance, the inadequacy of appropriate charging facilities [5] and the long durations of charging activities [6], in contrast to the fast refueling process of conventional Internal Combustion Engine (ICE) vehicles. In addition to these issues, the constraint from the power grid to meet the demands of the Electric Vehicle Charging Stations (EVCSs) has also been a main challenge to the EV industry and it might be responsible for negatively impacting EVs’ social acceptance [7,8]. To address this, we introduced and have been exploring the idea of developing grid independent EVCS networks in previous works [7,9,10,11,12]. Essentially, mobile Battery Energy Storage Systems (BESSs) that absorb extra (i.e., would be curtailed otherwise) energy from renewable sources (e.g., a wind farm) and are shipped by Electric Semi-Trucks (ESTs) to the EVCSs power the EVCS networks. Designing and managing a logistics system that minimizes the annualized cost for such network became a necessity, which in return promotes the development of EVs industry and penetration. Handling the logistics system of any operational supply and demand environment is in great importance in most fields. Hence, its significance in the case of EVCSs is not different, since its need stems from the dynamic interaction between the supply side of energy (the energy producer represented by the wind farm in this study) and the demand side (the energy consumer, EVs in this case). The logistics system in this study involves employing ESTs that deliver BESSs between the two sides, as introduced in [7].

Related Works

The planning of diverse types of logistics systems has been extensively studied [13,14,15]. In an old study that was performed by Powell [16], the author described a heuristic approach that manages a real time dispatching problem for truckload motor carriers (loaded or empty) from one location to the next, the author stated that the most difficult part is to forecast for the future demand because of its uncertainty. From this point, we can sense that the uncertainty of the future demand makes it hard to accurately plan for the operational process and guarantee its convergence, which easily leads to introduce uncertain errors. Recently, numerous studies, including those conducted by Vasilakos et al. [17] and Fanti et al. [18], focus on the Decision Support System (DSS) applications in shipping systems to mitigate uncertain demand problem. The decision support systems are judged to be essential backers of making crucial operational logistics decisions. Giusti et al. [19] introduced a new system for freight logistics planning for the Synchromodal supply chain eco-network, SYNCHRO-NET, which is an optimization toolset that offers tactical level decision support in terms of routes and schedules for synchro-modal freight transportation. The SYNCHRO-NET is projected to achieve notable results regarding the distances travelled, fuel emissions, and costs. In [20], it was reported that the very fast urban growth forms a serious logistics challenge for decision makers, especially when dealing with the social, economic, and environmental issues. It is necessary to plan for it in advance and, as stated in [21], logistic decision-making can precisely define the distribution pattern of shipments within the product’s supply chain.
Plant location and its associated services, transportation infrastructure, and demand profiles are important factors shaping the evolution of logistics systems’ structure. For the sake of examining the geography of logistics firms, the authors of [22] shed some light over the importance of the location patterns of logistics corporations, and utilized what is called “geo-referenced firm level data” side by side with an updated data system of transportation infrastructure. They concluded that the logistics sector is extremely urbanized, and its firms, as compared to other sectors, are located near highways and other transport infrastructure. The findings of [22] are in agreement with those in [23], where Kumar et al. summarized that maintaining the transportation infrastructure leads to optimistic effects on transportation and logistics clusters. The expansion of the current century’s development demands necessitates similar expansions regarding the logistics schemes. Developing a modernized logistics system that reflects the visions for a new future in which the development is sustainable and efficient is an essential requirement.
When dealing with the shipping actions, most of the previous studies consider the scenario of delivering supplies in one direction (i.e., going in one way from the source to the destination as a fully loaded carriers and returning back to the source as an empty load) [24,25,26]. While other studies tried to enhance the previously described case by finding other applications for the empty loads to gain more profits by reducing the shipping costs, and obtain improved usage, such as the sequence of deliveries scenario, for example [27,28,29,30]. In this paper, we deal with a different structure of logistics where we anticipated that the ESTs are equipped to carry only one unit of the mobile BESS; this unit will be fully charged when transferred from the BESS plant to the targeted EVCS while being swapped by the empty one back to the plant. Furthermore, and for the authors knowledge, combining some of the main components that form the conventional logistics structure configuration, as specified in [31], in one component can be a beneficial way for costs reductions. Therefore, we combine the plant and the storage at the same spot and exclude the retailer part, which is almost like the case of Direct to Store Delivery (DSD) [32].
In this study, a model of logistics system for a grid independent EVCSs network is developed. The design can supply a population of ten thousand EVs with their energy charging demands. The optimum design configured employing ten ESTs and 126 mobile BESS units. The principal objective function of the design was to provide every EV with its charging demands at the 27 ECVSs while aiming for minimizing the annual costs. Such design can be implemented by decision makers and planners for future sustainable communities to accomplish greener transportation systems in which the GHG emissions are the lowest levels.
The rest of the paper is organized as follows: In Section 2, we describe the methodology where the optimization problem is introduced along with the objective functions and the constraints. Section 3 provides the main results of the optimization process and their evaluations; the section is further supported by some findings and discussions. The conclusions of the paper and suggestions of further work in this field could be found in Section 4.

2. Methodology

The objective of this study is to design a logistics system model for mobile BESSs powered EVCS network, and then examine its performance when applied into a scenario of supply side, energy produced by renewable energy source (wind energy in this case), and demand side, energy consumed by EVs at the EVCSs. The scheme of EVCSs we study in this paper includes 27 charging stations spread in the city of Corpus Christi, Texas, and their locations are known as obtained from our previous study [9]. These EVCSs are projected to serve a population of about ten thousand EVs. Securing the supply of energy at the EVCSs is maintained by deliveries of mobile BESS units shipped by ESTs. The configuration of the best number of ESTs and mobile BESS units will be optimized while minimizing the annualized costs. The design considers placing a BESS plant, that stores the fully charged BESS, close to the supply side (wind farm). In this study, we assume the availability of boundless energy produced by the wind farm, so, the charging of the mobile BESS units at the BESS plant is conducted without any constraints at any time.
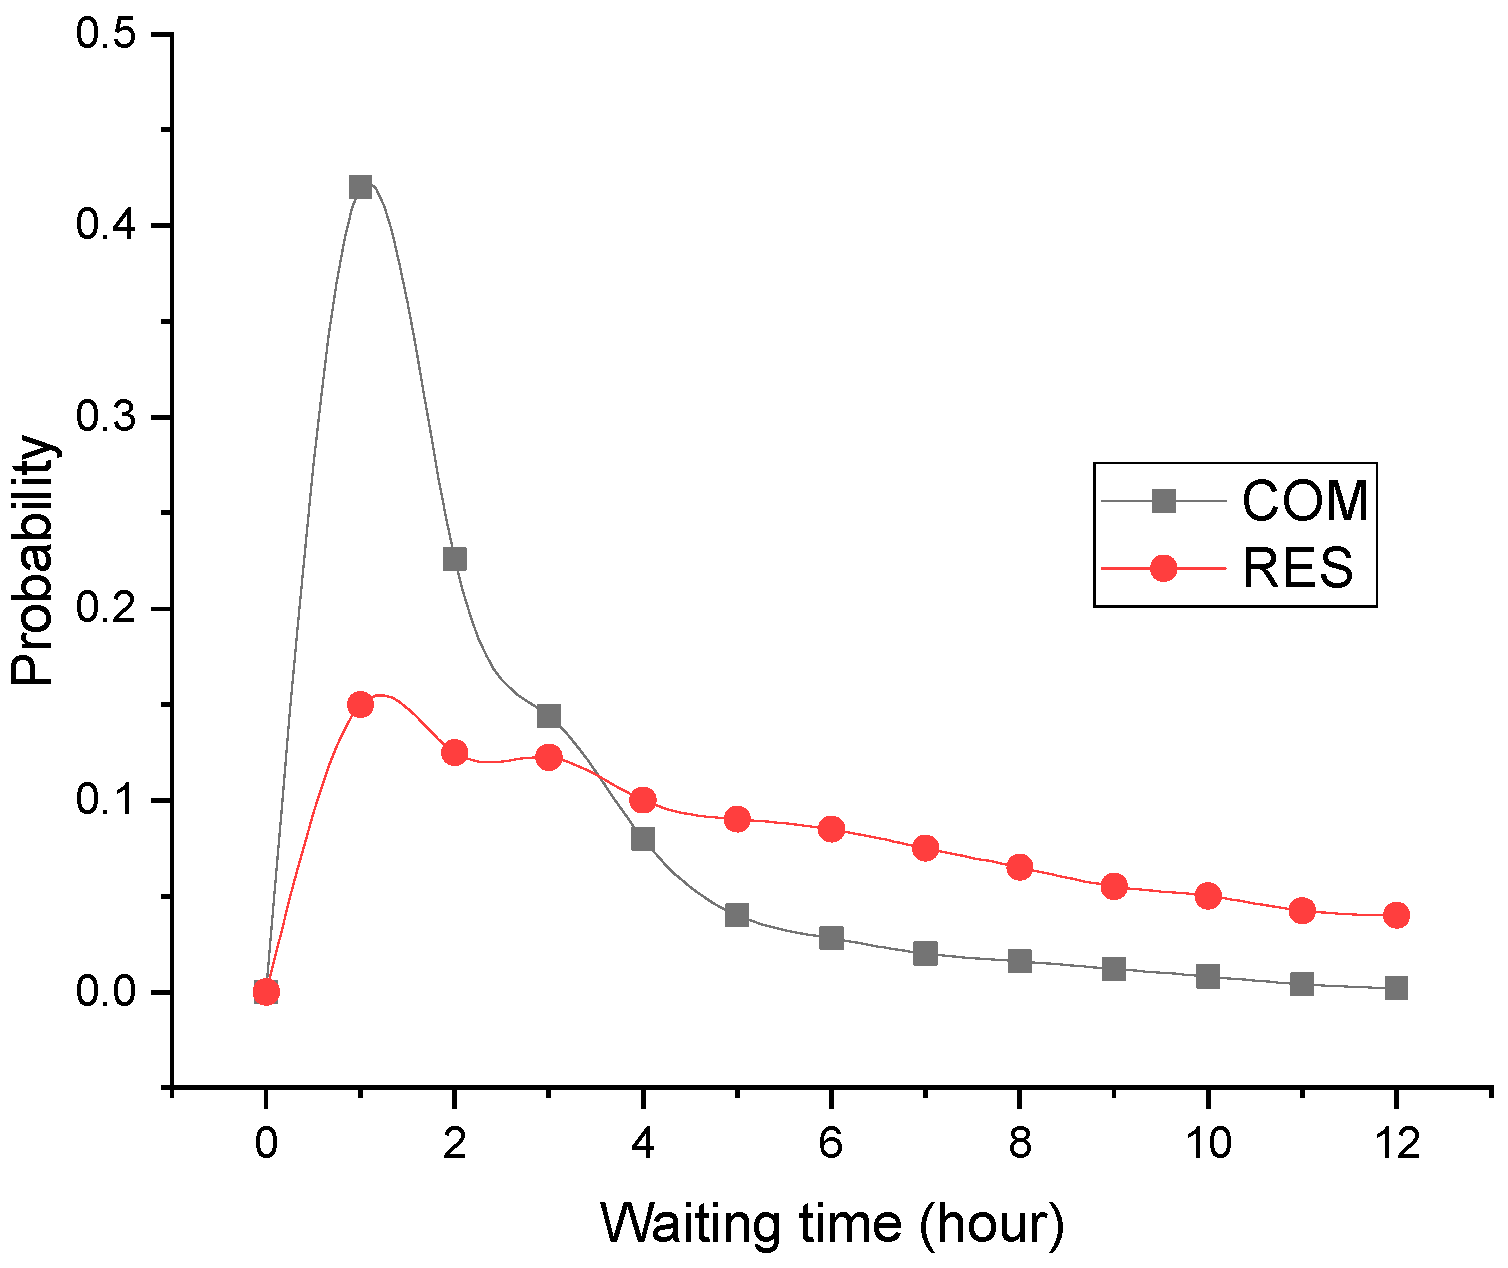
In the simulations, we consider a possible future scenario in which the interaction between the main components (BESS plant, ESTs, mobile BESSs units, EVCSs, and the enormous number of EV arrivals) is described as following. To begin with, this scenario maintains (NEV) as the total number of EVs (10,000 EVs), (NEVCS) as the total number of EVCSs (27 EVCSs), (NBESS) as the number of mobile BESS units (to be optimized) and (NEST) as the number of ESTs (to be optimized). At time step t = 0, which represents the beginning of the simulation and by referring to each time step by one hour, the capacity of each EV’s battery ranges from [60 kWh–120 kWh] and the initial State of Charge (SoC) ranges randomly between [0%–100%]. Also, each charging station is considered fully charged by having specific number of mobile BESS units (the capacity of each unit is 5 MWh). For instance, if EVCSi configures 3 units of mobile BESS, then, it is fully charged at the capacity of 15 MWh initially. The EVCSs are divided into two categories, 15 commercial (COM) EVCSs serving the offices and shopping centers areas, and 12 residential (RES) EVCSs serving the homes and suburban areas. Therefore, each type of EVCSs receives a different trend of EV arrivals during the day [33,34,35]. As a result, the energy demand profile at each ECVS is changing over time and peaks multiple times during the day. Each EV arrives to an EVCS will be likely to spend specific time while waiting for the charging process, that time is dependent on the type of the EVCS. Figure 1 shows the probabilities for EV arrivals to both commercial and residential EVCSs during the day, while Figure 2 represents the probabilities for the hours spent at each type of the EVCSs at any time.
To simulate such network of EVCSs that provides service to a population of EVs in a region, the initialization process is as follows: (i) set the number of fully charged mobile BESS units at each EVCS; in this case, the state of charge of each station is at 100% and each EVCS has an initial label of (1) that represents its fully charged status. Later and based on the energy consumption, the label will be switched to (−1) which represents the EVCS’s need to be charged (at least one unit of BESS is empty), and a signal to the BESS plant will be sent requesting the mobile BESS unit swapping; (ii) set a number of mobile BESS that is equal to the overall number of BESS units at all EVCSs at the plant as fully charged as well, and ready to secure the shipping process when requested. Each mobile BESS has its own ID and label that represents its status (1; if fully charged, and -1; if needs to be charged). (iii) set the whole fleet of ESTs stationed at the BESS plant and ready to be dispatched to the target EVCS when a request is received. Each EST has a label that represents its availability; (1; if available at the plant, and -1; if not available and on a trip).
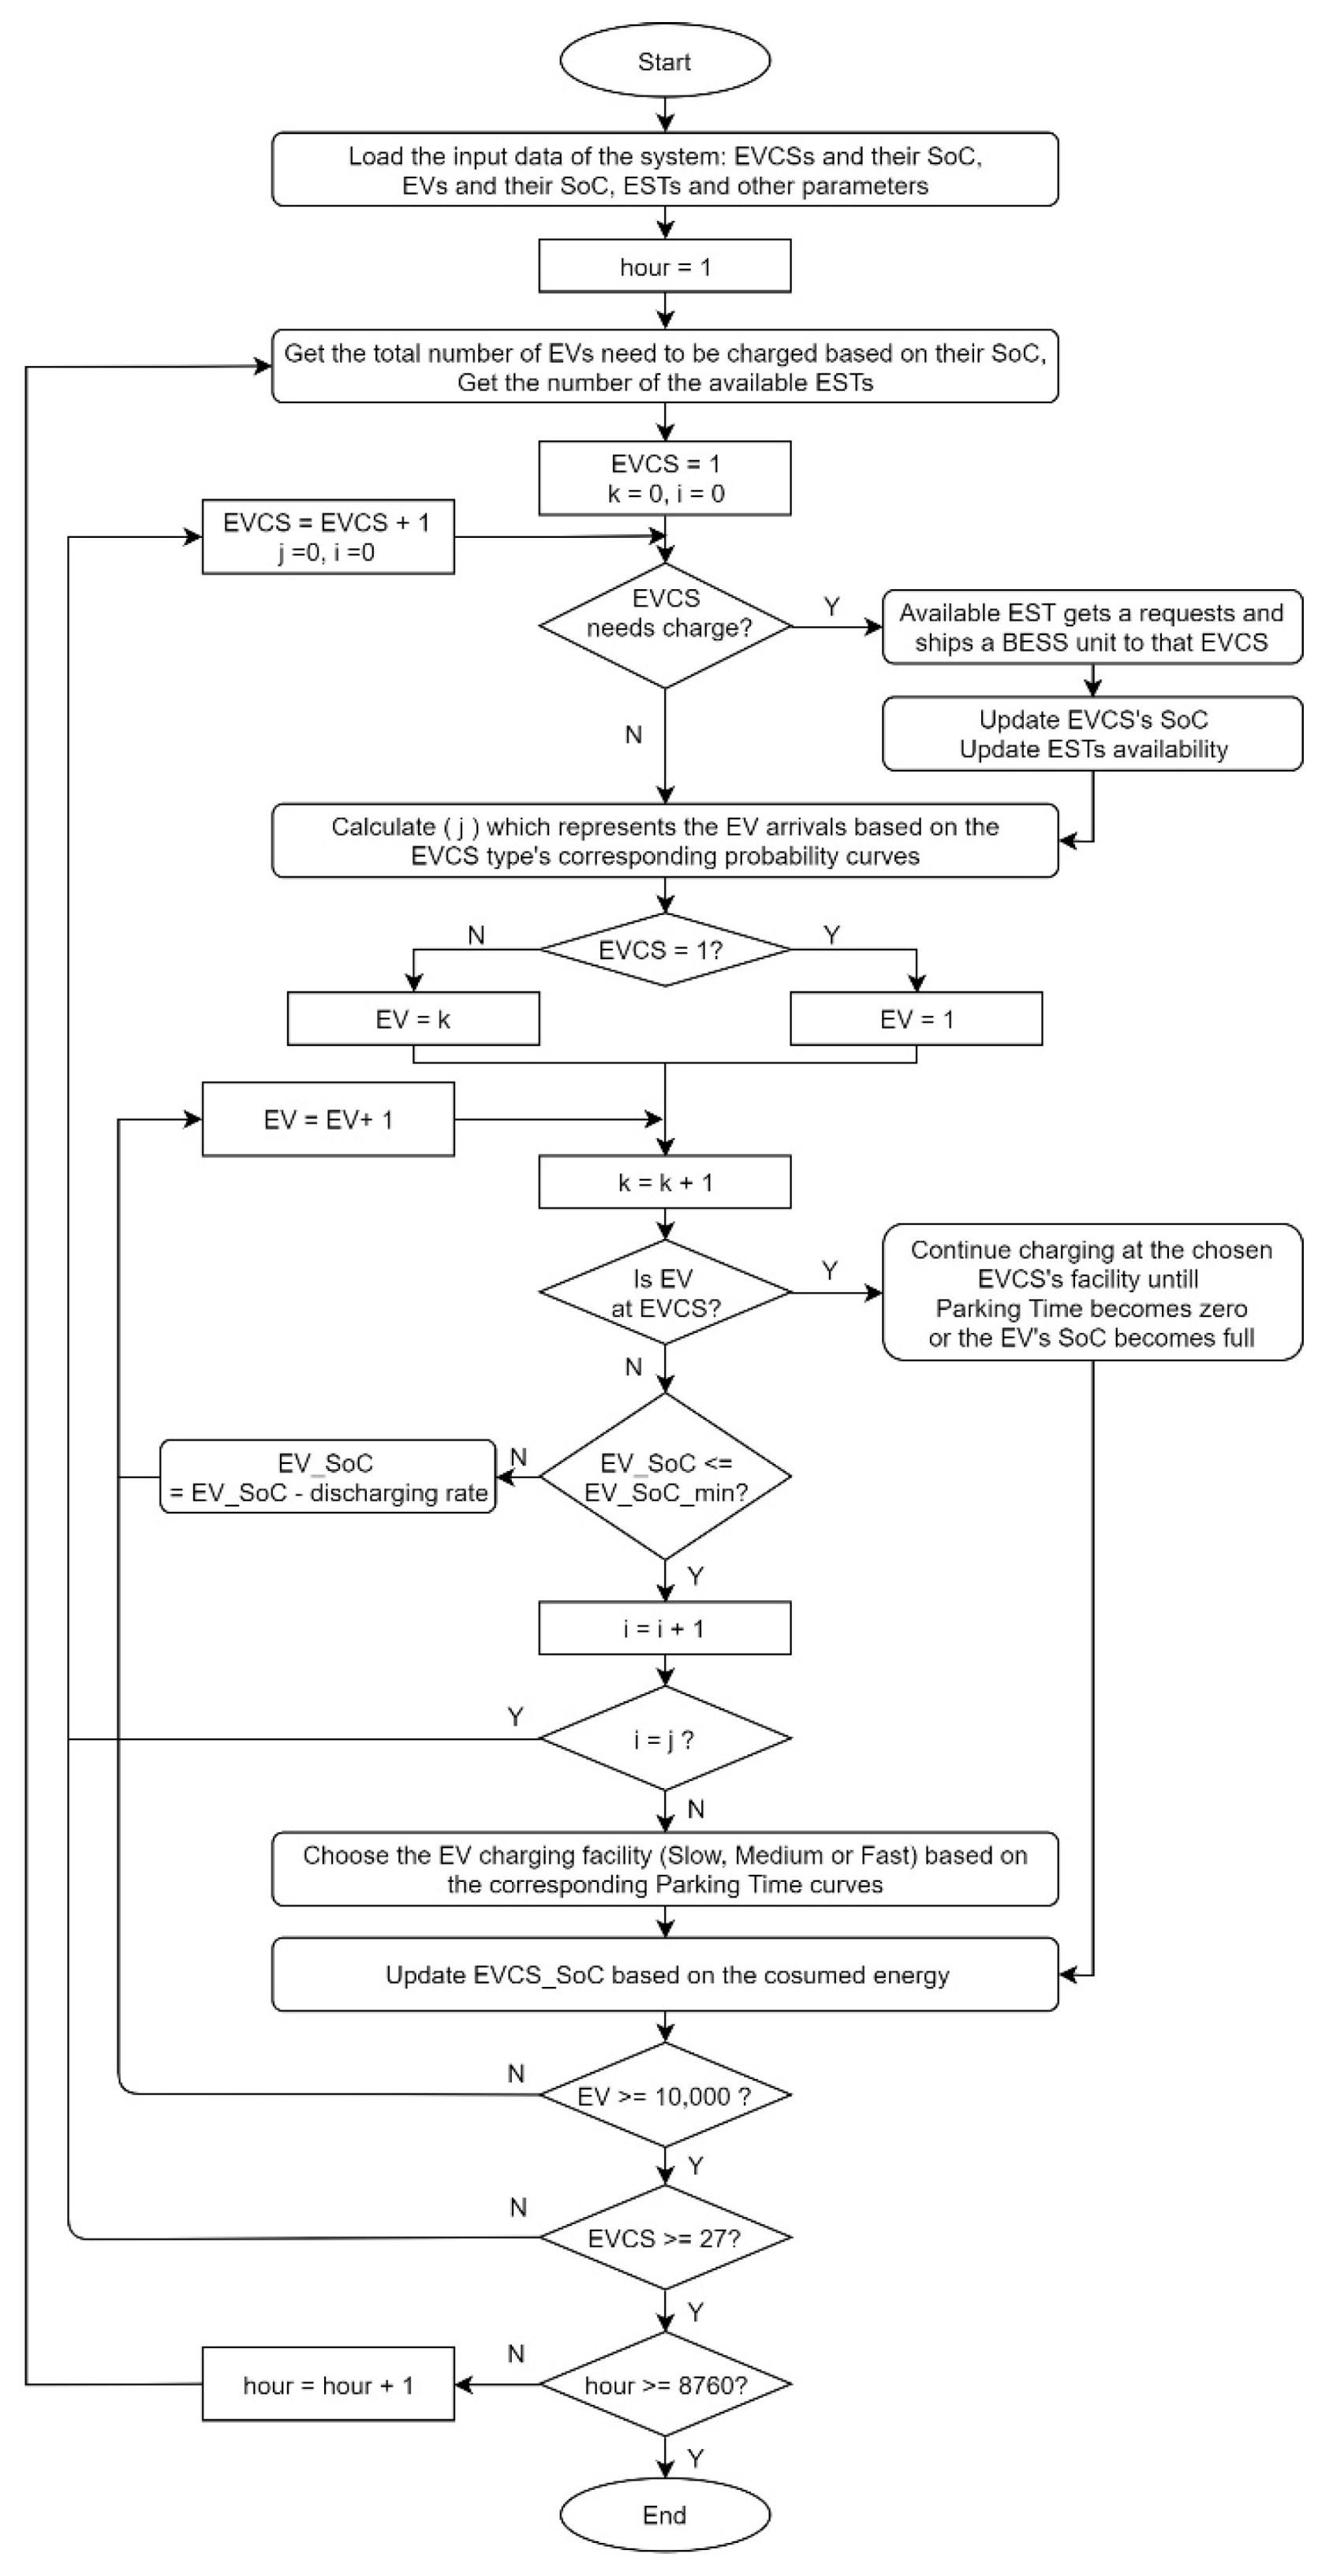
After the initialization process is over, the simulation runs for one year (~8760 h or time steps). During each time step, the algorithm updates the followings: (1) the SoC of each EV. (2) the SoC of each EVCS. (3) the label that represents each EVCS’s need to be charged or not. (4) the label that represents each mobile BESS status if full and ready to be shipped or needs charging. (5) the label that represents the availability of each EST. Figure 3 shows the flowchart of the simulation process.
Loading the input data is the first step of the simulation process; the input data includes but not limited to the 27 EVCSs along with the state of charge status of each station, the population of the EVs along with the state of charge status of each vehicle, and the population of the ESTs along with the availability status of each truck. At each time step of the total simulation time, the number of EVs need to be charged is estimated by comparing each EV’s SoC to the minimum allowed SoC which is ( E V _ S o C m i n 20 % ) in this case. Then, the total number of EVs that need charging will be spread between the available EVCSs, so each station will receive a portion of the EV arrivals (represented by j in the flowchart in Figure 3). To obtain the number of EVs arrive at each station, the simulation process scans each EVCS through a loop that first of all checks the need of that station to be charged itself (has at least one empty BESS unit) or not, if yes, then a request will be sent to the BESS plant asking to ship and swap that unit by a fully charged one. To find each EVCS’s portion of EV arrivals, the whole population of EVs will be checked to get the corresponding j. Two counters (i and k) are initialized at zero value and change while looping through the total number of EVs; i represents the accumulative number of EVs satisfies the conditions demanding its charging process and will reset to zero when it is equal to j, while k represents the number of scanned EVs and will reset to zero at the head of each time step.
During the process of scanning all EVs at each time step, each EV that has a SoC less than or equal to ( E V _ S o C m i n ) will be checked upon to validate its presence at an EVCS from the previous hour and does not need to be placed at another station, or yet to be placed at a station and an occurrence of i is recorded. In that case, the arrived EV will choose an EV charging facility at the EVCS based on the empty capacity of its battery that can be charged which can be estimated by ( C a p i ( 1 S o C i ) ), and the parking time duration ( T i d u r ). We consider three types of charging facilities at each EVCS: slow charging facility with a power rating of ( P S C F = 10   kW ), medium charging facility with a power rating of ( P M C F = 30   kW ), and fast charging facility with a power rating of ( P F C F = 120   kW ).
Equation (1) as formulated in [33] can be used to obtain the type of the charging facility chosen by that EV at that hour.
P E V i   =   { P S C F , i f   C a p i ( 1 S o C i ) P S C F T i d u r P M C F ,   i f   P S C F T i d u r <   C a p i ( 1 S o C i )   P M C F T i d u r P M C F ,   i f   P S C F T i d u r <   C a p i ( 1 S o C i )   P M C F T i d u r
Since the economic feasibility of this design is considered as a very important factor, this study’s concern is expanded to optimize for the optimum total number of mobile BESSs units and ESTs required in this design (the control variables) while minimizing the annual total costs as described in Equation (2) and set as the objective function. The optimization process follows those in [10].
min Cost = CI + CO&M
where CI is the annualized investment cost, where its detailed factors are represented in (3), and CO&M is the annualized operation and maintenance costs as represented in (5). The investment cost includes the costs of the ESTs (CEST = μNEST) where μ is the price of each EST, and the mobile BESS units (CBESS = δNBESS) where δ is the price of each mobile BESS unit.
CI = αCEST + βCBESS
where α and β are two annuity factors associated with the costs of the ESTs and the mobile BESS units respectively to annualize their capital investment costs. They can be obtained by (4) where d is the economical discount rate and y is the corresponding economic lifetime of each element.
α , β   =   d ( 1 + d ) y E S T ,   B E S S ( 1 + d ) y E S T ,   B E S S 1
CO&M = σDtot + φCEST + ωCBESS + ψNEST
where σ represents the expense of energy consumed by each EST’s trip per mile (estimated to be around $0.165/mile by [36,37,38]). φ and ω are constants represent the percentages of the investment costs to get the annual maintenance costs for the ESTs and the mobile BESS units respectively (they are chosen to be 5%). ψ characterizes the annual income for each EST operator. The annually total distance (Dtot) that ESTs drive while delivering the mobile BESS units is estimated by:
D t o t = i   = 1 N E V C S l ( i ) N T r i p s ( i )
where l ( i ) represents the distance between the BESS plant and the ith EVCS which is estimated in Corpus Christi, Texas to be between [10–25 miles], and N T r i p s ( i ) is the number of shipments or trips that the ith EVCS requires annually.

3. Results

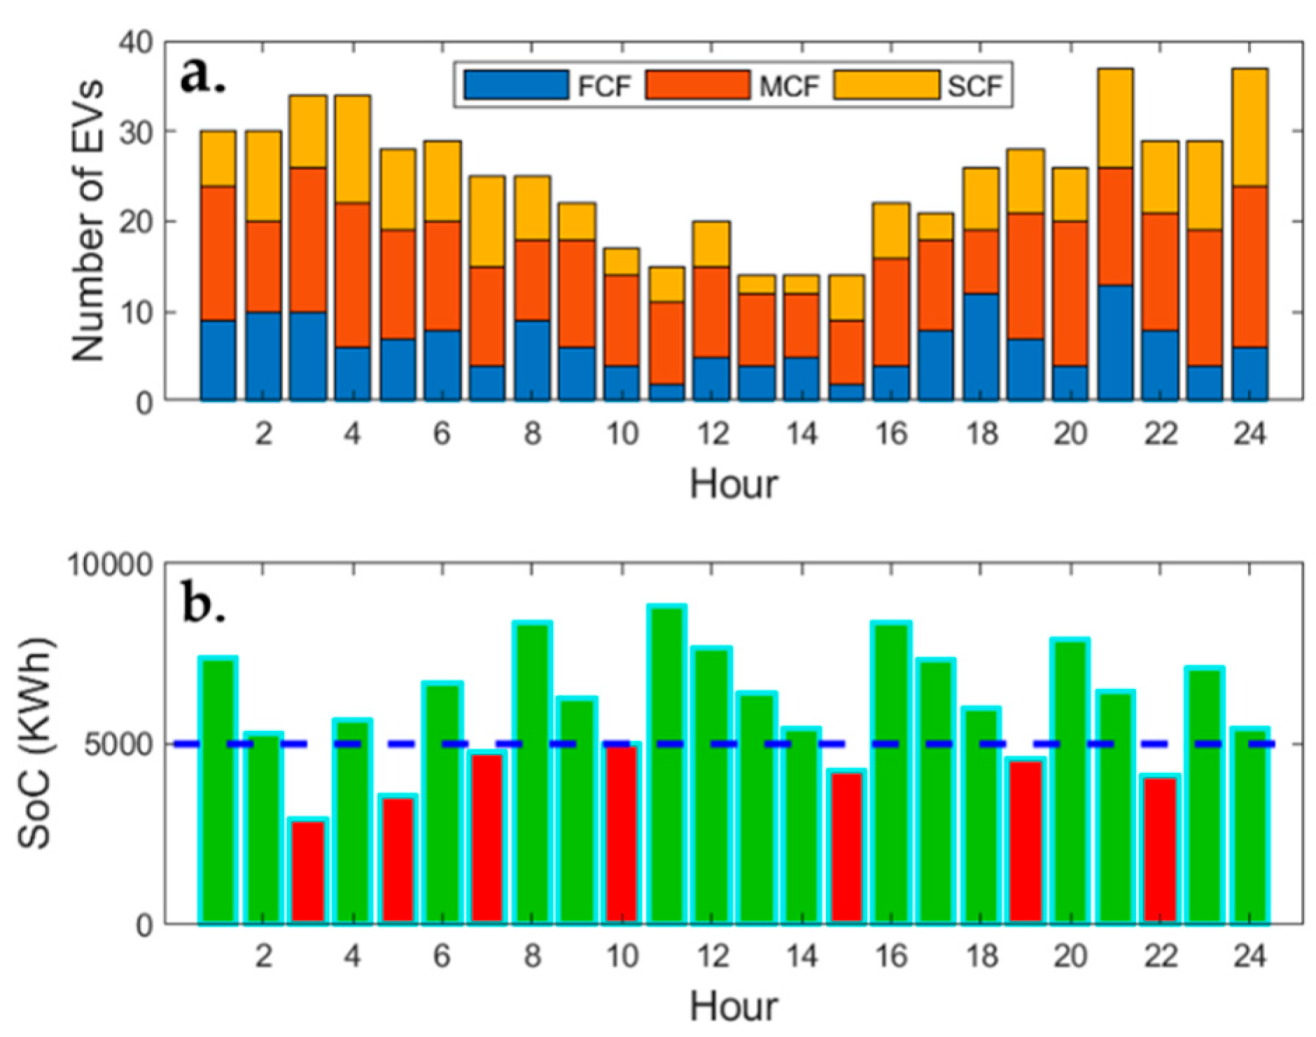
In this section and by following the model explained above, we present the simulation results. As stated before, each EVCS will receive a unique number EV arrivals during the day. The criteria of choosing the type of the charging facility by each arrived EV is described in Equation (1). It is important to notice that the number of charging facilities at each station is not a point of interest in this study. Therefore, the charging facilities are considered to be available at all times for all EVCSs. In Figure 4a. we present the EV arrivals at one of the RES EVCSs, EVCS #17, to demonstrate the diversity of EV arrivals and their charging facility choices during the day at that station. While in Figure 4b. we show the change over the state of charge of EVCS #17 during the day as the supplying the charging demands of the EVs arrived is taking place. In this case, EVCS #17 maintains two mobile BESS units as its asset. Whenever any of these two units is empty, then the station sends a request to the plant for a BESS unit swap. It can be noticed that EVCS #17 has required to recharge its BESS units for seven times during that day (characterized by the red bars).
To oversee the status of ESTs that serve the logistics system which configures 136 mobile BESS units at the operation mode, a case of employing nine ESTs as the transporters of the BESS units was modeled. Figure 5 presents the availability of these nine ESTs for two days. It is apparent that the ESTs are not available at most of the time because of the high demand at the EVCSs to swap and charge their own batteries.
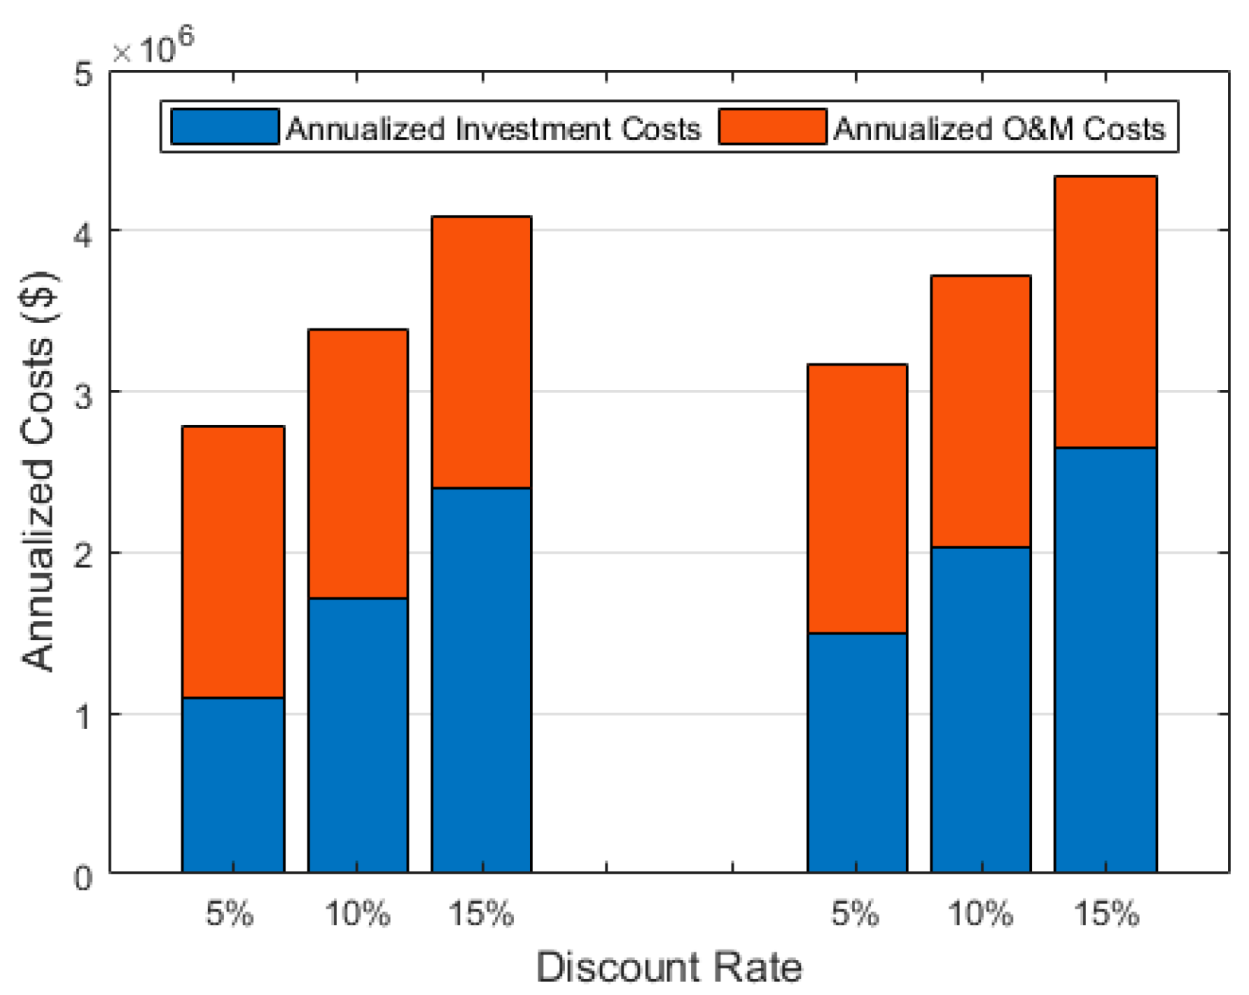
To see the change over the annualized costs, the effect of both the economic discount rate and the project’s lifetime is shown in Figure 6. This case considers deploying 10 ESTs and 140 mobile BESS units. From the economy’s point of view, the more discount rate applied, the more annualized costs are required. The opposite is applied to the project’s lifetime case, where the longer the lifetime of the project, the less annualized costs.
Obtaining the optimum number of ESTs and mobile BESS units at each station is an optimization problem. The optimization problem is subjected to achieve a scenario of logistics system that supplies the energy demands at all EVCSs, where each EVCS is not allowed to reject any EV by securing its energy demands. Particle Swarm Optimization (PSO) algorithm is used to find the optimal set of the control variables to minimize the fitness function, defined before as the annualized cost in Equations (2)–(6). The simulation model and the optimization process are implemented in MATLAB. The lower bound for the number of ESTs is one, and the upper bound is 27 which is equal to the number of EVCSs. The bounds for the number of mobile BESS units at each station ranges between 1 and 10. We use a typical PSO settings. Figure 7 shows a sample of convergence plot. Usually, the best fitness value is reached within 130 iterations when the average change in the fitness value is almost zero.
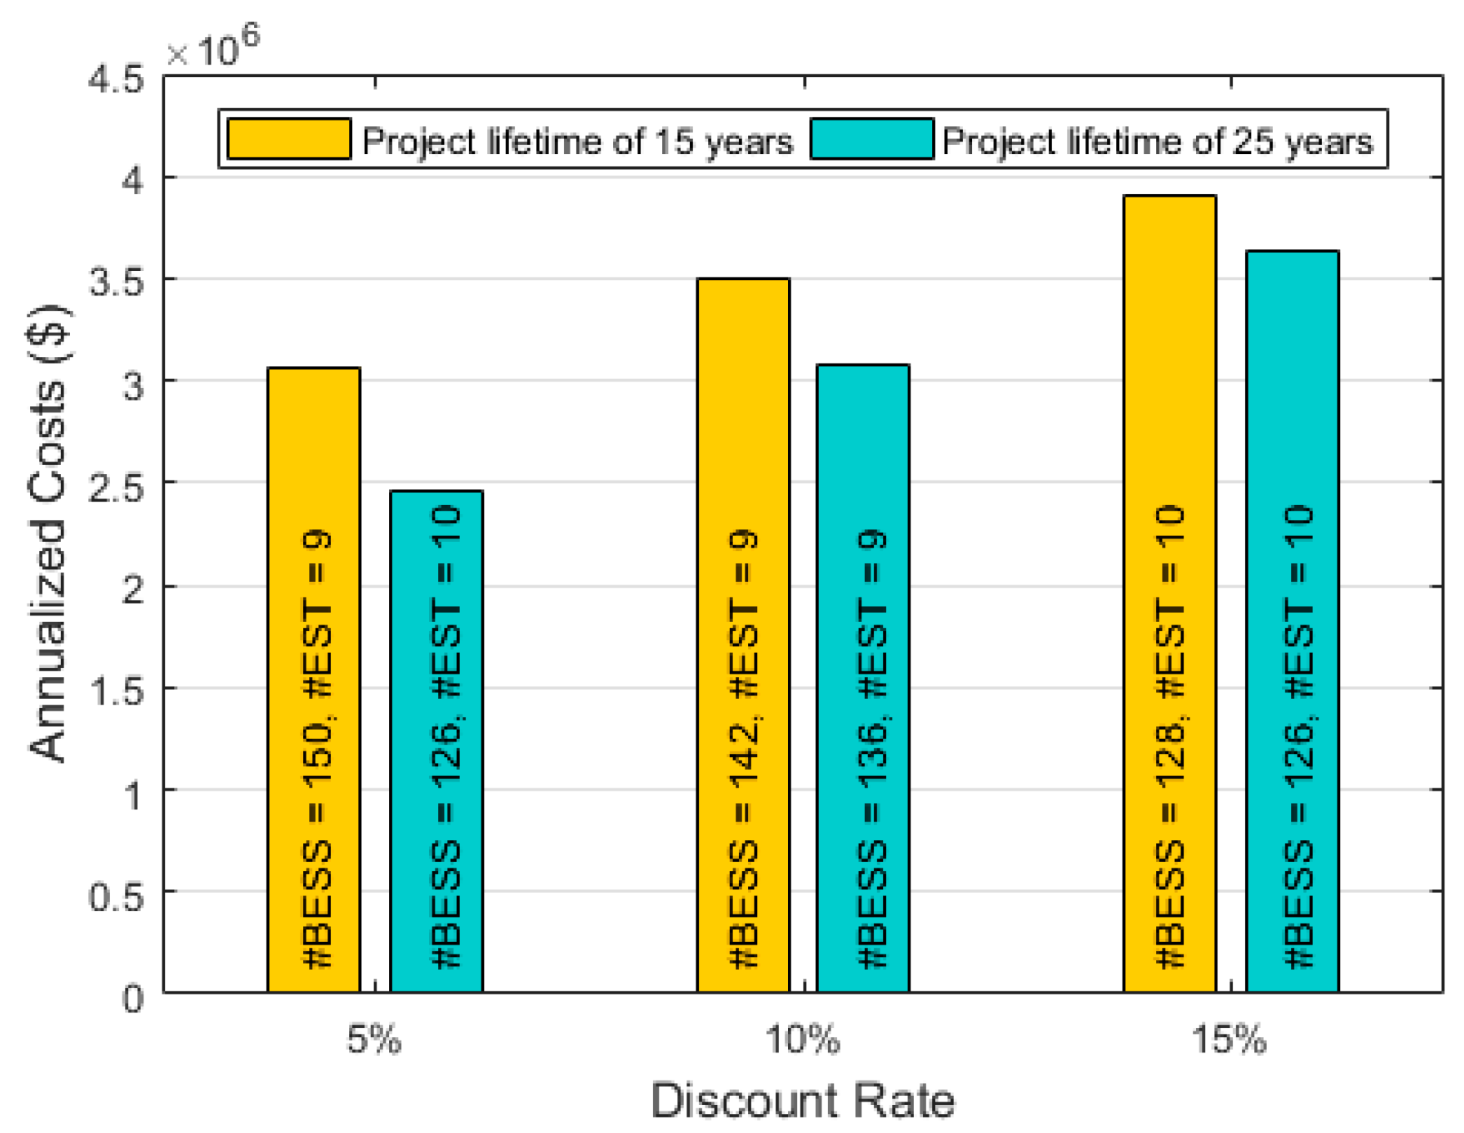
Now, we present the optimization results of the control variables in three comparable scenarios of different economic discount rates: 5%, 10% and 15% respectively. In each scenario, we obtain the results under two cases of project’s lifetime, 15 and 25 years, while fixing the cost of each EST at $150 k and the cost of each mobile BESS unit at $100 k. The optimum control variables are summarized in Table 1 and illustrated in Figure 8.
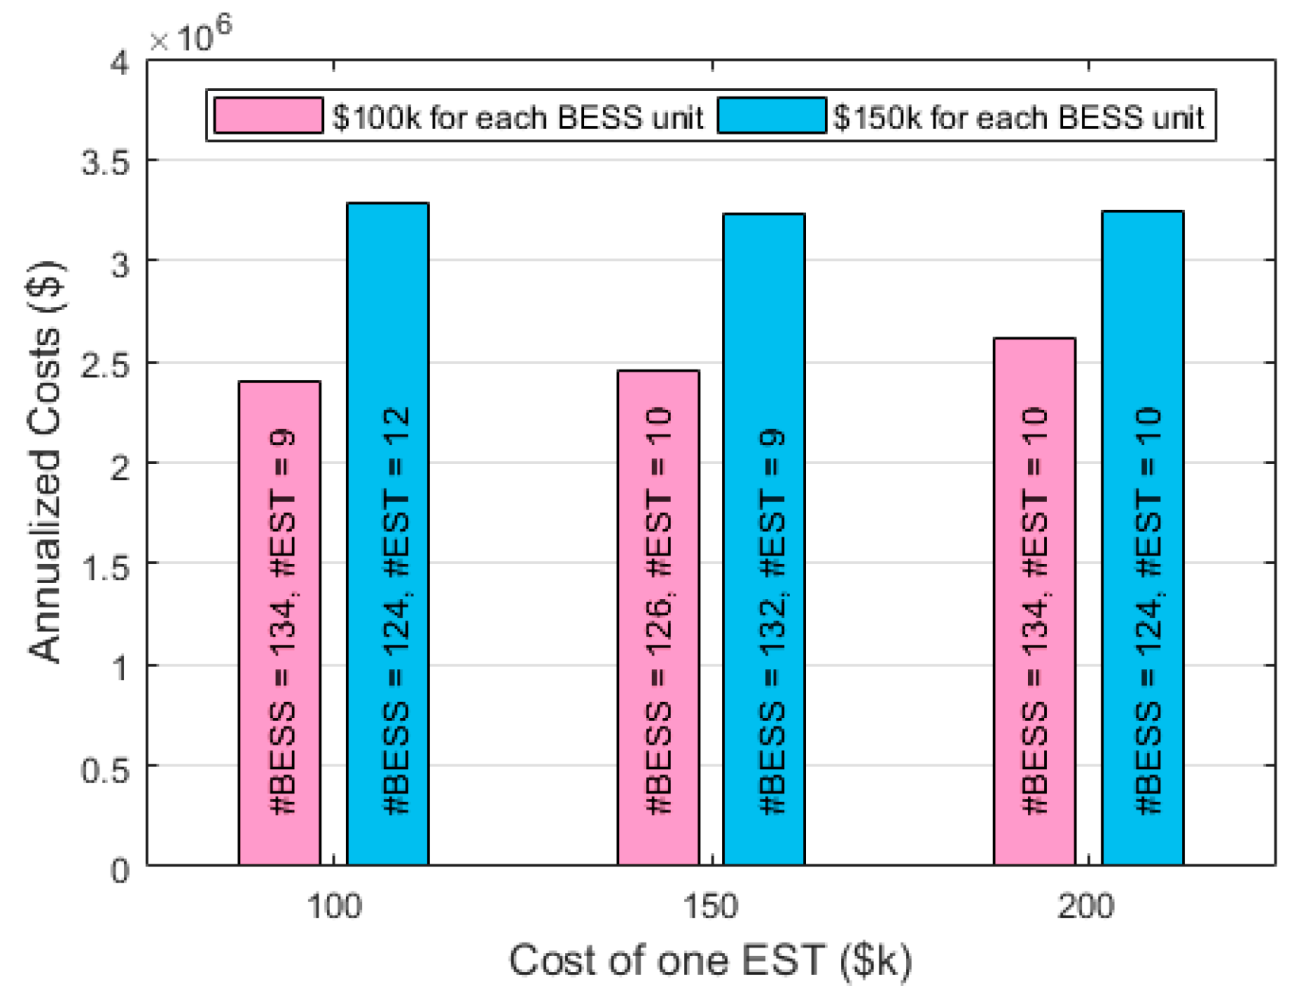
For further investigations over the effect of both control variables costs, we present the optimization results in three other comparable scenarios for the cost of an individual EST: $100 k, $150 k and $200 k respectively. In each scenario, we obtain the results under two cases for the cost of an individual mobile BESS unit, $100 k and $150 k years, while fixing the economic discount rate at 5% and the project’s lifetime at 25 years. The optimum control variables are summarized in Table 2 and illustrated in Figure 9.
Finally, we deliberate the case of 5% for the economic discount rate, 25 years for the project’s lifetime, $150 k for the cost of each EST and $100 k for the cost of each mobile BESS unit as the most anticipated promising case for the future. By using these values, the optimization results lead to a combination of 2.45391 million dollars annually as the minimum cost, 10 ESTs and 126 mobile BESS units, as the optimum values of the control variables.

4. Conclusions

In summary, this study aims to maximize the utilization of the Renewable Energy Sources (RES) while increasing the profitability of BESS by offering a new conceptual design of mobilizing the BESSs which has emerged from previous studies. This design would be able to tackle three major barriers toward a greener energy landscape in the future: (a) Curtailed grid integration of energy from RES such as wind and solar; (b) Low investment attractiveness of large-scale BESSs; and (c) Constraints from the existing electric infrastructure on the development of charging station networks to meet the increasing electrical transportation demands.
This work develops a logistics system design for mobile BESS implemented within a grid independent EVCSs network. The design achieved supplying a population of ten thousand EVs with their energy charging demands. The optimum attained design configured employing ten ESTs and 126 mobile BESS units while minimizing the annual costs at almost 2.5 million dollars. The principal objective function of the design was to provide every electric vehicle with its charging demands at the 27 ECVSs network. Such design can be implemented by decision makers and planners for future sustainable communities to accomplish greener transportation systems in which the greenhouse gas emissions are at the lowest levels.
The logistics system in which ESTs transport the batteries between the BESS and EVCSs was designed, which facilitates the planning and operation of EVCS networks without constraints from the grid. The design of the logistics system was tested under various scenarios anticipated for the future. These scenarios include executing different values for the economic discount rates, project lifetime, costs of ESTs and costs of mobile BESS units. In this design, a promising case of 5% for the economic discount rate, 25 years for the project’s lifetime, $150 k for the cost of each EST and $100 k for the cost of each mobile BESS unit was considered at the optimum setup.
In many regions in the United States (e.g., Texas) where there are plenty of renewable resources and little congestion pressure on the road networks, this solution could be viable. The city of Corpus Christi, Texas and the neighboring Chapman Ranch wind farm were used as the test case, this work implement such a design and analyze its performance based on the simulation of its operational processes. Further, we formulated an optimization problem to find design parameters that minimize the total costs. The main design parameters include the number of trucks and batteries. The results in this work, although preliminary, will be instrumental for potential stakeholders to make investment or policy decisions. Improvements can be made in the future work to (i) consider actual demand profiles of the mobile BESS units at the EVCSs. (ii) include real time travel times to the design model as well as consider a predictable and time-dependent supply profile.

Author Contributions

Conceptualization, H.S.H. and X.Z.; methodology, X.Z.; software, H.S.H.; validation, H.S.H. and X.Z.; manuscript preparation, H.S.H. and X.Z.; project administration, X.Z. All authors have read and agreed to the published version of the manuscript.

Funding

This research received no external funding.

Conflicts of Interest

The authors declare no conflict of interest.

Nomenclature and Parameter Values

NEVThe total number of EVs = 10,000 EVs
NEVCSThe total number of EVCSs = 27 EVCSs
NBESSThe total number of mobile BESS units
NESTThe total number of ESTs
C a p i The battery’s capacity of the ith EV
S o C i The battery’s SoC of the ith EV
E V _ S o C m i n The minimum SoC of an EV to require charging = 20%
j The number of EV arrivals at an EVCS
i A counter for EVs that satisfy the charging requirements and it resets to zero at each EVCS
k A counter for scanned EVs among NEV and it resets to zero at each hour
T i d u r The parking time duration of the ith EV
P S C F The power rating of the slow charging facility
P M C F The power rating of the medium charging facility
P F C F The power rating of the fast charging facility
P E V i The power rating of the charging facility chosen by the ith EV
CIThe annualized investment costs of the logistics system
CO&MThe annualized operations and maintenance costs of the logistics system
CESTThe total costs of the ESTs
μThe cost of each EST = $150 K
CBESSThe total costs of the mobile BESS units
δThe cost of each mobile BESS unit = $100 K
α, βTwo economical annuity factors
d The economical discount rate or the cost of capital = 5%
y E S T The economic life of ESTs = 25 years
y B E S S The economic life of mobile BESS units = 25 years
σ The cost of energy per mile = $0.165/mile
DtotThe annual total distance driven by ESTs to deliver mobile BESS units
φ The annual maintenance cost of ESTs = 5% of C E S T
ω The annual maintenance cost of mobile BESS units = 5% of C B
ψ The average annual salary of an EST operator = $70 K
l   ( i ) The distance between the BESS plant and the ith EVCS
N T r i p s ( i ) The number of shipments or trips that the ith EVCS requires annually

References

  1. Energy Information Administration (EIA). Annual Energy Outlook 2019 with Projections to 2050 (AEO 2019); Energy Information Administration (EIA): Washington, DC, USA, 2019; p. 83. Available online: https://www.eia.gov/outlooks/aeo/pdf/AEO2019.pdf (accessed on 21 December 2019).
  2. Li, C.; Negnevitsky, M.; Wang, X.; Yue, W.L.; Zou, X. Multi-criteria analysis of policies for implementing clean energy vehicles in China. Energy Policy 2019, 129, 826–840. [Google Scholar] [CrossRef]
  3. Qiao, Q.; Zhao, F.; Liu, Z.; He, X.; Hao, H. Life cycle greenhouse gas emissions of Electric Vehicles in China: Combining the vehicle cycle and fuel cycle. Energy 2019, 177, 222–233. [Google Scholar] [CrossRef]
  4. Li, W.; Long, R.; Chen, H. Consumers’ evaluation of national new energy vehicle policy in China: An analysis based on a four paradigm model. Energy Policy 2016, 99, 33–41. [Google Scholar] [CrossRef]
  5. Hayajneh, H.S.; Zhang, X. Evaluation of Electric Vehicle Charging Station Network Planning via a Co-Evolution Approach. Energies 2020, 13, 25. [Google Scholar] [CrossRef] [Green Version]
  6. Hou, K.; Xu, X.; Jia, H.; Yu, X.; Jiang, T.; Zhang, K.; Shu, B. A Reliability Assessment Approach for Integrated Transportation and Electrical Power Systems Incorporating Electric Vehicles. IEEE Trans. Smart Grid 2018, 9, 88–100. [Google Scholar] [CrossRef]
  7. Hayajneh, H.S.; Bashetty, S.; Salim, M.N.B.; Zhang, X. Techno-Economic Analysis of a Battery Energy Storage System with Combined Stationary and Mobile Applications. In Proceedings of the 2018 IEEE Conference on Technologies for Sustainability (SusTech), Long Beach, CA, USA, 11–13 November 2018; pp. 1–6. [Google Scholar]
  8. Barth, M.; Jugert, P.; Fritsche, I. Still underdetected—Social norms and collective efficacy predict the acceptance of electric vehicles in Germany. Transp. Res. Part F Traffic Psychol. Behav. 2016, 37, 64–77. [Google Scholar] [CrossRef]
  9. Hayajneh, H.S.; Bani Salim, M.N.; Bashetty, S.; Zhang, X. Optimal Planning of Battery-Powered Electric Vehicle Charging Station Networks. In Proceedings of the 2019 IEEE Green Technologies Conference (GreenTech), Lafayette, LA, USA, 3–6 April 2019; pp. 1–4. [Google Scholar]
  10. Hayajneh, H.; Salim, M.B.; Bashetty, S.; Zhang, X. Logistics system planning for battery-powered electric vehicle charging station networks. J. Phys. Conf. Ser. 2019, 1311, 012025. [Google Scholar] [CrossRef] [Green Version]
  11. Hayajneh, H.S.; Lainfiesta, M.; Zhang, X. Three Birds One Stone: A Solution to Maximize Renewable Generation, Incentivize Battery Deployment, and Promote Green Transportation. In Proceedings of the 2020 IEEE Innovative Smart Grid Technologies Conference North America (ISGT NA 2020), Washington, DC, USA, 17–20 February 2020. [Google Scholar]
  12. Hayajneh, H.S.; Lainfiesta, M.; Zhang, X. A New Form of Battery Energy Storage Systems for Renewable Energy Farms. In Proceedings of the 2020 IEEE PES T & D Conference, Chicago, IL, USA, 20–25 April 2020. [Google Scholar]
  13. Fagerholt, K.; Christiansen, M. A combined ship scheduling and allocation problem. J. Oper. Res. Soc. 2000, 51, 834–842. [Google Scholar] [CrossRef]
  14. de Oliveira, L.K.; dos Santos, O.R.; de Oliveira, R.L.M.; Nóbrega, R.A.A. Is the Location of Warehouses Changing in the Belo Horizonte Metropolitan Area (Brazil)? A Logistics Sprawl Analysis in a Latin American Context. Urban Sci. 2018, 2, 43. [Google Scholar] [CrossRef] [Green Version]
  15. Lu, E.H.-C.; Yang, Y.-W. A hybrid route planning approach for logistics with pickup and delivery. Expert Syst. Appl. 2019, 118, 482–492. [Google Scholar] [CrossRef]
  16. Powell, W.B. An operational planning model for the dynamic vehicle allocation problem with uncertain demands. Transp. Res. Part B Methodol. 1987, 21, 217–232. [Google Scholar] [CrossRef] [Green Version]
  17. Vasilakos, S.; Iacobellis, G.; Stylios, C.D.; Fanti, M.P. Decision Support Systems based on a UML description approach. In Proceedings of the 2012 6th IEEE International Conference Intelligent Systems, Sofia, Bulgaria, 6–8 September 2012; pp. 041–046. [Google Scholar]
  18. Fanti, M.P.; Iacobellis, G.; Nolich, M.; Rusich, A.; Ukovich, W. A Decision Support System for Cooperative Logistics. IEEE Trans. Autom. Sci. Eng. 2017, 14, 732–744. [Google Scholar] [CrossRef]
  19. Giusti, R.; Manerba, D.; Perboli, G.; Tadei, R.; Yuan, S. A New Open-source System for Strategic Freight Logistics Planning: the SYNCHRO-NET Optimization Tools. Transp. Res. Procedia 2018, 30, 245–254. [Google Scholar] [CrossRef]
  20. Rześny-Cieplińska, J.; Szmelter-Jarosz, A. Assessment of the Crowd Logistics Solutions—The Stakeholders’ Analysis Approach. Sustainability 2019, 11, 5361. [Google Scholar] [CrossRef] [Green Version]
  21. Xu, J.; Hancock, K.L. Enterprise-wide freight simulation in an integrated logistics and transportation system. In Proceedings of the 2003 IEEE International Conference on Intelligent Transportation Systems, Shanghai, China, 12–15 October 2003; Volume 1, pp. 534–538. [Google Scholar]
  22. Holl, A.; Mariotti, I. The Geography of Logistics Firm Location: The Role of Accessibility. Netw. Spat. Econ. 2018, 18, 337–361. [Google Scholar] [CrossRef]
  23. Kumar, I.; Zhalnin, A.; Kim, A.; Beaulieu, L.J. Transportation and logistics cluster competitive advantages in the U.S. regions: A cross-sectional and spatio-temporal analysis. Res. Transp. Econ. 2017, 61, 25–36. [Google Scholar] [CrossRef]
  24. Zenzerovic, Z.; Beslic, S. Optimization of cargo transport with a view to cost efficient operation of container ship. In Proceedings of the 25th International Conference on Information Technology Interfaces, 2003. ITI 2003, Cavtat, Croatia, 19 June 2003; pp. 531–536. [Google Scholar]
  25. Zenzerović, Z.; Bešlić, S. Contribution to the Optimisation of the Cargo Transportation Problem. Promet Traffic Transp. 2003, 15, 65–72. [Google Scholar]
  26. Kos, S.; Zenzerović, Z. Modelling the Transport Process in Marine Container Technology. Promet Traffic Transp. 2003, 15, 13–17. [Google Scholar]
  27. Christiansen, M. Decomposition of a Combined Inventory and Time Constrained Ship Routing Problem. Transp. Sci. 1999, 33, 3–16. [Google Scholar] [CrossRef]
  28. Krile, S. Application of the minimum cost flow problem in container shipping. In Proceedings of the Elmar-2004. 46th International Symposium on Electronics in Marine, Zadar, Croatia, 16–18 June 2004; pp. 466–471. [Google Scholar]
  29. Kobayashi, K.; Kubo, M. Optimization of oil tanker schedules by decomposition, column generation, and time-space network techniques. Jpn. J. Indust. Appl. Math. 2010, 27, 161–173. [Google Scholar] [CrossRef]
  30. Kobayashi, H.; Tamaki, H. A method of ship scheduling and inventory management problem for reducing demurrage and freight. In Proceedings of the 2017 IEEE International Conference on Systems, Man, and Cybernetics (SMC), Banff, AB, Canada, 5–8 October 2017; pp. 2790–2795. [Google Scholar]
  31. He, M.; Shen, J.; Wu, X.; Luo, J. Logistics Space: A Literature Review from the Sustainability Perspective. Sustainability 2018, 10, 2815. [Google Scholar] [CrossRef] [Green Version]
  32. Direct Store Delivery: Concepts, Applications and Instruments; Otto, A.; Schoppengerd, F.J.; Shariatmadari, R. (Eds.) Springer: Berlin, Germany, 2009; ISBN 978-3-540-77212-5. [Google Scholar]
  33. Luo, L.; Gu, W.; Zhou, S.; Huang, H.; Gao, S.; Han, J.; Wu, Z.; Dou, X. Optimal planning of electric vehicle charging stations comprising multi-types of charging facilities. Appl. Energy 2018, 226, 1087–1099. [Google Scholar] [CrossRef]
  34. Zhang, H.; Tang, W.; Hu, Z.; Song, Y.; Xu, Z.; Wang, L. A method for forecasting the spatial and temporal distribution of PEV charging load. In Proceedings of the 2014 IEEE PES General Meeting|Conference Exposition, Washington, DC, USA, 27–31 July 2014; pp. 1–5. [Google Scholar]
  35. Wang, Y.; Guo, Q.; Sun, H.; Li, Z. An investigation into the impacts of the crucial factors on EVs charging load. In Proceedings of the IEEE PES Innovative Smart Grid Technologies, Tianjin, China, 21–24 May 2012; pp. 1–4. [Google Scholar]
  36. Tesla Semi: 500-Mile Range, Cheaper Than Diesel, Quick to Charge—ExtremeTech. Available online: https://www.extremetech.com/extreme/259195-tesla-semi-500-mile-range-cheaper-diesel-quick-charge (accessed on 5 March 2019).
  37. “Comparing Energy Costs Per Mile for Electric and Gasoline-Fueled Vehicles,” Advanced Vehicle Testing Activity, Idaho National Laboratory. Available online: https://avt.inl.gov/sites/default/files/pdf/fsev/costs.pdf (accessed on 28 December 2019).
  38. Yi, Z.; Shirk, M. Data-driven optimal charging decision making for connected and automated electric vehicles: A personal usage scenario. Transp. Res. Part C Emerg. Technol. 2018, 86, 37–58. [Google Scholar] [CrossRef]
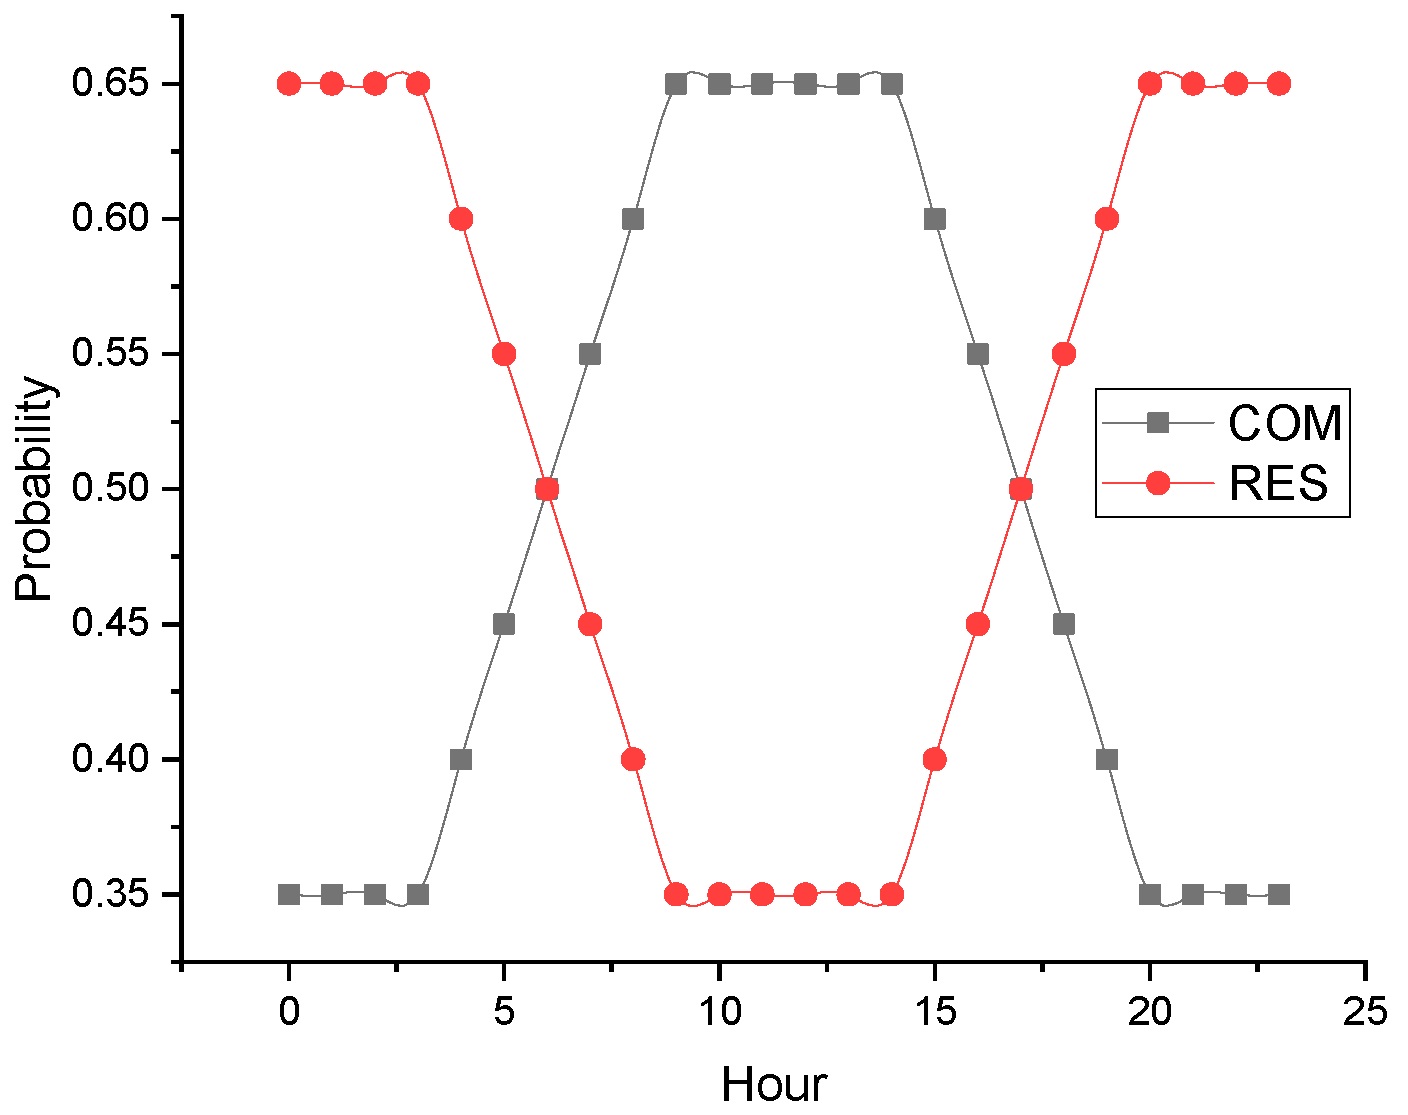
Figure 1. The probability for a commercial or residential EVCS to be chosen by an EV that needs to be charged during the day. The COM EVCS’s probability is divided randomly between the 15 stations around their average, while the RES EVCS’s probability is divided randomly between the 12 stations around their average.
Energies 13 01157 g001
Figure 2. The probability of the time that each EV will spend as the waiting/parking time to get charged at each type of the EVCSs.
Energies 13 01157 g002
Figure 3. The flowchart of the simulation process.
Energies 13 01157 g003
Figure 4. The charging demands and the SoC of EVCS #17. (a) Illustrates the number of EV arrivals at EVCS #17 in one day, where the total number is represented by arrivals at the three types of the charging facilities. (b) Shows the SoC of EVCS #17 in the same day, where the availability of energy at the station is represented by the green color and the station’s requirement to request a BESS unit swap from the BESS plant is represented by the red color.
Energies 13 01157 g004
Figure 5. The availability of 9 ESTs serving the logistics system where the red color represents the unavailability of the corresponding EST at the plant (on the road or at an EVCS) and the green color represents their availability.
Energies 13 01157 g005
Figure 6. The annualized cost of a logistics system that is composed of 10 ESTs and 140 mobile BESS units. The first group (left) considers 25 years as the lifetime of the ESTs and BESS units, while the second group (right) considers 15 years.
Energies 13 01157 g006
Figure 7. Particle Swarm Optimization (PSO) algorithm’s convergence plot.
Energies 13 01157 g007
Figure 8. The results of the optimization process under three diverse scenarios of economic discount rates and two cases for the project’s lifetime; the anticipated lifetime of both ESTs and mobile BESS units. In this study, the cost of each EST is $150 k while the cost of each mobile BESS unit is $100 k.
Energies 13 01157 g008
Figure 9. The results of the optimization process under three diverse scenarios for the costs of ESTs and two cases for the cost of mobile BESS units. In this study, the economic discount rate is 5% while the project’s lifetime is 25 years.
Energies 13 01157 g009
Table 1. Summary table of the optimization results under varying discount rates and project’s lifetime.
Discount RateLifetime of ESTs and Mobile BESS Units (years)Optimum Number of Mobile BESS UnitsOptimum Number of ESTMinimum Annualized Cost ($M)
5%1515093.06907
25126102.45391
10%1514293.49829
2513693.07089
15%15128103.90900
25126103.63470
Table 2. Summary table of the optimization results under varying costs of EST and mobile BESS unit.
Cost of One EST ($)Cost of Mobile BESS Unit ($/Each)Optimum Number of Mobile BESS UnitsOptimum Number of ESTMinimum Annualized Cost ($M)
100 k100 k13492.40547
150 k124123.28334
150 k100 k126102.45391
150 k13293.23504
200 k100 k134102.61062
150 k124103.23957